Abstract
An activated carbon manufacturing process from winemaking waste is analyzed. In that way, vine shoots conversion is studied as a basis for plant designing, and mass and energy balances of hydrothermal carbonization and physical activation are fulfilled. To develop an energy-integrated plant, a network of heat exchangers is allocated to recover heat waste, and a cogeneration cycle is designed to provide electricity and remaining heat process demands. Furthermore, thermoeconomic analysis is applied to determine the thermodynamic efficiency and the economic viability of the plant. Energy balance indicates that heat exchangers energy integration covers 48.9% of the overall demands by crossing hot and cold streams and recovering heat from residual flue gas. On the other hand, the exergy costs analysis identifies combustion of pruning wood as the main source of exergy destruction, confirming the suitability of the integration to improve the thermodynamic performance. Attending to economic costs analysis, production scale and vineyard pruning wood price are identified as a critical parameter on process profitability. With a scale of 2.5 ton/h of pruning wood carbonization, a break-event point to compete with activated carbons from biomass origin is reached. Nevertheless, cost of pruning wood is identified as another important economic parameter, pointing out the suitability of wet methods such as hydrothermal carbonization (HTC) to treat them as received form the harvest and to contribute to cutting down its prices.
1. Introduction
Concepts related to sustainable development stand out among the most influential topics at present, such as replacement of non-renewable resources, reduction of wastes and greenhouse emissions, and the improvement of energy efficiency. In this regard, the European Union launched its political strategy in 2015 to impulse its socioeconomic transition to a new model through the document “Closing the loop: An EU action plan for the Circular Economy” [1]. The plan includes several investments to encourage innovative and efficient companies and is considered by the Brussels authorities to provide the opportunity to reinvent the European economy and keep it in vanguard [2]. Looking at its economic activity, the agri-food industry appears as a chance to research new processes to make consumer goods from its wastes. The wine industry, which generates an abundant amount of organic wastes, such as vine shoots and grape marc and seeds, is an appropriate example. The Spanish wine sector has a strong presence in global production, with an average grape demand that oscillates between five and seven million tons every year. However, approximately 17% of this net weight ends up as waste. The relatively ease and mass availability, adequate properties, and low price of these organic residues make it an interesting resource from which to obtain biochar and activated carbon [3].
There currently exist many different thermal treatments to obtain char from biomass [4,5,6,7,8,9,10]. One of them is hydrothermal carbonization (HTC), which consists of the coalification of organic materials under an inert atmosphere, suspended inside an aqueous phase at sub-critical conditions. This process is performed by applying high temperatures (usually between 180 °C and 250 °C) and pressures (above the saturation pressure, generally from 10 to 50 bar) over a huge range of times (from a few minutes to several hours) [11,12,13,14,15]. These conditions change the chemical properties of water and make it an adequate solvent for biomass coalification treatments. The hydrothermal reaction of lignocellulosic materials begins when the temperature rises to 180 °C and the hydrolysis of hemicellulose starts. Hydrolysis of cellulose and decomposition of lignin occur when temperatures ascend to 230 °C and 250 °C, respectively [13].
Dehydration and decarboxylation of oligomers generate a series of organic acids, phenolic products, and furan derivates. Part of these products continue its decomposition and form a gaseous phase composed basically of CO2 and minor quantities of CO, CH4, and H2. The range of products and quantities depend on the specific conditions of the process. At lower temperatures and pressures, biomass decomposition tends to moderate rates and solid yield predominates. As the treatment becomes more aggressive (i.e., with higher temperatures and pressures or with the addition of organic solvents), liquid and gas formation is favored [11,12,13,15,16,17,18]. Hydrothermal cracking increases the carbon content and calorific power of treated solids, making them interesting energy alternatives to fossil fuels [18,19]. Hydrochar also presents good properties as a precursor for activated carbons [20,21], expanding its range of applications to different uses such as pollutant removal [22,23], hydrogen storage [24], batteries and supercapacitors [25,26], or additives for livestock feed [27].
Activated carbons are obtained by treating carbonaceous sources with activating agents, which deeply increase its surface area. Depending on the substances used during activation, two different routes can be distinguished. In the chemical route, the precursor is mixed with a chemical reagent—usually KOH [20,22], ZnCl2 [23], or H3PO4 [28]—which provokes oxidation and swelling under inert atmospheres at temperatures between 200 and 1000 °C. On the other hand, in the physical approach, the carbonaceous solid reacts with an oxidizing gas—usually steam or CO2—at temperatures between 700 and 1000 °C [20,22,29].
Although chemical routes usually confer larger surface areas and better adsorption capabilities to the activated carbons, compared with physical routes [20,22,30], their industrial competitiveness is lacking, due to the greater costs and complexity [31].
Interest in the research and production of hydrothermal carbon from biomass and wastes has grown over the past decade. Some publications have analyzed the feasibility of these methods [13,14,32,33,34,35] and a few pilot plants have even been built and put into operation [36]. In this regard, exergy and thermoeconomic analyses are useful tools to optimize the process, which have barely been employed in these processes. By applying thermodynamic principles, these studies provide suitable information to identify energy and economic process inefficiencies. Through a comprehensive assessment, opportune improvements can be defined and applied to the examined plants [37,38]. As examples of these reports, we cite the biomass gasification system developed by Yang et al. [39], the Organic Rankine Cycle and Vapor Compression Cycle hybrid system analyzed by Karellas and Braimakis [40], or the technoeconomic review of hydrothermal oxidation of food waste for hydrochar and bio-oil production made by Mahmood et al. [41].
Following this trend, the present work tackles the design and thermoeconomic analysis of an industrial-scale continuous plant for activated carbon production using vineyard pruning wood. To achieve a realistic, sustainable, and eco-friendly process, laboratory research data are used to examine the thermodynamics of hydrothermal carbonization and physical activation reactions, in order to carry out a thorough thermoeconomic analysis. In this way, energy integration of the process, including a cogeneration system fed by the same wood residues used raw, is proposed and analyzed, in order to foster energy self-sustainable production. Finally, a sensitivity analysis is applied to determine the plant profitability, based on different production and economic scenarios.
2. State of the Art
Viticulture is one of the oldest and most important industries within the agricultural sector around the world. Wine production is a widespread and well-known activity, in which the Mediterranean European countries, inheritors of the Roman influence, lead in the global market. In addition to France, Italy, and Spain, winemaking also presents a notable activity in other lands as California in the United States, Argentina and Chile in South America, South Africa, Australia, or Germany [42]. Previous studies note that grape harvesting could generate dry basis vine shoots yields close to 2 ton/ha [43,44,45]. Despite the wide variety of vineyards, the composition and properties of the vine shoots does not differ significantly. It was found that these woods are formed basically by approximately 67% of holocellulose and 20% of lignin and pentosans [46,47], and also have similar elemental compositions [45] and calorific values [45,48]. These characteristics make the vineyard pruning wood conversion treatments an easy technic to implement in any grape producing region.
The treatment of vine shoots attracted a considerable attention. The practice of using them as a source of organic matter for the soil could carry phytosanitary risks [49], meanwhile its composition and properties make them good raw to elaborate eco-friendly and value-added products, so the proposals surged in past years varied. At this respect, it can be considered some studies about its conversion into sugars and the obtaining of lactic acid, hydroxycinamic, and hydroxybenzoic acids [50]. Moreover, the relative high carbon content and thermodynamic properties of the vine shoots make them adequate to generate biochar and activated carbon. Coalification treatments in laboratory are usually made by pyrolyzing dried vineyard pruning wood [44,51,52,53,54]. One weakness of pyrolysis is the necessity to treat the biomass to reduce moisture contents, which increases timing and costs of storage [45]. In that way, it is important to consider that harvested vineyard pruning wood usually has moisture contents closer to 50 wt.% [45,48] and, in this point, hydrothermal carbonization appears as a competitive method. Hydrothermal carbonization was demonstrated as a suitable alternative to treat viticulture and oenological wastes in literature. Treatment of other winemaking wastes as grape marcs and rachis were analyzed to create hydrochar [32,55,56,57] and activated carbon precursors [20] with positive results and, recently, a hydrothermal carbonization treatment for vine shoot to make electrode batteries was tested [58].
3. Materials and Methods
3.1. Experimental Data
Vineyard pruning wood was received from the Biological Mission of Galicia (CSIC, northwest Spain) and crushed to a grain size of <2 mm using an SK 100 Cross Beater Mill to increase the surface area and reactivity. Then, the pruning wood was mixed with water (74 g of solid per liter of water) and introduced into a Berghof BR-100 reactor. The carbonization pressure was set at 50 bar, while different times (1 to 7 h) and temperatures (150 to 250 °C) were tested. Supplementary Figure S1 shows the solid yield of HTC of vineyard pruning wood under the different mentioned experimental conditions, as well as the variation of elemental composition after 1 h of treatment. The increase of temperature showed a stronger influence, leading to lower solid yields but achieving hydrochar with higher carbon contents; a characteristic that is desirable for the subsequent production of activated carbon. Thus, hydrothermal cracking was established at 250 °C for 1 h. Under these conditions, the reaction mass balance is shown in Supplementary Table S1.
Total organic carbon (TOC) of the liquid phase was determined using a combustion/non-dispersive infrared gas analyzer (model TOC-V Shimadzu). Afterwards, the liquid phase was separated into two fractions by evaporation in a rotary evaporator (Buchi Mod. R300), in order to determine its chemical composition.
The condensable phase consisted of an azeotropic mixture of water and minor contents of acetic acid, which were estimated through acid–base titration using a 1 M NaOH solution. On the other hand, the composition of the organic non-condensable phase was determined by gas chromatography-mass spectrometry (GC-MS). Analyzed samples of the non-condensable phase were diluted in dichloromethane at concentrations between 40 and 42 mg/mL and were injected immediately into the chromatograph. This analysis was done with an Agilent 7890A equipped with an Agilent MS5975C mass spectrometer and a 30 m long HP-5ms (5% phenyl-methylpolysiloxane) column. The chemical composition and elemental C, H, and O proportions of this organic phase are noted in Supplementary Tables S2 and S3. In order to make analysis of the process viable, the liquid phase composition was simplified by selecting chemical compounds among those detected in the GC-MS, based on the bibliographic disposability of thermodynamic data [59,60]. Their mass percentages were recalculated to maintain real carbon, hydrogen, and oxygen proportions. Gaseous products could not be determined experimentally, and their compositions were estimated through elemental C, H, and O mass balances, considering other biomass HTC studies published in the literature. As mentioned in the introduction, it is reasonable to expect a gaseous phase composed fundamentally of CO2 and minor contents of CO, CH4, and H2 [11,16,32,33]. The formation of other gaseous products was disregarded. Tables S4 and S5 note the estimated mass balance for the vineyard pruning wood hydrothermal carbonization.
Relating with other winemaking wastes previously analyzed [20], hydrothermal carbonization of the vineyard pruning wood seems more effective. Despite the lower carbon content of the vine shoots, the obtained hydrochar presents higher degrees of coalification and higher heat of combustion than those obtained from cluster stalks and bagasse. Moreover, the time needed to complete the conversion is reduced from 3 h to 1 h. Comparing with other pyrolysis treatments, the obtained hydrochar shows similar elemental composition than biochar coming from vine shoots pyrolysis under nitrogen atmosphere at 400 °C and char yields of both processes are analogous too [61].
Once HTC was completed, 4 g of hydrochar was physically activated in a rotary kiln by using a steam flow of 0.5 mL/min at 900 °C for 1 h. During activation, an important carbon fraction is removed as CO, giving place to a microporous network (Figure S2a) that increases the adsorption capacity [62]. Due to high temperatures, a slight coalification of the char was still generated and other gaseous products, such as CO2, H2, and H2O may have formed [63]. Activation burn-off gives a first approach to activation degree and further carbonization (Figure S2b). Its value was calculated through Equation (1) and reached 38.88%:
where w1 and w2 are the hydrochar and activated carbon masses, respectively. Activation gas composition was estimated through elemental mass balances, as done with the HTC gas phase. In this regard, significant condensable phases from hydrochar decomposition were not observed. The activation mass balance is shown in Tables S6 and S7.
Burn-off (%) = (w1 − w2)/w1∙100
Burn-off rates are quite lower than those obtained from chemical activation of cluster stalks and bagasse with KOH [20]. The burn-off rates of the physical activation done with steam at 900 °C are more on the line of other physical activations of vine shoot chars with CO2 analyzed in the literature [51]. Comparing BET surface areas of activated carbons coming from chemical and physical pathways, the superiority of chemical activations results is clear [20,51,53,54], so it could be expectable that the greater simplicity of the steam activation would be countered by surface areas inferior to 1.000 m2g−1. Figure S2a shows an SEM image of the porous structure of the obtained activated carbon.
3.2. Thermodynamic Analysis of Hydrothermal Carbonization and Physical Activation
Carbonization and activation heat were theoretically determined through the difference of heats of formation of the products and reagents at their respective reaction temperatures. Except for pruning wood, hydrochar, and activated carbon, all standard enthalpies of formation and specific heat capacities can be found in the bibliography. The heats of formation of these three compounds were estimated through their heats of combustion, which were experimentally measured using a calorimetric bomb. Through modeling a generic combustion reaction (Equation (2)) [16], these enthalpies can be calculated as the difference between the heat of formation of combustion products (CO2 and H2O) and the higher heating value (HHV) of solids:
CHxOy (s) + (1 + x/4 + y/2) O2 (g) → CO2 (g) + (x/2) H2O (l)
To solve the energy balances of carbonization and activation, solid heat capacities must be estimated by applying previous results for wood thermal properties [62,63]:
where u is the moisture content of the material, ufsp is the fiber saturation point (near to 25%), and T is the temperature. It should be considered that the hydrochar moisture varied from 25% after hydrothermal cracking and filtering to 7.5% after the drying step (see Table 1).
Cp = (2.097u + 826)/(1 + u) + (9.92u + 2.55)T/(1 + u) + 0.0002T2/(1 + u) u < ufsp
Cp = (2.862u + 555)/(1 + u) + (5.49u + 2.95)T/(1 + u) + 0.0036 T2/(1 + u) u ≥ ufsp

Table 1.
Moisture and thermodynamic properties of vineyard pruning wood, hydrochar, and activated carbon.
The energy balance revealed that hydrothermal carbonization is an exothermic process with a heat of reaction of −823 Joules per gram of pruning wood (Figure 1a). This value fit closely with the experimental measurement of −760 J/g obtained by Funke and Ziegler for poplar wood HTC at 240 °C [64] and the recent assessment done by Pecchi et al. [65] for cellulose and pine wood. This kind of analysis is published for vineyard pruning wood for the first time. It is pertinent to mark the importance of executing meticulous elemental mass balances based on experimental measurements, in order to prevent unexpected deviations; for example, simplifying the analysis by supposing a gas phase composed entirely of CO2 would have led to a 35% overestimation of the carbonization heat in the present research.
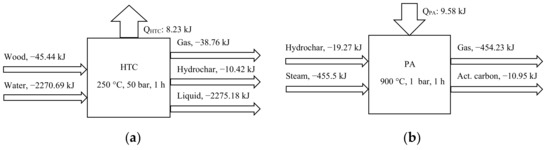
Figure 1.
Energy balances per gram of wood of hydrothermal carbonization (a) and physical activation (b).
Otherwise, the physical activation of hydrochar is an endothermic process (Figure 1b) and the heat of reaction stands at 2396 J/g. The strongly endothermic generation of CO and H2 from the carbon–steam reaction is barely compensated by CO2 formation by the decomposition of anhydride and carboxyl groups.
3.3. System Description
Figure 2 shows the industrial-scale continuous process designed for activated carbon production from vineyard pruning wood. This process was established after a previous thermoeconomic study that identified the optimum points for energy integration.
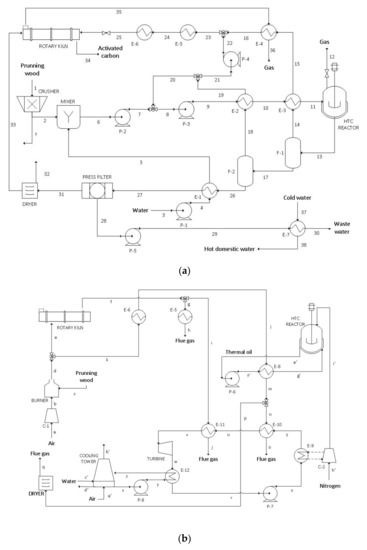
Figure 2.
Schematic flow sheet of the activated carbon production plant (a) and the coupled cogeneration system (b).
Vineyard pruning wood is crushed in a crusher to homogenize the particle sizes and increase their surface area and reactivity. Then, part of the wood is mixed with water and pumped into the HTC reactor (Figure 2a). Simultaneously, compressed nitrogen is introduced into the batch, in order to maintain the pressure at the operation set point (Figure 2b).
It is worth mentioning that a discontinuous reactor model was selected. Instead of the use of pilot projects with continuous or semi-continuous models, the preference to select current standard equipment and to follow a conservative approach for the cost analysis prevailed. To create a continuous flow, a battery of three batches working in parallel was chosen, in order to avoid the carbonization lapse. The reactors are heated with thermal oil, which takes the heat demand from the flue gas of burned raw material in exchanger E-6.
After HTC reaction, the hydrochar suspension is depressurized to 10 and 3.2 bars in flash tanks F-1 and F-2, respectively. As consequence of both expansions, two steam flows are generated. These flows are used to pre-heat the reactor feed in exchangers E-2 and E-3 and, downstream, as an activating agent into the rotary kiln. Flash pressures are established to warm the HTC inlet below the cellulose hydrolysis point (180 °C), avoiding fogging in heat exchanger E-3 and premature carbonization. The outgoing slurry from flash tank F-2 is used to pre-heat the inlet water and conduced to a press filter, where the hydrochar is removed from the aqueous phase. This wastewater is pumped to exchanger E-7, in order to transfer its heat and supply a hot domestic water stream. Meanwhile, the char is dried and carried to the rotary kiln to accomplish activation. The activation gas heat is partially recovered in exchanger E-4, in which the condensed flow coming from E-3 is evaporated again.
Otherwise, the part of the crushed pruning wood that is not used to produce activated carbon (stream c) is burned to generate a compressed flue gas, in order to provide the remaining heat demand. To recover the sensible heat of the outgoing flue gas and the excess of heat emitted by the nitrogen compressor C-2, a Rankine cycle is coupled. This steam power cycle works at 60 bar and 480 °C at the turbine inlet and generates the electricity necessary for the operation of the entire plant.
3.4. Process Thermoeconomic Analysis
The incidence matrix A (m × n) represents the physical structure of the process, connecting the m streams and n sub-systems. This matrix ought to be amplified by adding sub-system exergy flows or economic process structure, depending on the thermoeconomic data needed. To define A (m × n), each element aij of the matrix should be valued +1 if stream j enters into sub-system i, −1 if it leaves, or 0 if there does not exist a direct physical connection between them [36]. Under steady-state operation, it is possible to describe mass, energy, and exergy balances using the incidence matrix: A × M = 0, A × E = 0, A × B = Bd, where M, E, B, and Bd are vectors of dimension [n] whose elements correspond to the mass, energy, exergy, and destroyed exergy flows.
To perform the thermoeconomic analysis, the exergy of each process stream was calculated using the physical (bp) and chemical (bc) exergies of the contained substances (Equations (5)–(7)):
bp = (H-H0) − T0(S-S0)
bc = ∑xi∙bc,i + RT0∑xi∙ln(xi)
b = bp + bc
Pruning wood, hydrochar, and activated carbon chemical exergies were estimated using their Lower Heating Values (LHV) in Equation (7) [66]:
where β is a correlation that depends on the chemical composition of the solid [64]:
where zH, zC, and zO are the hydrogen, carbon, and oxygen mass fractions of the solids, respectively.
bc = β ∙ LHV
β = [1.0412 + 0.216zH⁄zC − 0.2499zO⁄zC(1 + 0.7884zH⁄zC) + 0.045zN⁄zC]/[1 − 0.3035zO⁄zC]
Finally, the exergy vector is completed by adding the exergy flows in each plant device. By multiplying an amplified incidence matrix and the exergy vector, the exergy destruction at each process stage can be determined.
The exergy cost balance is defined by Equation (10) [36]:
where B* is the exergy cost vector, A−1 (n × n) is the inverse of the amplified incidence matrix A (m × n) with economic structure matrix α(n − m) × n, and Ω is the vector of imputed exergy costs. All elements of α are null, except for the following cases:
B* (n × 1) = A−1 (n × n) ∙ Ω(n × 1)
- -
- Resources: a value of + 1 is assigned to the αir elements corresponding to input resources;
- -
- Products and by-products: a value of + 1 is attributed to the αip elements belonging to process products or by-products;
- -
- Wastes: a value of + 1 is assigned to the αiw elements corresponding waste streams; and
- -
- Bifurcations: in those sub-systems with various exiting streams, values of +1⁄Bj and −1⁄Bk are assigned to the corresponding j and k flows.
The vector Ω is defined by a series of null elements that correspond to the m rows of the process physical structure, while the other n − m elements are established as follows:
- -
- Resources: The values of Br, corresponding to resources exergy flows, are imputed; and
- -
- Wastes and bifurcations: null values are assigned.
By solving the exergy cost balance, the rational yield (τ) is obtained. This parameter denotes the process overall efficiency, relating the exergy contained in products with the exergy needed to obtain them:
τ = Bp/Bp*
The economic cost balance is calculated using Equation (12). It expresses the cost of the outputs through the cost of inputs and fixed costs (e.g., depreciation, maintenance, operations, and general plant expenses):
Π(n × 1) = −A−1 (n × n) ∙ Φ(n × 1)
The execution of the economic balance is quite similar to the exergetic cost balance. The same matrix is used, corresponding to imputed thermoeconomic costs. Φ is composed of the m sub-systems and the n − m costs of resources, by-products, wastes, and bifurcations. Otherwise, it is the thermoeconomic costs vector, which indicates how expensive the manufactured products are.
The economic balance is based on equipment investments. Equipment prices were estimated by bibliographic procedures [67,68,69] and actualized according to the Chemical Engineering Price Cost Index [70]. Through this spending (C), the amount of capital needed to create the plant was deduced using the Lang method [71]. Once the plant investment (PI) is estimated, the annualized fixed costs flow (FCA) can be calculated by Equation (13):
where A/Pi,n is the capital recovery factor and fRM is the repair and maintenance factor. The capital recovery factor is determined by cost of capital (i) and plant lifetime (n) in years:
where E and D are the amounts of equity and debt, ke is the rate of return, kd is the cost of debt, and t represents income taxes. The costs of maintenance stands at 8% of the equipment spent, and 2 workers per shift were considered necessary to keep the plant running, with individual annual salary costs estimated at €40,000.
FCA = (A/Pi,n + fRM)PI
A⁄Pi,n = i(1 + i)n/[(1+i)n − 1]
i = keE/(D + E) + kd(1 − t)D/(D + E)
fRM = (Maintenance + Salaries)/PI
Finally, to define the vector and solve the economic balance, the annualized fixed costs flow is divided proportionally between the m subsystems of the plant:
FCj = FCA(Cj/C)
4. Results and Discussion
Previous studies of hydrothermal carbonization plants of biomass distinguish the scale of production as a critical factor to ensure the economic viability of those process [12,33]. To determine the impact of production volume on the designed plant, three different scales based on standard reactor capacities for hydrothermal carbonization [72] were analyzed: 0.5 ton/h, 1 ton/h, and 2.5 ton/h of pruning wood converted into activated carbon.
4.1. Energy and Exergy Cost Analysis
To complete the energy analysis, the size of the cogeneration cycle, as well as electric and heat equipment consumptions were estimated. To cover electricity and heat demands, additional mass flows of 1 ton/h, 2.1 ton/h, and 5.2 ton/h of pruning wood had to be crushed and burned, depending on the scale of production. Table 2 summarizes the electricity and heat needed to keep running the plant and other parameters considered to carry out the analysis, meanwhile Figure 3 shows main energy consumptions broken down by equipment and operation.
Table 2.
Energy flows of the plant and thermodynamic parameters considered for the exergetic analysis.
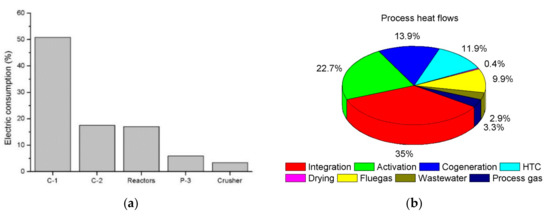
Figure 3.
Relative equipment electric consumption (a) and heat flows distribution (b).
Compressor C-1, which compresses the air used to burn the wood and provide heat demands, comprises half of the total electricity consumption. Looking at the rest of equipment, the main consumers of electricity are the nitrogen compressor (C-2), the HTC reactor stirrers, the HTC reactor feeding pump (P-3), and the crusher. The remaining equipment represents minor electric consumptions, adding together to 5.2% of the overall.
The savings achieved by the thermal energy integration throughout the plant are remarkable. In that way, 35% of the overall heat flow process is covered by crossing hot and cold streams of the activated carbon making in heat exchangers E-1, E-2, E-3, E-4, and E-7. Including the 13.9% of the heat recovered from flue gas in heat exchangers E-10 and E-11 to generate the electricity, the heat demands covered through integrating cold and hot streams and through attaching the Rankine cycle climbs at 48.9% of the overall.
As expected, activation is the step with higher heat demands by far, followed by hydrothermal carbonization. Vaporization and heating up to 900 °C in heat exchangers E-5 and E-6, and the endothermic nature of the activation, hoard 22.7% of the plant heat flows. Otherwise, the heating of stream 11 up to 250 °C in the hydrothermal carbonization reactors takes 11.9%. Moreover, it should be noted that 40.9% of the electricity generated with the pruning wood combustion is consumed by the stirrers of the HTC reactors, nitrogen compressor, and pumps P-2 and P-3, which fed the reactors.
To increase the energy efficiency of the plant, the attached cogeneration cycle recovers more than half of the sensible heat of the outgoing flue gas in heat exchangers E-10 and E-11 and converts it into electricity. In that way, only 16.1% of the heat flows is lost in exiting exhaust gases, wastewater, and activation and HTC gases. Heat recovery and energy integration are also shown in exergy flow diagrams of Figure 4.
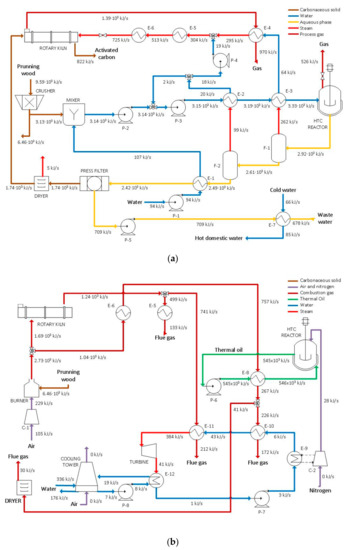
Figure 4.
Exergy flows for a 500 kg/h pruning wood carbonization plant (a) and its coupled cogeneration system (b).
One first way to measure the energy efficiency of the plant is to compare the energy output produced if the activated carbon were burned with the energy needed to produce them. This method was proposed by Steman and Ziegler for measuring a hydrochar production from biomass hydrothermal carbonization [34]. For the present work, in which the energy demands are supplied through pruning wood combustion, the energy efficiency of the plant could be estimated as follows:
Energy efficiency = HHVAC/HHVPW = 0.11
The effect of the energy integration and cogeneration cycle on efficiency is clear. The lack of heat recovering to preheat streams and to generate electricity would decrease the energy efficiency of the plant to 0.08, due to the increase on wood consumption to cover the 35% of the heat saved through the integration and the electric consumption that would be taken from the grid.
Lucian and Fiori also used this method to analyze the efficiency of a hydrochar making process from off-specification compost and grape marc [32]. In this regard, they determine an influence of the biomass to water ratio in HTC on the energy efficiency. The hydrothermal carbonization analyzed presents similar ratios of 0.07 kg of dry biomass per kg of water to the present work. With this biomass/water ratio, the process plant for hydrochar making from compost with an HTC at 250 °C for 1 h shows also similar solid yields to that obtained in the present work and an energy efficiency near to 0.27. The impact of the activation on plant energy efficiency results is evident.
To describe the process and results thoroughly, Figure 4 shows the exergy flow balances of the plant designed to carbonize 500 kg/h of pruning wood.
Figure 5 shows the exergy cost analysis. The process has a cost of 12.27 exergy units for each exergy unit of activated carbon produced. In this calculation, chemical and physical exergies of substances and energy equipment demands are taken into account. On the other hand, the integrated Rankine cycle recovers one exergy unit for each 3.26 units contained in flue gas streams.
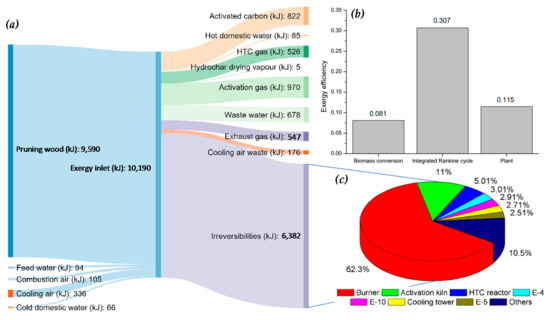
Figure 5.
Sankey diagram of a 500 kg/h pruning wood carbonization plant (a); exergy efficiency of conversion, electric generation, and overall efficiency of the plant (b); and distribution of exergy destructions among the equipment of the plant (c).
As shown in Figure 4 and in the Sankey diagram of Figure 5a, the more significant exergy losses happen due to combustion followed by chemical transformations, while thermodynamic equipment irreversibility and heat loss represent minor percentages. Doing a calculation analogous to the one performed for energy efficiency, the exergy efficiency of the activated carbon making reaches 8.1%. If hot domestic water is included as product and electricity consumption and generation are taken into account, the overall exergy costs of the plant descend to 8.72 units per exergy unit produced, which corresponds to an exergy efficiency of 11.5% (Figure 5b):
AC making exergy efficiency = BAC/Binlet = 0.081
Plant exergy efficiency = (BAC + Belectricity + BHDW)/(Binlet + Belectricity) = 0.115
Figure 5c shows the distribution of exergy destruction by equipment. The burner represents 62.3% of all process irreversibility due to the combustion of pruning wood. Specifically, 39% of each unit of exergy introduced into the process is lost in pruning wood combustion to supply energy demands, which emphasizes the importance of the energy integration achieved by the heat exchangers network. Looking to Figure 4a, it is worth to note that the set of heat exchangers E-1, E-2, E-3, E-4, and E-7 saves an exergy flow of 440 kJ/s for the 500 kg/h scale plant. In addition, it can be seen in Figure 4b that the combustion in the burner provides a return of 42% of every exergy unit contained in pruning wood, so the savings of 440 kJ/s suppose an exergy thrift near to 1042 kJ/s. Comparing this data with the Sankey diagram of Figure 5a, the energy integration in heat exchangers E-1, E-2, E-3, E-4, and E-7 achieves an increase on the exergy efficiency of the plant of 10.2%.
Comparing hydrothermal carbonization and physical activation, Figure 4 and Figure 5a show that activation has a stronger impact on plant efficiency. Destruction of exergy on rotary kiln and HTC reactors seems similar in Sankey diagram, but the exergy contained in activation gases is 84.4% higher than those contained in HTC reactor exiting gas. Taking exergy values from Figure 4, exergy efficiency of both processes could be estimated:
HTC exergy efficiency = Bhydrochar/(B11 + Bi’ + Bheat + Belectricity) = 0.43
Activation exergy efficiency = Bactivated carbon/(B25 + B33 + Bheat + Belectricity) = 0.28
4.2. Economic Analysis
Economic investments into equipment, the plant, and process operations were estimated according to the procedure described in Section 3.4 and noted in Table 3, with other economic parameters used as reference.
Table 3.
Economic parameters considered for the economic analysis.
Costs of equity and debt give a cost of capital of 6.25%. These values are based on a financial analysis of the chemical industry [61] and financial reports of the EU [73]; the profit tax rate was set at 25%, according to the current Spanish taxation. Operation of the plant was estimated for 15 years with 4 shifts of 2000 h each and 8000 annual working hours. Pruning wood cost was estimated through an actualization of the prices of this kind of biomass [74]; process water and wastewater costs through the public tariffs of a local water company; and electricity cost according to the Eurostat statistics for Spanish industrial consumers [75].
Figure 6 and Figure 7 show the influence of production scales on economic costs. The increase of scale is crucial to ensure the viability of the plant. At the smaller scale, the investments and fixed costs associated with the Rankine cycle have an excessive weight and make the plant unprofitable under market scenarios with electricity costs below 0.115 €/kWh. For the higher scales of 1 ton/h and 2.5 ton/h, the incorporation of the cogeneration cycle leads to adequate results (Figure 6a). In contrast, the cost of hot domestic water supply does not differ significantly, being only affected by the price of main water and the expenses relating to heat exchanger E-7 (Figure 6b).

Figure 6.
Costs of electricity (a) and costs of hot domestic water (b).

Figure 7.
Economic investments distribution (a) and fixed cost distribution among the equipment (b).
As expected, the increase of the scale notably reduced the weight of the fixed costs on total economic spending (Figure 7a). Wood price stood out among the variable costs, supposing more than 30% of total investments during the plant service life. Previous analysis pointed out the relative high impact of raw costs on plant economics [12]. This is an important aspect, as long as the wood used is a waste that needs an adequate disposing with inherent associated costs (around 25 €/ton). Mendívil et al. [45] made an approach to the cost of vineyard pruning wood, indicating an average price of 70 €/ton for dried and chopped wood in a price range between 50 and 80 €/ton, a value that matches the estimated cost (Table 3). In this line, Spinelli et al. [76] published a comprehensive analysis of vineyard pruning wood costs, in which they indicate that processed pruning residues could be obtained at about 30–40 €/ton under favorable conditions (short forwarding distances, for example). Moreover, HTC is a probed method to treat wet biomass, so drying storage times could be avoided. Water costs shows lower impact, but alternatives to reduce its use might be considered. In that way, a continuation of the research in the laboratory would be suggested to determine if biomass/water ratio on HTC could be increased and if aqueous phase could be recirculated successively as in other HTC process [32,77].
Figure 7b compares the impact of the most expensive equipment on the fixed costs. Hydrothermal carbonization reactors accumulate the highest expenses. This result agrees with other economic analyses carried out for hydrochar production from hydrothermal carbonization of biomass [32,34,35]. The relatively high spending dedicated to acquiring the batches and the nitrogen compressor indicates that the development of new semi-continuous or continuous industrial reactors might be a point of consideration to increase the competitivity of carbon product synthesis from biomass and wastes.
4.3. Sensitivity Analysis
A sensitivity analysis was carried out to determine the influence of economic and operational parameters on plant profitability. This kind of analysis was demonstrated as an effective method to determine the influence of different parameters on thermoeconomic costs vector [39]. As described in Section 3.4, thermoeconomic costs estimation is based on equipment investments and is influenced by the following parameters: cost of capital, lifetime, salaries, maintenance and costs of resources, by-products, wastes, and bifurcations. As shown in Table 3, maintenance and salaries have lesser impact compared to equipment and plant investments, so it was found that variations on Equation (14) (lifetime and cost of capital) would have higher influence on the economy of the plant. On the other hand, the effect of annual workload was also analyzed to complete the analysis. In terms of resources costs, vineyard pruning wood was identified in Section 4.3 as another high impact parameter whose costs may be subject to fluctuations, so it was decided to be included on the sensitivity analysis. These four parameters were analyzed for the three different scales of production in order to include its influence, so Figure 8 and Figure 9 show the activated carbon production costs variation with annual working hours, service life, cost of capital, and cost of pruning wood. To determine adequate economic scenarios, production costs of activated carbon obtained from wood (2.0 €/kg) and fossil carbon (1.10 €/kg) were set as targets [78,79].

Figure 8.
Activated carbon production costs variation in function of the working hours per year (a) and service life (b).

Figure 9.
Activated carbon production costs variation in function of the cost of capital (a) and pruning wood (b).
The scale of production was demonstrated to be a fundamental parameter in economic plant viability and only at the highest scale was the plant systematically capable of achieving production costs which were competitive with biomass activated carbon prices. Only a severe reduction of workload could raise the production costs upper the target prices of activated carbon obtained from biomass. The number of shifts and annual working hours impacted the plant profitability significantly. Figure 8a shows that it would be reasonable to reduce the original 8000 working hours to 6000 working hours for the highest production scale, but further reductions on operational time could limit the economic feasibility, if other parameters were not improved. In this way, the cogeneration system clearly favors the plant competitivity under scenarios with higher workloads and service life. To prolong the service life helps to increase the amortization of the investment and reduce costs of production. This effect has a notable impact on how the cogeneration cycle influences the production costs (Figure 8b). Increasing service life to 20 year would decrease production costs by more than 5% and even in the lowest scale of production, the decision to attach the cogeneration cycle to activated carbon production becomes favorable. However, it is important to note that an increase in plant lifetime does not make scales of production of 500 kg/h and 1000 kg/h economically viable.
Capital costs influenced the activated carbon prices moderately (Figure 9a). Its increase caused a growth in plant investments, which marked an adverse tendency against the economic profits given by electricity cogeneration. In any case, the advantage of this system at high production scales is obvious and, even under other adverse scenarios, it manages to keep the production costs low, compared with one that takes the electricity from the grid. At the highest scale of production, costs are systematically below the target of 2.0 €/kg, so the plant would be resistant to adverse economic scenarios with increasing interest rates and reductions of credit flow.
Finally, vineyard pruning wood cost appears as the other great impact economic parameter (Figure 9b), which is often the point of focus of projects working with wastes and low-cost raw materials. It is important to note that the wood used in the present research is a waste whose price could be reduced as mentioned in Section 4.2. With the price range determined bibliographically, the produced activated carbons are not in position to compete in the market with activated carbons made from coal. This break-even point would only be reached if pruning wood procurement costs descend under 15 € per ton. Then, the obtained activated carbon would be even competitive in price with activated carbons made from coal if the scale of production of the plant were at 2500 kg/h. However, fluctuation of costs of pruning wood shows a strong influence on plant profitability. If pruning wood price descends below 60 € per ton, the designed plant achieves the target prices for biomass activated carbons with a production scale of 1000 kg/h for the first time. At his highest production scale, the plant seems robust to wood price fluctuation and only under scenarios with cost of pruning wood equal or higher to 100 €/ton would there be a lack of competitiveness against other activated carbons from renewable origins. At this point, it would be interesting to investigate alternative wastes with lower costs and determine its potential to be transformed into eco-friendly activated carbons.
It would be concluded that encouraging the research on this kind of process could open up a promising opportunity to replace activated carbons from fossil origin and help to change the industrial model in a new sustainable and ecological direction in the future.
5. Conclusions
Conversion of waste vineyard pruning wood into activated carbon was studied through experimental research to determine the products formed and the thermodynamics involved. The experimental results and thermoeconomic principles were used to design and model a sustainable production process for activated carbons using these wastes. The analysis focused on improving the efficiency of the plant through energy integration and the coupling of a cogeneration cycle which recovers the residual heat to provide the electric demands. Furthermore, economic and sensitivity analyses were performed to identify the competitive weakness of the plant and to consider the impacts of different parameters on its feasibility. According to the results, the following conclusions can be stated:
- Pruning wood combustion used to supply heat demand causes the major destruction of exergy and, so, efficiency improvements should necessarily be focused on avoiding heat losses and reducing heat demands through recovery from remaining sources.
- Energy integration and cogeneration are capable of covering 48.9% of the energy demands of the plant, which demonstrates the utility of the thermoeconomic method to identify the improvement opportunities in process efficiency.
- High scales of production are fundamental to ensure the economic competitivity of the plant and to reduce the impact of the fixed costs on the overall balance.
- At the highest scale of 2.5 ton/h of treated pruning wood, the plant achieves production costs which are systematically competitive with activated carbon made from wood (2.0 €/kg). In this regard, the sensitivity analysis revealed the convenience of maintaining a workload above 6000 working hours per year.
- Pruning wood cost is identified as the other great influence parameter in the economic sensitivity analysis. In this regard, HTC could help to reduce the costs by treating pruning wood as received from harvest. Water costs show lower impact, but alternatives to reduce its use might be considered.
Supplementary Materials
The following are available online at https://www.mdpi.com/1996-1073/13/23/6462/s1, Figure S1. Solid yield of the HTC of vineyard pruning wood under experimental conditions (a) and elemental composition of raw and hydrochar after 1 h of treatment (b); Figure S2. SEM image of the activated carbon porous structure obtained (a) and variation on the elemental composition during the activation treatment (b); Table S1. Mass balance of hydrothermal carbonization; Table S2. Non-condensable phase composition detected by GC-MS; Table S3. Elemental composition of the non-condensable organic phase analyzed by GC-MS; Table S4. Chemical composition of the HTC aqueous phase assumed for the process analysis; Table S5. Chemical composition estimated for the HTC gaseous phase; Table S6. Mass balance of the activation; Table S7. Chemical composition estimated for the activation gas phase.
Author Contributions
Conceptualization, F.A.L. and F.J.A.; methodology, F.A.L., A.J.V., and F.J.A.; validation, I.L.; formal analysis, F.A.L. and I.L.; investigation, I.L.; resources, F.A.L.; data curation, I.L. and A.J.V.; writing—Original draft preparation, I.L.; writing—Review and editing, all authors.; supervision, F.A.L. and A.J.V. All authors have read and agreed to the published version of the manuscript.
Funding
This research received no external funding.
Acknowledgments
We acknowledge the support of the publication fee by the CSIC Open Access Publication Support Initiative through its Unit of Information Resources for Research (URICI).
Conflicts of Interest
The authors declare no conflict of interest.
Nomenclature
| HTC | hydrothermal carbonization |
| TOC | Total Organic Content |
| GC-MS | gas chromatography-mass spectrometry |
| HHV | higher heating value |
| LHV | Lower Heating Value |
| Cp | heat capacity |
| ufsp | fiber saturation point moisture |
| P-1, P-2, P-3, P-4, P-5, P-6, P-7, P-8 | pumps |
| E-1, E-2, E-3, E-4, E-5, E-6, E-7, E-8, E-9, E-10, E-11, E-12 | heat exchangers |
| F-1, F-2 | flash tanks |
| C-1, C-2 | compressors |
| 1-38 | activated carbon making process streams |
| a-h’ | cogeneration cycle process streams |
| A (m × n) | incidence matrix |
| B | stream exergy |
| Bp | physical exergy |
| Bc | chemical exergy |
| Bd | destroyed exergy, thermodynamic irreversibilities |
| T | temperature |
| H, H0 | enthalpy and standard enthalpy of formation |
| S, S0 | entropy and standard entropy of formation |
| ZH, ZC, ZO | mass fraction of hydrogen, carbon and oxygen |
| B* | exergy cost |
| A-1 (n × n) | inverse amplified incidence matrix |
| Ω(n × 1) | imputed exergy costs vector |
| Τ | rational yield, exergy efficiency |
| Π(n × 1) | thermoeconomic costs vector |
| Φ(n × 1) | imputed thermoeconomic costs vector |
| FCA | annualized fixed costs flow |
| A/Pi,n | capital recovery factor |
| fRM | repair and maintenance factor |
| PI | plant investment |
| i | cost of capital |
| n | plant lifetime |
| E | equity |
| D | debt |
| ke | cost of equity |
| kd | cost of debt |
| t | income taxes |
| FC | fixed costs flow |
| C | cost of equipment |
| AC | activated carbon |
| PW | vineyard pruning wood |
References
- European Commision. An EU Action Plan for the Circular Economy; EEA: Copenhagen, Denmark, 2015; Volume 614, p. 21. [Google Scholar]
- EU. European Commision Report from the Commision to the European Parliament, the Council, the European Economic and Social Commitee and the Committe of the Regions on the Implementation of the Circular Economy Action Plan; EU: Brussels, Belgium, 2019. [Google Scholar] [CrossRef]
- Dupuis, I. Producción y consumo sostenibles y residuos agrarios. Minist. Agric. Aliment. y Medio Ambient. 2012, 66, 37–39. [Google Scholar] [CrossRef]
- Kambo, H.S.; Dutta, A. A comparative review of biochar and hydrochar in terms of production, physico-chemical properties and applications. Renew. Sustain. Energy Rev. 2015, 45, 359–378. [Google Scholar] [CrossRef]
- Brownsort, P.; Mašek, O. Biomass Pyrolysis Processes: Performance Parameters and their Influence on Biochar System Benefits. Master’s Thesis, University of Edinburgh, Edinburgh, UK, 2009. [Google Scholar]
- López, F.A.; Centeno, T.A.; García-Díaz, I.; Alguacil, F.J. Textural and fuel characteristics of the chars produced by the pyrolysis of waste wood, and the properties of activated carbons prepared from them. J. Anal. Appl. Pyrolysis 2013, 104, 551–558. [Google Scholar] [CrossRef]
- Haeldermans, T.; Campion, L.; Kuppens, T.; Vanreppelen, K.; Cuypers, A.; Schreurs, S. Bioresource Technology A comparative techno-economic assessment of biochar production from different residue streams using conventional and microwave pyrolysis. Bioresour. Technol. 2020, 318, 124083. [Google Scholar] [CrossRef]
- Rousset, P.; MacEdo, L.; Commandré, J.M.; Moreira, A. Biomass torrefaction under different oxygen concentrations and its effect on the composition of the solid by-product. J. Anal. Appl. Pyrolysis 2012, 96, 86–91. [Google Scholar] [CrossRef]
- Puig-Arnavat, M.; Bruno, J.C.; Coronas, A. Review and analysis of biomass gasification models. Renew. Sustain. Energy Rev. 2010, 14, 2841–2851. [Google Scholar] [CrossRef]
- Brynda, J.; Skoblia, S.; Pohořelý, M.; Beňo, Z.; Soukup, K.; Jeremiáš, M.; Moško, J.; Zach, B.; Trakal, L.; Šyc, M. Wood chips gasification in a fixed-bed multi-stage gasifier for decentralized high-efficiency CHP and biochar production: Long-term commercial operation. Fuel 2020, 281, 118637. [Google Scholar] [CrossRef]
- Libra, J.A.; Ro, K.S.; Kammann, C.; Funke, A.; Berge, N.D.; Neubauer, Y.; Titirici, M.M.; Fühner, C.; Bens, O.; Kern, J.; et al. Hydrothermal carbonization of biomass residuals: A comparative review of the chemistry, processes and applications of wet and dry pyrolysis. Biofuels 2011, 2, 71–106. [Google Scholar] [CrossRef]
- Reza, M.T.; Andert, J.; Wirth, B.; Busch, D.; Pielert, J.; Lynam, J.G.; Mumme, J. Hydrothermal Carbonization of Biomass for Energy and Crop Production. Appl. Bioenergy 2014, 1, 11–29. [Google Scholar] [CrossRef]
- Reza, M.T.; Uddin, M.H.; Lynam, J.G.; Hoekman, S.K.; Coronella, C.J. Hydrothermal carbonization of loblolly pine: Reaction chemistry and water balance. Biomass Convers. Biorefinery 2014, 4, 311–321. [Google Scholar] [CrossRef]
- Saba, A.; McGaughy, K.; Toufiq Reza, M. Techno-economic assessment of co-hydrothermal carbonization of a coal-Miscanthus blend. Energies 2019, 12, 1–17. [Google Scholar] [CrossRef]
- Kruse, A.; Funke, A.; Titirici, M.M. Hydrothermal conversion of biomass to fuels and energetic materials. Curr. Opin. Chem. Biol. 2013, 17, 515–521. [Google Scholar] [CrossRef] [PubMed]
- Ramke, H.; Blöhse, D.; Lehmann, H.; Fettig, J. Hydrothermal Carbonization of Organic Waste. In Proceedings of the 12th International Waste Management and Landfill Symposium, Sardinia, Italy, 5–9 October 2009. [Google Scholar]
- Hoekman, S.K.; Broch, A.; Robbins, C. Hydrothermal carbonization (HTC) of lignocellulosic biomass. Energy Fuels 2011, 25, 1802–1810. [Google Scholar] [CrossRef]
- Yan, W.; Hastings, J.T.; Acharjee, T.C.; Coronella, C.J.; Vásquez, V.R. Mass and energy balances of wet torrefaction of lignocellulosic biomass. Energy Fuels 2010, 24, 4738–4742. [Google Scholar] [CrossRef]
- Gamgoum, R.; Dutta, A.; Santos, R.; Chiang, Y. Hydrothermal Conversion of Neutral Sulfite Semi-Chemical Red Liquor into Hydrochar. Energies 2016, 9, 435. [Google Scholar] [CrossRef]
- Alcaraz, L.; López Fernández, A.; García-Díaz, I.; López, F.A. Preparation and characterization of activated carbons from winemaking wastes and their adsorption of methylene blue. Adsorpt. Sci. Technol. 2018, 36, 1331–1351. [Google Scholar] [CrossRef]
- Ramón-Gonçalves, M.; Alcaraz, L.; Pérez-Ferreras, S.; León-González, M.E.; Rosales-Conrado, N.; López, F.A. Extraction of polyphenols and synthesis of new activated carbon from spent coffee grounds. Sci. Rep. 2019, 9, 17706. [Google Scholar] [CrossRef]
- Alcaraz, L.; Escudero, M.E.; Alguacil, F.J.; Llorente, I.; Urbieta, A.; Fernández, P.; López, F.A. Dysprosium Removal from Water Using Active Carbons Obtained from Spent Coffee Ground. Nanomaterials 2019, 9, 1372. [Google Scholar] [CrossRef]
- Björklund, K.; Li, L.Y. Adsorption of organic stormwater pollutants onto activated carbon from sewage sludge. J. Environ. Manage. 2017, 197, 490–497. [Google Scholar] [CrossRef]
- Jordá-Beneyto, M.; Suárez-García, F.; Lozano-Castelló, D.; Cazorla-Amorós, D.; Linares-Solano, A. Hydrogen storage on chemically activated carbons and carbon nanomaterials at high pressures. Carbon N. Y. 2007, 45, 293–303. [Google Scholar] [CrossRef]
- Lim, J.Y.; Kang, D.A.; Kim, N.U.; Lee, J.M.; Kim, J.H. Bicontinuously crosslinked polymer electrolyte membranes with high ion conductivity and mechanical strength. J. Memb. Sci. 2019, 589, 117250. [Google Scholar] [CrossRef]
- Zhu, X.; Yu, S.; Xu, K.; Zhang, Y.; Zhang, L.; Lou, G.; Wu, Y.; Zhu, E.; Chen, H.; Shen, Z.; et al. Sustainable activated carbons from dead ginkgo leaves for supercapacitor electrode active materials. Chem. Eng. Sci. 2018, 181, 36–45. [Google Scholar] [CrossRef]
- Huwig, A.; Freimund, S.; Käppeli, O.; Dutler, H. Mycotoxin detoxication of animal feed by different adsorbents. Toxicol. Lett. 2001, 122, 179–188. [Google Scholar] [CrossRef]
- Gonzalez-Serrano, E.; Cordero, T.; Rodriguez-Mirasol, J.; Cotoruelo, L.; Rodriguez, J.J. Removal of water pollutants with activated carbons prepared from H3PO4 activation of lignin from kraft black liquors. Water Res. 2004, 38, 3043–3050. [Google Scholar] [CrossRef]
- Zhang, T.; Walawender, W.P.; Fan, L.T.; Fan, M.; Daugaard, D.; Brown, R.C. Preparation of activated carbon from forest and agricultural residues through CO2 activation. Chem. Eng. J. 2004, 105, 53–59. [Google Scholar] [CrossRef]
- Nowicki, P.; Kazmierczak, J.; Pietrzak, R. Comparison of physicochemical and sorption properties of activated carbons prepared by physical and chemical activation of cherry stones. Powder Technol. 2014, 269, 312–319. [Google Scholar] [CrossRef]
- Maciá-Agulló, J.A.; Moore, B.C.; Cazorla-Amorós, D.; Linares-Solano, A. Activation of coal tar pitch carbon fibres: Physical activation vs. chemical activation. Carbon N. Y. 2004, 42, 1367–1370. [Google Scholar] [CrossRef]
- Lucian, M.; Fiori, L. Hydrothermal carbonization of waste biomass: Process design, modeling, energy efficiency and cost analysis. Energies 2017, 10, 211. [Google Scholar] [CrossRef]
- Stemann, J.; Erlach, B.; Ziegler, F. Hydrothermal carbonisation of empty palm oil fruit bunches: Laboratory trials, plant simulation, carbon avoidance, and economic feasibility. Waste Biomass Valorization 2013, 4, 441–454. [Google Scholar] [CrossRef]
- Stemann, J.; Ziegler, F. Assessment of the Energetic Efficiency of a Continuously Operating Plant for Hydrothermal Carbonisation of Biomass. In Proceedings of the World Renewable Energy Congress—Sweden, 8–13 May 2011; Linköping University Electronic Press: Linköping, Sweden, 2011; pp. 125–132. [Google Scholar] [CrossRef]
- Erlach, B.; Wirth, B.; Tsatsaronis, G. Co-Production of Electricity, Heat and Biocoal Pellets from Biomass: A Techno-Economic Comparison with Wood Pelletizing. In Proceedings of the World Renewable Energy Congress—Sweden, 8–13 May 2011; Linköping University Electronic Press: Linköping, Sweden, 2011; Volume 57, pp. 508–515. [Google Scholar] [CrossRef]
- Hitzl, M.; Corma, A.; Pomares, F.; Renz, M. The hydrothermal carbonization (HTC) plant as a decentral biorefinery for wet biomass. Catal. Today 2015, 257, 154–159. [Google Scholar] [CrossRef]
- Valero, A.; Muñoz, M.; Lozano, M.A. General Theory of Exergy Saving: II. On the Thermoeconomic Cost; Gaggioli, R., Ed.; Pergamon Press: Oxford, UK, 1986; Volume 3, pp. 1–8. [Google Scholar]
- Lozano, M.A.; Valero, A. Theory of the exergetic cost. Energy 1993, 18, 939–960. [Google Scholar] [CrossRef]
- Yang, K.; Zhu, N.; Ding, Y.; Chang, C.; Yuan, T. Thermoeconomic analysis of an integrated combined cooling heating and power system with biomass gasification. Energy Convers. Manag. 2018, 171, 671–682. [Google Scholar] [CrossRef]
- Karellas, S.; Braimakis, K. Energy-exergy analysis and economic investigation of a cogeneration and trigeneration ORC-VCC hybrid system utilizing biomass fuel and solar power. Energy Convers. Manag. 2016, 107, 103–113. [Google Scholar] [CrossRef]
- Mahmood, R.; Parshetti, G.; Balasubramanian, R. Energy, exergy and techno-economic analyses of hydrothermal oxidation of food waste to produce hydro-char and bio-oil. Energy 2016, 102, 187–198. [Google Scholar] [CrossRef]
- Hussain, M.; Cholette, S.; Castaldi, R. An Analysis of Globalization Forces in the Wine Industry. J. Glob. Mark. 2008, 21, 33–47. [Google Scholar] [CrossRef]
- Di Blasi, C.; Tanzi, V.; Lanzetta, M. A study on the production of agricultural residues in Italy. Biomass Bioenergy 1997, 12, 321–331. [Google Scholar] [CrossRef]
- Azuara, M.; Sáiz, E.; Manso, J.A.; García-Ramos, F.J.; Manyà, J.J. Study on the effects of using a carbon dioxide atmosphere on the properties of vine shoots-derived biochar. J. Anal. Appl. Pyrolysis 2017, 124, 719–725. [Google Scholar] [CrossRef]
- Mendívil, M.A.; Muñoz, P.; Morales, M.P.; Juárez, M.C.; García-Escudero, E. Chemical characterization of pruned vine shoots from la Rioja (Spain) for obtaining solid bio-fuels. J. Renew. Sustain. Energy 2013, 5. [Google Scholar] [CrossRef]
- Jiménez, L.; Angulo, V.; Ramos, E.; De La Torre, M.J.; Ferrer, J.L. Comparison of various pulping processes for producing pulp from vine shoots. Ind. Crops Prod. 2006, 23, 122–130. [Google Scholar] [CrossRef]
- Delgado-Torre, M.P.; Ferreiro-Vera, C.; Priego-Capote, F.; Pérez-Juan, P.M.; Luque De Castro, M.D. Comparison of accelerated methods for the extraction of phenolic compounds from different vine-shoot cultivars. J. Agric. Food Chem. 2012, 60, 3051–3060. [Google Scholar] [CrossRef]
- Fernández-Puratich, H.; Hernández, D.; Tenreiro, C. Analysis of energetic performance of vine biomass residues as an alternative fuel for Chilean wine industry. Renew. Energy 2015, 83, 1260–1267. [Google Scholar] [CrossRef]
- Duca, D.; Toscano, G.; Pizzi, A.; Rossini, G.; Fabrizi, S.; Lucesoli, G.; Servili, A.; Mancini, V.; Romanazzi, G.; Mengarelli, C. Evaluation of the characteristics of vineyard pruning residues for energy applications: Effect of different copper-based treatments. J. Agric. Eng. 2016, 47, 22–27. [Google Scholar] [CrossRef]
- Devesa-Rey, R.; Vecino, X.; Varela-Alende, J.L.; Barral, M.T.; Cruz, J.M.; Moldes, A.B. Valorization of winery waste vs. the costs of not recycling. Waste Manag. 2011, 31, 2327–2335. [Google Scholar] [CrossRef] [PubMed]
- Nabais, J.M.V.; Laginhas, C.; Carrott, P.J.M.; Carrott, M.M.L.R. Thermal conversion of a novel biomass agricultural residue (vine shoots) into activated carbon using activation with CO2. J. Anal. Appl. Pyrolysis 2010, 87, 8–13. [Google Scholar] [CrossRef]
- Barroso-Bogeat, A.; Alexandre-Franco, M.; Fernández-González, C.; Macías-García, A.; Gómez-Serrano, V. Temperature dependence of the electrical conductivity of activated carbons prepared from vine shoots by physical and chemical activation methods. Microporous Mesoporous Mater. 2015, 209, 90–98. [Google Scholar] [CrossRef]
- Corcho-Corral, B.; Olivares-Marín, M.; Valdes-Sánchez, E.; Fernández-González, C.; Macías-García, A.; Gómez-Serrano, V. Development of activated carbon using vine shoots (Vitis Vinifera) and its use for wine treatment. J. Agric. Food Chem. 2005, 53, 644–650. [Google Scholar] [CrossRef]
- Manyà, J.J.; González, B.; Azuara, M.; Arner, G. Ultra-microporous adsorbents prepared from vine shoots-derived biochar with high CO2 uptake and CO2/N2 selectivity. Chem. Eng. J. 2018, 345, 631–639. [Google Scholar] [CrossRef]
- Pala, M.; Kantarli, I.C.; Buyukisik, H.B.; Yanik, J. Hydrothermal carbonization and torrefaction of grape pomace: A comparative evaluation. Bioresour. Technol. 2014, 161, 255–262. [Google Scholar] [CrossRef]
- Basso, D.; Weiss-Hortala, E.; Patuzzi, F.; Baratieri, M.; Fiori, L. In Deep Analysis on the Behavior of Grape Marc Constituents during Hydrothermal Carbonization. Energies 2018, 11, 1379. [Google Scholar] [CrossRef]
- Zhang, B.; Heidari, M.; Regmi, B.; Salaudeen, S.; Arku, P.; Thimmannagari, M.; Dutta, A. Hydrothermal carbonization of fruit wastes: A promising technique for generating hydrochar. Energies 2018, 11, 2022. [Google Scholar] [CrossRef]
- Palomares, V.; Blas, M.; Serras, P.; Iturrondobeitia, A.; Peña, A.; Lopez-Urionabarrenechea, A.; Lezama, L.; Rojo, T. Waste Biomass as in Situ Carbon Source for Sodium Vanadium Fluorophosphate/C Cathodes for Na-Ion Batteries. ACS Sustain. Chem. Eng. 2018, 6, 16386–16398. [Google Scholar] [CrossRef]
- Linstrom, P.J.; Mallard, W.G. NIST Chemistry WebBook, NIST Standard Reference Database Number 69; National Institute of Standards and Technology: Gaithersburg, MD, USA, 2018. [Google Scholar]
- Szargut, J. Appendix 1. Standard Chemical Exergy. Thermodyn. Destr. Resour. 2011. [Google Scholar] [CrossRef]
- Videgain-Marco, M.; Marco-Montori, P.; Martí-Dalmau, C.; del Carmen Jaizme-Vega, M.; Manyà-Cervelló, J.J.; García-Ramos, F.J. Effects of biochar application in a sorghum crop under greenhouse conditions: Growth parameters and physicochemical fertility. Agronomy 2020, 10, 104. [Google Scholar] [CrossRef]
- Marsh, H.; Rodríguez-Reinoso, F. CHAPTER 5—Activation Processes (Thermal or Physical). In Activated Carbon; Marsh, H., Rodríguez-Reinoso, F., Eds.; Elsevier Science Ltd: Oxford, UK, 2006; pp. 243–321. ISBN 978-0-08-044463-5. [Google Scholar]
- Ghouma, I.; Jeguirim, M.; Dorge, S.; Limousy, L.; Matei Ghimbeu, C.; Ouederni, A. Activated carbon prepared by physical activation of olive stones for the removal of NO2 at ambient temperature. Comptes Rendus Chim. 2015, 18, 63–74. [Google Scholar] [CrossRef]
- Funke, A.; Ziegler, F. Heat of reaction measurements for hydrothermal carbonization of biomass. Bioresour. Technol. 2011, 102, 7595–7598. [Google Scholar] [CrossRef]
- Pecchi, M.; Patuzzi, F.; Benedetti, V.; Di Maggio, R.; Baratieri, M. Thermodynamics of hydrothermal carbonization: Assessment of the heat release profile and process enthalpy change. Fuel Process. Technol. 2020, 197, 106206. [Google Scholar] [CrossRef]
- Radmanović, K.; Đukić, I.; Pervan, S. Specific Heat Capacity of Wood. Drv. Ind. 2014, 65, 151–157. [Google Scholar] [CrossRef]
- Ptasinski, K.J. Efficiency of Biomass Energy: An Exergy Approach to Biofuels, Power and Biorefineries; John Wiley & Sons: Hoboken, NJ, USA, 2016; ISBN 978-1-119-11816-9. [Google Scholar]
- Seider, W.D.; Seader, J.D.; Lewin, D.R.; Wigado, S. Product and Process Design Principles: Synthesis, Analysis and Evaluation, 3rd ed.; John Wiley & Sons: Hoboken, NJ, USA, 2010. [Google Scholar]
- U.S. Department of Energy Combined Heat and Power Technology Fact Sheet Series. Available online: https://www.energy.gov/sites/prod/files/2016/09/f33/CHP-SteamTurbine.pdf (accessed on 20 April 2020).
- Mignard, D. Correlating the chemical engineering plant cost index with macro-economic indicators. Chem. Eng. Res. Des. 2014, 92, 285–294. [Google Scholar] [CrossRef]
- Peters, M.S.; Timmerhaus, M.D.; West, R. Plant Design and Economics for Chemical Engineers; McGraw-Hill: New York, NY, USA, 2003. [Google Scholar]
- De Dietrich. Products Portfolio—Glass-Lined Technology & Other Materials; De Dietrich: Zinswiller, France, 2014. [Google Scholar]
- Gvetadze, S.; Kraemer-Eis, H.; Lang, F.; Prencipe, D.; Signore, S.; Torfs, W. EIF SME Access to Finance Index; Working Paper No. 2018/47; European Investment Fund: Luxembourg, 2018. [Google Scholar]
- Fernández, J. Los residuos de las agroindustrias como biocombustibles sólidos (I). Vida Rural 2006, 233, 14–18. [Google Scholar]
- Eurostat. Electricity Price Statistics Tables and Graphs; Eurostat: Luxembourg, 2019; pp. 1–12. [Google Scholar]
- Spinelli, R.; Magagnotti, N.; Nati, C. Harvesting vineyard pruning residues for energy use. Biosyst. Eng. 2010, 105, 316–322. [Google Scholar] [CrossRef]
- Stemann, J.; Putschew, A.; Ziegler, F. Hydrothermal carbonization: Process water characterization and effects of water recirculation. Bioresour. Technol. 2013, 143, 139–146. [Google Scholar] [CrossRef] [PubMed]
- Zanella, O.; Tessaro, I.C.; Féris, L.A. Desorption- and decomposition-based techniques for the regeneration of activated carbon. Chem. Eng. Technol. 2014, 37, 1447–1459. [Google Scholar] [CrossRef]
- Akbari, M.; Oyedun, A.O.; Kumar, A. Techno-economic assessment of wet and dry torrefaction of biomass feedstock. Energy 2020, 207, 118287. [Google Scholar] [CrossRef]


Publisher’s Note: MDPI stays neutral with regard to jurisdictional claims in published maps and institutional affiliations. |
© 2020 by the authors. Licensee MDPI, Basel, Switzerland. This article is an open access article distributed under the terms and conditions of the Creative Commons Attribution (CC BY) license (http://creativecommons.org/licenses/by/4.0/).