The Possibility Analysis of Adapting a Public Building to the Standard of a Building with a Zero Energy Balance


Abstract
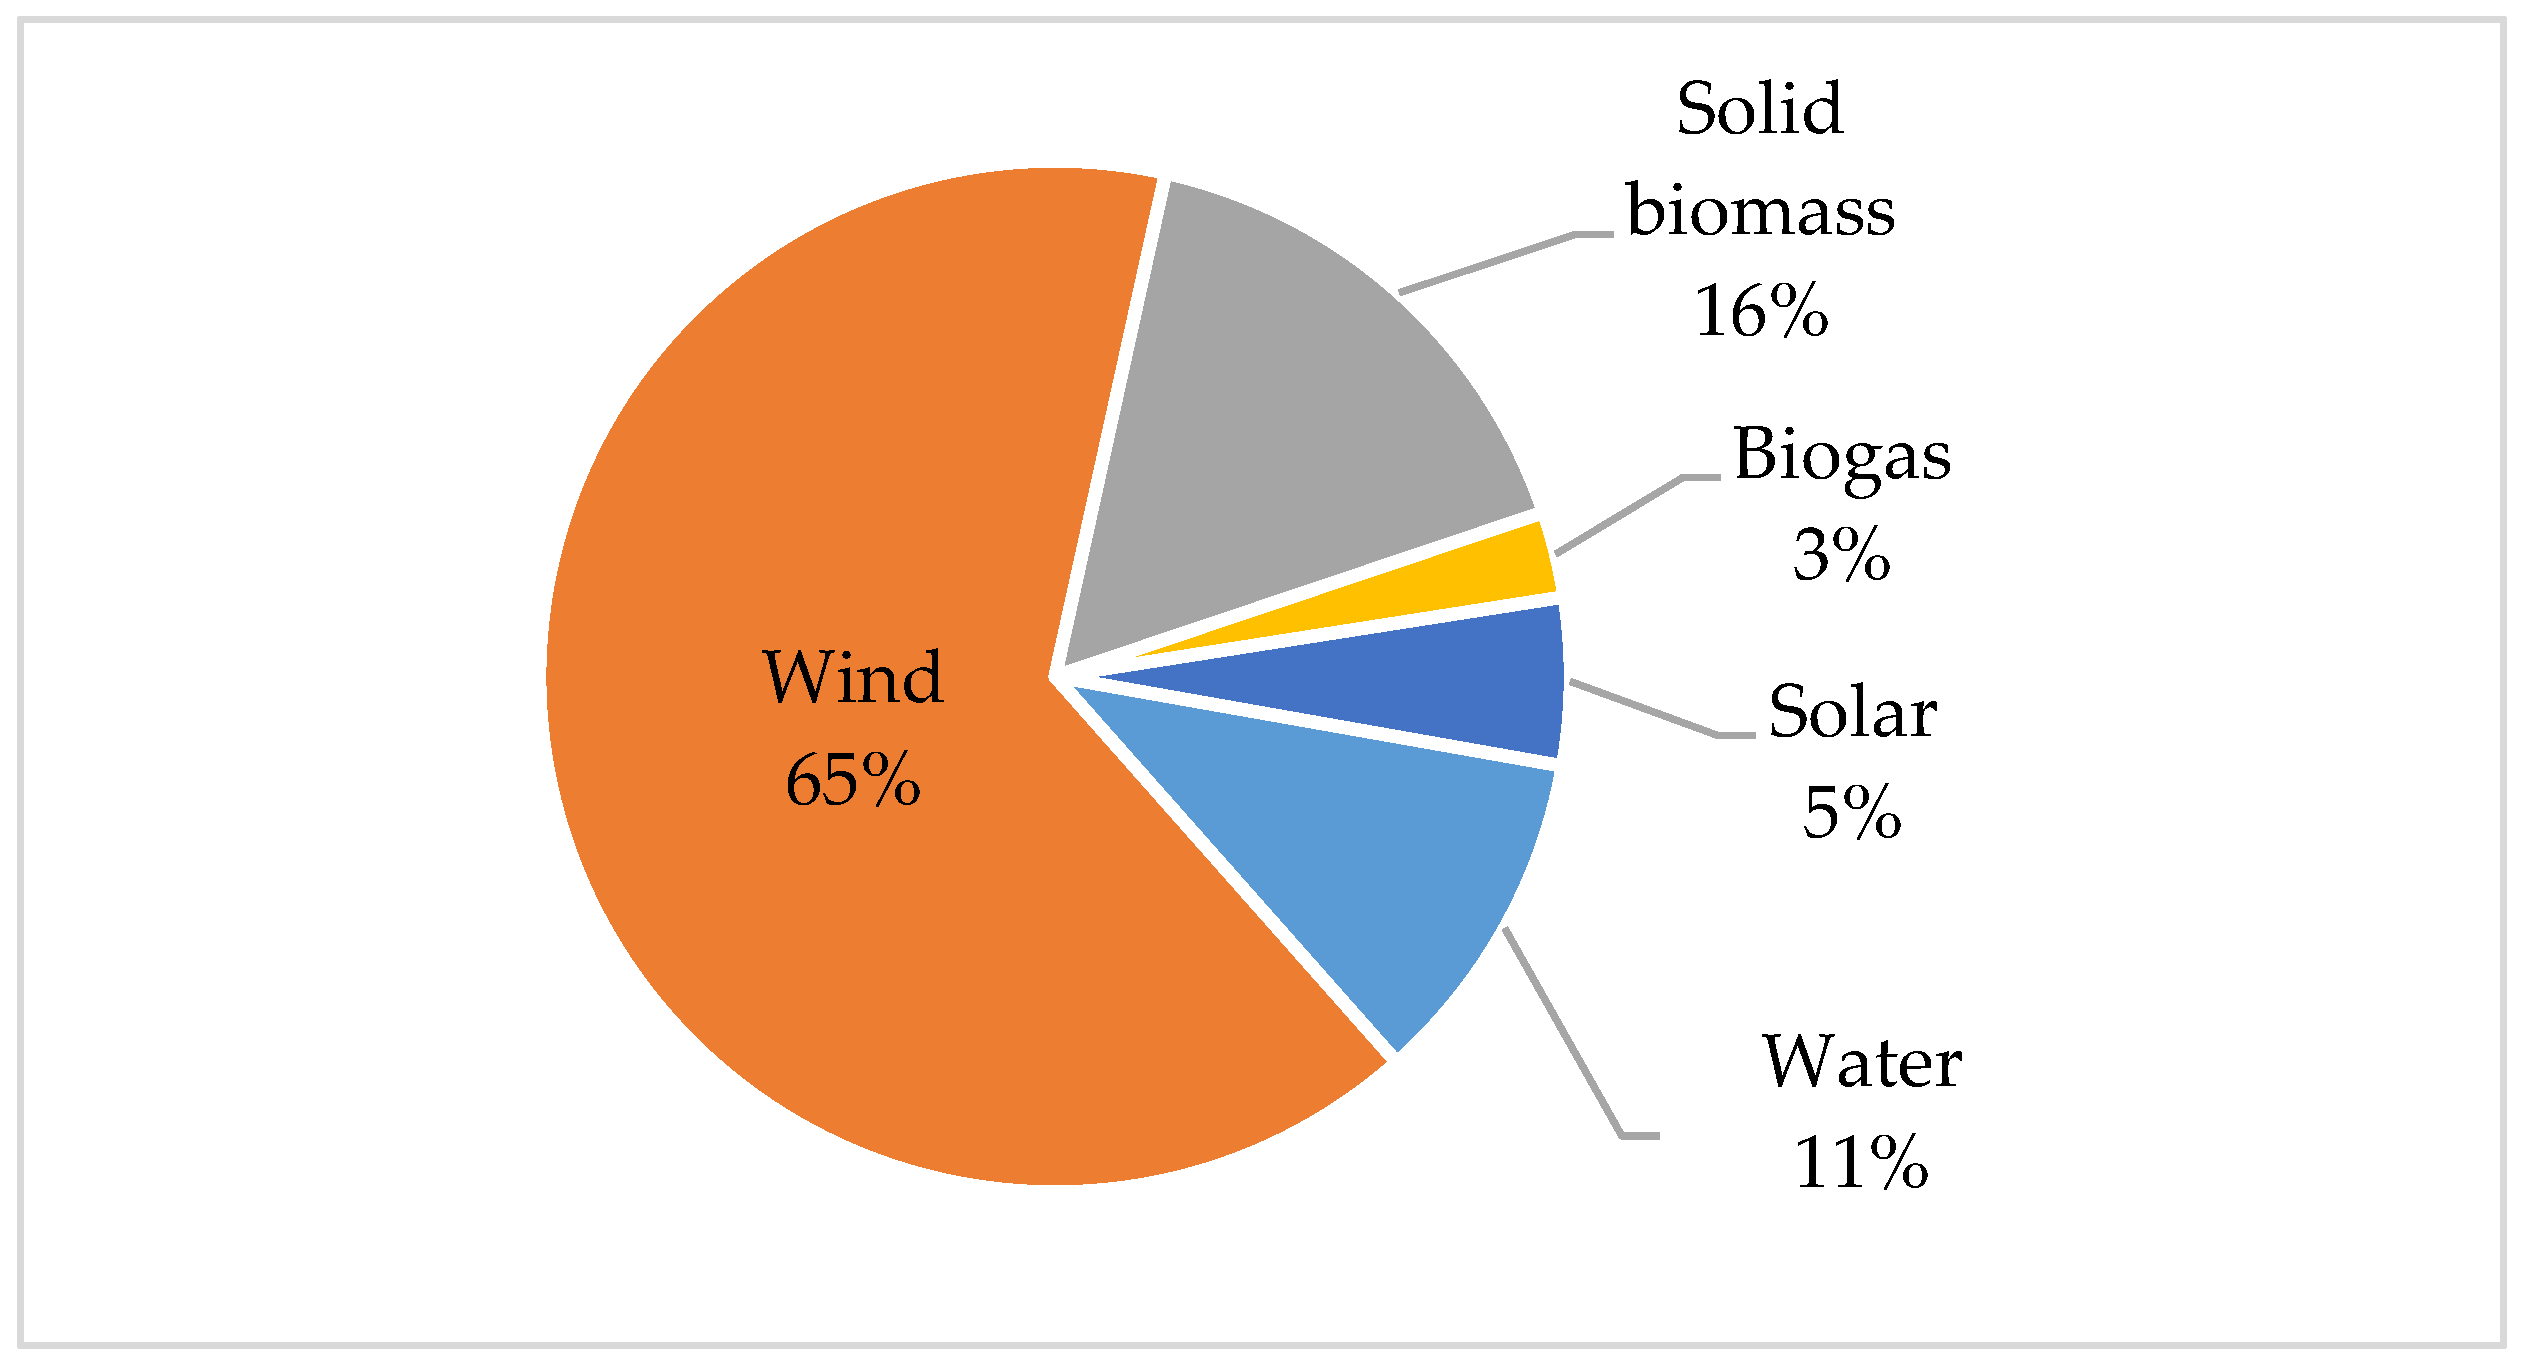
1. Introduction
- long-term renovation strategy—commits the Member States to “[…] establish a long-term strategy to promote the renovation of existing public and private building stock to achieve by 2050 their high energy efficiency equivalent to the nZEB standard”;
- electromobility—promoting electric vehicles, mainly charged with surplus electricity from renewable sources;
- technical building systems, operation of smart grids—the Directive “[…] extends the definition of technical building systems to include automation and control systems in the building, on-site electricity generation systems and systems using energy from renewable sources” [3]. Additionally, the new version of the Directive mitigates the obligation to inspect heating and air-conditioning systems regularly;
- methodology for determining the energy performance of buildings—recommends that national methods for determining the energy performance of buildings be adapted to the set of European standards introduced together with the Directive.
2. Literature Review
3. Materials and Methods
4. Proposed Energy Sources
4.1. Ground Source Heat Pump
- —the total amount of heat extracted by the heat pump for heating purposes during the year;
- —the total amount of electricity consumed by the heat pump during the year:
4.2. Photovoltaic
4.3. Solar Collectors
- energy content of the hot water (MJ/day),
- average solar irradiance in the year (kWh/m2/day),
- efficiency of the solar collector (-).
- —volume of hot water delivered at a specified temperature, (m3/day),
- —a specified temperature of hot water at the tapping point, for a building of over 1000 m2, ,
- —temperature of the inlet water, .
- —unit requirement, water consumption for schools without a canteen per person [41],
- —number of units to be taken into account, for 1400 building users, .
- correction factor determined by the experiment (-),
- optical characteristics of the collector (-),
- overall heat loss coefficient of the collector (W/m2K),
- inlet temperature of the working fluid (°C),
- ambient air temperature (°C),
- global solar irradiance (W/m2).
- zero-loss collector efficiency, ,
- heat loss coefficient (W/m2K),
- temperature dependence of the heat loss coefficient (W/m2K).
- absorber surface, .
5. Proposal for System Modification
6. Conclusions
Author Contributions
Funding
Conflicts of Interest
References
- Energy Efficiency in Buildings, European Commission. 2020. Available online: https://ec.europa.eu/info/news/focus-energy-efficiency-buildings-2020-feb-17_en (accessed on 15 June 2020).
- Directive 2018/844 of the European Parliament and of the Council of 30 May 2018 Amending Directive 2010/31/EU on the Energy Performance of Buildings and DIRECTIVE 2012/27/EU on Energy Efficiency, L 156/75. Available online: https://eur-lex.europa.eu/eli/dir/2018/844/oj (accessed on 15 June 2020).
- Witczak, K. Nowa dyrektywa EPBD dotycząca efektywności energetycznej budynków. Mater. Bud. 2019, 1, 4–6. [Google Scholar]
- Directive 2010/31/EU of the European Parliament and of the Council of 19 May 2010 on the Energy Performance of Buildings, L 153/13. Available online: https://eur-lex.europa.eu/legal-content/EN/TXT/?uri=celex%3A32010L0031 (accessed on 23 June 2020).
- Rynek Energii Elektrycznej. Available online: https://rynek-energii-elektrycznej.cire.pl (accessed on 12 September 2020).
- Directive 2009/28/EC of the European Parliament and of the Council of 23 April 2009 on the Promotion of the Use of Energy from Renewable Sources and Amending and Subsequently Repealing Directives 2001/77/EC and 2003/30/EC, L 140/16. Available online: https://eur-lex.europa.eu/legal-content/EN/ALL/?uri=CELEX%3A32009L0028 (accessed on 15 September 2020).
- Energy Regulatory Office. Available online: https://www.ure.gov.pl/ (accessed on 12 September 2020).
- Ministerstwo Aktywów Państwowych. Krajowy Plan na Rzecz Energii i Klimatu na Lata 2021–2030; The National Energy and Climate Plan; Ministerstwo Aktywów Państwowych: Warszawa, Grudzień, 2019. [Google Scholar]
- Valenzuela, P.; Lima, D.A.; Granville, S. A risk-constrained Energy Reallocation Mechanism for renewable sources with a Marginal Benefit approach. Electr. Power Syst. Res. 2018, 158, 297–305. [Google Scholar] [CrossRef]
- Krawczyk, D.A.; Żukowski, M.; Rodero, A. Efficiency of a solar collector system for the public building depending on its location. Environ. Sci. Pollut. Res. 2020, 27, 101–110. [Google Scholar] [CrossRef] [PubMed]
- Gan, G.; Xiang, Y. Experimental investigation of a photovoltaic thermal collector with energy storage for power generation, building heating and natural ventilation. Renew. Energy 2020, 150, 12–22. [Google Scholar] [CrossRef]
- Marinho de Castro, M.M.; Sharpe, T.; Kelly, N.; Allison, J. A taxonomy of fabric integrated thermal energy storage: A review of storage types and building locations. Future Cities Environ. 2018, 4, 5. [Google Scholar] [CrossRef]
- Özrahat, E.; Ünalan, S. Thermal performance of a concrete column as a sensible thermal energy storage medium and a heater. Renew. Energy 2017, 111, 561–579. [Google Scholar] [CrossRef]
- Finck, C.; Li, R.; Kramer, R.; Zeiler, W. Quantifying demand flexibility of power-to-heat and thermal energy storage in the control of building heating systems. Appl. Energy 2018, 209, 409–425. [Google Scholar] [CrossRef]
- Rosato, A.; Ciervo, A.; Ciampi, G.; Scorpio, M.; Guarino, F.; Sibilio, S. Impact of solar field design and back-up technology on dynamic performance of a solar hybrid heating network integrated with a seasonal borehole thermal energy storage serving a small-scale residential district including plug-in electric vehicles. Renew. Energy 2020, 154, 684–703. [Google Scholar] [CrossRef]
- Narula, K.; De Oliveira Filho, F.; Chambers, J.; Patel, M.K. Simulation and comparative assessment of heating systems with tank thermal energy storage—A Swiss case study. J. Energy Storage 2020, 32, 101810. [Google Scholar] [CrossRef]
- Sanmamed, V.P.; Caetano, N.S.; Felgueiras, C. Ground-source energy systems for building heating and cooling—A case study. Energy Rep. 2020, 6, 353–357. [Google Scholar] [CrossRef]
- Zhu, L.; Chen, S.; Yang, Y.; Tian, W.; Sun, Y.; Lyu, M. Global sensitivity analysis on borehole thermal energy storage performances under intermittent operation mode in the first charging phase. Renew. Energy 2019, 143, 183–198. [Google Scholar] [CrossRef]
- Aldubyan, M.; Chiasson, A. Thermal study of hybrid photovoltaic-thermal (PVT) solar collectors combined with borehole thermal energy storage systems. Energy Procedia 2017, 141, 102–108. [Google Scholar] [CrossRef]
- Paiho, S.; Hoang, H.; Hukkalainen, M. Energy and emission analyses of solar assisted local energy solutions with seasonal heat storage in a Finnish case district. Renew. Energy 2017, 107, 147–155. [Google Scholar] [CrossRef]
- Panno, D.; Buscemi, A.; Beccali, M.; Chiaruzzi, C.; Cipriani, G.; Ciulla, G.; Di Dio, V.; Lo Brano, V.; Bonomolo, M. A solar assisted seasonal borehole thermal energy system for a non-residential building in the Mediterranean area. Sol. Energy 2019, 192, 120–132. [Google Scholar] [CrossRef]
- Morofsky, E.L. History of thermal energy storage. In Thermal Energy Storage for Sustainable Energy Consumption. Fundamentals, Case Studies and Design; Paksoy, H.O., Ed.; Springer: Berlin/Heidelberg, Germany, 2005. [Google Scholar]
- Morofsky, E.L.; Cataford, R.; Mirza, C. Monitoring Energy Consumption at the Canada Centre ATES Site. In Proceedings of the Intersociety Energy Conversion Engineering Conference, San Diego, CA, USA, 3 August 1992; SAE Technical Paper. p. 929198. [Google Scholar] [CrossRef]
- Mirza, C. Case History of Aquifer Thermal Energy Storage (ATES) (1993). International Conference on Case Histories in Geotechnical Engineering. 3. Available online: https://scholarsmine.mst.edu/icchge/3icchge/3icchge-session13/3 (accessed on 23 October 2020).
- Midttomme, K.; Kocbach, J.; Ramstad, R.K.; Henne, I. Aquifer thermal energy storage (ATES). Tech. Poszuk. Geol. Geoterm. Zrównoważony Rozw. 2017, 56, 203–214. [Google Scholar]
- Giordano, N.; Comina, C.; Mandrone, G.; Cagni, A. Borehole thermal energy storage (BTES). First results from the injection phase of a living lab in Torino (NW Italy). Renew. Energy 2016, 86, 993–1008. [Google Scholar] [CrossRef]
- Gauthier, C.; Lacroix, M.; Bernie, H. Numerical simulation of soil heat exchanger-storage systems for greenhouses. Sol. Energy 1997, 60, 333–346. [Google Scholar] [CrossRef]
- Lehmann, B.; Dorer, V.; Koschenz, M. Application range of thermally activated building systems tabs. Energy Build. 2007, 39, 593–598. [Google Scholar] [CrossRef]
- Kizilkan, O.; Dincer, I. Exergy analysis of borehole thermal energy storage system for building cooling applications. Energy Build. 2012, 49, 568–574. [Google Scholar] [CrossRef]
- Zhang, L.; Xu, P.; Mao, J.; Tang, X.; Li, Z.; Shi, J. A low cost seasonal solar soil heat storage system for greenhouse heating: Design and pilot study. Appl. Energy 2015, 156, 213–222. [Google Scholar] [CrossRef]
- Lanahan, M.; Tabares-Velasco, P.C. Seasonal Thermal-Energy Storage: A Critical Review on BTES Systems, Modeling, and System Design for Higher System Efficiency. Energies 2017, 10, 743. [Google Scholar] [CrossRef]
- Welsch, B.; Göllner-Völker, L.; Schulte, D.; Bär, K.; Sass, I.; Schebek, L. Environmental and economic assessment of borehole thermal energy storage in district heating systems. Appl. Energy 2018, 216, 73–90. [Google Scholar] [CrossRef]
- Saitoh, T.S.; Yamaguchi, A. Efficient Borehole Energy Storage System for High-Story Buildings. IECEC 96. In Proceedings of the 31st Intersociety Energy Conversion Engineering Conference, Washington, DC, USA, 11–16 August 1996. [Google Scholar] [CrossRef]
- Joint Research Centre. The European Commission’s In-House Science Service, PVGIS Internet Tools for the Assessment of Photovoltaic Solar Energy Systems. Available online: https://ec.europa.eu/jrc/sites/jrcsh/files/20130626-esti-pvgis.pdf (accessed on 23 June 2020).
- Huld, T.A.; Suri, M.; Kenny, R.P.; Dunlop, E.D. Estimating PV Performance over Large Geographical Regions. In Proceedings of the Conference Record of the Thirty-first IEEE Photovoltaic Specialists Conference, Lake Buena Vista, FL, USA, 3–7 January 2005; pp. 1679–1682. [Google Scholar]
- PN-EN 14825:2019-03. Klimatyzatory, Agregaty do Chłodzenia Cieczy Oraz Pompy Ciepła ze Sprężarkami Napędzanymi Elektrycznie, do Ogrzewania i Chłodzenia Pomieszczeń—Badanie i Ocena w Warunkach Częściowego Obciążenia Oraz Obliczanie Wydajności Sezonowej; The Polish Standardization Committee: Warsaw, Poland, 2019. [Google Scholar]
- EN 14511-1:2018. Air Conditioners, Liquid Chilling Packages and Heat Pumps with Electrically Driven Compressors for Space Heating and Cooling; European Committee for Standardization: Brussels, Belgium, 2018. [Google Scholar]
- VDI 4650-1:2016. Calculation of the Seasonal Coefficient of Performance of Heat Pumps—Electric Heat Pumps for Space Heating and Domestic Hot Water; Verlag des Vereins Deutscher Ingenieure: Düsseldorf, Germany, 2016. [Google Scholar]
- Ustawa z dnia 19 lipca 2019 r. o zmianie ustawy o odnawialnych źródłach energii oraz niektórych innych ustaw, Nowelizacja Ustawy Dz. U. 2015 Poz. 478 z dnia 20 lutego 2015 r. o odnawialnych źródłach energii. Available online: http://isap.sejm.gov.pl/isap.nsf/download.xsp/WDU20190001524/T/D20191524L.pdf (accessed on 27 April 2020).
- prEN 15316-3-1:2006. Heating Systems in Buildings—Method for Calculation of System Energy Requirements and System Efficiencies—Part 3-1 Domestic Hot Water Systems, Characterisation of Needs (Tapping Requirements); Prepared by Technical Committee CEN/TC228; European Committee for Standardization: Brussels, Belgium, 2006. [Google Scholar]
- Nor Zużycia Wody w Polsce (Standards of Water Consumption in Poland), Rozporządzenie Ministra Infrastruktury z Dnia 14 Stycznia 2002 r. w Sprawie Określenia Przeciętnych Norm Zużycia Wody. (Dz. U. Nr 8, poz. 70). Available online: http://isap.sejm.gov.pl/isap.nsf/download.xsp/WDU20020080070/O/D20020070.pdf (accessed on 25 June 2020).
- Kraczyk, D.A.; Carlos, J.; Haro, A.; David, M.; Kęstutis, B.J.; Milius, P.; Serrano, A.R.; Teleszewski, T.J.; Urbonienė, V.; Żukowski, M. Buildings 2020: Energy Sources; Printing House of Bialystok University of Technology: Bialystok, Spain, 2019. [Google Scholar]
- BTE—Borehole Thermal Energy Storage. Available online: https://underground-energy.com/our-technology/btes/#how-does-btes-work (accessed on 12 May 2020).
- Kalaielvam, S.; Parameshwaran, R. Thermal Energy Storage Technologies for Sustainability; Elsevier: Amsterdam, The Netherlands, 2014. [Google Scholar] [CrossRef]
- Skaphagen, H.; Banks, D.; Frenghstad, B.; Gether, H. Design considerations for borehole thermal energy storage (BTES): A review with emphasis on convective heat transfer. Geofluids 2019, 4961781. [Google Scholar] [CrossRef]
- Nils, B.; Døvre, J. Seasonal Energy Storage for District Heating Applications, Including Simulation and Analysis of Borehole Thermal Energy Storage Systems. Master’s Thesis, Norges Arktiske Universitet, Tromsø, Norway, June 2018. [Google Scholar]


| Author, Year | Type of Building | System | Research Area |
|---|---|---|---|
| Gan and Xiang, 2020 [11] | office building | photovoltaic thermal system integrated with a phase change material (PCM) as a thermal storage | increase the PV electrical efficiency |
| Marinho de Castro et al., 2018 [12] | single building | fabric integrated thermal storage | interaction between the storage of thermal energy and the thermal zones of buildings, the methods and medium used to store thermal energy, and the storage temperature |
| Özrahat and Ünalan, 2017 [13] | multi-storey building | concrete column used as a sensible thermal energy storage medium | heater and thermal energy storage medium in the building structure |
| Finck et al., 2018 [14] | small-scale office building | heat pump, electric heater, air-blown heat exchanger, and a thermal energy storage tank | demand flexibility for tanks of thermal energy storage: water tank, phase change material (PCM) tank, and thermochemical material (TCM) tank |
| Rosato et al., 2020 [15] | small-scale district consisting of single-family houses | solar network integrated with a seasonal borehole thermal energy storage | primary energy consumption, the equivalent global carbon dioxide emissions, and operating costs |
| Narula et al., 2020 [16] | multi-family households | Solar collectors, tank thermal energy storage (TTES) | economic, environmental, energy, and technical parameters |
| Sanmamed et al., 2020 [17] | warehouse | PV-T solar panels, air, heat pumps and geothermal wells | energy efficiency, energy flexibility |
| Zhu et al., 2019 [18] | group of single-family houses | borehole thermal energy storage (BTES) | relationship between different kinds of input parameters (temperature, depth, spacing, and soil thermal conductivity) and four output indicators (values of injected heat, energy density, storage efficiency and percentage of heat loss) |
| Aldubyan and Chiasson, 2017 [19] | small office building | photovoltaic-thermal (PVT) system coupled with borehole thermal energy storage (BTES) | comparison between (i) a PVT system coupled to a BTES with no ground-coupled heat pump (GCHP), and (ii) a PVT system coupled to a BTES with a GCHP |
| Paiho et al., 2017 [20] | residential area | solar energy solutions and seasonal thermal energy storages (BTES or tank storage) | options for heat and power generation based on local energy systems and utilising seasonal thermal energy storage |
| Panno et al., 2019 [21] | school buildings | heat pumps, solar collector, thermal energy storages (BTES) | analysis of energy and costs savings |
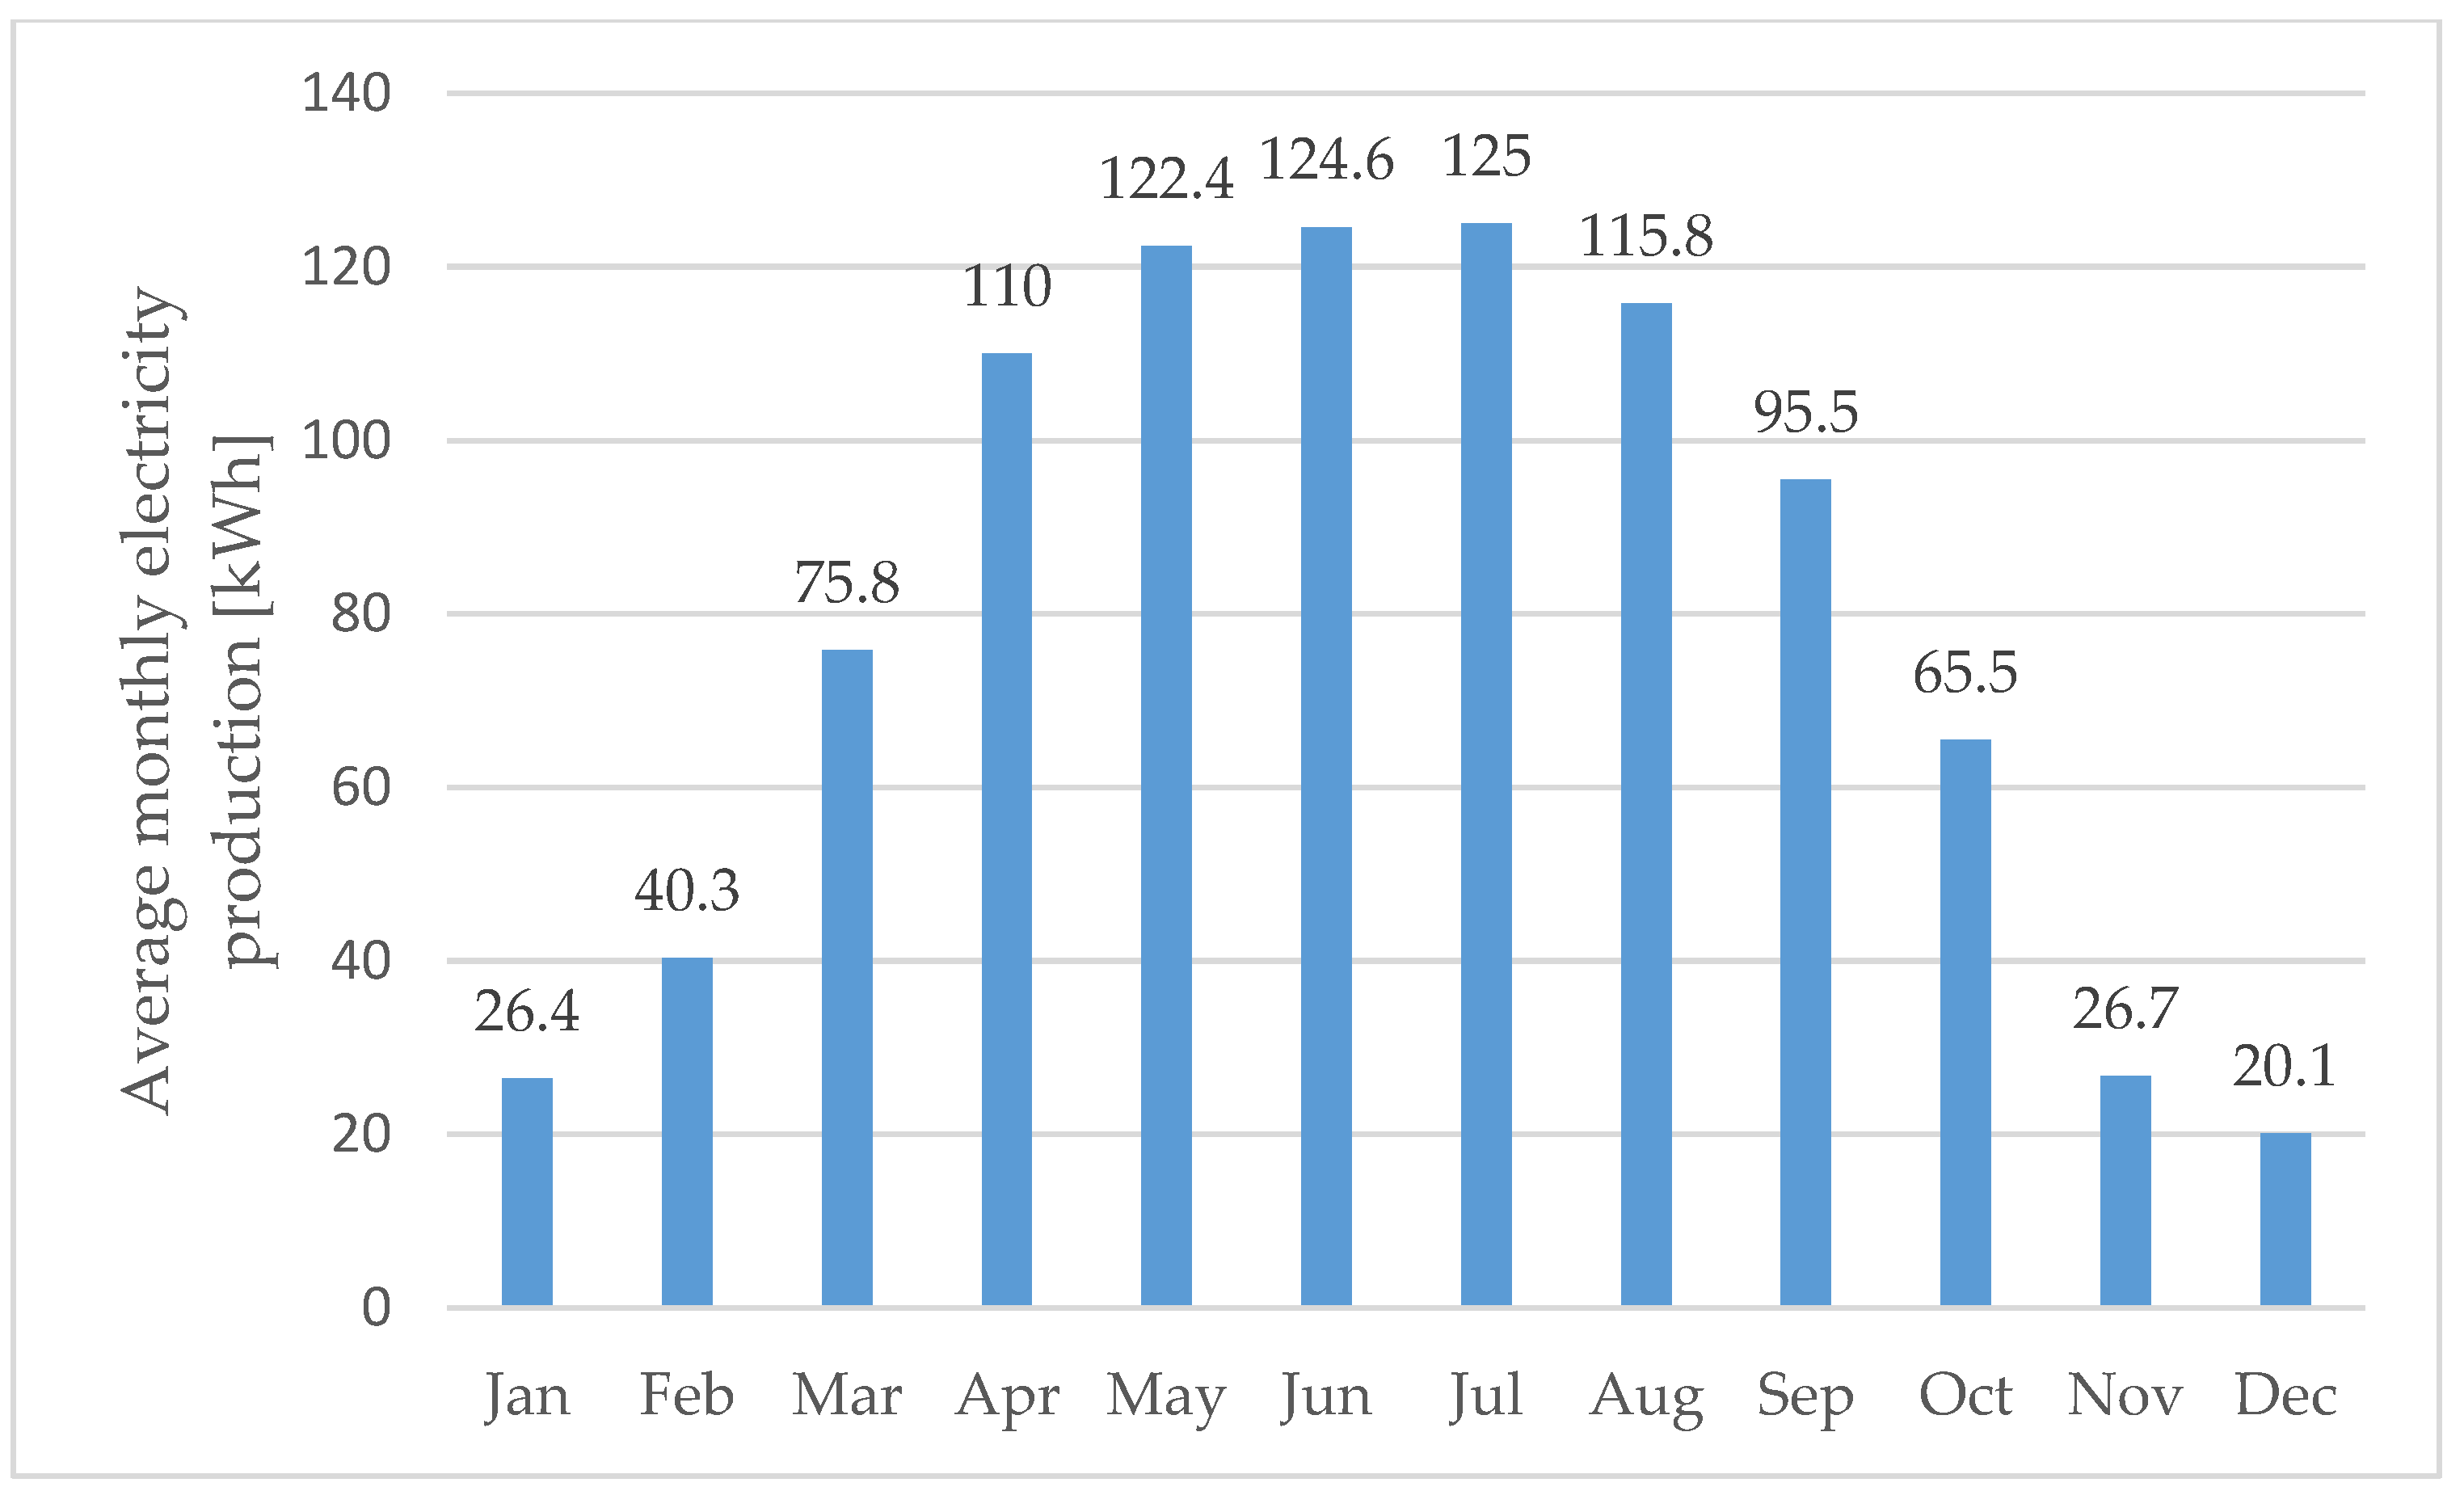
| Month | Average Monthly Electricity Production [kWh/kWp] | Electricity Generated [kWh] | Electricity Demand for the Building [kWh] | The Energy Drawn by the Heat Pump [kWh] | Total Demand [kWh] | Coverage of Demand | Electricity Shortage (−) /Overproduction (+) [kWh] |
|---|---|---|---|---|---|---|---|
| Jan | 26.4 | 4648 | 6118 | 25,535 | 31,653 | 15% | −27,005 |
| Feb | 40.3 | 7095 | 6906 | 17,788 | 24,694 | 29% | −17,599 |
| Mar | 75.8 | 13,345 | 7062 | 12,206 | 19,268 | 69% | −5923 |
| Apr | 110.0 | 19,366 | 4564 | 6188 | 10,753 | 180% | 8613 |
| May | 122.4 | 21,549 | 6268 | 0 | 6268 | 344% | 15,281 |
| Jun | 124.6 | 21,936 | 4532 | 0 | 4532 | 484% | 17,403 |
| Jul | 125.0 | 22,006 | 2039 | 0 | 2039 | 1079% | 19,967 |
| Aug | 115.8 | 20,387 | 2349 | 0 | 2349 | 868% | 18,038 |
| Sep | 95.5 | 16,813 | 5917 | 0 | 5917 | 284% | 10,895 |
| Oct | 65.5 | 11,531 | 7278 | 5810 | 13,088 | 88% | −1557 |
| Nov | 26.7 | 4701 | 7402 | 12,343 | 19,745 | 24% | −15,045 |
| Dec | 20.1 | 3539 | 6927 | 19,480 | 26,407 | 13% | −22,869 |
| total: 166,713 | total: 200 |
| Average Solar Irradiance in the Year | Specified Temperature of Hot Water at Tapping Point | Temperature of the Inlet Water | Water Consumption Per Person | Building Users |
|---|---|---|---|---|
| Surface | Absorber Surface | Zero-Loss Collector Efficiency | Heat Loss Coefficient | Temperature Dependence of the Heat Loss Coefficient |
|---|---|---|---|---|
| , |
| The Baseline | The Result | |||||
|---|---|---|---|---|---|---|
| Electricity [kWh] | District Thermal Energy for Heating [kWh] | District Thermal Energy for DHW Preparation [GJ] | Electricity [kWh] | Thermal Energy for Heating [kWh] | Thermal Energy for DHW Preparation | |
| Demand | 67,362 | 1774.0 GJ = 492,776.2 kWh | 946.5 | 166,713 | 492,776.2 | 946.5 GJ |
| Generation | - | - | - | 166,916 | 492,776.2 | 1441.7 GJ |
| Balance | −67,362 | −492,776.2 | −946.5 | 203 | 0 | 495.2 GJ = 137,557 kWh |
| Borehole Diameter | Length of Boreholes | Spacing | Thermal Conductivity | Average Thermal Capacity | Min/Max Input Temperature | Energy Storage Cost |
|---|---|---|---|---|---|---|
| 100–150 mm | 30–150 m | 2–4 m | 2–4 W/mK | 20–30 W/m | −5/+90 °C | 50–80 €/m |
| Material | Thermal Conductivity (W/mK) | Thermal Volume Capacity | Density (t/m3) | |
|---|---|---|---|---|
| (MJ/m3K) | (kWh/m3K) | |||
| dry clay | 0.4–1.0 | 1.5–1.6 | 0.42–0.44 | 1.8–2.0 |
| wet clay | 1.1–3.1 | 2.0–2.8 | 0.56–0.78 | 2.0–2.2 |
| dry sand | 0.3–0.9 | 1.3–1.6 | 0.36–0.44 | 1.8–2.2 |
| wet sand | 2.0–3.0 | 2.2–2.8 | 0.61–0.78 | 1.9–2.3 |
| dry gravel | 0.4–0.9 | 1.3–1.6 | 0.36–0.44 | 1.8–2.2 |
| wet gravel | 1.6–2.5 | 2.2–2.6 | 0.61–0.72 | 1.9–2.3 |
| silt | 1.1–2.9 | 1.5–2.5 | 0.42–0.70 | 1.8–2.3 |
| sandstone | 1.9–4.6 | 1.8–2.6 | 0.50–0.72 | 2.2–2.7 |
| granite | 2.1–4.1 | 2.1–3.0 | 0.58–0.83 | 2.4–3.0 |
| bentonite | 0.5–0.8 | 3.9 | 1.08 | - |
| water | 0.59 | 4.15 | 1.15 | 1.0 |
| Without BTES | With BTES | |
|---|---|---|
| PV system power | 176 kW | 136 kW |
| Annual energy drawn by the heat pump | 99,350 kWh | 61,597 kWh |
| Annual electricity demand | 166,713 kWh | 128,959 kWh |
Publisher’s Note: MDPI stays neutral with regard to jurisdictional claims in published maps and institutional affiliations. |
© 2020 by the authors. Licensee MDPI, Basel, Switzerland. This article is an open access article distributed under the terms and conditions of the Creative Commons Attribution (CC BY) license (http://creativecommons.org/licenses/by/4.0/).
Share and Cite
Dec, K.; Broniewicz, E.; Broniewicz, M. The Possibility Analysis of Adapting a Public Building to the Standard of a Building with a Zero Energy Balance. Energies 2020, 13, 6389. https://doi.org/10.3390/en13236389
Dec K, Broniewicz E, Broniewicz M. The Possibility Analysis of Adapting a Public Building to the Standard of a Building with a Zero Energy Balance. Energies. 2020; 13(23):6389. https://doi.org/10.3390/en13236389
Chicago/Turabian StyleDec, Karolina, Elżbieta Broniewicz, and Mirosław Broniewicz. 2020. "The Possibility Analysis of Adapting a Public Building to the Standard of a Building with a Zero Energy Balance" Energies 13, no. 23: 6389. https://doi.org/10.3390/en13236389
APA StyleDec, K., Broniewicz, E., & Broniewicz, M. (2020). The Possibility Analysis of Adapting a Public Building to the Standard of a Building with a Zero Energy Balance. Energies, 13(23), 6389. https://doi.org/10.3390/en13236389