Abstract
The application of renewable energy has become increasingly widespread worldwide because of its advantages of resource abundance and environmental friendliness. However, the deployment of hybrid renewable energy systems (HRESs) varies greatly from city to city due to large differences in economic endurance, social acceptance and renewable energy endowment. Urban policymakers thus face great challenges in promoting local clean renewable energy utilization. To address these issues, this paper proposes a combined multi-objective optimization method, and the specific process of this method is described as follows. The Hybrid Optimization Model for electric energy was first used to examine five different scenarios of renewable energy systems. Then, the Technique for Order Preference by Similarity to an Ideal Solution was applied using eleven comprehensive indicators to determine the best option for the target area using three different weights. To verify the feasibility of this method, Xiongan New District (XND) was selected as an example to illustrate the process of selecting the optimal HRES. The empirical results of simulation tools and multi-objective decision-making show that the Photovoltaic-Diesel-Battery off-grid energy system (option III) and PV-Diesel-Hydrogen-Battery off-grid energy system (option V) are two highly feasible schemes for an HRES in XND. The cost of energy for these two options is 0.203 and 0.209 $/kWh, respectively, and the carbon dioxide emissions are 14,473 t/yr and 345 t/yr, respectively. Our results provide a reference for policymakers in deploying an HRES in the XND area.
1. Introduction
1.1. Research Background
China is the largest energy consumer worldwide due to its continued industrialization and urbanization, and the majority of the energy supply is still provided by non-renewable resources such as coal and natural gas. To cope with this situation and to promote ecological environmental improvement, the Chinese government has decided to intensely develop solar, wind, hydropower, and other renewable energy sources. Some related policies and regulations reflect the detailed staged goals of China and establish feasible ways to achieve these goals up to 2050, which provides policy support for the development of renewable energy. The Renewable Energy Law of the People’s Republic of China [1] provides a new framework for the development of renewable energy from the aspects of resource investigation and development planning, industrial guidance and technical support, and promotion and application. The China 2050 High Renewable Energy Penetration Scenario and Roadmap Study [2] explores the scenarios and pathways by which China can move fossil fuels, especially coal, away from dominating China’s energy development and achieve a low-carbon, green electricity future. The 13th Five-Year energy plan [3] expounds the guiding ideology, basic principles, development goals, key tasks and policy measures for China’s energy development. China Renewable Energy Outlook 2017 [4] is an annual report based on China’s established strategic polices and the experience of advanced countries; the report focuses on the development of renewable energy and proposes solutions to the problems faced in the development of renewable energy. Against this background, a range of technologies and systems related to carbon emission reduction have been examined, including the development of concentrating solar power technology [5], the utilization of enhanced geothermal energy [6] and other related renewable energy technologies.
However, the fraction of renewable energy in the national energy mix is only 3%, which is lower than the world average (4%), and coal-fired power generation (more than 70%) remains mainstream in China and continues to have a serious impact on the environment [7,8]. In addition, cities, as some of the largest producers of anthropogenic greenhouse gases, also continue to accelerate the global warming process [9]. It is urgent for the Chinese government to reduce anthropogenic greenhouse gas emissions and increase the utilization of available renewable energy in the energy system. Accordingly, this paper aims to provide a decision-making scheme for building feasible renewable energy systems by proposing a quantitative evaluation method.
1.2. Literature Review
To reduce the overall cost of the system, hybrid energy systems (HESs) are widely used to improve the security of traditional energy systems [10]. With the deepening of the clean energy revolution, HESs are gradually being replaced by hybrid renewable energy systems (HRESs).
The methods used in research related to the configuration of HRESs can be divided into traditional methods, artificial intelligence methods and software methods. Traditional methods mainly include probability and statistical methods [11]; iteration methods [12]; and numerical methods [13], which are used to provide the analyses and solutions for simple linear problems with uncertain results. Common artificial intelligence methods include genetic algorithms and particle swarm optimization. Different from traditional methods, artificial intelligence methods can be used to solve complex nonlinear problems, which mainly reflect multiple uncertainties, including uncertain meteorological conditions and a variable electricity load, in the optimization process of the HRES [14]. Although artificial methods can solve the above problems, researchers must have advanced programming abilities to employ these methods. Against this background, an increasing number of researchers use software tools to solve the HRES optimization problem. Common software tools include HOMER, RETSCREEN, and PVSYST [15] Among all the software tools related to the HRES, the HOMER model is favoured by researchers because of its flexible modelling ability [16].
The HOMER model is a hybrid electricity system analysis and design software developed by the National Renewable Energy Laboratory (NREL), which integrates system simulation, optimization and sensitivity analysis. Existing studies related to the HOMER model can be divided into two categories: Remote areas and urban areas.
For remote rural areas or islands, economic factors tend to dominate the deployment of an energy system [17]. Due to the remoteness of these locations, the cost of grid installation is relatively high, so the off-grid HRES becomes a suitable choice. Many researchers have conducted studies to perform a more accurate economic benefit evaluation of these systems. [18] used this model to conduct an economic analysis, and the net present cost (NPC) and cost of energy (COE) were presented as significant indicators by which to evaluate an energy system during its entire life cycle. Based on the analysis results, the optimal HRES option brings great economic benefits, and the CO2 emissions are greatly reduced [19]. The maximum reduction in CO2 emissions is 100%, which means that local renewable energy resources can be used to satisfy the daily demand for electricity in remote rural areas and islands.
Moreover, the current urban energy structure still has a serious negative impact on the environment; thus, it needs to be optimized and upgraded through renewable energy penetration. Many scholars have conducted techno-economic analyses of the HRES at the urban scale. For example, [20] analysed the technological and economic potentials of two different HESs (Photovoltaic/Wind/Diesel and PV/Wind systems) with battery storage in the Jubail industrial city of Saudi Arabia. The results indicated that the minimum COE was 0.25 $/kWh for the HRES with 100% renewable energy penetration. Furthermore, [21] analysed the PV-Battery-Hydrogen system with the HOMER model both technologically and economically. The results showed that the COE of the optimal system was 0.323 $/kWh, and there were no carbon dioxide emissions into the atmosphere. The above study used batteries and hydrogen as energy storage carriers, and the different energy storage carriers had correspondingly different characteristics. For example, the initial construction cost of utilizing battery energy storage is lower than that of utilizing hydrogen, and the battery energy storage efficiency is higher than that of hydrogen. However, when the end of the life cycle of batteries is reached, the disposal of discarded batteries is costly and has a particularly negative impact on the environment compared to hydrogen storage [22]. To determine the most appropriate types of energy storage in different areas, [23] performed a techno-economic analysis of nine different HRESs with different energy storage modes for five different global locations. Their findings showed that hydrogen has greater long-term benefits than does battery storage. Furthermore, [24] not only simulated the energy systems of 17 cities in South Korea but also generated the overall economic feasibility map of Korean cities. From this map, it was found that Jeju and Incheon have a higher economic feasibility than do the other 15 cities examined.
It is worth noting that the algorithm of the HOMER model is based on the minimum net present value, which means that this model is suitable for areas restricted by economic factors. In addition to economic factors, other factors influence the deployment of the entire HRES, such as the endowment of renewable energy, load demand, dispatch strategy and energy policy [25]. To synthetically evaluate the impacts of these factors on energy system deployment, the analytic hierarchy process (AHP) approach was adopted. According to the evaluation results, political instability, transportation problems, and site suitability are the major barriers in the corresponding research regions. The AHP method is mostly used to evaluate the importance of corresponding indicators. To quantitatively evaluate renewable energy options, the Technique for Order Preference by Similarity to an Ideal Solution (TOPSIS) is adopted. TOPSIS is a method by which to determine the ideal solution and can fully consider the factors that impact the evaluation results. For example, [26] applied the Criteria Importance through Inter-Criteria Correlation (CRITIC) method and TOPSIS to assess options both technologically and economically, as required by HOMER. The system consisting of wind turbines, diesel generators and batteries was determined to be the optimal option among all candidate options according to the CRITIC and TOPSIS results. Additionally, [27] utilized HOMER to simulate cost scenarios in communities in Nigeria, and the HOMER results were evaluated by TOPSIS according to 15 different economic, social, and environmental indicators. The results indicated that the energy system with a COE of 0.787 $/kWh was the optimal option.
In summary, HRES deployment can effectively reduce emissions of greenhouse gases. However, for different regions, the factors influencing the selection of an HRES are different. For some remote areas, such as rural areas and isolated islands, economic and technological factors dominate the selection of energy systems. For developed areas, the dominant factors include the environment and society. HOMER is a multi-objective optimization algorithm based on the minimum NPC, which is a suitable tool for the simulation and optimization of energy systems in remote areas. However, for developed areas, such as the Xiongan New District (XND) area in this study, considering only economic and technological factors is insufficient, and we need a more comprehensive evaluation index system to select the optimal HRES. Thus, a multi-objective evaluation method for HRES selection is examined in the present study.
1.3. The Potential Contribution of This Study
The priority of a candidate option in HOMER is determined by the principle of the minimum NPC. Thus, HOMER is a great tool for simulating scenarios in undeveloped areas where the economy and technology are the obvious limiting factors for local development. However, for developed areas, the limiting factors may be the society and environment, rather than the economy and technology. Although some predecessors have used the method of combining TOPSIS and HOMER to evaluate HOMER simulation results, these studies have some shortcomings, which can be divided into two categories. First, these studies did not consider the impacts of local policies on system selection [26]. For example, political willingness plays a special role in regional development in China. This method considers comprehensive indicators affecting the selection of HRES options, including economic (the initial cost, O&M cost and COE), technological (renewable fraction, ease of installation and excess electricity), environmental (CO2 emissions, area requirements and environmental impact) and social (acceptability and willingness to pay) factors. Different from previous studies, social indicators related to local energy policies are included in the index evaluation system for the first time. In addition, the subjective weighting method represented by the AHP method has strong subjectivity, which ignores the variability and conflict within indicator elements. Second, the objective weighting method represented by the CRITIC method has strong subjectivity, which is not in line with the reality of real-world decision-making [28]. Thus, using only subjective weighting or objective weighting can introduce certain errors into the results.
Combining subjective and objective weighting to reduce errors, this paper presents an evaluation method based on the HOMER model and the TOPSIS method. This contribution unifies the indicator unit in the evaluation process of a complex system, which is helpful to the scientific ranking of alternatives. Based on this method, we further determine the optimal HRES option in the XND in China.
2. Methodology
This paper proposes an evaluation method combining the HOMER model and the TOPSIS method. Generally, a large amount of heat energy will be released in the process of coal-fired power production in China, which is used as a by-product of electric energy to provide heating services. Since this study focuses on the optimization of the power system, the research does not consider the heat energy supply. The energy system consists of the already-produced power to the end-users. In this text, the HOMER model is used to simulate different scenarios in the research area, and the simulation results are evaluated as options. The TOPSIS method is utilized to rank the HRES options, considering all aspects affecting HRES selection. In the decision-making process of the TOPSIS method, three different weighting methods are proposed—the AHP method, CRITIC method, and AHP-CRITIC method—which represent subjective empowerment, objective empowerment and the combination of subjective and objective empowerment. Figure 1 shows a flow chart of this method, and the details of each step are presented in the following sections.
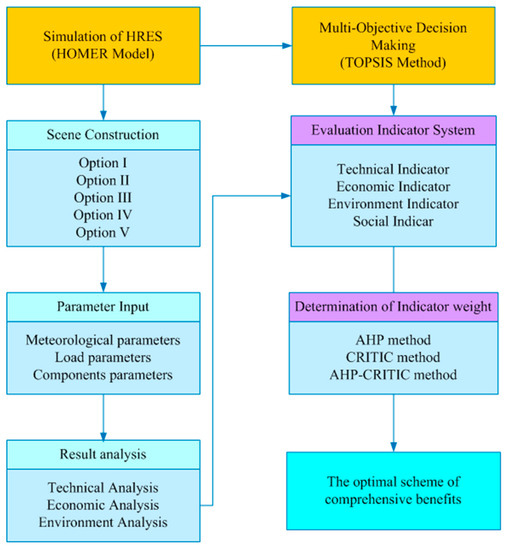
Figure 1.
Flow chart of the HOMER-TOPSIS (Technique for Order Preference by Similarity to an Ideal Solution) method of the Xiongan New District (XND) area.
2.1. HOMER Simulation
HOMER was developed by the NREL. The main functions of this model include system simulation, system optimization, and sensitivity analysis, which can be used for system design, energy planning, market analysis and policy making. To obtain candidate HRES options in the research area, HOMER based on the minimum net present value is applied.
2.1.1. Description of the XND
To focus on the non-capital functions of Beijing in China—considering the application of a new optimal development mode for densely populated areas; adjusting and optimizing the layout and spatial structure of the Beijing, Tianjin and Hebei districts; and cultivating a new engine for innovation-driven development—the government of China decided to develop the XND area.
Located in the hinterland of Beijing, Tianjin and Baoding at 38°51.8′ N, 115°52.2′ E, the XND area covers the administrative districts of Xiongxian, Rongcheng and Anxin counties, as well as the surrounding areas, which have distinct regional advantages, such as a low extent of current development, basic conditions that provide a good starting point and high development and construction standards.
The plan involves developing the XND area in advance, starting with specific areas, and the planned start-up area of the XND area is 38 km2, in which the planned construction land area is 26 km2, accounting for 68.4% of the total planning area according to the local regulations published in [29]. This area will inherit the non-capital function stock of Beijing and effectively attract part of the population of Beijing, thereby accruing highly skilled workers, and a population structure that is compatible with the function positioning of innovative intelligence and other new areas will gradually form to satisfy the development needs of high-end and prosperous industries. This paper selects this area as the research area, and Figure 2 shows the detailed information of the research area in this study. The sources of the pictures on the left and right of Figure 2 are HOMER and the Planning Outline of the XND area in Hebei Province [30], respectively.
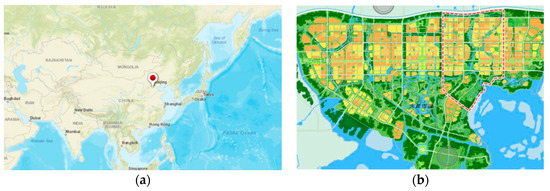
Figure 2.
(a) Location of the XND start-up area, (b) Coverage area of XND (These two maps are download from the basic plan of XND).
2.1.2. Hybrid Energy System Options
According to the construction plan, the XND area will realize a 100% clean power supply and become the first urban power grid with a continuous 100% clean power supply. This plan will enable clean power consumption to account for 52% of the final energy consumption. To fulfil this purpose, it is necessary to make full use of local renewable resources to optimize the power system configuration. The policy planning outline (Hebei 2017) shows that clean energy sources include wind, solar, hydrogen, and other renewable energy with no waste. In view of the dense population, nuclear power is not feasible in the XND. This paper applied HOMER to simulate HRESs with different storage modes, including battery and hydrogen energy storage equipment, which are applied to solve the problems of excess electricity and power output volatility. In the present study, PV panels, wind turbines, batteries, fuel cells, electrolytic cells, hydrogen tanks, converters, and diesel generators constitute the candidate components of the HRES options. This study constructed five different scenarios in the XND area, including a grid-connected HRES with a battery storage mode (option I), a grid-connected HRES with a hydrogen storage mode (option II), an off-grid HRES with a battery storage mode (option III), an off-grid HRES with a hydrogen storage mode (option IV), and an off-grid HRES with modes that combine battery and hydrogen storage (V). Figure 3 shows the detailed configurations of the above systems.
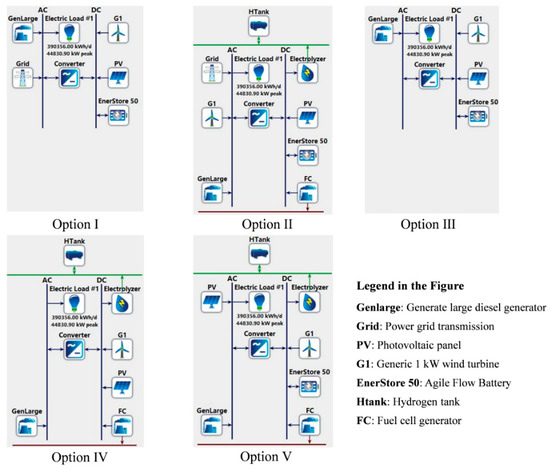
Figure 3.
Configuration of the different hybrid renewable energy system (HRES) alternatives in this study.
2.2. AHP Method
The AHP method was proposed in the mid-1970s by the American operations research scientist Tomas L. Saaty [31]. This method regards complex multi-objective decision-making problems as systems, decomposes the objective into multiple objectives, and then obtains several levels of multi-indexes through further decomposition. Through the nine-scale scoring method put forward by Saaty, single and total rankings are calculated, which can be used as a systematic method of multi-index and multi-scheme decision-making [32]. The calculation method for each evaluation indicator and the steps of the AHP method are explained in Section 2.2.1 and Section 2.2.2, respectively.
2.2.1. The Calculation Process of Each Indicator
To comprehensively evaluate the HRES options in the XND area, eleven indicators covering technology, economy, environment and society are selected, which can be divided into qualitative indicators and quantitative indicators. The detailed calculation processes of the quantitative indicators and evaluation criteria of the qualitative indicators are provided in this section.
(1) Renewable fraction
The renewable fraction is a quantitative and technical index, and this indicator refers to the fraction of energy provided by renewable energy resources to the load, which is calculated by the following equation:
where Enonren is the electricity generated by a non-renewable energy resource (kWh/yr), Hnonren is the thermal energy generated by a non-renewable energy resource (kWh/yr), Eserved is the total electrical load supplied (kWh/yr), and Hserved is the total thermal load supplied (kWh/yr).
In HRES deployment, the larger the fraction of renewable energy, the smaller the impact on the environment; therefore, the renewable fraction is a benefit indicator.
(2) Ease of installation
The ease of installation is a qualitative and technical indicator. The number of system components and the ease with which the various components fit together are used to evaluate this indicator. In the deployment of renewable energy systems, an easier installation will reduce the investment cost. Thus, the ease of installation is a benefit indicator.
(3) Excess electricity
The excess electricity is a quantitative and technical indicator. In the HRES, the electricity generated from renewable energy sources first satisfies the local load demand, and the rest of the electricity is divided into two parts, with one part stored in batteries or hydrogen tanks and the other part wasted. The excess electricity is applied to describe the fraction of wasted electricity, and the smaller this indicator in the HRES is, the better the HRES functions. Thus, the excess electricity is a cost indicator, and this value is calculated by the following equation:
where Eexcess is the total excess electricity (kWh/yr) and Eprod is the total electrical production (kWh/yr).
(4) Initial cost
The initial cost is a quantitative and economic indicator. This indicator refers to the investment required for each component at the beginning of the HRES. The smaller this indicator is, the lower the initial capital investment is. Thus, this parameter is a cost indicator.
(5) Operation and maintenance (O&M) cost
The O&M cost is a quantitative and economic indicator. During the life cycle of each system component, the operation and maintenance of each system component both require a certain amount of capital investment, and the total required investment is represented by the O&M cost. This parameter is a cost indicator.
(6) Cost of energy (COE)
The COE is a quantitative and economic indicator. To specify the cost of generating electricity per kilowatt hour, the concept of the COE is introduced. The value of this indicator is calculated by the following equation:
where Cann,tot refers to the total annualized cost ($/yr), cboiler refers to the boiler marginal cost ($/kWh), Hserved refers to the total thermal load supplied (kWh/yr) and Eserverd refers to the total electrical load supplied (kWh/yr). In the HRES deployment, the lower the COE is, the lower the investment is. Thus, the COE is a cost indicator.
(7) CO2 emission
CO2 emission is a quantitative and environment indicator. In the configuration of an HRES, a diesel generator is used to mitigate the harm caused by fluctuations in renewable energy generation. In addition, diesel combustion produces a certain amount of carbon dioxide, which is represented by the CO2 emission. Although a certain amount of carbon dioxide is produced during the life cycle of renewable energy components, the amount generated is much lower than that generated by diesel generators. Thus, this paper assumes that there are no carbon dioxide emissions in the process of electricity generation using renewable energy components. The value of this indicator is calculated by the following equation:
where TCE refers to the total carbon dioxide emissions (t/yr), Ei refers to the carbon emission intensity of diesel combustion (t CO2/MW h) and Qi refers to the electricity generated from diesel (MWh).
The lower the CO2 emission is, the smaller the greenhouse effect is. Thus, this parameter is a cost indicator.
(8) Area requirement
This indicator represents the total floor area of each device, including PV panels, wind turbines, electrolysers, hydrogen tanks, and generators. The land area in the city is very limited, and the smallest HRES footprint is sought. Thus, the area requirement is a cost indicator. The installed surface area of a diesel generator station is relatively small, and this study takes only the installed surface area of renewable energy components into consideration. In this study, the installed surface areas of a 1-kW PV panel and a 1.5-MW wind turbine are 7.5 m2 and 1500 m2, respectively. Table 1 shows the detailed information of land surface requirement for each option.

Table 1.
Land surface requirement for each option.
(9) Environment impact
The environment impact is a qualitative and environmental indicator. This indicator refers to the noise impact caused by an HRES. In addition to the greenhouse effect, the noise impact also causes physical discomfort to humans, which is why we select this indicator to evaluate the candidate HRES schemes in this study. The environment impact is a cost indicator.
(10) Acceptability
Acceptability is a qualitative and social indicator. This indicator refers to the degree of recognition and mastery of technology from the perspective of the public. In the XND, the public is more familiar with diesel generator technology than with renewable energy components technology and is more familiar with battery storage systems than with hydrogen storage systems. Acceptability is a benefit indicator.
(11) Willingness to pay
Willingness to pay is a qualitative and social indicator, and this indicator represents the degree of willingness of investors or policymakers to invest in different HRESs. Hence, willingness to pay is a benefit indicator.
2.2.2. The Process of the AHP Method
This section describes the detailed calculation process of the AHP method in the XND area, and the specific steps are as follows:
Step 1: Establish a hierarchical model
Figure 4 shows the hierarchical structure of this study. The highest level in this study is the selection of the best HRES option in the target region. The renewable fraction, ease of installation and other nine indicators are the evaluation indicators in this study.
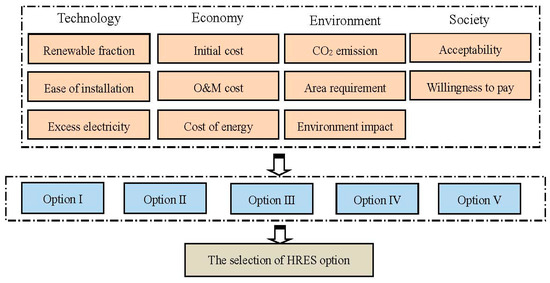
Figure 4.
Structure of the analytic hierarchy process (AHP) method in the XND.
Step 2: Compare the different indicators
When comparing the importance of the ith and the jth elements in the previous layer, use the quantitative relative weight aij for the analysis. The aij value in the pairwise comparison matrix is assigned according to the scale proposed by Saaty, and detailed information on the Saaty scale table can be found in Appendix A [33,34].
The pairwise comparison matrix has the following properties: aij > 0, and aij = 1/aji; (when i is equal to j, the value of aij is 1).
Step 3: Calculate the weight vector and evaluate the consistency
As shown in Table 2, Table 3, Table 4, Table 5 and Table 6, five n×n judgement matrices can be obtained in Step 2. Then, the maximum eigenvalue (max) and corresponding eigenvectors are calculated for each paired comparison matrix, and the consistency test is performed. Detailed information on the consistency test can be found in Appendix A.
Table 2.
Pairwise comparison to the criterion layer.
Table 3.
Pairwise comparison to the sub-criterion layer (technology layer).
Table 4.
Pairwise comparison to the sub-criterion layer (economy layer).
Table 5.
Pairwise comparison to the sub-criterion layer (environment layer).
Table 6.
Pairwise comparison to the sub-criterion layer (society layer).
Step 4: Ranking each indicator
The vector of each indicator can be obtained by multiplying the weight vector of the sub-criterion layer by the weight vector of the criterion layer. If the value of the indicator vector is high, this indicator has a higher importance in the whole HRES and vice versa.
2.3. CRITIC Method
The CRITIC method is an objective weighting method proposed by Diakoulaki in 1995 [28]. In this method, the objective values of each indicator element are determined based on the variability and conflict within the indicator element. The measurement of the variability and conflict within the indicator element is realized in the form of the standard deviation in the indicator element and the correlation coefficient between the indicator elements. The process of determining the objective weight of indicator elements by the CRITIC method can be divided into five parts, namely, the dimensionless treatment of the elements of the decision matrix, the calculation of the standard deviation, the calculation of the correlation coefficient, the calculation of the information value and the calculation of the weight of each indicator element. The detailed calculation process can be found in Appendix B.
Step 1: The dimensionless treatment of the elements of the decision matrix
The units of each indicator element in the initial decision matrix are different, and the differences between the indicator elements bring errors to the subsequent results. Before objective weight assignments using the CRITIC method, the first step is the dimensionless processing of the decision matrix.
Step 2: The calculation of the standard deviation of the indicator elements
To quantitatively measure the variability within the evaluation indicator element, the standard deviation is selected as the tool with which to evaluate variability in this paper.
Step 3: The calculation of the correlation coefficient between indicator elements
In order to quantitatively measure the conflict between indicator elements, this paper selects the correlation coefficient as the tool to evaluate the conflict.
Step 4: The calculation of the information value of each indicator element
To comprehensively evaluate the variability and conflict within in each indicator element, this paper selects the information value of the indicator element to evaluate the variability and conflict within the indicator element.
Step 5: The calculation of the weight of each indicator element
In the CRITIC method, the weight value of each indicator element is calculated according to the ratio of the information value of each indicator element to the sum of the information value of each indicator.
2.4. AHP-CRITIC Method
The AHP method determines the weight of each indicator element based on expert consultation and scoring and does not consider the objective information of the indicator elements themselves. In the CRITIC method, the objective information of the indicator element itself is the basis for determining the weight of the indicator element, without considering the subjective intention in the real world. To make full use of the advantages of the two methods, this paper proposes an AHP-CRITIC combination weighting method. The process of weighting can be achieved by the following equation.
2.5. TOPSIS Method
TOPSIS is an acronym for the Technique for Order Preference by Similarity to an Ideal Solution. This method was developed by C.L. Hwang and K. Yoon in 1981 [35]. The main idea of this method is to rank all candidate options according to their distance from idealized goals. If the evaluation option is the closest to the positive ideal solution and the farthest from the negative ideal solution, it is the optimal option, and if not, the evaluation option is not the best option. In this paper, TOPSIS is used to select the optimal HRES option in the XND area, and the calculation process can be found in Appendix B. TOPSIS is applied in this study according to the following process:
Step 1: Formulate the decision matrix
According to the AHP method, eleven indicators are used to evaluate the HRES options in the target area. These indicators can be divided into two types, namely, cost and benefit indicators. The quantitative indicator values in this study are calculated based on the HOMER simulation results, and the qualitative indicator values are determined according to expert opinions by the AHP method. Table 7 shows the detailed information of the decision matrix. The analysis process of each indicator can be found in Section 4.
Table 7.
TOPSIS method decision matrix.
Step 2: Normalize the decision matrix
To eliminate errors due to the order of magnitude, this paper normalizes the decision matrix. Detailed information on the normalization can be found in Appendix B.1, and Table 8 shows the detailed information of the decision matrix after normalization.
Table 8.
TOPSIS method decision matrix after normalization.
Step 3: Calculate the weighted normalized matrix
The weighted normalized matrix is obtained after the normalization process by Equation (A11) in Appendix C. There are three weighting systems in this paper, which are the weights determined by the AHP method, the CRITIC method, and the AHP-CRITIC method, and the weight determination process is shown in Section 2.2, Section 2.3 and Section 2.4.
Step 4: Determine the ideal solutions among all the candidate options
In this step, the ideal solution has the shortest distance from the positive solution indicator and the longest distance from the negative solution indicator and is considered the optimal reference option.
Step 5: Calculate the relative distances of the option to the best and worst solutions
In this step, the relative distances are calculated from the ideal and non-ideal solutions. The longer the distance of the option to the ideal solution, the more feasible the option is.
Step 6: Calculate the closeness coefficient
The closeness coefficient is the relative closeness of each option to the ideal solution, which is used to determine the optimal option out of all the candidate options.
3. Parameter Setting
Detailed information on the data input is provided in this section. The data input is divided into two types: The HOMER model and the AHP method. In the section on HOMER, the power load estimation approach, available renewable energy resources and cost parameters are introduced. In addition, the establishment of the matrix weights and the consistency evaluation process of the AHP method are described in Section 3.2.
3.1. HOMER Model
3.1.1. Electricity Consumption Estimation
To predict the population density of the XND area, some researchers use the grey system prediction model. According to the simulation results, the population density of the XND area is 685 people per km2 [36]. The construction floor area is 26 km2 in the start-up area of the XND, and the population of the research area in the future scenario is 17,810 people.
According to the technical provisions for urban planning management in Hebei Province, the average annual electricity consumption ranges from 6000 to 8000 kWh; that is, the estimated yearly electricity demand estimation ranges from 106.86 to 142.48 GWh. To ensure that the simulation results can meet the electricity demand of the region to the greatest extent, the annual electricity consumption considered for this region is 142.48 GWh, which means that the daily electricity consumption is 390 MWh. In addition, the energy system is subject to random variability, and the daily and hourly random variability in this study are 10% and 20%, respectively, according to previous research [37].
3.1.2. Available Renewable Energy Resources in the Research Area
To verify the optimal HRES option in the XND, the potential renewable energy resources in the research area must be evaluated. This study utilized meteorological data consisting of wind speed and solar energy data for the evaluation.
Figure 5 shows detailed information on the local renewable resources. As shown in the left panel of Figure 5, the average annual solar global horizontal irradiance and clearness index are 4.07 kWh/m2/day and 0.508, respectively. The highest daily solar irradiation occurs in May and July, which means that there is abundant solar energy in these months. Moreover, the wind speed information is displayed in the right panel of Figure 5. According to this figure, the average annual wind speed is 3.52 m/s, which is measured by an anemometer at 50 m above sea level, and the highest wind speed is observed in April. The above information is retrieved from NASA meteorology and solar energy data resources.
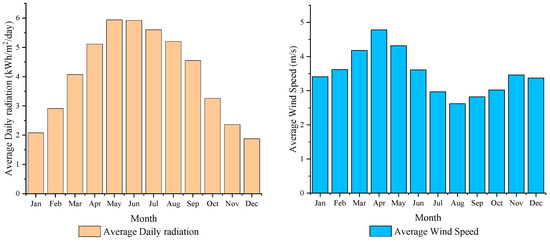
Figure 5.
Renewable resources in the XND.
3.1.3. Cost parameters of the HRES options in the research area
In this paper, a techno-economic analysis was conducted with HOMER to determine the optimal HRES option in the XND area among five different scenarios. Table 9 lists the detailed cost information of each component [37,38].
Table 9.
Cost information of each component in the HRES options.
3.2. AHP Method
In this study, each candidate HRES option was evaluated from the perspectives of the economy, technology, environment, and society. The AHP method is applied in this study to determine the most influential indicator in HRES deployment. Table 1 summarizes the different weights of the indicators of the criterion layer, and most of these types are influenced by social indicators. Furthermore, the weight of each indicator in the corresponding type (sub-criterion or indicator criterion) is presented in Table 5, Table 6, Table 7, Table 8 and Table 9. From the evaluation results, the renewable energy fraction (with a weight of 0.63), COE (with a weight of 0.63), CO2 emission (with a weight of 0.63), and acceptability (with a weight of 0.75) are the most influential indicators among the different types. The overall weight of each indicator is provided in the following part. The weight of each indicator is determined by the sum of the elements in a single row relative to the sum of the elements in each row.
4. Results and Discussion
The purpose of this study is to determine the optimal HRES configuration in the XND area by considering all factors, including technology, economy, environment and society. The HOMER simulation and the TOPSIS evaluation results are presented in this section.
4.1. HOMER Simulation Results
The HOMER model is applied to determine the candidate HRES options in the research area based on the simulation results. In this section, the different technical analyses of hybrid energy are divided into four parts: System configuration, economic analysis, technology analysis, and environmental analysis.
4.1.1. System Configuration
To determine the optimal configuration of each option, five different scenarios are built via HOMER simulations. According to the simulation results, each optimal HRES option is distinguished. Table 10 contains detailed information on each configuration in the research area and the various configurations identified as candidate options to be assessed by the TOPSIS method. It is worth noting that diesel generators are used in each optimal system because diesel generators can prevent system damage caused by the intermittent nature of renewable energy power generation.
Table 10.
Configuration of the options to be evaluated in the research area.
4.1.2. Technology Analysis
This study selects the renewable fraction, excess electricity and grid power fraction as the evaluation criteria; thus, our technology analysis considers these three indicators. Detailed information on these two indicators can be found in Table 11. For the grid-connected HRES options, an amount of electricity is supplied by the grid, leading to a low renewable fraction. In this study, the grid power fractions of options I and II are 48.5% and 16.3%, respectively. In addition, for energy storage purposes, the effect of battery energy storage is better than that of hydrogen energy storage, which can be evaluated according to the excess electricity. In this study, the excess electricity of the battery storage mode option is lower than that of the hydrogen storage mode option, regardless of whether the option is a grid-connected or off-grid HRES option. Additionally, this paper constructs three different hydrogen energy storage HRESs to be evaluated because of the policy requirements of the XND area. According to the development plan of the research area, the XND area will have more hydrogen energy vehicles and refuelling stations in the near future. Therefore, this study regards the hydrogen energy storage HRES as a plan option to be evaluated.
Table 11.
Technology data of all candidate options.
4.1.3. Economic Analysis
For each candidate HRES option to be evaluated, economic data including the initial capital cost, O&M costs and COE can be obtained from the HOMER simulation results. Table 12 summarizes the economic data of all candidate HRES options. The grid power and sellback prices are 0.1 $/kWh and 0.2 $/kWh, respectively. The grid electricity portion is large in the grid-connected HRES option; thus, the electricity price of the off-grid HRES is higher than that of the grid-connected HRES. In this study, the COEs of options I and II are lower than those of the other options. Moreover, the cost of hydrogen storage equipment is much higher than that of battery storage equipment, so the COE and initial cost of option II are higher than those of option I in the grid-connected HRES, and the COE and initial cost of options IV and V are higher than those of option III in the off-grid HRES. Although this study does not take the cost of the disposal process of waste batteries into consideration, the cost is too high to be ignored, which will bring obstacles into the deployment of HRES to some extent [39].
Table 12.
Economic data of all candidate options.
4.1.4. Environment Analysis
Carbon dioxide, as an indicator of climate change, cannot be ignored in the process of HRES selection. According to the simulation results of the HOMER model, the optimal configuration of carbon dioxide emissions in each scenario is obtained, which are 51,322 (option I), 24,405 (option II), 14,473 (option III), 58,995 (option IV), and 345 (option V) t/yr. From these results, we can conclude that options I and V have the highest and lowest CO2 emissions because of the different renewable fractions, respectively. In this study, 632 g carbon dioxide is emitted into the atmosphere by the grid per 1 kWh of electricity provided.
4.2. AHP Results
The AHP method was applied in this study to calculate the relative importance of each indicator of the candidate HRES options. This section is divided into two parts, namely, the qualitative indicator evaluation and the indicator weight calculation by the AHP method.
4.2.1. Evaluation of the Qualitative Indicators
The indicators in this study can be divided into quantitative and qualitative indicators. The quantitative indicators are required for the HOMER simulation results, and detailed information on these indicators can be found in Section 3.1. In this section, we evaluate the qualitative indicators by their Saaty scale values, and Table 13 contains detailed information on these indicators in each candidate HRES option.
Table 13.
Information on the qualitative indicators of all HRES option.
From Table 13, we can obtain the priority order for each indicator in all candidate HRES options. At the technical level, we choose the high slope of the learning curve as our preferred criterion. The hydrogen storage mode equipment includes an electrolyser, hydrogen tank, dispenser, and fuel cell, which are more complex than battery storage equipment [40]. Therefore, options I and III are easier to install than the other options, and if grid power is considered, the installation will become complex, which is why the score of option III is higher than that of option IV. Furthermore, the environmental impact mainly refers to the noise impact on the environment, and wind turbines generate a large amount of noise in the process of generating electricity; therefore, options IV and V have the lowest scores for this cost indicator. In addition, the mastery of hydrogen energy storage technology in the research area is worse than that of battery energy storage technology, so the scores of acceptability of option I and III in this study are higher than those of other options. Lastly, since the disposal of waste batteries will have an impact on the environment, local policymakers increase their investment in hydrogen energy storage technology, so the willingness-to-pay scores of option I and III in this study are lower than those of other options.
4.2.2. The Overall Weight of Each Option
In this section, the results of the AHP method are summarized in Table 14. From this table, we can obtain the local and overall weights of each indicator. From the perspective of the local index weight, the renewable fraction, COE, CO2 emission and acceptability are the most important indicators in each class, and the weights of these indicators in the classes are 0.63, 0.63, 0.63, and 0.75, respectively. Furthermore, CO2 emission is the most important indicator among all indicators, and the overall weight of this indicator is 0.353, which means that policymakers should pay more attention to CO2 emissions in the HRES deployment process, which is basically consistent with the local construction planning, and a 100% clean power supply will be realized in the XND, thereby allowing the area to become the first urban power grid to provide a continuous 100% clean power supply in China according to the local development planning.
Table 14.
The results of the AHP method in the XND area.
4.3. CRITIC Results
According to the differences and conflicts between the indicator elements, the CRITIC method is used to assign weights to the indicator elements. In this study, this method is used to calculate the weights of 11 indicators in the indicator system.
As shown in Table 15, the standard deviation, information value and weight of each indicator are calculated. In terms of the standard deviation, the environmental impact, acceptability and willingness-to-pay indicators have the highest scores, which means that these three indicators have more variability within the indicator element. Furthermore, the willingness-to-pay indicator has the highest score, which means that this indicator is highly weighted, and the weight of this indicator is 0.19.
Table 15.
The results of the Criteria Importance through Inter-Criteria Correlation (CRITIC) method in the XND area.
4.4. AHP-CRITIC Results
The weight determined by the AHP method is the product of expert scoring or consultation, which has certain subjectivity. Furthermore, this paper uses the method of combining subjective weighting and objective weighting to reduce the error in the decision result caused by subjectivity. Table 16 shows the detailed information of each indicator’s weight.
Table 16.
Results of the AHP-CRITIC method in the XND area.
4.5. TOPSIS Results
The TOPSIS method is applied to rank all the candidate HRES options in the research area. In the process of the TOPSIS method, once the decision matrix and weight sets are established, the next step is to evaluate all the candidate options using the TOPSIS method. To express the results more accurately, Benedetto and Kleme used the method of drawing a performance strategy map to directly express the advantages and disadvantages of the results [41]. In this paper, Figure 6 shows the score results using the TOPSIS method with three different weighting systems. In all three weighting methods, the least feasible scheme is option IV, and the reason behind this result is that the excess electricity in option IV is the highest among all the candidate options, which means that the majority of the electricity produced by renewable energy components is wasted. For option I and option II, part of the electricity is supplied by the grid, and this study considers that the electricity of the grid is provided by thermal power generation, which means that certain amounts of carbon dioxide emissions and higher grid transmission costs exist, so the feasibility of these two options decreases. In all three weighting methods, the most preferred option is option III, followed by option V. In this paper, the score of option III is higher than that of option V, and the reasoning behind this result can be divided into four factors, including technology, economy, environment, and society. From the perspective of the technical indicators, the proportion of excess electricity is the lowest and the ease of installation is the highest, which means that option III has a better technical performance and simpler construction techniques. From the perspective of the economy, option III’s initial cost and COE are lower than those of other distributed renewable energy system options because the cost of hydrogen storage systems is higher than that of battery storage systems. From the perspective of the environment, the area requirement and environmental impact of option III perform better than do those of option V. On one hand, the requirement of land surface area of PV panels is high, and the number of PV panels in option III is higher than that in option V. On the other hand, option V’s configuration includes wind turbines, which have greater a noise effect on the environment than option III. From the perspective of society, option III has lower technical requirements and is easier to implement because people in the research area have a better understanding of battery energy storage technology than hydrogen energy storage.
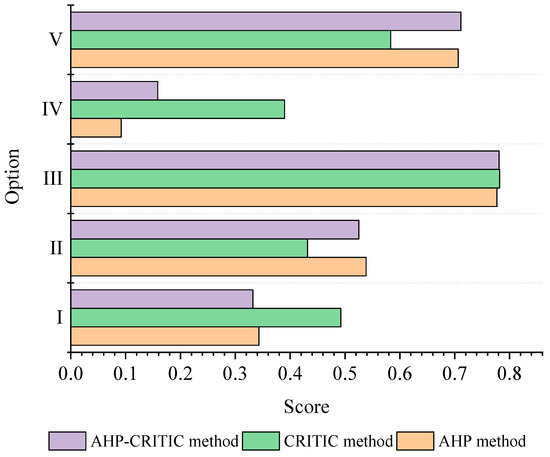
Figure 6.
Evaluation results of TOPSIS with three different weighting systems.
5. Conclusions
Promoting renewable energy utilization is challenging because it is related not only to local renewable resources but also to local policies and economic development levels. The XND area, as an area designated for green and low-carbon development, needs to fully utilize local renewable energy resources. To achieve this target in a short time, a method that combines the HOMER model and the TOPSIS method was proposed in this study, which is used to quantitatively evaluate the feasible renewable energy allocation strategy in the XND area.
The optimal configuration for each scenario, which are regarded as the candidate options to be assessed, can be determined through the simulation and optimization results of the HOMER model. Based on the TOPSIS method results, the optimal HRES options are option III and option V, which are composed of a 134.40 MW PV array, a 24 MW diesel generator, a 38.43 MW converter, and 19.6 MW batteries and a 168.43 MW PV array, 28 kW wind turbines, 15 MW diesel generators, a 39.20 MW converter, 75.6 MW batteries, a 20 MW fuel cell, a 10 MW electrolyser, and a 10 t hydrogen tank, respectively. To perform a more comprehensive assessment of the scenarios, we conducted technical, economic, environmental and social analyses of these two optimal scenarios. First, the renewable fractions of options III and V are 85.8% and 99.7%, respectively, which means that most of the electricity is generated from renewable energy. In addition, the excess electricity portions in option III and V are 6.77% and 25.1%, respectively. The excess electricity in option V can be improved by the development of hydrogen storage technology. Apart from the system configuration and technical analysis, this study also presents economic analysis results based on three indicators, including the initial cost, O&M cost and COE. The initial cost, O&M cost and COE of options III and V are 253 and 355 M$, 9.35 and 2.24 M$ and 0.203 and 0.209 $/kWh, respectively. Moreover, we also conduct an environmental analysis of each option. The CO2 emissions in option V are 345 t/yr, and this value is the minimum value among all the candidate options. The carbon dioxide emission reduction in option III ranks second, at 14,473 t/yr. In general, these two options have good environmental benefits and play important roles in improving the ecological environment and promoting carbon emission reduction.
Optimal HRES configuration selection in the XND area is realized by the quantitative evaluation method in combination with the HOMER model and the TOPSIS method. However, there are still limitations and uncertainties. On one hand, the limitations lie in the low applicability level of this method because different regions have different policies. This method is suitable for economically developed regions in which distributed renewable and hydrogen energy resources urgently need to be developed. On the other hand, uncertainties are embodied in the strong subjectivity of this approach because different experts have different opinions, which lead to different weights being applied in the TOPSIS method. Although this study adopts the AHP-CRITIC weighting method, there is still strong subjectivity because there are not enough samples of expert grading tables and there are few qualified experts. To alleviate the influence of subjectivity, other multi-objective evaluation methods will be applied in a future study. Despite these shortcomings, the research results provide a new approach for decision-makers and provide a useful reference for local renewable energy planning.
Author Contributions
Conceptualization, B.Y.; methodology, M.Z.; formal analysis, D.Y.; writing—review and editing, Y.L.; funding acquisition, B.Y. and Y.L. All authors have read and agreed to the published version of the manuscript.
Funding
The authors appreciate the support of the National Natural Science Foundation of China (Grant No. 71803074), the Natural Science Foundation of Shenzhen City (Grant No. JCYJ20190809162809440), the High-level Special Funding of the Southern University of Science and Technology (Grant Nos. G02296302 and G02296402), and the Foundation for Innovative Research Groups of the National Natural Science Foundation of China (Grant No. 71721001).
Conflicts of Interest
The authors declare no conflict of interest.
Abbreviations
| HRES | Hybrid Renewable Energy System |
| HOMER | Hybrid Optimization Model for Electric Energy |
| PV | Photovoltaic |
| AHP | Analytic Hierarchy Process |
| TOPSIS | Technique for Order Preference by Similarity to an Ideal Solution |
| COE | Cost of Energy |
| NPC | Net Present Cost |
| XND | Xiongan New District |
Appendix A. Calculation of the AHP Method
Appendix A.1. Saaty Scale Table
The Saaty scale table is used to assess the importance of the indicators. The detailed information of the evaluation criteria is shown in Table A1.
Table A1.
Saaty scale table.
Table A1.
Saaty scale table.
| Relative Importance of Ai to Aj | Assignment Value |
|---|---|
| Equal importance | 1 |
| Little importance | 3 |
| More importance | 5 |
| Highly importance | 7 |
| Extremely importance | 9 |
| Intermediate value of two adjacent judgements | 2; 4; 6; 8 |
Appendix A.2. Consistency Test
The general structure of the decision matrix can be calculated by (A1). On this basis, a consistency test is carried out. If the consistency test passes, which means that the consistency ratio (A2) is less than 0.1, the eigenvector (after normalization according to (A3)) is the weight vector. If not, the paired comparison matrix is reconstructed until it passes the consistency test. The process of the consistency test depends on the value of CR, which can be calculated by (A4) and detailed information on the RI value can be found in Table A2.
Table A2.
The RI value of consistent test.
Table A2.
The RI value of consistent test.
| n | 1 | 2 | 3 | 4 | 5 | 6 | 7 | 8 | 9 |
|---|---|---|---|---|---|---|---|---|---|
| RI | 0 | 0 | 0.58 | 0.9 | 1.12 | 1.24 | 1.32 | 1.41 | 1.45 |
Appendix B. Calculation of the CRITIC Method
Appendix B.1. Dimensionless Treatment
The dimensionless treatment was fulfilled by (A5) and (A6) in this study.
where xij is a benefit indicator.
where xij is a cost indicator.
Appendix B.2. Standard Deviation Calculation
The standard deviation was calculated by (A7) in this study.
where m is the number of option.
Appendix B.3. Correlation Coefficient Calculation
The correlation coefficient was calculated by (A8) in this study.
Appendix B.4. Information Value Calculation
The information value was calculated by (A9) in this study.
Appendix B.5. Indicator Weight Calculation of Each Indicator Element
The indicator weight of each indicator element was calculated by (A10) in this study.
Appendix C. Calculation of the TOPSIS Method
Appendix C.1. Normalization of the Decision Matrix
The normalization was achieved by (A11) in this study.
In this equation, tij and Xij refer to the element in the i-th column and j-th row of the decision matrix and normalization decision matrix, respectively.
Appendix C.2. The Search for Ideal Solutions
Ideal solutions in this study mean those with the maximum values of benefit indicators and the minimum values of cost indicators. This step was fulfilled by (A12) and (A13).
where j+ is the benefit indicator, j− is the cost indicator, V+ and V− refer to the best solutions and worst solutions in research area, respectively.
Appendix C.3. Calculate the Relative Distances from the Best and Worst Solutions
The relative distances from the best and worst solutions can be calculated by (A14) and (A15).
where Si+ and Si− are the relative distance of each option from the best solution and the worst solution.
Appendix C.4. The Calculation of the Closeness Coefficient
The closeness coefficient is used to evaluate all the candidate option in this study, and this coefficient can be calculated by (A16).
where Fi refers to each option’s closeness coefficient.
References
- National Energy Administration (NEA). Renewable Energy Law of the People’s Republic of China. Available online: http://www.nea.gov.cn/2017-11/02/c_136722869.htm (accessed on 2 November 2017).
- China National Renewable Energy Center (CNREC). China 2050 High Renewable Energy Penetration Scenario and Roadmap Study. 2015. Available online: https://www.efchina.org/Reports-en/china-2050-high-renewable-energy-penetration-scenario-and-roadmap-study-en. (accessed on 20 April 2015).
- National People’s Congress (NPC) and Chinese People’s Political Consultative Conference (CPPCC) Sections, 13th Five-Year Plan. 2016. Available online: http://www.china.org.cn/china/NPC_CPPCC_2016/node_7234656.htm (accessed on 5 March 2016).
- China National Renewable Energy Center (CNREC). China Renewable Energy Outlook. 2017. Available online: http://www.cnrec.org.cn/english/publication/2017-10-18-532.html (accessed on 18 October 2017).
- Islam, M.T.; Huda, N.; Abdullah, A.B.; Saidur, R. A comprehensive review of state-of-the-art concentrating solar power (CSP) technologies: Current status and research trends. Renew. Sustain. Energy Rev. 2018, 91, 987–1018. [Google Scholar] [CrossRef]
- Wilberforce, T.; Baroutaji, A.; El Hassan, Z.; Thompson, J.; Soudan, B.; Olabi, A.G. Prospects and challenges of concentrated solar photovoltaics and enhanced geothermal energy technologies. Sci. Total Environ. 2019, 659, 851–861. [Google Scholar] [CrossRef] [PubMed]
- Oberschelp, C.; Pfister, S.; Raptis, C.E.; Hellweg, S. Global emission hotspots of coal power generation. Nat. Sustain. 2019, 2, 113–121. [Google Scholar] [CrossRef]
- Song, Y.; Liu, T.; Ye, B.; Li, Y. Linking carbon market and electricity market for promoting the grid parity of photovoltaic electricity in China. Energy 2020, 211. [Google Scholar] [CrossRef]
- Kammen, D.M.; Sunter, D.A. City-integrated renewable energy for urban sustainability. Science 2016, 352, 922–928. [Google Scholar] [CrossRef]
- Ashok, S. Optimised model for community-based hybrid energy system. Renew. Energy 2007, 32, 1155–1164. [Google Scholar] [CrossRef]
- Kazem, H.A.; Khatib, T.; Sopian, K. Sizing of a standalone photovoltaic/battery system at minimum cost for remote housing electrification in Sohar, Oman. Energy Build. 2013, 61, 108–115. [Google Scholar] [CrossRef]
- Sinha, S.; Chandel, S. Review of recent trends in optimization techniques for solar photovoltaic–wind based hybrid energy systems. Renew. Sustain. Energy Rev. 2015, 50, 755–769. [Google Scholar] [CrossRef]
- Upadhyay, S.; Sharma, M. A review on configurations, control and sizing methodologies of hybrid energy systems. Renew. Sustain. Energy Rev. 2014, 38, 47–63. [Google Scholar] [CrossRef]
- Kornelakis, A.; Marinakis, Y. Contribution for optimal sizing of grid-connected PV-systems using PSO. Renew. Energy 2010, 35, 1333–1341. [Google Scholar] [CrossRef]
- Sinha, S.; Chandel, S. Review of software tools for hybrid renewable energy systems. Renew. Sustain. Energy Rev. 2014, 32, 192–205. [Google Scholar] [CrossRef]
- Hoseinzadeh, S.; Ghasemi, M.H.; Heyns, S. Application of hybrid systems in solution of low power generation at hot seasons for micro hydro systems. Renew. Energy 2020, 160, 323–332. [Google Scholar] [CrossRef]
- Ahmad, J.; Imran, M.; Khalid, A.; Iqbal, W.; Ashraf, S.R.; Adnan, M.; Ali, S.F.; Khokhar, K.S. Techno economic analysis of a wind-photovoltaic-biomass hybrid renewable energy system for rural electrification: A case study of KallarKahar. Energy 2018, 148, 208–234. [Google Scholar] [CrossRef]
- Ye, B.; Yang, P.; Jiang, J.; Miao, L.; Shen, B.; Li, J. Feasibility and economic analysis of a renewable energy powered special town in China. Resour. Conserv. Recycl. 2017, 121, 40–50. [Google Scholar] [CrossRef]
- Enongene, K.E.; Abanda, F.H.; Otene, I.J.J.; Obi, S.I.; Okafor, C. The potential of solar photovoltaic systems for residential homes in Lagos city of Nigeria. J. Environ. Manag. 2019, 244, 247–256. [Google Scholar] [CrossRef]
- Baseer, M.A.; Alqahtani, A.; Rehman, S. Techno-economic design and evaluation of hybrid energy systems for residential communities: Case study of Jubail industrial city. J. Clean. Prod. 2019, 237, 117806. [Google Scholar] [CrossRef]
- Das, H.S.; Tan, C.W.; Yatim, A.H.M.; Lau, K.Y. Feasibility analysis of hybrid photovoltaic/battery/fuel cell energy system for an indigenous residence in East Malaysia. Renew. Sustain. Energy Rev. 2017, 76, 1332–1347. [Google Scholar] [CrossRef]
- Rohit, A.K.; Devi, K.P.; Rangnekar, S. An overview of energy storage and its importance in Indian renewable energy sector. J. Energy Storage 2017, 13, 10–23. [Google Scholar] [CrossRef]
- Abdin, Z.; Mérida, W. Hybrid energy systems for off-grid power supply and hydrogen production based on renewable energy: A techno-economic analysis. Energy Convers. Manag. 2019, 196, 1068–1079. [Google Scholar] [CrossRef]
- Park, E. Potentiality of renewable resources: Economic feasibility perspectives in South Korea. Renew. Sustain. Energy Rev. 2017, 79, 61–70. [Google Scholar] [CrossRef]
- Das, B.K.; Zaman, F. Performance analysis of a PV/Diesel hybrid system for a remote area in Bangladesh: Effects of dispatch strategies, batteries, and generator selection. Energy 2019, 169, 263–276. [Google Scholar] [CrossRef]
- Babatunde, M.; Ighravwe, D.E. A CRITIC-TOPSIS framework for hybrid renewable energy systems evaluation under techno-economic requirements. J. Proj. Manag. 2019, 4, 109–126. [Google Scholar] [CrossRef]
- Diemuodeke, E.O.; Hamilton, S.; Addo, A. Multi-criteria assessment of hybrid renewable energy systems for Nigeria’s coastline communities. Energy Sustain. Soc. 2016, 6, 26. [Google Scholar] [CrossRef]
- Diakoulaki, D.; Mavrotas, G.; Papayannakis, L. Determining objective weights in multiple criteria problems: The critic method. Comput. Oper. Res. 1995, 22, 763–770. [Google Scholar] [CrossRef]
- Hebei Xiongan New District area Working Committee of the Communist Party of China; Administrative Committee Member of Xiongan New District Area in Hebei Province. Detailed Control Planning for the Start-Up Area of Xiongan New District Area and the Controlling Planning of the Starting Area of Xiongan District New Area in Hebei Province. Available online: http://www.xiongan.gov.cn/2019-06/01/c_1210149257.htm (accessed on 1 June 2019).
- Hebei Provincial Party Committee of the Communist Party of China and People’s Government of Hebei Province. The Planning Outline of the Xiongan New District Area in Hebei Province. Available online: www.scio.gov.cn/tt/zdgz/document/1627988/1627988.htm (accessed on 22 January 2017).
- Saaty, T.L. How to make a decision: The analytic hierarchy process. Eur. J. Oper. Res. 1990, 48, 9–26. [Google Scholar] [CrossRef]
- AbdelAzim, A.I.; Ibrahim, A.M.; Aboul-Zahab, E.M. Development of an energy efficiency rating system for existing buildings using Analytic Hierarchy Process—The case of Egypt. Renew. Sustain. Energy Rev. 2017, 71, 414–425. [Google Scholar] [CrossRef]
- Saaty, T.L. Decision Making for Leaders: The Analytic Hierarchy Process for Decisions in a Complex World; University of Pittsburgh: Pittsburgh, PA, USA, 1990. [Google Scholar]
- Saaty, T.L. Time dependent decision-making; dynamic priorities in the AHP/ANP: Generalizing from points to functions and from real to complex variables. Math. Comput. Model. 2007, 46, 860–891. [Google Scholar] [CrossRef]
- Yoon, K. A Reconciliation among Discrete Compromise Solutions. J. Oper. Res. Soc. 1987, 38, 277–286. [Google Scholar] [CrossRef]
- Liang, L.; Cao, J.; Liu, B. Future population trend forecast and policy Suggestions of Xiongan New area. Contem. Econ. Manag. 2019, 41, 59–67. [Google Scholar]
- Ye, B.; Jiang, J.; Cang, Y. Technical and economic feasibility analysis of an energy and fresh water coupling model for an isolated island. Energy Procedia 2019, 158, 6373–6377. [Google Scholar] [CrossRef]
- Ye, B.; Zhang, K.; Jiang, J.; Miao, L.; Li, J. Towards a 90% renewable energy future: A case study of an island in the South China Sea. Energy Convers. Manag. 2017, 142, 28–41. [Google Scholar] [CrossRef]
- Bigum, M.; Damgaard, A.; Scheutz, C.; Christensen, T.H. Environmental impacts and resource losses of incinerating misplaced household special wastes (WEEE, batteries, ink cartridges and cables). Resour. Conserv. Recycl. 2017, 122, 251–260. [Google Scholar] [CrossRef]
- Gökçek, M.; Kale, C. Optimal design of a Hydrogen Refuelling Station (HRFS) powered by Hybrid Power System. Energy Convers. Manag. 2018, 161, 215–224. [Google Scholar] [CrossRef]
- De Benedetto, L.; Klemeš, J. The Environmental Performance Strategy Map: An integrated LCA approach to support the strategic decision-making process. J. Clean. Prod. 2009, 17, 900–906. [Google Scholar] [CrossRef]
Publisher’s Note: MDPI stays neutral with regard to jurisdictional claims in published maps and institutional affiliations. |
© 2020 by the authors. Licensee MDPI, Basel, Switzerland. This article is an open access article distributed under the terms and conditions of the Creative Commons Attribution (CC BY) license (http://creativecommons.org/licenses/by/4.0/).