Comprehensive Evaluation of Photovoltaic Solar Plants vs. Natural Ecosystems in Green Conflict Situations
Abstract
1. Introduction
2. PV System Costs and Benefits
2.1. Benefits (Positive Impacts)
2.1.1. Climate Change Mitigation
2.1.2. Economic Benefit
2.2. Costs (Negative Impacts)
2.2.1. Loss of Carbon Sink
2.2.2. Biodiversity Loss
2.2.3. Disaster Risk
3. Materials and Methods
3.1. Cost and Benefit Quantification
3.1.1. Climate Change Mitigation
3.1.2. Economic Benefit
3.1.3. Loss of Carbon Sink
3.1.4. Biodiversity Loss
3.1.5. Disaster Risk
- Landslide hazard map
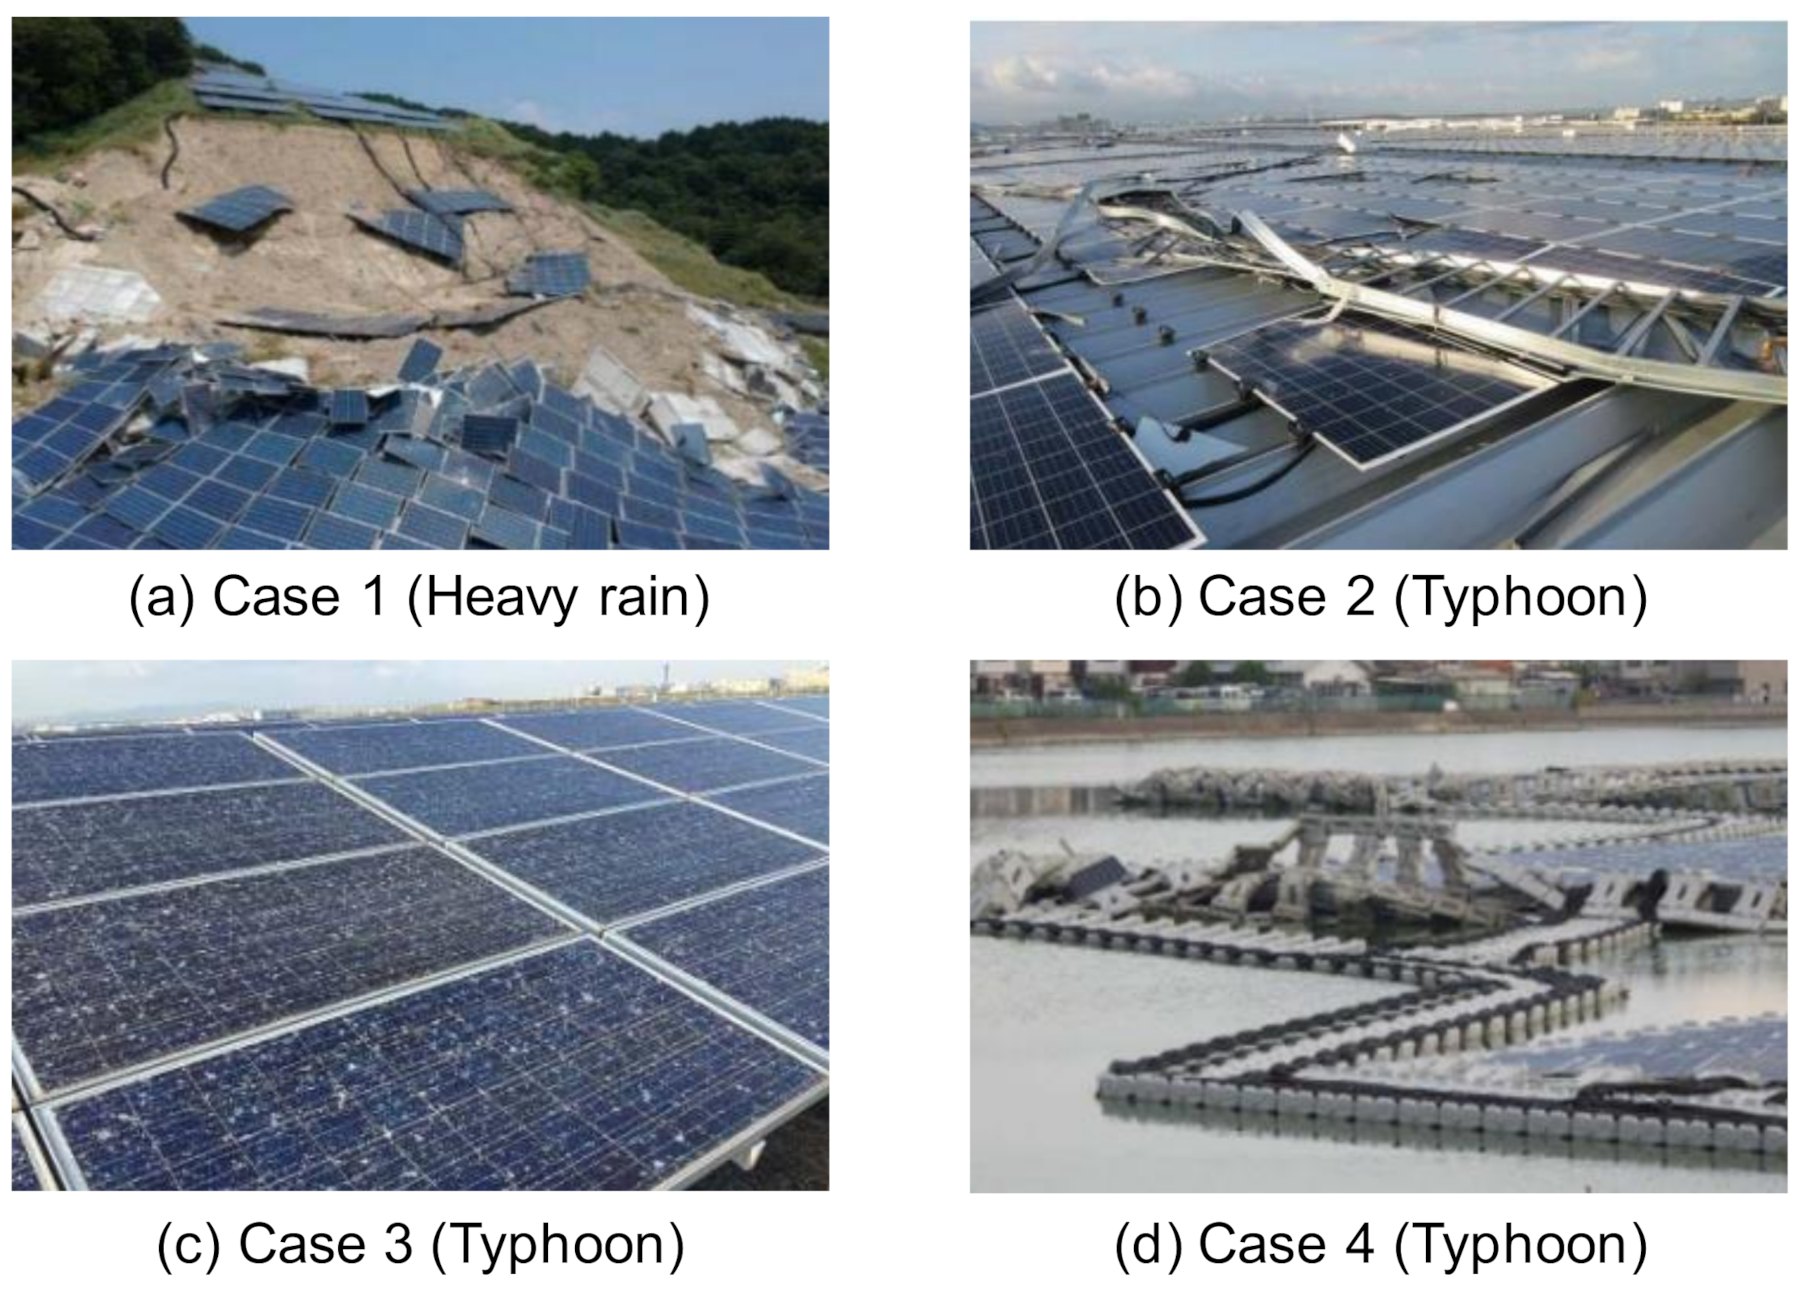
- PV solar plant damage
3.2. Case Study
- Climate change mitigation
- Economic benefit
- Loss of carbon sink
- Biodiversity loss
- Disaster risk
- Integration of positive and negative impacts
4. Results and Discussion
4.1. Cost and Benefit Quantification Results
4.1.1. Climate Change Mitigation
4.1.2. Loss of Carbon Sink
4.1.3. Disaster Risk
4.2. Case Study
5. Conclusions
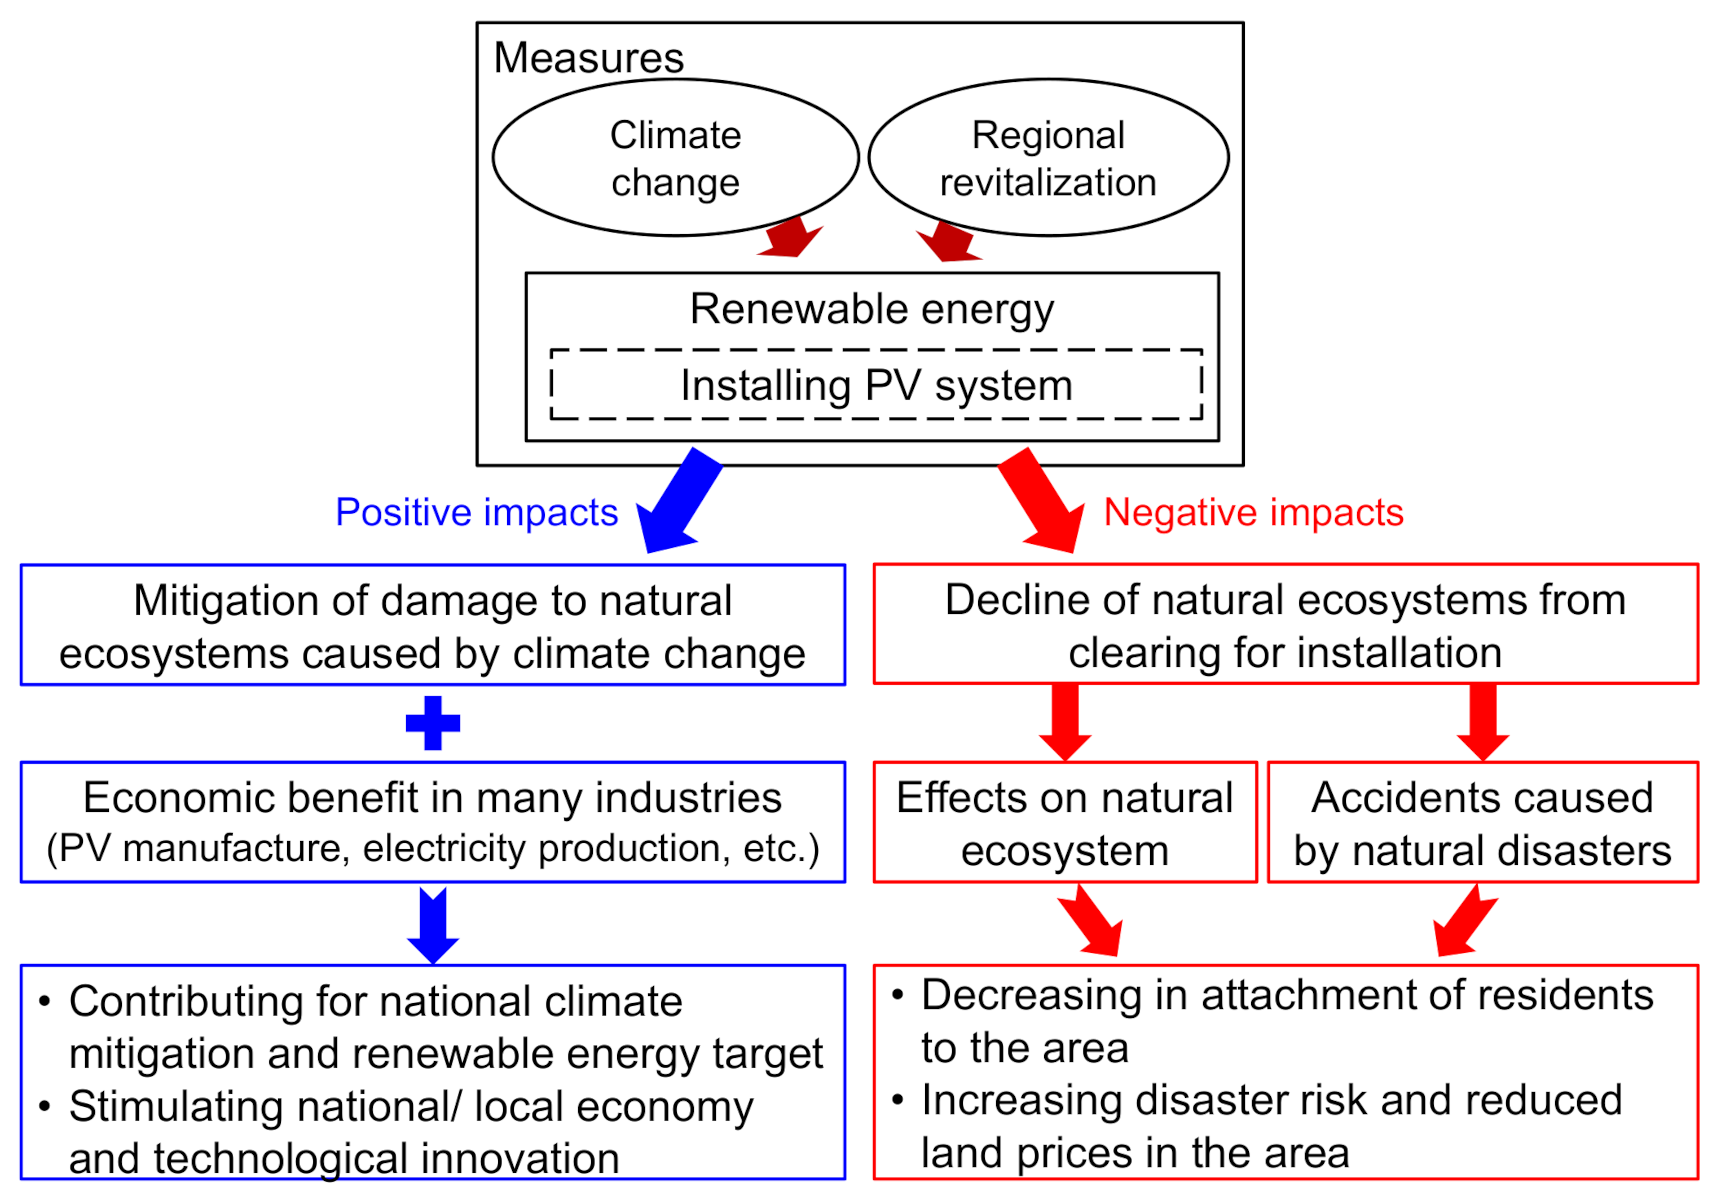
- The costs and benefits (negative and positive impacts) established for installing a PV system by clearing forests and moorlands have been described from environmental, social, and economic perspectives. The most influential benefits (climate change mitigation and economic benefit) and costs (loss of carbon sink, biodiversity loss, and disaster risk) were targeted for quantitative evaluation.
- Climate change mitigation was calculated using GHG emissions released during PV system manufacturing, and applying substitution values for GHG emissions (determining CO2 equivalents for all GHGs) for PV array development and installation. The economic benefit was calculated based on the FIT scheme subsidies gained by plant operation. Carbon sink loss was calculated based on estimates of CO2 absorption by forests, and biodiversity loss was calculated based on the forest area lost to facilitate plant installation. Disaster risk was calculated using map overlays to determine whether PV solar plants were located in landslide hazard areas; it was assumed that such plants would eventually be damaged by landslides, and that all parts of such facilities would become waste, needing suitable disposal.
- A comprehensive evaluation was conducted, using the EIA process from the LCA method. The P/N ratio was also defined to compare the cost and benefits (positive and negative impacts).
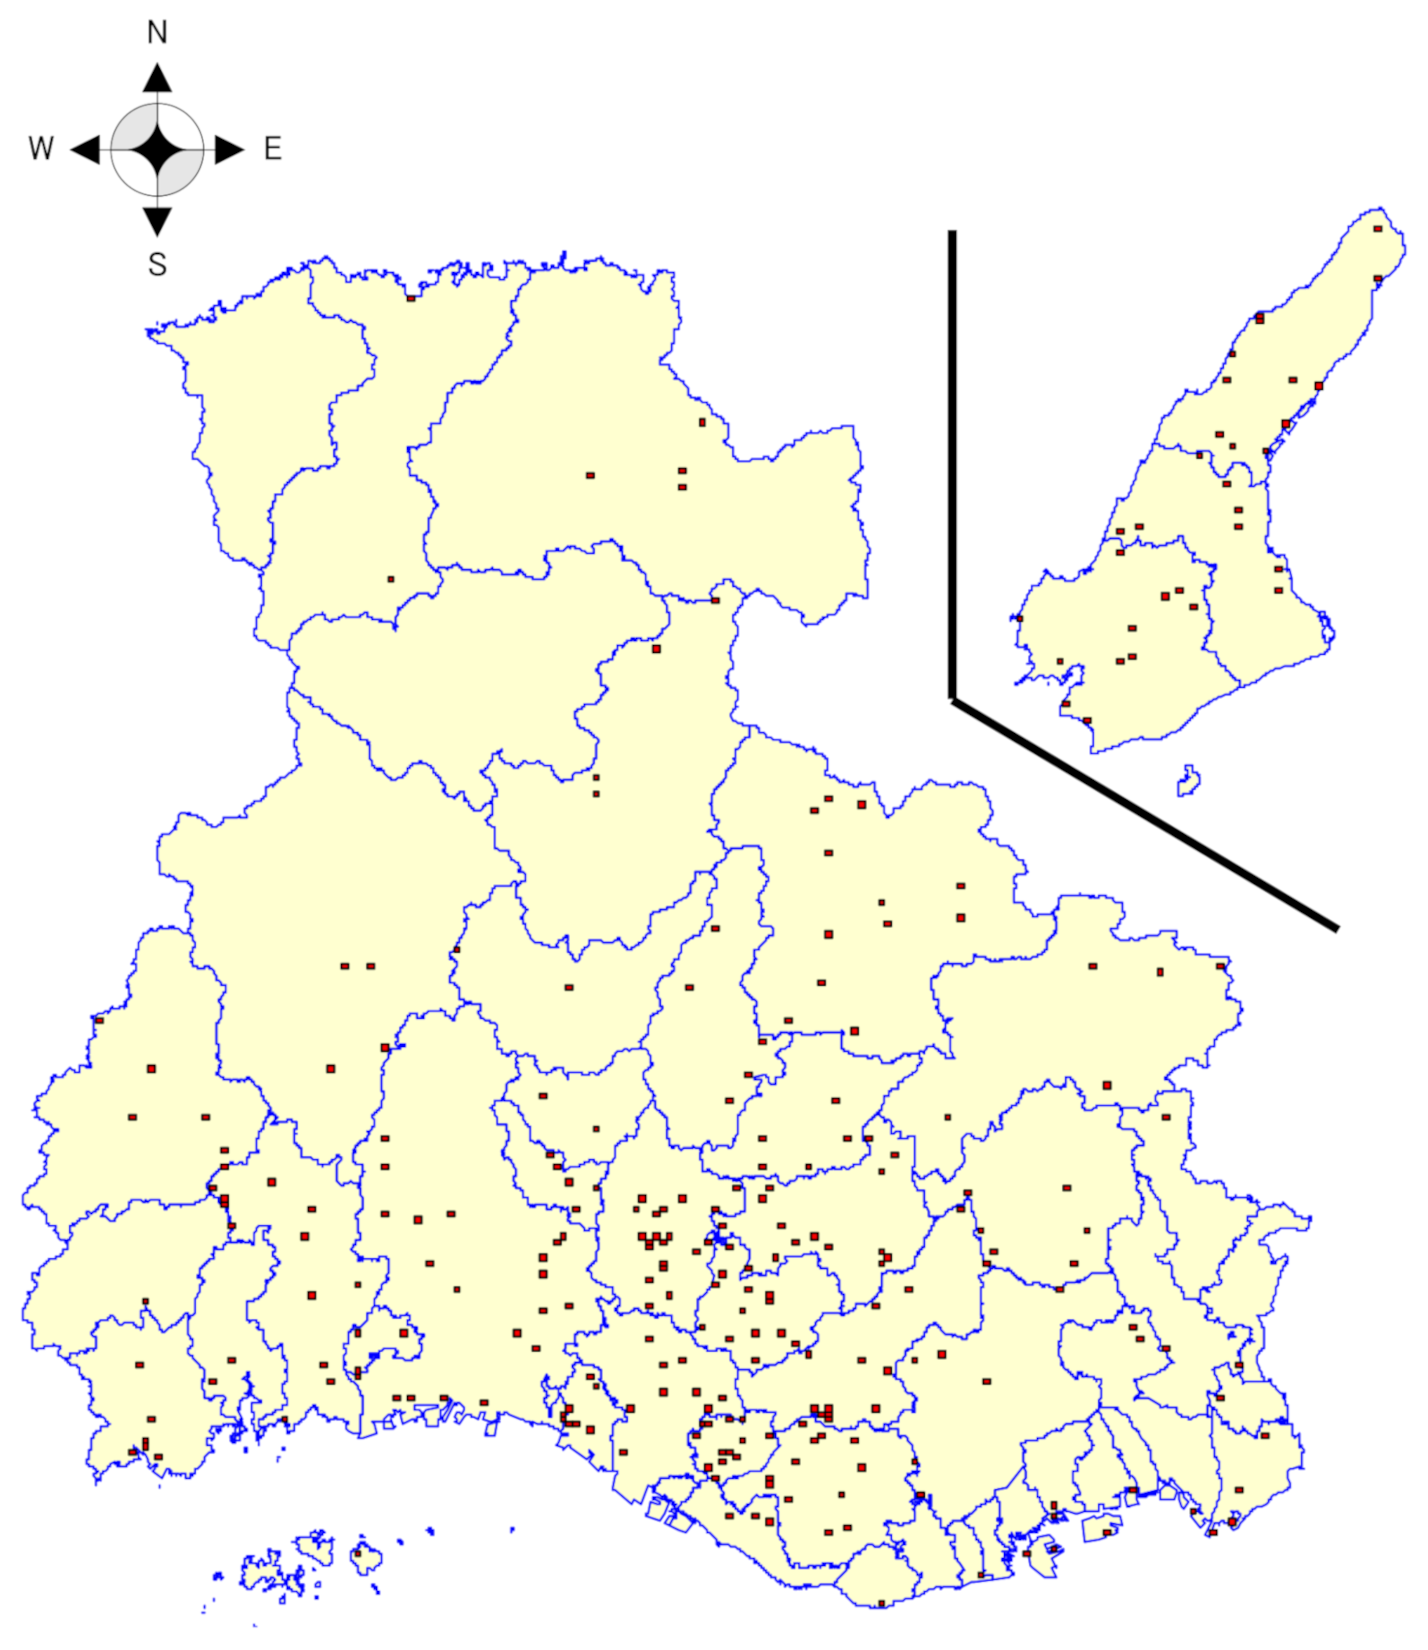
- When this text was drafted, there were 361 mega solar plants installed in Hyogo Prefecture, Japan, of which 92 were installed by clearing natural ecosystems, such as forests, moorlands, and agricultural land. The natural ecosystem area cleared to install these 92 plants was estimated at 3,226,100 m2 using satellite imagery, and 42 of these were found to be located in high-landslide-risk sites. The natural ecosystem area cleared for these 42 plants was calculated to be 2,041,600 m2. We estimated that the mega PV solar plants installed by clearing natural ecosystems had an annual economic benefit of JPY 10,648 million JPY (101.16 million USD), and an estimated annual cost of 7776 million JPY (73.88 million USD). These estimates resulted in a P/N ratio of 1.37, indicating that, by using the methods applied here, the PV solar array economic benefits outweighed their costs, in terms of effects on natural ecosystems.
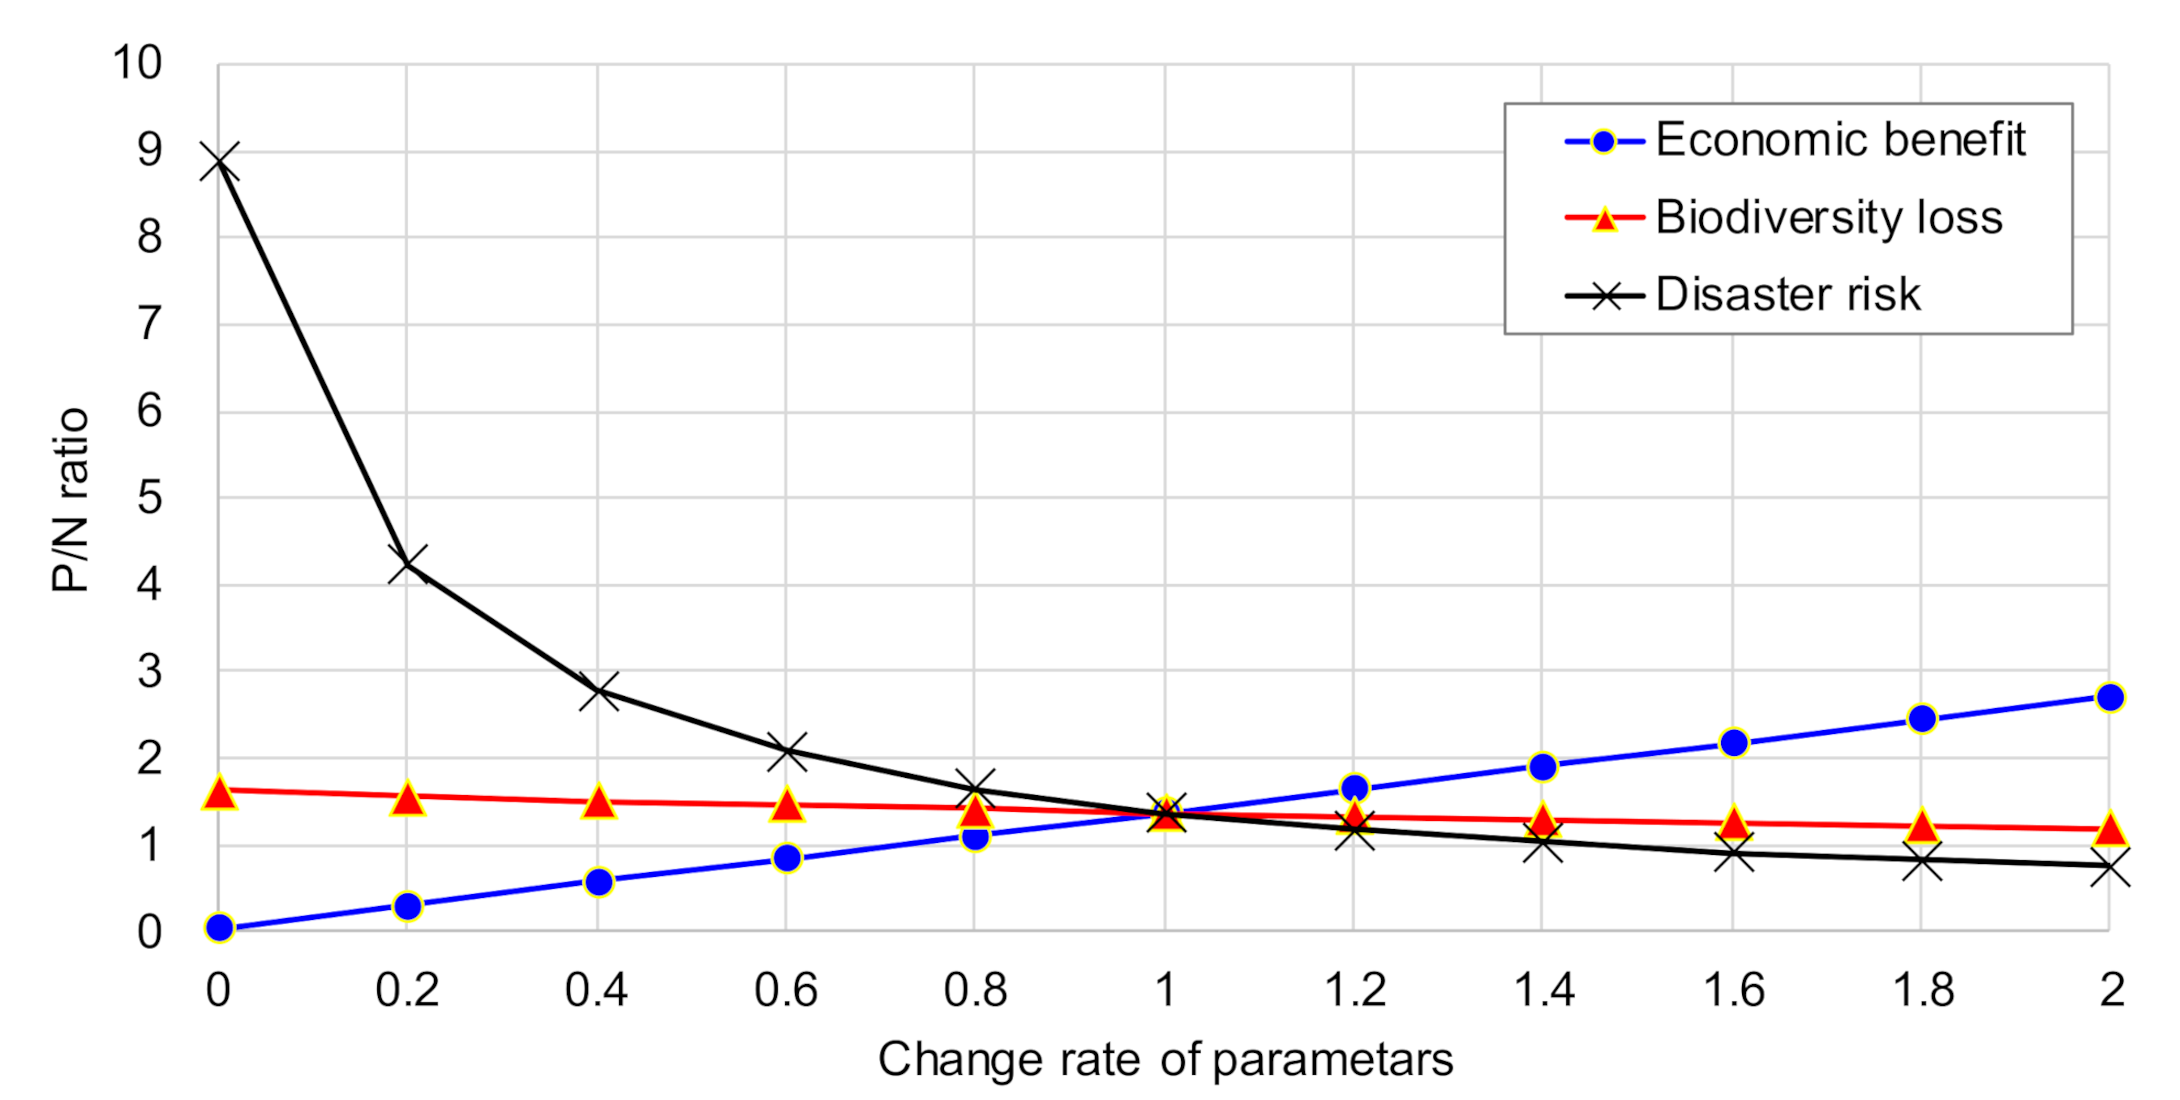
- We found that economic benefit, disaster risk, and biodiversity loss were the parameters with the greatest influence on the P/N ratio, and reviewed the effect of changes to these parameters on the P/N ratio, using sensitivity analysis. We found that the P/N ratio did not go below 1.0, irrespective to any changes in biodiversity value estimates, while, if the economic benefit was reduced by 20% from the default value, the P/N ratio would become <1.0—that is, the costs would outweigh the benefits. We also found that applying disaster prevention measures to reduce disaster risk could be a good way to increase the P/N ratio significantly.
Author Contributions
Funding
Acknowledgments
Conflicts of Interest
References
- Japan Ministry of Environment. Long-Term Low-Carbon Vision. Available online: https://www.env.go.jp/earth/report/h30-01/ref02.pdf (accessed on 23 September 2020).
- Outlook of Long-Term Energy Demand in Japan. Available online: https://www.enecho.meti.go.jp/committee/council/basic_policy_subcommittee/mitoshi/pdf/report_01.pdf (accessed on 23 September 2020).
- International Renewable Energy Agency. Renewable Capacity Statistics 2019. Available online: https://www.irena.org/-/media/Files/IRENA/Agency/Publication/2019/Mar/IRENA_RE_Capacity_Statistics_2019.pdf (accessed on 23 September 2020).
- Electrical Japan, Visualization of Electricity Demand and Supply. Available online: http://agora.ex.nii.ac.jp/earthquake/201103-eastjapan/energy/electrical-japan/ (accessed on 23 September 2020). (In Japanese).
- Japan Photovoltaic Energy Association. Statistics for PV Cell Shipment. Available online: http://www.jpea.gr.jp/document/figure/index.html (accessed on 23 September 2020). (In Japanese).
- Skogen, K.; Helland, H.; Kaltenborn, B. Concern about climate change, biodiversity loss, habitat degradation and landscape change: Embedded in different packages of environmental concern? J. Nat. Conserv. 2018, 44, 12–20. [Google Scholar] [CrossRef]
- Japan Ministry of Environment. Report on Environmental Impact Assessment for PV Plants. Available online: http://www.env.go.jp/press/files/jp/110948.pdf (accessed on 23 September 2020). (In Japanese)
- Japan Ministry of Economy. Trade and Industry, Characteristics of Accidents of PV Systems in Summer. 2018. Available online: https://www.meti.go.jp/shingikai/sankoshin/hoan_shohi/denryoku_anzen/newenergy_hatsuden_wg/pdf/014_01_00.pdf (accessed on 23 September 2020). (In Japanese)
- PV Owner Network, Japan, Report on Ordinances of Municipalities for PV Plants in Japan. Available online: http://www.greenenergy.jp/wordpress/wp-content/uploads/2015/08/PVlocal-regulation.pdf (accessed on 23 September 2020). (In Japanese).
- International Institute for Sustainable Development. Green Conflict Minerals: The Fuels of Conflict in the Transition to a Low-Carbon Economy. Available online: https://www.iisd.org/library/green-conflict-minerals-fuels-conflict-transition-low-carbon-economy (accessed on 23 September 2020).
- Liu, S.-Q.; Mao, X.-Q.; Gao, Y.-U.; Xing, Y.-K. Life cycle assessment, estimation and comparison of greenhouse gas Mmitigation potential of new energy power generation in China. Adv. Clim. Chang. Res. 2012, 3, 147–153. [Google Scholar]
- Ito, M.; Kodo, M.; Nagura, M.; Umeda, Y.; Tsuno, Y.; Kurokawa, K. A life cycle assessment of the Hokuto mego-solar plant. Sol. Energy 2013, 39, 51–60. (In Japanese) [Google Scholar]
- Guo, X.; Lin, K.; Huang, H.; Li, Y. Carbon footprint of the photovoltaic power supply chain in China. J. Clean. Prod. 2019, 233, 626–633. [Google Scholar] [CrossRef]
- Nwaigwe, K.N.; Mutabilwa, P.; Dintwa, E. An overview of solar power (PV systems) integration into electricity grids. Mater. Sci. Technol. 2019, 2, 629–633. [Google Scholar] [CrossRef]
- Koura, A.; Akizuki, H. Planning issues in the conflicting public interests of landscape and renewable energy. J. City Plan. Inst. Jpn. 2017, 52, 1171–1176. (In Japanese) [Google Scholar]
- Bevk, T.; Golobič, M. Contentious eye-catchers: Perceptions of landscapes changed by solar power plants in Slovenia. Renew. Energy 2020, 152, 999–1010. [Google Scholar] [CrossRef]
- Denholm, P.; Margolis, R.M. Land–use requirements and the per-capita solar footprint for photovoltaic generation in the United States. Energy Policy 2008, 36, 3531–3543. [Google Scholar] [CrossRef]
- Sakamura, K.; Kaneko, T.; Numata, M.; Nakai, N. Study on the site character of the ground standing photovoltaic power generating system. J. City Plan. Inst. Jpn. 2014, 49, 633–638. (In Japanese) [Google Scholar]
- Faircloth, G.C.; Wagner, K.H.; Woodward, K.E.; Rakkwamsuk, P.; Gheewala, S.H. The environmental and economic impacts of photovoltaic waste management in Thailand. Resour. Conserv. Recycl. 2019, 143, 260–272. [Google Scholar] [CrossRef]
- Noda, H.; Okuno, Y.; Itsubo, T. The estimated impacts of photovoltaic power systems on varieties of Japanese forest vegetation. J. LCA Jpn. 2015, 11, 172–188. (In Japanese) [Google Scholar]
- Corona, B.; Cerrajero, E.; López, D.; Miguel, G.S. Full environmental life cycle cost analysis of concentrating solar power technology: Contribution of externalities to overall energy costs. Sol. Energy 2016, 135, 758–768. [Google Scholar] [CrossRef]
- Guerin, T. A case study identifying and mitigating the environmental and community impacts from construction of a utility-scale solar photovoltaic power plant in eastern Australia. Sol. Energy 2017, 146, 94–104. [Google Scholar] [CrossRef]
- Mahlandu, N.; Thopil, G.A. Life cycle analysis of external costs of a parabolic trough Concentrated Solar Power plant. J. Clean. Prod. 2018, 195, 32–43. [Google Scholar] [CrossRef]
- Mahmud, M.A.; Huda, N.; Farjana, S.H.; Lang, C. Life–cycle impact assessment of renewable electricity generation systems in the United States. Renew. Energy 2020, 151, 1028–1045. [Google Scholar] [CrossRef]
- Fraser, T.; Chapman, A.J. Social equity impacts in Japan’s mega-solar siting process. Energy Sustain. Dev. 2018, 42, 136–151. [Google Scholar] [CrossRef]
- Bauer, C.; Hirschberg, S.; Bäuerle, Y.; Biollaz, S.; CalbryMuzyka, A.; Cox, B.; Heck, T.; Lehnert, M.; Meier, A.; Prasser, H.-M.; et al. Potentials, Costs, and Environmental Assessment of Electricity Generation Technologies. Available online: https://www.psi.ch/sites/default/files/import/lea/HomeEN/Final-Report-BFE-Project.pdf (accessed on 23 September 2020).
- Mizuho Information & Research Institute, Inc. Actual Situation and Future Outlook for Renewable Energy in Japan. Available online: https://www.mizuho-ir.co.jp/publication/report/2018/mhir15_saiene_01.html (accessed on 23 September 2020). (In Japanese).
- Promotion Council for the “FutureCity” Initiative, Future City Initiative. Available online: http://future-city.jp/en/ (accessed on 23 September 2020).
- Japan Agency for Natural Resources and Energy. Feed-In Tariff Scheme in Japan. Available online: https://www.meti.go.jp/english/policy/energy_environment/renewable/pdf/summary201207.pdf (accessed on 22 October 2020).
- Japan Agency for Natural Resources and Energy. FIT Scheme in Japan. Available online: https://www.enecho.meti.go.jp/category/saving_and_new/saiene/kaitori/fit_kakaku.html (accessed on 23 September 2020). (In Japanese)
- Costanza, R.; D’Arge, R.; de Groot, R.; Farberll, S.; Grassot, M.; Hannon, B.; Limburg, K.; Naeem, S.; O’Neilltt, R.V.; Paruelo, J.; et al. The value of the world’s ecosystem services and natural capital. Nature 1997, 387, 253–260. [Google Scholar] [CrossRef]
- Imamura, E.; Iuchi, M.; Bando, S. Comprehensive Assessment of Life Cycle CO2 Emissions from Power Generation Technologies in Japan. Available online: https://criepi.denken.or.jp/jp/kenkikaku/report/detail/Y06.html (accessed on 23 September 2020). (In Japanese).
- The Research Institute of Science for Safety and Sustainability, National Institute of Advanced Industrial Science and Technology and Japan Environmental Management Association for Industry, LCI Database “IDEA Version 2.2”. Available online: http://idea-lca.com/features/?lang=en (accessed on 23 September 2020).
- New Energy and Industrial Technology Development Organization. Database for the Quantity of Solar Radiation. Available online: https://www.nedo.go.jp/library/nissharyou.html (accessed on 23 September 2020). (In Japanese).
- New Energy and Industrial Technology Development Organization. Guidebook for Installing Electric Power Generation; New Energy and Industrial Technology Development Organization: Tokyo, Japan, 2000; 180p. (In Japanese) [Google Scholar]
- Japan Industrial Standards Committee. JIS C8960 “Words and Terms for Photovoltaic Power Generation”. Available online: https://www.jisc.go.jp/pdfa6/PDFView/ShowPDF/WgAAAOcGcqCKzXYGolxq (accessed on 23 September 2020). (In Japanese)
- Kansai Electric Power Co. Inc. Environmental Data. Available online: https://www.kepco.co.jp/english/corporate/list/environmental/data/pdf/en2019_e_00.pdf (accessed on 23 September 2020).
- Japan Agency for Natural Resources and Energy. Electronic Applications for Renewable Energy in FIT Scheme. Available online: https://www.fit-portal.go.jp/ (accessed on 23 September 2020). (In Japanese)
- Intergovernmental Panel on Climate Change, Special Report Climate Change and Land. Available online: https://www.ipcc.ch/srccl/chapter/chapter-2/ (accessed on 23 September 2020).
- Anwar, A. Does the Age of a Tree Affect Carbon Storage? Available online: https://icp.giss.nasa.gov/research/ppa/2001/anwar/ (accessed on 23 September 2020).
- Japan Ministry of Land, Infrastructure, Transport and Tourism. National Land Numerical Information Download Service. Available online: https://nlftp.mlit.go.jp/ksj/index.html (accessed on 23 September 2020). (In Japanese)
- Japan Photovoltaic Energy Association. Guideline for Ground-Mounted PV Systems. Available online: http://www.jpea.gr.jp/topics/guideline.html (accessed on 23 September 2020). (In Japanese).
- Itsubo, N.; Sakagami, M.; Washida, T.; Kokubu, K.; Inaba, A. Weighting across safeguard subjects for LCIA through the application of conjoint analysis. Int. J. LCA 2004, 9, 196–205. [Google Scholar] [CrossRef]
- Greenhouse Gas Inventory Office of Japan, National GHG Inventory Report of Japan. Available online: http://www-gio.nies.go.jp/aboutghg/nir/2019/NIR-JPN-2019-v3.0_GIOweb.pdf (accessed on 23 September 2020).
- Japan Forest Agency. 2019 Forestry Statistics. Available online: https://www.rinya.maff.go.jp/j/kikaku/toukei/youran_mokuzi2019.html (accessed on 23 September 2020). (In Japanese)
- National Institute for Environmental Studies. Disaster Report for Heavy Rain in Tanba. 2014. Available online: https://dwasteinfo.nies.go.jp/archive/grep/special_141226tamba.pdf (accessed on 23 September 2020). (In Japanese)




| Fiscal Year (FY) | Purchase Rate 1 [JPY/kWh (USD/kWh)] | Fiscal Year | Purchase Rate 1 [JPY/kWh (USD/kWh)] |
|---|---|---|---|
| FY2012 | 42.00 (0.40) | FY2016 | 25.92 (0.25) |
| FY2013 | 37.80 (0.36) | FY2017 | 22.68 (0.22) |
| FY2014 | 34.56 (0.33) | FY2018 | 19.44 (0.18) |
| FY2015 (April 1 to June 30) | 31.32 (0.30) | Since FY2019 | Decided by tendering |
| FY2015 (From July 1) | 29.16 (0.28) | ||
| Product | Material | Weight or Area of Material | GHG Emission | ||
|---|---|---|---|---|---|
| Mount | Steel | 16.2 | [kg/m2] | 2.16 | [kg CO2eq/kg] |
| Aluminum foil | 0.5 | [kg/m2] | 12.6 | [kg CO2eq/kg] | |
| Foundation | Concrete | 107.7 | [kg/m2] | 0.212 | [kg CO2eq/kg] |
| Solar panel | Glass | 1 | [m2] | 26.7 | [kg CO2eq/m2] |
| Aluminum frame | 2.16 | [kg/m2] | 11 | [kg CO2eq/kg] | |
| Plastic | 2.44 | [kg/m2] | 4.55 | [kg CO2eq/kg] | |
| Cell (Crystalline Silicon) | 1 | [m2] | 767 | [kg CO2eq/m2] | |
| Item | Variable | LIME2 Coefficient | Unit |
|---|---|---|---|
| Benefit (positive impact) | Climate change mitigation | 2.33 0.022 | [JPY/kg CO2eq] [USD/kg CO2eq] |
| Cost (negative impacts) | Loss of carbon sink | 2.33 0.022 | [JPY/kg CO2eq] [USD/kg CO2eq] |
| Biodiversity loss | 7420 70.49 | [JPY/m2] [USD/m2] | |
| Disaster risk | 23.80 0.23 | [JPY/kg] [USD/kg] |
| Solar Panel | Mount | Foundation (Concrete) | Total |
|---|---|---|---|
| 11.60 (11.34–13.49) 1 | 16.70 | 107.07 | 135.37 (135.11–137.26) 1 |
| Specifications | Case 1 | Case 2 | Case 3 | Case 4 |
|---|---|---|---|---|
| Total generation capacity [kW] | 750 | 6500 | 9990 | 1990 |
| Land use [m2] | 217,000 | 270,000 | 150,000 | N.A. |
| Location | Mountainside | Factory rooftop | Closed landfill | Holding pond |
| Solar panels | 3534 | 28,160 | 36,480 | 9268 |
| Disaster | Heavy rain | Typhoon | Typhoon | Typhoon |
| Damaged solar panels | 1344 | 13,780 | 13,413 | 733 |
| Potential disaster waste [t] | 299 (268–343) 1 | 3067 (2745–3512) 1 | 2985 (2672–3419) 1 | 34 (31–40) 1 |
| Positive and Negative Impacts | Quantified Results [kg/m2] | Integrated Value by LIME2 [JPY/m2] ([USD/m2]) | Area [m2] | (a) Economic Benefit [Million JPY] ([Million USD]) | (b) Indicator Value [Million JPY] ([Million USD]) | (a) + (b) | |
|---|---|---|---|---|---|---|---|
| Benefit (positive impacts) | Climate change mitigation | 34.70 | 80.85 (0.77) | 3,226,100 | - | 261 (2.48) | 261 (2.48) |
| Economic benefit | - | - | - | 10,387 (98.68) | - | 10,387 (98.68) | |
| (1) Total | - | - | - | - | - | 10,648 (101.16) | |
| Cost (negative impacts) | Loss of carbon sink | 0.25 | 0.58 (0.0055) | 3,226,100 | - | 1.88 (0.018) | 1.88 (0.0018) |
| Biodiversity loss | - | 371.00 (3.52) | 3,226,100 | - | 1197 (11.37) | 1197 (11.37) | |
| Disaster risk | 135.37 | 3221.81 (30.61) | 2,041,600 | - | 6578 (62.49) | 6578 (62.49) | |
| (2) Total | - | - | - | - | - | 7776 (73.88) | |
| P/N ratio | 1.37 | ||||||
Publisher’s Note: MDPI stays neutral with regard to jurisdictional claims in published maps and institutional affiliations. |
© 2020 by the authors. Licensee MDPI, Basel, Switzerland. This article is an open access article distributed under the terms and conditions of the Creative Commons Attribution (CC BY) license (http://creativecommons.org/licenses/by/4.0/).
Share and Cite
Mori, K.; Tabata, T. Comprehensive Evaluation of Photovoltaic Solar Plants vs. Natural Ecosystems in Green Conflict Situations. Energies 2020, 13, 6224. https://doi.org/10.3390/en13236224
Mori K, Tabata T. Comprehensive Evaluation of Photovoltaic Solar Plants vs. Natural Ecosystems in Green Conflict Situations. Energies. 2020; 13(23):6224. https://doi.org/10.3390/en13236224
Chicago/Turabian StyleMori, Kosuke, and Tomohiro Tabata. 2020. "Comprehensive Evaluation of Photovoltaic Solar Plants vs. Natural Ecosystems in Green Conflict Situations" Energies 13, no. 23: 6224. https://doi.org/10.3390/en13236224
APA StyleMori, K., & Tabata, T. (2020). Comprehensive Evaluation of Photovoltaic Solar Plants vs. Natural Ecosystems in Green Conflict Situations. Energies, 13(23), 6224. https://doi.org/10.3390/en13236224


