Abstract
In this paper, the research methodology and the results of the analysis carried out using the acoustic emission (AE) and thermal imaging for a selected oil power transformer are presented. The basis for the research, by means of the AE method, was the author’s patented research method. The AE descriptor maps on the side walls of the tested transformer along with the location of areas with increased AE activity and an analysis of the properties of AE signals recorded at the measurement points located in these areas have been performed. The results showed no partial discharges that could threaten further operation of the tested transformer as well as three areas where increased magnetoacoustic emission occurred. Thermal imaging studies were carried out in the 7.5 μm < λ < 13 μm band. Three areas were located on the calculated thermograms: the entire upper surface of the transformer tank and two areas on the side walls of the tested transformer in which increased IR radiation occurred. The results of the analysis of the research results for the two methods correspond with each other, having a common part, and complement each other giving a broader description of studied phenomena.
1. Introduction
Oil power transformers are an important element of the power system, and detailed rules of their operation and operational research programs are developed to avoid failures [1,2]. Operational testing programs for oil power transformers aimed at avoiding transformer failure include basic, specialist, and periodic tests. In the area of specialist and periodic tests, an important role is played by tests performed without disconnecting the transformer from the network. These are chromatographic analysis of gases dissolved in transformer oil (DGA), tests of the content of furan compounds dissolved in oil, tests of partial discharges (PDs) by electrical, acoustic, chemical, and optical methods, tests of magnetization processes occurring in the magnetic circuit of a transformer, vibroacoustic analysis, and thermal imaging studies.
The DGA method is aimed at identifying damage caused by changes in the condition of the oil–paper insulation caused by the electric field (PDs in particular) and the temperature occurring in the transformer during its operation. The method enables the identification of PD processes, total discharges, and local internal overheating [3,4]. About 70% of common faults can be diagnosed by DGA alone, but to locate the sources of failure, often, additional types of tests are needed [2].
The research of the content of furan compounds dissolved in oil is aimed at assessing the aging of the cellulose insulation of transformers and ultimately determining the degree of polymerization of the cellulose insulation of the tested transformer [5,6].
Research into PDs in oil power transformers plays an important role, as statistically, most of the failures of such transformers are electrical insulation failures, for which the key indicator is the occurrence of PDs [1,7]. PDs are of an electrical nature and are accompanied by acoustic, chemical, and optical phenomena; therefore, different measurement methods for PDs testing are used [8,9].
In the online research of PDs, two electrical quantity measurement methods are available. They are the ultrahigh frequency (UHF) method and pulse capacitive coupler method [9,10]. Research of PDs with the acoustic method are aimed at registering elastic waves generated in the sources in the deformational processes activated by PDs and then propagating in the tested object, as well as analyzing the recorded signals and locating the sources of these signals [11,12]. This test method is called the acoustic emission (AE) method.
In the magnetic circuit of the transformer, magnetization processes take place. The registration of signals generated in these processes, and then the analysis of their properties and the location of the sources of these signals [13] is most often carried out as part of acoustic measurements, and this method has the name of the magnetoacoustic emission (MAE) [14,15].
During the transformer operation, there are also magnetostrictive vibrations and other mechanical vibrations. Vibroacoustic analysis deals with the study of these phenomena. Vibroacoustic analysis enables the identification of magnetostrictive vibrations and core damage as well as separate evaluation of the technical condition of the core and windings [16].
The AE and MAE methods and vibroacoustic analysis are acoustic methods, and they are based on the analysis of signals in different frequency bands, which are the main bands for particular types of signals.
Thermal imaging studies are aimed at obtaining thermograms for the transformer tank and transformer accessories [17,18]. Elevated temperatures can indicate many faults in the operation of the transformer. The analysis of thermograms of the transformer tank surface using thermal models and the international standards gives the possibility that the point of the highest temperature inside a transformer (in the core or winding) can be predicted. This is very important, as the insulation temperature of the windings and the insulation of the magnetic segments determines the lifetime of the insulation [19].
The importance of PDs research in oil power transformers leads to the development of solutions in which the research is carried out in parallel by several methods. Such solutions make it possible to build a broader description of the phenomena studied and to improve the accuracy of the interpretations made for the obtained results of the analyzes [20,21].
The authors of the paper working at the Silesian University of Technology have been dealing with PDs research for over twenty years [22]. These are mainly research studies using the AE method [23,24,25]. Some of them were carried out simultaneously with the AE method and the electric method, and the results obtained with the electric method were the basis for the calibration of the results obtained with the AE method [26,27]. The 8AE-PD measurement system dedicated to PDs tests in such transformers was built [28]. This system was calibrated in laboratory tests [29]. A research method based on the map of acoustic emission descriptors in the frequency domain was developed [30]. In total, a dozen or so oil power transformers have been tested. For the four tested transformers, PDs with values requiring renovation or internal inspections were identified and located: renovation was necessary in two cases where PDs were located in the winding insulation [31,32], revision was made in other two cases where PDs were located outside of the winding insulation (finally, the PDs sources were removed, and these two transformers are still operating). Using the 8AE-PD measurement system, MAE studies were also carried out, identifying the signals coming from and locating the sources of these signals [15].
It should be added that in an oil power transformer, the presence of PDs with high apparent charge values and magnetization processes occurring in the magnetic circuit, giving high values of MAE signals, leads to a local increase in temperature.
The authors of the paper, working at the University of Applied Sciences in Tarnow, have been dealing with thermovision research in electric power devices and oil power transformers for more than 7 years [33,34]. The university’s cooperation with an electricity distribution company has resulted in a wider implementation of thermal imaging methods for early damage detection, as a supplementary method to standard diagnostics and equipment monitoring.
Having regard to two facts—(I) thermal imaging measurements give direct temperature surface distributions in an oil power transformer, which corresponds to the equipment inner temperature distributions, and (II) the presence of AE and MAE signals with high activity is associated with a local increase in temperature in the oil energy transformer—the authors of the paper have undertaken the implementation of a project aimed at carrying out research on an oil power transformer using two methods in parallel, i.e., the thermal imaging and the AE method. Such tests were carried out on a selected transformer.
The paper presents a tested transformer, both the testing method and the results of the analysis of the obtained test results. This analysis was performed in two stages: analysis of test results under individual methods and then analysis of the results within both methods together. The last stage showed that the research results for the two methods correspond with each other, having a common part, and they complement each other giving a broader description of the studied phenomena.
2. The Tested Transformer
The diagnosed object was an oil power transformer; the transformer has been operating for over 40 years. Its parameters are as follows: 110/15/6 kV winding voltage (YNd11d11), 50 Hz, 40 MVA; winding power: 40,000/25,000/25,000 kVA; oil mass of 21,800 kg; and total mass of 72,000 kg. The transformer is oil cooled, and the oil circulation in the tank is powered by a circulating pump. If the temperature of the oil rises excessively, then the cooling system is supported by fans that force air to the radiator. During the measurements, the power load of the transformer was less than 50% of its nominal power (this is a typical power load for regular work of the power transformers in this distribution system), the current was 35 A (110 kV voltage), 280 A (15 kV voltage), and no current was in the 6 kV windings, one of the fans operated and cooled the oil in the transformer.
3. Testing Using the Acoustic Emission Method
3.1. Introduction
In a working oil power transformer, there are numerous phenomena, the occurrence of which causes acoustic impulses to be generated in the sources and then propagate in the volume of the transformer as acoustic signals. They are:
- (a)
- acoustic emission (AE) signals generated during deformation processes [11,20] that accompany partial discharges (PDs) [8,35,36],
- (b)
- magnetoacoustic emission (MAE) signals generated by numerous phenomena that occur during the magnetization of the ferromagnetic materials [13,14],
- (c)
- acoustic signals generated during oil circulation in the transformer,
- (d)
- vibroacoustic signals, and
- (e)
- outer acoustic interference.
The study of acoustic signals that are generated by the modeled sources led to the following conclusions: in the 100–200 kHz band, signals from acoustic phenomena that accompany partial discharges are dominant; in the 20–100 kHz band, there are acoustic signals from many phenomena, such as, among others, acoustic phenomena that accompany partial discharges, phenomena associated with the process of the magnetization of ferromagnetic materials and acoustic phenomena generated by the circulation of the transformer’s oil; the 20–40 kHz band is the dominant band for acoustic signals generated during some types of partial discharges and during phenomena associated with the magnetization process of ferromagnetic materials.
The acoustic emissions test method that was used [30] consists of the following elements: an 8AE-PD measurement system, the construction of a network of measurement points on the side walls of the transformer’s oil tank, mounting the EA sensors, checking the quality of the mounting of individual sensors using the Hsu-Nielsen method, analysis of the properties of the acoustic emission signals generated during the Hsu-Nielsen tests, data recording, determining the author’s maps of the descriptors on the side walls of the tested transformer, together with the location of the areas with increased acoustic emission activity, analysis of the properties of the acoustic emission signals recorded at the measurement points in areas identified as local maxima on the descriptor maps along with identification of the sources of the registered signals.
3.2. The 8AE-PD Measurement System and the Measurement Method
During the investigation, the 8AE-PD measurement-research system was used [28,29]. It is a computer measurement system dedicated to locating and describing PDs in oil power transformers using the acoustic emission method. A block diagram of the measurement system is presented in Figure 1. A view of the measurement system is presented in Figure 2a.
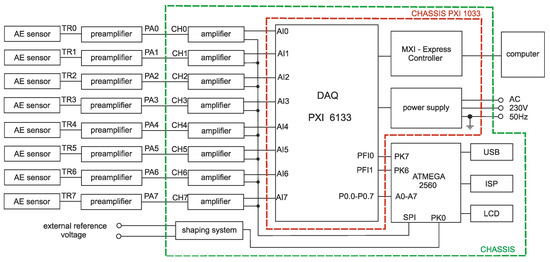
Figure 1.
Block diagram of the measurement 8AE-PD system. AE: acoustic emission, PD: partial discharge.
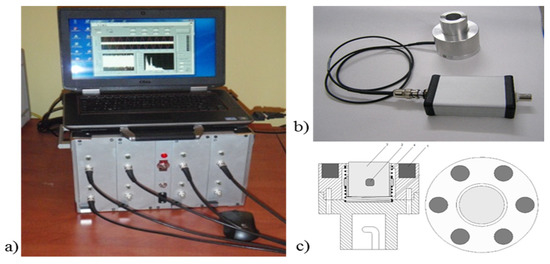
Figure 2.
(a) The measurement system 8AE-PD; (b) the AE sensor in the housing together with the amplifier; (c) the construction of the magnetic holder.
This system has eight independent measurement channels; simultaneous recording of the signals in up to all eight measurement channels is possible, and it provides the opportunity to locate the source of AE signals. The gain of the system is fully controlled by its software with a dynamic range of 65 dB for input signal changes (preamplifier + amplifier). The built-in preamplifier is based on a low-noise AD8421 instrumentation amplifier manufactured by Analog Devices; the bandwidth of the amplifier is from 20 to 1000 kHz.
The system is equipped with the authors’ software written in LabVIEW, which enables monitoring of the signals, recording of the data in real time (within the band of 20–1000 kHz), and basic (in the domains of time, frequency and time-frequency) and advanced (in the domains of discrimination threshold) analysis of the recorded signals. Mounting magnetic holders that enable the measurement sensor to be fixed to the tested object in a stable manner are also essential elements of the 8AE-PD system. In the presented solution, a set of neodymium magnets located in a housing (Figure 2b), together with an appropriate system of springs (Figure 2c), was used. The authors have obtained patent protection for this novel holder [37].
Testing and scaling of the 8AE-PD measurement system were carried out during laboratory tests [29]. The investigations of PDs coming from a modeled source were performed in parallel by two methods: the AE method with the use of the constructed measuring system 8AE-PD and the electrical method with the use of the PD measuring system of type TE 571 produced by Haefely Trench Tettex Instruments. The investigation results obtained from the electrical method, particularly the measurement of the apparent charge introduced by the PD source, were the reference for the results from the AE method.
During the research, the voltage U was applied to the modeled PDs source, and using the measuring system of type TE 571, the apparent charge Q introduced by the modeled source was measured, and using the 8AE-PD measuring system, the signals generated by the PD source located in the modeled tank were recorded in the measurement channels containing AE sensors of the D9241A type and WD type mounted on the outside surface of the tank at a distance of 29 cm from the source. In order to calibrate the 8AE-PD system, ADC descriptors for the recorded signals were calculated. The calibration results are shown in Table 1.

Table 1.
The results of calibration of measuring system 8AE-PD.
The limit values of the apparent charge introduced by the PD source, for which the recorded signal can be identified as that coming from the PDs, is 20 pC for the 8AE-PD computer measurement system with AE sensor type D9241A. Thus, the 8AE-PD is an apparatus that can provide sufficient sensitivity for the registration of the phenomena of PDs, and its sensitivity is comparable to the data provided by the manufacturers of dedicated applications for the study of the phenomena of PDs [38,39], and it is even used by global leaders in developing and manufacturing acoustic emission equipment for industrial inspection and monitoring applications [40,41].
This research began with determining the network of the measurement points on the side walls of the oil power transformer tank that would ensure the determination of the sources of AE signals within the tested transformer. In the second step, measurements to register the AE signals were carried out. Finally, the recorded signals were then analyzed.
The process of taking the measurements included mounting the AE sensors, checking the quality of the mounting of individual sensors using the Hsu–Nielsen method; this was done by means of analyzing the properties of the AE signals generated during the Hsu–Nielsen tests and then registering the AE signals that reached the mounted AE sensors.
The analysis of the recorded signals was carried out in two stages. During the first stage, the signals were analyzed in the domain of the discrimination threshold, and finally, the Amplitude Distribution of Counts (ADC) descriptor maps on the side walls of the tested transformer tank were determined. During the second stage, a fundamental analysis of the signals that were registered at the measurement points in areas with increased AE activity (from the analysis determined in the first stage) was performed. Within this analysis, the registered signals were filtered in selected frequency bands, and they were then analyzed in the domains of time, frequency, and time-frequency to produce an acoustic image of the analyzed signal. This stage of the analysis was aimed at identifying the signals and the sources of the signals.
3.3. Building the Network of Measurement Points
In the research conducted, seven D9241A resonance AE sensors and one WDI wideband AE sensor were used. During the tests, D9241A AE sensors were located on the side walls of the tested transformer; a network of measurement points was built to ensure the AE signal sources in the transformer could be located. In practice, AE sensors were placed in a line at distances of about one meter from each other, and then, the entire line was moved vertically by about half a meter (five heights for the locations of the AE sensors were used for the tested transformer). Then, the AE sensors were moved horizontally to new positions, and tests were carried out so as to cover the entire side walls of the tank with measurement points (three such placements of the AE sensors were needed for the tested transformer). The wideband AE sensor was placed at selected measurement points with high AE activity, and this was necessary to analyze the properties of the recorded signals over a wide frequency band.
3.4. Properties of the AE Signals Generated during the Hsu–Nielsen Tests
Each time the AE sensors were attached to the tank, Hsu–Nielsen (H-N) tests were first carried out in order to check the quality of the installation of the individual sensors.
Table 2 provides information about the location of the AE sensors on the side walls on the tank of the tested transformer (during AE sensors arrangement) and parameters of AE signals (peak-to-peak amplitudes Upp and ADC descriptor values) recorded with sensors mounted at a distance of 5 cm from Hsu–Nielsen sources.
Table 2.
The AE sensors location (for one of particular configuration) and parameters of AE signals (peak-to-peak amplitudes Upp and Amplitude Distribution of Counts (ADC) descriptor values) recorded with sensors mounted at a distance of 5 cm from Hsu–Nielsen sources.
In a separate row of Table 2, there are calculated values for the set of seven D9241A AE sensors. These values confirmed the good quality of the installation of the sensors, which was in accordance with the requirements of the PN-EN 14584:2013-07 Standard; the peak-to-peak amplitude Upp of the signal recorded with the sensor mounted at a distance of 5 cm from the Hsu–Nielsen source for each sensor is within the range [average value for set TR0-TR6 − 3dB, average value for set TR0-TR6 + 3dB]. It is worth noting that the values of the peak-to-peak amplitudes of the signals after filtration in the 100–200 kHz and 60–100 kHz bands are similar; the higher values of these amplitudes after the signal that were filtered in the 20–60 kHz band were caused by the maximum that occurred due to the amplitude–frequency characteristics of the D9241A AE sensors. The peak amplitudes for the wideband sensor are smaller due to the lower sensitivity of this sensor.
The fundamental properties of the AE signals that were generated during the Hsu–Nielsen tests result from the fact that during these tests, propagating modes are generated in the metal plate that makes up the wall of the transformer tank. These modes are longitudinal waves, transverse waves, and Lamb waves (symmetrical and antisymmetric modes). The energy contributions of the different modes are different, and the propagation rates of these modes are also different; these properties can be seen in Figure 3 and in Table 2 and Table 3.
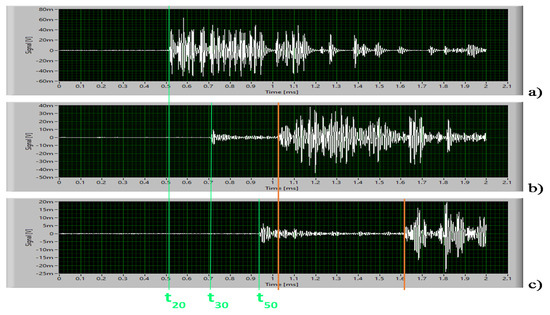
Figure 3.
Signals recorded in the measurement channels (a) CH2; (b) CH3; (c) CH5, during the Hsu–Nielsen test performed next to the TR2 sensor after filtering of the signals in the 100–200 kHz frequency band.
Table 3.
Peak-to-peak amplitudes Upp and ADC descriptor values for the AE signals recorded with sensors TR3 in CH3 during the operation of Hsu-Nielsen sources located next to the different AE sensors.
Figure 3 shows the signals recorded in the CH2, CH3, and CH5 measurement channels during the Hsu–Nielsen test that was carried out next to the TR2 sensor. The time waveforms signals from Figure 3 show the following properties of the generated signal: the signal dispersion is visible as the length of the propagation path increases, the energy of the Lamb modes is greater than the energy carried by the longitudinal wave; the longitudinal wave speed that was calculated from the signal arrival times for the individual sensors (t20, t30, t50) in the arrangement of the AE sensors, shown in Table 1, is 5800 m/s.
Table 3 shows the peak-to-peak amplitudes Upp and the values of the ADC descriptors for the AE signals recorded with the TR3 sensor in the CH3 measurement channels during the operation of the H-N sources at various locations (the H-Nn source next to the TRn sensor). For each of the analyzed frequency bands, the Upp amplitude has the maximum for the measurement situation when the H-N source is next to the TR3 sensor and decreases as the H-N source moves away from this AE sensor. The calculated AE attenuation coefficients for the individual frequency bands are as follows: β (100–200 kHz) = 2.76 dB/m, β (60–100 kHz) = 2.26 dB/m, and β (20–60 kHz) = 1.03 dB/m. The calculated changes in the value of the ADC descriptor with distance are γADC (100–200 kHz) = 23.8 m−1, γADC (60–100 kHz) = 5.7 m−1, and γADC (20–60 kHz) = 4.1 m−1. It is worth noting the large value of these changes that occur in the 100–200 kHz band.
3.5. Maps of the ADC Desriptors on the Side Walls of the Transformer Tank along with the Location of Areas with Increased AE Activity in Selected Frequency Bands
After obtaining a positive result when checking the quality of the mounting of the AE sensors (for each particular configuration), the AE signals reaching the AE sensors were then recorded. Then, ten signals were recorded at each measurement point; each signal had a duration of one second (approximately 50 cycles of the voltage supplying the transformer).
Then, the analysis of the recorded signals was carried out in two stages. During the first stage, the signals in the domain of the discrimination threshold were analyzed: all the signals were filtered in the selected frequency bands: 100–200, 60–100, and 20–60 kHz. Then, the author’s ADC descriptors were calculated [9,16], and finally, the ADC descriptor maps on the side walls of the tested transformer tank were determined (Figure 4). These maps were determined using the kriging method, whereas the data for the map designation are average values of the descriptors at the individual measurement points.
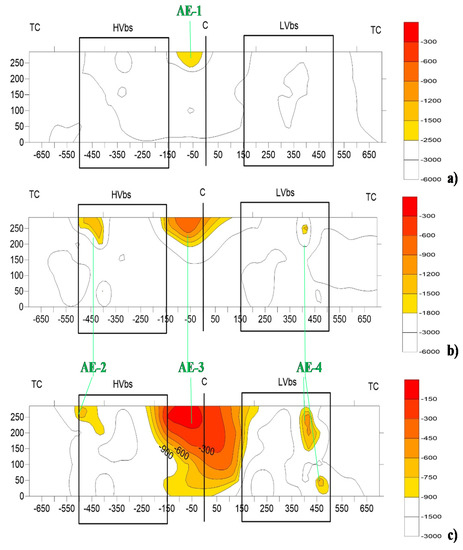
Figure 4.
Maps of the ADC descriptor values on the lateral walls of the tank of the tested transformer within the chosen frequency bands: (a) 100–200 kHz; (b) 60–100; (c) 20–60 kHz with the localized areas AE-1, AE-2, AE-3, and AE-4. Description of the points within the maps: (X; Y) in centimeters - coordinate of the points at the side walls of the tested transformer tank: X- position running along the transformer tank, (0-the point opposite to the center of the tap changer (TC), positive X values for part of the tank from the low voltage bushing side (LVbs), negative X values for part of the tank from the high voltage side (HVbs), Y-height running up the tank (0-bottom of the tank).
As can be seen in Figure 4, the grids developed for the maps are the side walls of the tested transformer tank, where each point has coordinates (X, Y) given in centimeters.
- X-position running along the transformer tank, (0-the point opposite the center of the tap changer (TC), positive X values for the part of the tank from the low voltage bushing side (LVbs), negative X values for the part of the tank from the high voltage bushing side (HVbs),
- Y-height running up the tank (0-bottom of the tank)).
The map drawn after filtering of the signal in the 100–200 kHz band (Figure 4a) shows one area described with AE-1 where AE signals with increased activity were recorded. On the other maps, three such areas can be seen (AE-2, AE-2, AE-4), whereby these areas became larger after filtering of the signal in the 20–60 kHz band, and they contain areas that are visible on the maps after filtering of the signal in the 60–100 kHz band.
3.6. Properties of AE Signals from Localized Area with Increased AE Activity on ADC Desriptor Map in the 100–200 kHz Band
During the second stage, a fundamental analysis of the signals that were registered at the measurement points in areas that showed increased AE activity (determined by the analysis in the first stage) was performed. This stage of the analysis was aimed at identifying the signals and the AE sources.
The information on the location of AE-1 area (Figure 4a) in the transformer that was tested is as follows: it is in the upper part of the transformer, where the amplitudes of the strength of the electric fields were sufficient for the respective phases of the supply voltage to fulfill the conditions of PD initiation in the sources, and it is in the area of maximum circulation of the cooling oil for the working transformer. The signals registered in area AE-1 have very varied ADC descriptor values (the average value of the ADC descriptor is −1963 and the average standard deviation is 996). Such a value compared to the results obtained during the calibration of the 8AE-PD computer measurement system with AE sensor type D9241A corresponds to PDs of approximately 100 pC.
Figure 5 shows the acoustic images for the selected AE signal. In order to determine the acoustic image of the recorded signal, the signal was first filtered in the 100–200 kHz band. Then, the following characteristics were determined: time course of the recorded pulse, phase–amplitude characteristics of the signal module, and the Short-Time Fourier Transform (STFT) spectrogram.
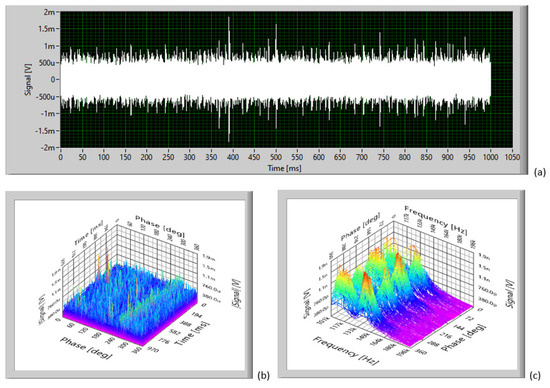
Figure 5.
Acoustic image of a selected AE signal from area AE-1 within the map from Figure 4a (after filtration of the AE signal within the 100–200 kHz band): (a) transient signal; (b) phase-time characteristic; (c) averaged Short-Time Fourier Transform (STFT) spectrogram. AE signal parameters: ADC = −3020, Upp = 3.68 mV, Urms = 0.15 mV.
The phase–time characteristic is obtained in the following way: the transient signal’s absolute value is calculated, the modified signal is divided into fragments with a length of one supply voltage period, and ultimately, these fragments are folded one after the other and stitched as the phase-time characteristic. The “tunnel” in such a characteristic confirms the periodic character of the analyzed signal.
The STFT spectrogram of the signal is calculated as the average spectrogram of all the spectrograms that are calculated for the signal in successive periods of the supply voltage.
Figure 5 shows the acoustic image of the AE signal with an ADC descriptor value of −3020 (Upp = 3.68 mV, Urms = 0.15 mV). Within the signal, there are numerous time structures that occur four times during the supply voltage’s period (they occur at the times when the supply voltage’s phases are close to the values of 50° and 230° as well as 130° and 310°). These time structures do not come from partial discharges, and they are magnetoacoustic emission signals with harmonic components that are higher than 100 kHz [13,14,15]. These structures produce four “tunnels” in the amplitude–phase characteristics of the signal module and eight areas on the STFT spectrograms (in each phase band, there are two structures for the 100–125 kHz and 135–145 kHz frequency bands).
In the registered signals (Figure 5), there are a few time structures that occur at specific intervals in the supply voltage phases; these do not occur periodically. The transient signal and the Fourier transform of such a signal that is registered with a wideband AE sensor is shown in Figure 6.
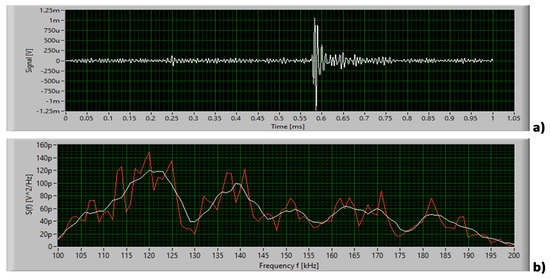
Figure 6.
(a) The transient signal; (b) Fourier transform of a fragment of the AE signal registered with a WDI type wideband sensor, signal duration ∆t = 30 μs.
The estimated duration of such a structure is about 30 μs, and its amplitude is too large to be an impulse generated in the PD source; however, it could be an impulse generated in the PD source that changed during propagation and detection, resulting in the recorded signal. For these few large signals, the following details are important: the signals only occur at certain phase intervals of the supply voltage, the signals have low ADC descriptor values, these are not signals that occur periodically as the supply voltage changes. In addition to these facts, from the location of area AE-1, it can be concluded that these signals originate from PDs generated in bubbles that are generated in the circulating cooling medium, and they are not significant in the further operation of the tested transformer.
3.7. Properties of AE Signals from Localized Areas with Increased AE Activity on ADC Descriptor Maps in the 60–100 kHz and 20–60 kHz Bands
An acoustic image of a typical AE signal that was recorded in localized areas with increased AE activity on the ADC descriptor maps in the 60–100 kHz and 20–60 kHz bands is shown in Figure 7. This acoustic image was obtained after filtration in the 20–100 kHz band. A detailed analysis of the characteristics presented in Figure 7 indicated the presence of the following signal properties:
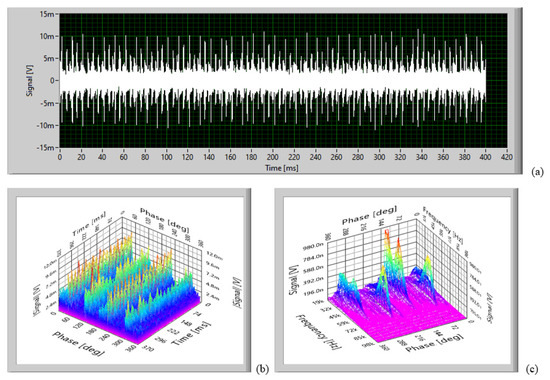
Figure 7.
Acoustic image of the selected AE signal from area AE-2 within the map from Figure 4c (after filtration of AE signal within the 20–100 kHz band): (a) transient signal; (b) phase–time characteristic; (c) averaged STFT spectrogram. AE signal parameters: ADC = −351, Upp = 27.47 mV, Urms = 1.59 mV.
- (a)
- four “tunnels” on the phase-time characteristic; the signal has periodic properties within four bands of the supply voltage’s phases,
- (b)
- there are eight structures on the STFT spectrogram that describe the frequency properties of the periodic signals; four of them have a main band of 35–45 kHz, and the other four have a main band of 45–65 kHz.
Figure 8 shows a fragment of the AE signal with a duration of 20 ms (one period of the supply voltage) and the separated parts of the signal with their Fourier transforms. There are four time structures in the signal (Figure 8a). These structures contribute to the four “tunnels” shown in Figure 7b. These four structures can be divided into two groups of two signals each. In one group, there are signals where the main band of the signal is 45–65 kHz, the estimated duration of such a structure is 100 μs; these signals occur at times when the supply voltage phase is near 50° or 230°. In the second group, there are signals for which the main band of the signal is 35–45 kHz, and the estimated duration of such a structure is 200 μs; these signals occur at times when the phase of the supply voltage is near 130° or 310°.
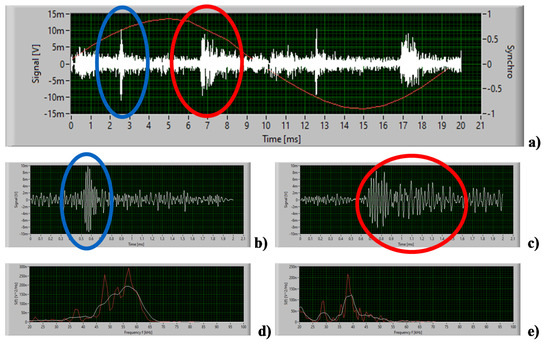
Figure 8.
(a) The recorded AE signal with a duration of one period of the supply voltage (20 ms); (b,c) two time structures separated from the signal; (d,e) Fourier transforms of signals from Figure 8b,c (respectively).
The described properties of the signals visible in Figure 7a and Figure 8a indicate that these are typical properties for magnetoacoustic emission signals originating from deformational processes that occur during the magnetization and demagnetization of the transformer’s core material [13,15]. Hence, in AE-2, AE-3, and AE-4 areas, the processes of magnetization and demagnetization of the ferromagnetic materials are the sources of the recorded signals. As can be seen from Figure 7 and Figure 8, the highest intensity of the MAE signals with high activity occurs in the 20–60 kHz frequency band (Figure 4c). Ultimately, the most advanced deformation processes that produce signals with the highest ADC descriptor values occur in the AE-3 area, followed by the upper part of the AE-4 area and then the lower part of the AE-4 areas and AE-2 area. The process that produces a hysteresis loop for magnetic materials results in the dissipation of energy and can cause local macroscopic temperature changes. If these deformation processes cause local temperature changes in the transformer, then the maximum temperature changes should be expected in a part of the AE-3 area and followed by a small upper part of the AE-4 area and by a lower part of the AE-4 area and AE-2 area.
It is also worth noting that the properties of the signals from Figure 8b,c differ from the properties of the signal visible in Figure 6a, and this differentiation of the signals confirms that the signals located in the AE-1 area are generated in other types of deformation processes, i.e., deformation processes accompanying the PDs phenomena.
4. Testing with the Thermal Imaging
4.1. Introduction
Thermography is an efficient, contactless, and widely applied diagnostic technique. An element overheating, which can be distinguished on the surface of a transformer as a “hot spot”, might be evidence of the incorrect condition of the machinery or poor work parameters. Power transformers are crucial elements in the distribution system; an atypical distribution of a transformer’s surface temperature might be evidence of progressive deterioration of the machinery’s elements (core, winding, connections, or clamps) and/or the deterioration of the electrical isolation (such as paper or oil) [33,42].
The damage that occurs in a power transformer can result from the following: partial discharges, complete discharges, overheating, damage to the tap switch, and contaminants in the oil (such as sulfur or fine particles). Since these processes deteriorate the insulation condition and shorten the transformer’s lifetime, the following parameters of the transformers are constantly monitored: the temperature of the core, the temperature of the windings and the oil temperature, the oil humidity, the gases dissolved in the oil (for example, hydrogen, acetylene, other explosive gases, carbon dioxide, and carbon monoxide). Smaller transformers are regularly tested and diagnosed, but not all of the parameters are monitored on-line. In this case, a quick detection of overheating is necessary, for example through the use of thermography [33,42].
The analysis and the experiments on the temperature distribution inside the transformer’s core and the winding, as well as the cooling oil flow, confirmed that the coolest section should be the lowest part of the transformer’s surface, and the hottest section should be the upper/top part of the transformer’s surface; the increase of the surface temperature is almost linear. Then, a typical temperature distribution for the oil-cooled power transformer was compared to the international standards and the computer system (supporting the monitoring and the maintenance of the electrical power machinery). A thermal model of the transformer was also implemented in accordance with the international standards. The point of the highest temperature inside a transformer (in the core or winding) can be predicted from the surface temperature [17,18,19].
The combination of several detection methods or damage diagnostic tests will give a more complete picture of the actual state of the tested equipment (electrical, IR, ultrasound, dissolved gas analysis etc.) [34,43].
4.2. Thermal Imaging Reaserch Method
During the investigation, the temperature distribution on the surface of a single device was examined. In the course of the investigation, the thermograms were recorded at the same time as the acoustic recording in May 2018. Additional thermograms were carried out in February 2019 to compare the IR emission from the device under different ambient conditions. A FLIR E50 thermal imaging camera was used for the measurements, the specification of which is spectral range 7.5–13 μm, detector type-focal plane array, uncooled microbolometer 240 × 180 pixels, image refresh rate 60 Hz, thermal sensitivity (N.E.T.D.) 0.05 °C, at +30 °C; precision ±2 °C, temperature range −20 to 650 °C.
The measurements were taken from different sides of the transformer in order to cover most of its surface and to compare the different areas. The distance between the camera and the analyzed object varied from 2 up to 4 m. In the course of the measurements, additional information was collected: air temperature and relative humidity. The main meteorological information was as follows: on 22 May 2018, the temperature was 18 °C, RH 46%; on 12 February 2019, the temperature was 1 °C, RH 56%. During the measurements, the sky was overcast, and the wind speed was less than 1 m/s (heat loss from the surface by convection was minimal). In order to avoid reflections (or direct sunlight), the measurements were taken in very cloudy weather. The transformer’s surface emissivity was estimated as ɛ = 0.71 (using a tape with a known emissivity coefficient). The metal surfaces (for example, the galvanized surfaces of the radiators) were not analyzed for their temperature distribution (their emissivity was significantly lower).
4.3. Results of the Thermograms Analysis
Then, the temperature distribution on the transformer tank was analyzed; the thermograms of the IR radiation from the surface of the tested transformer from the different sides are presented in Figure 9, Figure 10 and Figure 11. Within the thermograms, there is information on the temperatures at the selected measurement points. A temperature distribution is justified by all the possible processes responsible for the generation of heat within the working transformer.
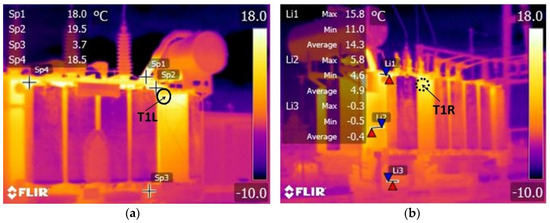
Figure 9.
Thermograms of the IR radiation from the transformer’s surface recorded from both sides of the conservator taken in the wintertime, with quantitative information on the temperatures at the selected measurement points. The higher IR emissions area is the hot spot T1L ((a)—the surface area delimited by a black circle) and the hot spot T1R ((b)—the surface area delimited by a black circle with a dashed line).
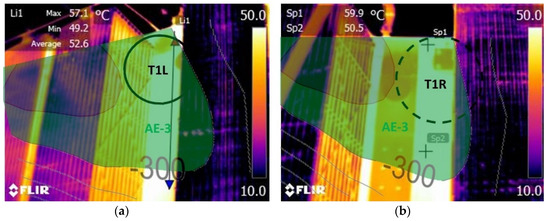
Figure 10.
Thermograms of the IR radiation from the transformer’s surface recorded from both sides of the conservator taken in the springtime with quantitative information on the temperatures at the selected measurement points. T1L “hot spot”—the surface area with higher IR emissions delimited by a black circle (a). T1R “hot spot”—the surface area with higher IR emissions delimited by a black circle with a dashed line (b). The part of AE-3 area with increased activity ADC > −300 is highlighted in green. T1L and T1R are the parts of AE-3.
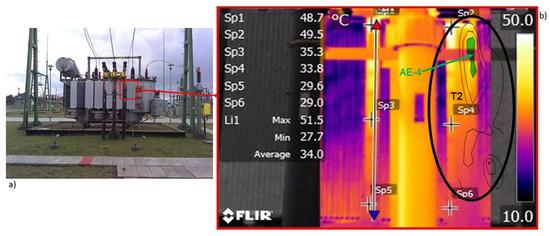
Figure 11.
Thermograms of the IR radiation from the transformer’s surface recorded at the side of the low voltage bushings with quantitative information on the temperatures at the selected measurement points. General view of the transformer (a). T2 “hot spot”—the surface area with higher IR emissions delimited by a black envelope (b). The part of the AE-4 area with increased activity with descriptor value in the range of [−600, −300] is highlighted in green. The AE-4 area is inside the T2 area.
The analysis of the thermograms of the IR radiation from the surface of the tested transformer tank shows (I) the overall temperature distribution, in which the top surface area of the transformer tank displayed much higher IR emission, as compared to the area at the bottom, (II) several areas with abnormal temperature distribution. The overall temperature distribution (I) is shown in Figure 9, where most of the transformer tank is visible. These distinguished areas (II) with abnormal temperature distribution are of particular interest, as they constitute hot spots on the surface of the transformer’s tank. They are in the following two areas: the T1 area on the top under the conservator (Figure 10) and the T2 area at the top and at the side of the low voltage bushings (Figure 11).
In Figure 9 and Figure 10, the thermograms of the IR radiation from the transformer’s surface that were recorded on both sides of the conservator are presented. The area T1 is located near the conservator and contains two hot spots: T1L on the left side of the transformer’s surface and T1R on the right side of the transformer’s surface. T1 area is the hottest area on the entire surface of the transformer in the wintertime (Figure 9) as well as in the springtime (Figure 10). Therefore, the maximums within these areas are as follows: in the wintertime, 19.50 °C (Figure 9a) and 15.80 °C (Figure 9b), and in the springtime, 57.10 °C (Figure 10a) and 59.90 °C (Figure 10b). It is worth noting that in the springtime, these temperatures reached a value of 60.00 °C, which is the limit value for efficient cooling within the transformer. The T1R hot spot with the highest temperature for the entire transformer (59.90 °C) is located near the main inlet to the cooling system, in which a large volume of oil is forced out, but the fact that there is a global maximum of the temperature distribution in this area indicates the existence of an additional heat source-its origin is unknown.
In Figure 11, the thermogram of the IR radiation from the transformer’s surface recorded at the side of the low voltage bushings is presented. The thermogram shows intensive energy emission in the area in the vicinity of measurement points Sp1 and Sp2. The hot spot T2 (marked with the black envelope) is located in the vicinity of the zone where the windings and wires conduct the highest current: 280 A on the 15 kV side during the measurement and near the inlet to the cooling system in which the outflow of a small volume of oil is forced.
In order to perform a quantitative analysis, six measurement points were selected on the thermogram along with two adjacent vertical lines in such a way that there are three measurement points in each line and two points are at the same height of the transformer. At the lowest level in both lines, the temperatures at the measurement points were similar 29.00 °C (Sp6) and 29.60 °C (Sp5). At subsequent temperature heights, the measurement points differ and amount to 33.80 °C (Sp4) and 35.30 °C (Sp3) and 49.50 °C (Sp2) and 48.70 °C (Sp1). In summary, there is a complex temperature distribution in the study area showing the existence of a source responsible for this temperature distribution in this area. This source could be additional Ohmic heat loss within the windings and wires conducting the highest current: 280 A on the 15 kV side.
5. Relationships in between Areas with Increased MAE Activity and Hot Spots within Thermograms
According to the results of analysis of the thermograms, the origins of sources for spots T1L and T1R are unknown.
Near the hot spots T1L and T1R, AE testing showed increased MAE activity, which is marked in Figure 4c as region AE-3. On the thermograms (Figure 10), a fragment of the area AE-3 was marked by applying levels with ADC values not lower than −300. The area marked in this way indicates the fragment of the transformer in which the maximum MAE activity was found. This is a large area, which is 250 cm wide and 200 cm high. In the marked area, the maximum values of the ADC descriptors are in the upper part of the transformer and reach the upper line of the transformer tank. This correlation between the recorded MAE activity and the temperature distribution on the thermograms justify the conclusion that in area AE-3, the magnetization processes having anomalously high levels contribute to the determination of the local temperature values. Only a joint analysis of the results obtained using two methods indicates the source of the existence of T1L and T1R hot spots.
According to the results of the thermograms analysis in the area of the T2 hot spot, there are two phenomena that occurred (additional Ohmic heat loss within the windings and wires conducting the highest current as well as anomalous magnetization processes) that are the sources that determine the local temperature values in the transformer.
Near the hot spot T2, the AE testing showed increased MAE activity marked in Figure 4c as area AE-4. The thermogram in Figure 11 is plotted with the part of AE-4 area having ADC descriptor values in the range of [−600, −300]. The upper part of this AA-4 area is 100 cm high and 50 cm wide, and is exposed on the thermogram. The marked area begins 40 cm below the top line of the transformer tank. It should be noted that the maximum temperature distribution on the thermogram occurs at the measuring point SP2, which is 20 cm below the upper line of the transformer tank. The combination of these facts indicates that in the AE-4 area, the magnetization processes (having level with ADC > −600) also can contribute to the determination of the local temperature values.
This requires further research, as in the AE-4 area where the ADC descriptor values are even lower, there are no hot spots on the thermograms.
6. Conclusions
6.1. Acoustic Emission Method
The research methodology and the results of the analysis carried out using the method of acoustic emission (AE) for a selected oil power transformer are presented.
Research conducted using the AE method showed the occurrence of few signals from PDs (located in the area called AE-1) and numerous MAE signals (located in the areas called AE-2, AE-3, and AE-4).
The sources of the PDs were located in the oil in the area of maximum circulation of the cooling oil that occurred in the upper part of the transformer near the conservator. These signals did not occur periodically and have low values of ADC descriptors; therefore, they do not pose a threat to the further operation of the transformer.
The MAE signals occurred periodically, four times during one period of the supply voltage. These four structures can be divided into two groups of two signals each. In one group, there are signals for which the main band of the signals is 45–65 kHz; the estimated duration of such a structure is 100 μs, and these signals occur at times when the supply voltage phase is near 500 or 2300. In the second group, there are signals for which the main band of the signals is 35–45 kHz; the estimated duration of such a structure is 200 μs, and these signals occur at times when the supply voltage phase is near 1300 or 3100. These structures are associated with the magnetization processes that occur in the transformer’s ferromagnetic core. According to the ADC descriptor values that registered MAE signals, the most advanced deformation processes occur in the area AE-3, followed by the upper part of area AE-4 and then in the lower part of the area AE-4 and area AE-2. Due to the magnetization processes occurring throughout the entire core, and the MAE signals only being recorded in certain areas, this indicates that anomalies are occurring in certain parts of the core.
These properties of signals recorded within the AE-2 area differ from the properties of the signal recorded in the AE-1 area, which confirms the different types of sources generating these signals.
6.2. Thermal Imaging
The research methodology and the results of the analysis carried out using the method of thermovision for a selected oil power transformer are presented.
Thermal imaging studies have been carried out in the 7.5 μm < λ < 13 μm band. Three areas were located on the thermograms that were calculated: the entire upper surface of the transformer tank, the areas on the top side under the conservator (named as T1L and T1R), and the area on the side wall of the tested transformer in which increased IR radiation occurred (named T2).
The higher temperature on the entire upper surface of the transformer tank is a result of all the possible processes that are responsible for the generation of heat within the working transformer.
The area T1 is located near the conservator and contains two hot spots: T1L, with a local maximum of temperature (57.10 °C), and T1R, with the highest temperature for the entire transformer (59.90 °C). The hot spot T1R is located near the main inlet to the cooling system, in which a large volume of oil is forced through, but the fact that there is a global maximum of the temperature distribution in this area indicates the existence of an additional heat source of unknown origin.
The hot spot T2 is located in the vicinity of the zone where the windings and wires conduct the highest current: 280 A (on the 15 kV side, during the measurement) and near the inlet to the cooling system in the outflow of which a small volume of oil is forced. There is a complex temperature distribution in hot spot T2, and one of the possible sources that is responsible for this can be an additional Ohmic heat loss within the windings and the wires that conduct the highest current.
6.3. Acoustic Emission and Thermal Imaging
According to the results of the thermograms analysis, the origins of sources for spots T1L and T1R are unknown. Near the hot spots T1L and T1R within the AE-3 area, AE testing showed increased MAE activity with an ADC descriptor value not lower than −300. There is a correlation between the recorded MAE activity and the temperature distribution on the thermograms. These data justify the conclusion that in area AE-3, the magnetization processes have anomalously high levels and contribute to the determination of the local temperature values.
In the area of the T2 hot spot, there are two identified phenomena that determine the local higher temperature values in the transformer (additional Ohmic heat loss within the windings and wires conducting the highest current as well as anomalous magnetization processes). Within the area of the T2 hot spot, there is part of the AE-4 area with ADC descriptor value in the range of [−600, −300], which also can contribute to the determination of the local temperature values.
The use of both research methods results in a broader description of the phenomena studied and more precise diagnosis regarding the condition of the operated transformer and its further operation.
The high similarity between the temperature distributions visible in thermograms and ADC descriptor maps for MAE signals with high activity, i.e., high values of ADC descriptors, requires further research to what ADC descriptor values can be associated with areas where elevated temperatures occur.
Author Contributions
Conceptualization, F.W; methodology, F.W., A.L.-L.; software, Z.O.; validation, F.W., A.O.; formal analysis, F.W., A.O., A.L.-L.; investigation, F.W., A.O., Z.O., A.L.-L., G.S.; resources, F.W.; data curation, F.W., A.O.; writing—original draft preparation, F.W.; writing—review and editing, F.W., A.O.; visualization, F.W., A.O., A.L.-L., G.S.; supervision, F.W., A.O., Z.O., A.L.-L., G.S. All authors have read and agree to the published version of the manuscript.
Funding
This research received no external funding.
Conflicts of Interest
The authors declare no conflict of interest.
References
- Islam, M.M.; Lee, G.; Hettiwatte, S.N. A review of condition monitoring techniques and diagnostic tests for lifetime estimation of power transformers. Electr. Eng. 2018, 100, 581–605. [Google Scholar] [CrossRef]
- Olech, W. The Framework Instruction for Operation of Transformers; Energopomiar-Elektryka: Gliwice, Polish, 2001; ISBN 83-916040-0-4. (In Polish) [Google Scholar]
- Bacha, K.; Souahlia, S.; Gossa, M. Power transformer fault diagnosis based on dissolved gas analysis by support vector machine. Electr. Power Syst. Res. 2012, 83, 73–79. [Google Scholar] [CrossRef]
- Abu-Siada, A.; Islam, S. A new approach to identify power transformer criticality and asset management decision based on dissolved gas-in-oil analysis. IEEE Trans. Dielectr. Electr. Insul. 2012, 19, 1007–1012. [Google Scholar] [CrossRef]
- IEC. Guidance on the Interpretation of Carbon Dioxide and 2-Furfuraldehyde as Markers of Paper Thermal Degradation in Insulating Mineral Oil; IEC TR 62874:2015; IEC: Geneva, Switzerland, 2015. [Google Scholar]
- Ortiz, F.; Fernández, C.; Santisteban, A.; Delgado, F.; Ortiz, A. Estimating the age of power transformers using the concentration of furans in dielectric oil. Renew. Energy Power Qual. J. 2015, 1, 1011–1015. [Google Scholar] [CrossRef]
- Kapinos, J.; Glinka, T.; Drak, B. Typical causes of operational failures of power transformers. Przegląd Elektrotechniczny 2014, 90, 186–189. (In Polish) [Google Scholar]
- Santosh Kumar, A.; Gupta, R.P.; Udayakumar, K.; Venkatasami, A. Online partial discharge detection and location techniques for condition monitoring of power transformers: A review. In Proceedings of the 2008 International Conference on Condition Monitoring and Diagnosis, Beijing, China, 21–24 April 2008; pp. 927–931. [Google Scholar]
- Yaacobi, M.M.; Alsaedi, M.A.; Rasshed, J.R.; Dadkhil, A.M.; Atyah, S.F. Review on partial discharge detection techniques related to high voltage power equipment using different sensors. Photonic Sens. 2014, 4, 325–337. [Google Scholar] [CrossRef]
- Dukanac, D. Application of UHF method for partial discharge source location in power transformers. IEEE Trans. Dielectr. Electr. Insul. 2018, 25, 2266–2278. [Google Scholar] [CrossRef]
- Harbaji, M.; Shaban, K.; El-Hag, A. Classification of Common Partial Discharge Types in Oil-paper Insulation System using Acoustic Signals. IEEE Trans. Dielectr. Electr. Insul. 2015, 22, 1674–1683. [Google Scholar] [CrossRef]
- Witos, F.; Olszewska, A.; Szerszeń, G. Analysis of properties characteristic for acoustic emission signals recorded on-line in power oil transformers. Acta Phys. Pol. A 2011, 120, 759–762. [Google Scholar] [CrossRef]
- Wilson, J.; Tian, G.Y.; Moorthy, V.; Shaw, B.A. Magneto-Acoustic Emission and Magnetic Barkhausen Emission for Case Depth Measurement in En36 Gear Steel. IEEE Trans. Magn. 2009, 45, 177–183. [Google Scholar] [CrossRef]
- Augustyniak, B.; Piotrowski, L.; Chmielewski, M.; Sablik, M.J. Nondestructive characterization of 2Cr-1Mo steel quality using magnetoacoustic emission. IEEE Trans. Magn. 2002, 38, 3207–3209. [Google Scholar] [CrossRef]
- Olszewska, A.; Witos, F. Identification of acoustic emission signals originating from the core magnetization of power oil transformer. Arch. Acoust. 2016, 41, 798–812. [Google Scholar] [CrossRef][Green Version]
- Borucki, S.; Cichoń, A.; Majchrzak, H.; Zmarzły, D. Evaluation of the Technical Condition of the Active Part of the High Power Transformer Based on Measurements and Analysis of Vibroacoustic Signals. Arch. Acoust. 2017, 42, 313–320. [Google Scholar] [CrossRef]
- ISO. Condition Monitoring and Diagnostics of Machines—Thermography; ISO 18434-1:2008; ISO: Geneva, Switzerland, 2008. [Google Scholar]
- IEEE Power & Energy Society. IEEE Guide for Loading Mineral-Oil-Immersed Transformers and Step-Voltage Regulators; IEEE Std C57.91™-2011; IEEE: New York, NY, USA, 2011. [Google Scholar]
- IEC. Power transformers—Part 2: Temperature rise for Liquid-Immersed Transformers (IEC 60076-2:2011); EN 60076-2:2011; IEC: Geneva, Switzerland, 2011. [Google Scholar]
- Markalous, S.; Tenbohlen, S.; Feser, K. Detection and Location of Partial Discharges in Power Transformers using Acoustic and Electromagnetic Signals. IEEE Trans. Dielectr. Electr. Insul. 2008, 15, 1576–1583. [Google Scholar] [CrossRef]
- Sikorski, W.; Walczak, K.; Gil, W.; Szymczak, C. On-Line Partial Discharge Monitoring System for Power Transformers Based on the Simultaneous Detection of High Frequency, Ultra-High Frequency, and Acoustic Emission Signals. Energies 2020, 13, 3271. [Google Scholar] [CrossRef]
- Witos, F.; Gacek, Z.; Opilski, A. The new acoustic emission descriptor for modelled sources of partial discharges. Arch. Acoust. 2002, 27, 65–80. [Google Scholar]
- Witos, F.; Olszewska, A. Analysis of properties of chosen acoustic emission descriptors describing acoustic signals measured by means of acoustic emission method within oil transformers. Acta Phys. Pol. A 2010, 118, 1267–1271. [Google Scholar] [CrossRef]
- Witos, F.; Gacek, Z. Properties of acoustic emission signals coming from partial discharges caused by modeled sources immersed in transformer oil. Acta Phys. Pol. A 2009, 116, 422–427. [Google Scholar] [CrossRef]
- Olszewska, A.; Witos, F. Location of partial discharge sources and analysis of signals in chosen power oil transformers by means of acoustic emission method. Acta Phys. Pol. A 2012, 122, 921–926. [Google Scholar] [CrossRef]
- Witos, F.; Gacek, Z. Application of the joint electro-acoustic method for partial discharge investigations within a power transformer. Eur. Phys. J. Spec. Top. 2008, 154, 239–247. [Google Scholar] [CrossRef]
- Gacek, Z.; Szadkowski, M.; Malitowski, G.; Witos, F.; Olszewska, A. Anusual application of partial discharges to diagnose of high voltage power transformers. Acta Phys. Pol. A 2011, 120, 609–615. [Google Scholar] [CrossRef]
- Witos, F.; Opilski, Z.; Szerszeń, G.; Setkiewicz, M. The 8AE-PD computer measurement system for registration and analysis of acoustic emission signals generated by partial discharges in oil power transformer. Metrol. Meas. Syst. 2019, 26, 404–418. [Google Scholar]
- Witos, F.; Opilski, Z.; Szerszeń, G.; Setkiewicz, M.; Olszewska, A.; Duda, D.; Maźniewski, K.; Szadkowski, M. Calibration and laboratory testing of computer measuring system 8AE-PD dedicated for analysis of acoustic emission signals generated by partial discharges within oil power transformers. Arch. Acoust. 2017, 42, 297–311. [Google Scholar] [CrossRef][Green Version]
- Witos, F.; Opilski, Z. The Method of Partial Discharges Locating, Particularly in the Power Oil Transformers, Based on the Map of Acoustic Emission Descriptors in the Frequency Domain. Patent PL 223605 B1, 31 October 2016. (In Polish). [Google Scholar]
- Witos, F.; Gacek, Z.; Malitowski, G.; Szadkowski, M.; Szerszeń, G. Testing of partial discharges in an oil power transformer with the combined electro-acoustic method supported by the DGA method. Przegląd Elektrotechniczny 2010, 11b, 13–16. (In Polish) [Google Scholar]
- Olszewska, A.; Witos, F. Location and identification of acoustic signals recorded in power oil transformers within the band of 20–180 kHz. Acta Phys. Pol. A 2011, 120, 709–712. [Google Scholar] [CrossRef]
- Lisowska-Lis, A. Thermographic monitoring of the power transformers. Meas. Autom. Monit. 2017, 63, 154–157. [Google Scholar]
- Lisowska-Lis, A. Thermographic and electrical test of medium voltage surge arresters. Meas. Autom. Monit. 2019, 65, 60–63. [Google Scholar]
- Bartnikas, R. Partial Discharges—Their Mechanism, Detection and Measurement. IEEE Trans. Dielectr. Electr. Insul. 2002, 9, 763–808. [Google Scholar] [CrossRef]
- Boczar, T. Identification of a Specific Type of Partial Discharges form Acoustic Emission Frequency Spectra. IEEE Trans. Dielectr. Electr. Insul. 2001, 8, 598–606. [Google Scholar] [CrossRef]
- Witos, F.; Szerszeń, G.; Setkiewicz, M. Mounting Magnetic Holders, Especially for Acoustic Emission Sensors, to the Side Surfaces of the Transformer Tank. PL Patent 223606 B1, 31 October 2016. (In Polish). [Google Scholar]
- Búa-Núñez, I.; Posada-Román, J.E.; Rubio-Serrano, J.; Garcia-Souto, J.A. Instrumentation System for Location of Partial Discharges Using Acoustic Detection With Piezoelectric Transducers and Optical Fiber Sensors. IEEE Trans. Instrum. Meas. 2014, 63, 1002–1013. [Google Scholar] [CrossRef]
- Castro, B.; Clerice, G.; Ramos, C.; Andreoli, A.; Baptista, F.; Campos, F.; Ulson, J. Partial Discharge Monitoring in Power Transformers Using Low-Cost Piezoelectric Sensors. Sensors 2016, 16, 1266. [Google Scholar] [CrossRef] [PubMed]
- Available online: https://www.mistrasgroup.com (accessed on 14 November 2020).
- Available online: http://www.vallen.de (accessed on 14 November 2020).
- Qingsong, C.; Yongxiang, L.; Zhixiang, L.; Zhenyu, Z.; Shen, Z.; Zhiyuan, W. Analysis of transformer abnormal heating based on infrared thermal imaging technology. In Proceedings of the 2nd IEEE Conference on Energy Internet and Energy System Integration (EI2), Beijing, China, 20–22 October 2018; pp. 1–5. [Google Scholar]
- Wang, Q.; Ji, C.; Sun, J.; Sun, W. A comparative study on infrared detection and ultrasonic detection of power distribution equipment. In Proceedings of the IEEE International Conference on High Voltage Engineering and Application (ICHVE), Athens, Greece, 10–13 September 2018; pp. 1–5. [Google Scholar]


Publisher’s Note: MDPI stays neutral with regard to jurisdictional claims in published maps and institutional affiliations. |
© 2020 by the authors. Licensee MDPI, Basel, Switzerland. This article is an open access article distributed under the terms and conditions of the Creative Commons Attribution (CC BY) license (http://creativecommons.org/licenses/by/4.0/).