Abstract
An investigation of electrolyte-assisted hydrogen storage reactions in complex aluminum hydrides (LiAlH4 and NaAlH4) reveals significantly reduced reaction times for hydrogen desorption and uptake in the presence of an electrolyte. LiAlH4 evolves ~7.8 wt% H2 over ~3 h in the presence of a Li-KBH4 eutectic at 130 °C compared to ~25 h for the same material without the electrolyte. Similarly, NaAlH4 exhibits 4.8 wt% H2 evolution over ~4 h in the presence of a diglyme electrolyte at 150 °C compared to 4.4 wt% in ~15 h for the same material without the electrolyte. These reduced reaction times are composed of two effects, an increase in reaction rates and a change in the reaction kinetics. While typical solid state dehydrogenation reactions exhibit kinetics with rates that continuously decrease with the extent of reaction, we find that the addition of an electrolyte results in rates that are relatively constant over the full desorption window. Fitting the kinetics to an Avrami-Erofe’ev model supports these observations. The desorption rate coefficients increase in the presence of an electrolyte, suggesting an increase in the velocities of the reactant-product interfaces. In addition, including an electrolyte increases the growth parameters, primarily for the second desorption steps, resulting in the observed relatively constant reaction rates. Similar effects occur upon hydrogen uptake in NaH/Al where the presence of an electrolyte enables hydrogenation under more practical low temperature (75 °C) and pressure (50 bar H2) conditions.
1. Introduction
The complex aluminum hydrides (MAlH4 where M = Na, Li, K) are known for their high hydrogen capacities and ability (in some cases) to reversibly cycle hydrogen under moderate temperature and pressure conditions. Thermally driven hydrogenation/dehydrogenation occurs in three steps [1]:
3MAlH4 ←→ M3AlH6 + 2Al + 3H2
M3AlH6 ←→ 3MH + Al + 3/2H2
3MH ←→ 3M + 3/2H2
Although all three steps are reversible, the decomposition of the binary hydride in the third step occurs at high temperatures (>400 °C) and therefore only the first two steps are typically considered for hydrogen storage reactions.
Lithium aluminum hydride (LiAlH4) exhibits the highest gravimetric and volumetric hydrogen capacities for the first two reactions (theoretical 72 g-H2/L, 7.9 wt% H); however, neither Reaction (1) nor Reaction (2) has been proven to be reversible in this material [2]. Reversible hydrogenation reactions have been demonstrated in the presence of a solvent, which leads to the formation of an alanate adduct [3,4]; however, the solvated/adduct form exhibits a much lower hydrogen capacity and therefore, these reactions are primarily being explored as the first step in a multi-step regeneration process. Sodium aluminum hydride (NaAlH4) also exhibits high gravimetric and volumetric hydrogen capacities (theoretical 50 g-H2/L, 5.6 wt%), but unlike LiAlH4, NaAlH4 is capable of reversible hydrogen cycling when catalyzed (typically with a transition metal catalyst at 1–4 mol%) [1]. Multiple studies have demonstrated reversible hydrogen cycling in Ti-catalyzed sodium alanate with over 100 cycles with a measured capacity of ~4 wt% H2. [1,5] In addition to the high reversible capacity, this material exhibits moderate desorption enthalpies of 37 kJ/mol H2 (Reaction (1)) and 47 kJ/mol H2 (Reaction (2)) [6], implying 1 bar of H2 pressure is achieved with a (theoretical) desorption temperature of ~35 °C and 110 °C, respectively. Calculated equilibrium pressure curves for the NaAlH4 reaction are shown in Figure S1 from Supplementary Materials. The high hydrogen capacity and low thermodynamic desorption temperatures are ideally suited for on-board automotive hydrogen storage for fuel cell vehicles. However, these solid state reactions (Reactions (1) and (2)) exhibit slow desorption rates at practical temperatures (~100 °C), which tend to decrease with the extent of reaction (getting slower as the reaction proceeds). The poor kinetics have limited the utility of these materials for automotive and other storage applications—slow dehydrogenation rates translate into low power and slow rehydrogenation rates translate into long re-fuel times. Despite considerable effort investigating alternative catalysts [1,5,6,7,8,9,10,11,12], tailored particle sizes/dimensions [13] and scaffolds/supports [14], the reaction kinetics of NaAlH4 have not increased significantly from the early reversibility [1] and kinetic [12] studies.
It was recently demonstrated that the presence of a liquid electrolyte (under reaction conditions), in the form of a eutectic, significantly increases the dehydrogenation and rehydrogenation reaction rates in some hydrides [15]. It has been suggested that the electrolyte substantially increases the reaction interface area as well as transport of heavy ions. Previous work was primarily focused on destabilized hydrides. For example, complete reversibility was achieved in the MgH2/Sn system with a 0.725LiBH4/0.275KBH4 electrolyte. A similar effect was also seen for the hydrogenation of MgB2 (to form Mg(BH4)2) using a 0.33LiI/0.33KI/0.33CsI electrolyte. These studies indicate that a similar rate enhancement may occur in complex hydrides. Here we extend our previous work with electrolyte-assisted hydrogen storage reactions to the complex aluminum hydrides (NaAlH4 and LiAlH4). We show that with the addition of an electrolyte, both hydrides exhibit a significant reduction in reaction times for dehydrogenation with desorption curves that maintain nearly constant rates over much of the reaction. Analysis using the Avrami-Erofe’ev model indicates increased reaction rate coefficients and growth parameters which together lead to the reduced reaction times. In addition, a rate enhancement is also observed in the hydrogen uptake reaction in NaAlH4. We demonstrate complete hydrogenation of NaH+Al (>4 wt%) at low pressure (50 bar) and temperature (75 °C) indicating reversible cycling much closer to thermodynamic conditions.
2. Materials and Methods
All sample handling was performed in a glove box with <1 ppm O2 and H2O concentrations.
Catalyzed sodium aluminum hydride was prepared by mechanically milling 1.381 g NaAlH4 (Aldrich, St. Louis, MO, USA, >90%) with 0.128 g TiCl3 (Strem, 98%) using a Fritsch (Idar-Oberstein, Germany) Pulversette 6 planetary mill in an 80 cm3 hardened steel vessel with 30 yttria stabilized zirconia milling balls 6.5 mm diameter (Inframat Advanced Materials, Manchester, NH, USA) at 400 rpm for 2 h. After preparation the catalyzed sample was stored in the glove box for one to several weeks. During this time we suspect that some dehydrogenation occurred.
Mixtures with diglyme were prepared in the sample vessel just prior to testing by using a needle to mix 0.156 g (~47 wt%) TiCl3/NaAlH4 with 0.175 g (~53 wt%) diglyme (Aldrich, anhydrous, 99.5%) until a uniform slurry was obtained. For these mixtures, diglyme is nominally just a solvent. In this case, we consider an electrolyte to be formed either from some dissolution of the NaAlH4 and/or from dissolution of NaCl formed during milling by reaction with TiCl3. We note that although the initial 47 wt% hydride/53 wt% diglyme mixture was a pourable slurry, after cycling the sample appeared partially dried with visible “mud-cracks”. In addition, a small amount of solvent was collected from the Sieverts apparatus (designed and built in-house at HRL) in an un-heated region, where the sample vessel assembly attached to the Sieverts manifold. This indicates that some solvent was lost during reaction and importantly that lower solvent loading may be effective for the observed improved kinetics. An approximate weight measurement indicated that after three cycles the sample contained ~25 wt% diglyme.
Catalyzed lithium aluminum hydride was prepared by loading 0.926 g LiAlH4 (Aldrich, 95%) and 0.076 g TiF3 (Aldrich) into a 60 ml glass vial and hand shaking vigorously in the glove box for ~5 min. We note that mechanical milling or even hand grinding TiF3/LiAlH4 mixtures led to significant hydrogen evolution during the milling or grinding and thus reduced capacity during dehydrogenation. In contrast, shaking the powders gave samples that had improved (i.e., catalyzed) kinetics without loss of capacity.
The 0.725LiBH4/0.275KBH4 eutectic [16] was prepared in situ during dehydrogenation by first grinding 0.52 g LiBH4 (Aldrich, 95%) and 0.48 g KBH4 (Aldrich, 98%) until a uniform consistency was obtained. Then the desired amount (0.50 g) of this mixture was lightly mixed using a spatula with the lithium aluminum hydride mixture (0.51 g). Previous differential scanning calorimetry (DSC) measurements confirmed that eutectic melting occurred from the ground mixture during the initial heating at ~110 °C. [15].
Hydrogen cycling experiments were carried out in a home-built Sieverts apparatus described previously in Vajo et al. [17]. Dehydrogenation experiments were performed in an overpressure of ~1 bar helium to prevent any boiling of the diglyme solvent and improve thermal conduction for the dry powder samples.
3. Results
3.1. Kinetic Analysis of H2 Desorption: NaAlH4 with and without Electrolyte
The efficacy of the electrolyte on the rate of dehydrogenation of NaAlH4 was measured in two samples. The first sample, used as a control, consisted of NaAlH4 catalyzed with 3 mol% TiCl3, known to produce 3 mol% TiAlx [18], which catalyzes both the hydrogenation and dehydrogenation reactions. A second sample was prepared with the same catalyzed NaAlH4 mixed with ~50 wt% diglyme (electrolyte). Although pure diglyme is a solvent, not an electrolyte, the electrolyte is formed with the introduction of ions from the dissolution of NaAlH4 or other species (e.g., NaCl, formed by reaction with TiCl3 during milling).
Three dehydrogenation/rehydrogenation cycles were completed on each sample and the desorption results are shown in Figure S2 from Supplementary Materials. The dehydrogenation measurements were performed by linearly ramping the temperature at a rate of 0.5 °C/min up to a maximum of 150 °C. The hydrogenation treatment was performed at 110 bar of H2 pressure at 130 °C over 15 h. Both samples exhibit the characteristic 2-step desorption (Reactions (1) and (2)) with the electrolyte-treated sample evolving ~4.8 wt% H2 in ~4 h and the control sample evolving ~4.4 wt% H2 in ~15 h.
The desorption results from the second cycle of the control and electrolyte-treated samples are presented in Figure 1, showing the total amount of desorbed hydrogen (Figure 1a) and the rate of desorbed hydrogen (Figure 1b). The electrolyte-treated sample exhibits an onset of H2 desorption at 40 °C (after 1.1 h), approximately 15 °C lower than the control. Once initiated, the rates for the first desorption step are similar for both the control and electrolyte-treated sample with both samples reaching a maximum hydrogen desorption rate of 3 wt%/h with the peak rate occurring at 103 °C for the electrolyte sample and 118 °C for the control.
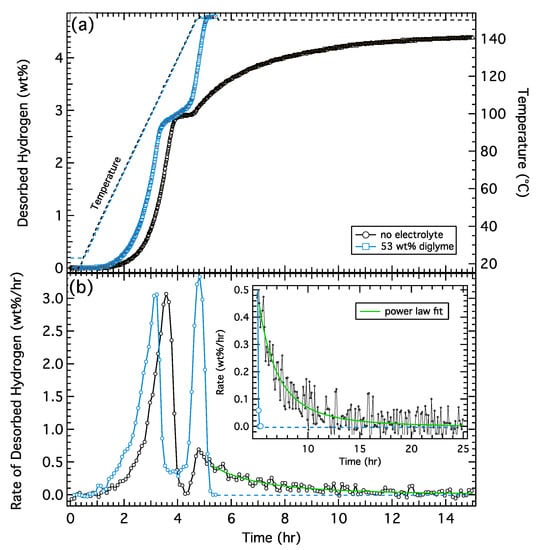
Figure 1.
(a) Hydrogen desorption from 50/50 wt% NaAlH4/diglyme (blue) and NaAlH4 control samples (black). Corresponding temperature profiles are indicated by the dashed lines. (b) Rate of desorbed hydrogen from both samples calculated from the derivative of the desorption curve with a magnified and expanded region of the data set shown in the inset. Green curve is a power law fit to the continuously slowing desorption in the control sample (green) and the dashed blue curve represents an extrapolated rate of the electrolyte sample, which is zero after ~5.4 h.
The desorption rates of the second step are distinctively different between the two samples. The electrolyte-treated sample starts out faster and reaches a peak desorption rate of ~3.3 wt%/h. The rate is fast and reasonably constant during the second stage of the reaction, as indicated by the sharp transitions in the rate curve. A sharp desorption onset is also observed in the control sample; however, the peak rate is much lower, reaching a maximum of only ~0.7 wt%/h. In addition, the rate slows continuously as the reaction proceeds. The inset of Figure 1b shows the tail of the desorption rate along with a power law fit indicating the rate goes completely to zero only after >25 h. The total time required to complete just the second desorption step is ~1 hr for the electrolyte sample and ~20 h for the control sample. These data clearly indicate that the addition of a (non-reactive) electrolyte significantly increases the rate of the second dehydrogenation step in sodium aluminum hydride (Na3AlH6 → 3NaH + Al + 3/2H2) with relatively constant kinetics (desorption rate) over the full desorption window as opposed to kinetics that continuously decrease with the extent of reaction. It is worth noting that the desorption rates for the control sample are consistent with those measured by Sandrock et al. [12] for NaAlH4 catalyzed with 4 mol% TiCl3 (see Figure S3 from Supplementary Materials).
A more detailed kinetic analysis was performed by fitting the fractional desorption (α) data from the control and electrolyte-treated sample for each step to an Avrami-Erofe’ev (A-E) equation [19,20,21]:
where t is time and the exponent, n, is the growth parameter and is defined by the geometry of the transformation (dimensionality of nuclei growth). [21] In this equation k is a rate constant that exhibits an Arrhenius behavior with temperature:
where A is the pre-exponential constant, E is the activation energy, R is the gas constant (8.314 J K−1 mol−1) and T is the absolute temperature. The temperature ramp used in these desorption measurements was relatively slow (0.5 °C/min) and the first decomposition step was complete before an isothermal temperature was reached. Therefore, the A-E fits were performed as a function of temperature (rather than k, which varies continuously during the temperature ramp). Combining Equations (4) and (5) give the following expression for fractional decomposition as a function of temperature:
α = 1 − exp(−(kt)n)
K = Aexp[−E/RT]
α = 1 − exp(−(Aexp[−E/RT]t)n)
The fractional decomposition for the first desorption step (Reaction (1)) from the control sample and the electrolyte-treated sample are shown in Figure 2a,b, respectively. The full desorption curves (shown in Figure 1) were trimmed to isolate the first desorption step (defined as 0–3 wt%) and normalized. The fits and fitting parameters determined from the A-E model (Equation (6)) are shown in Figure 2 and Table 1. The general shape of the fractional decomposition curves and the growth parameter, n, are similar for both the control and the electrolyte sample with n ~ 1 for the first step of both reactions [21]. The primary difference in the first step occurs in the rate constant k (shown in Table 1 at 383 K (110 °C)), which is 2.7× larger in the electrolyte-treated sample.
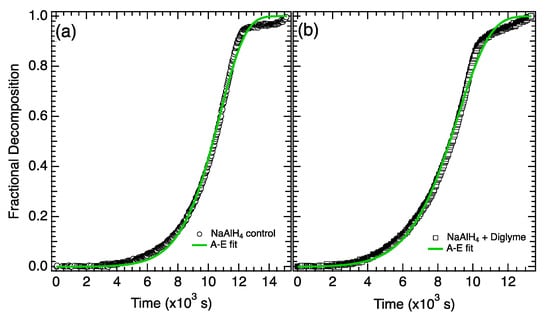
Figure 2.
Fractional decomposition from step 1 for (a) NaAlH4 control and (b) NaAlH4 + diglyme.

Table 1.
Fit parameters A, E, and n from the A-E fit to the first step of desorption (fractional decomposition) of NaAlH4 (control) and NaAlH4 + diglyme.
The fractional decomposition for the second desorption step (Reaction (2)) from the control and the electrolyte-treated sample are shown in Figure 3a,b, respectively. The full desorption curves (shown in Figure 1) were trimmed to isolate the second desorption step (defined as 3–4.48 wt% for the control and 3–4.85 wt% for electrolyte-treated sample) and normalized. The results from the A-E fit (Equation (6)) are shown in Figure 3 and Table 2.
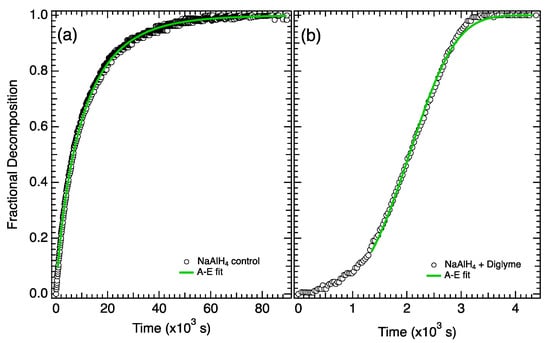
Figure 3.
Fractional decomposition from step 2 for (a) NaAlH4 control and (b) NaAlH4 + diglyme.
Table 2.
Fit parameters from a A-E fit to the second step of desorption (fractional decomposition) of NaAlH4 (control) and NaAlH4 + diglyme.
The growth and fit parameters for the second step (Reaction (2)) are significantly different for the two samples. First, the rate constant k (at 424 K) is nearly 5× faster in the electrolyte-treated sample. More significantly, the growth constant, n, goes up from ~0.8 in the control sample up to 3.5 in the electrolyte sample. This suggests that in addition to an increase in the rate constant, the addition of electrolyte causes a substantial change in the growth mechanism, which governs the transformation of the second step (Reaction (2)) in the electrolyte-treated sample.
3.2. Hydrogen Cycling in NaAlH4 with and without Electrolyte
A series of hydrogen cycling experiments were conducted where hydrogenation was performed at low temperatures and low pressures to further explore the impact of the electrolyte on the hydrogen release and uptake in sodium alanate. Figure 4a shows desorption results from three hydrogen cycles in a control sample and an electrolyte-assisted sample. The first desorption is similar to that observed in Figure 1. The rate of hydrogen release in step 1 is similar for both samples. The hydrogen release in the second step is considerably faster in the electrolyte-treated sample with a constant rate over the full extent of desorption while the control samples exhibits a desorption that consistently slows as the reaction proceeds. The total time required to complete the second desorption step is ~15× shorter with the electrolyte-treated sample. It is worth noting that the amount of hydrogen released during the first step (Reaction (1)) is ~1 wt% less in the electrolyte-treated sample, which is attributed to loss of hydrogen during storage (~1 week) at room temperature under an Ar atmosphere (no H2 overpressure).
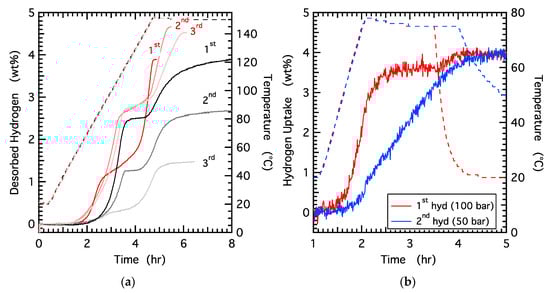
Figure 4.
(a) Hydrogen desorption from 50/50 wt% NaAlH4/diglyme (red, solid line) and NaAlH4 control samples (black, solid line) across three cycles (each cycle shown in a lighter shade). Corresponding temperature profiles are indicated by the dashed lines. (b) Hydrogen uptake for the 50/50 wt% NaAlH4/diglyme sample at the first hydrogenation step under 100 bar pressure for 90 min (red, solid line) and the second hydrogenation at 50 bar for 120 min (blue, solid line); both cycles were performed at 75 °C (dashed lines).
Following the first dehydrogenation, both samples were hydrogenated at ~100 bar and 75 °C for ~2 h (the uptake for the sample with diglyme is shown in Figure 4b). This temperature is considerably lower than the more standard hydrogenation temperature of 125 °C for catalyzed sodium alanate [12]. For the electrolyte-treated sample the subsequent dehydrogenation (Figure 4a) is similar to the first, both the first and second steps exhibit rapid H2 rates that are constant over the full desorption step. The total amount of hydrogen released from the electrolyte-treated sample is ~4.6 wt% indicating a nearly complete hydrogenation at 100 bar and 75 °C in 2 h. The desorption rates from the control sample are similar on the second cycle with a slow rate on the second step that continuously slows as the reaction proceeds. In addition, the control sample released ~2.6 wt% hydrogen indicating only partial hydrogen uptake under these low pressure and temperature conditions (100 bar, 75 °C, 2 h).
A second hydrogenation measurement was performed (on the same samples) at 50 bar of H2 pressure and 75 °C for 2.5 h. In this case, both the pressure and the temperature are significantly lower than the standard hydrogenation conditions for catalyzed sodium alanate (100 bar, 125 °C). Despite these low pressure and temperature conditions, the electrolyte-treated sample exhibits complete hydrogenation as shown in Figure 4b. Similar to the dehydrogenation kinetics, the uptake appears to display a relatively constant rate from ~ 1 wt% to ~3.5 wt% (note: analogous data for the control sample was not collected). Confirmation for complete hydrogenation is shown by the desorption plot (Figure 4a), which shows a total desorbed hydrogen of 4.5 wt%. In contrast, the control sample exhibits a total released hydrogen of only ~1.5 wt%. Although the control sample can be completely re-hydrogenated at higher temperatures and pressures (Figure S2 from Supplementary Materials, 130 °C and 100 bar), the reduced capacity observed with each subsequent cycle (Figure 4a) reflects the incomplete re-hydrogenation that occurs at low pressure and temperature conditions. These results suggest that the presence of an electrolyte not only increases the dehydrogenation rate, but also significantly increases the rate of hydrogenation and enabling hydrogen uptake under pressure and temperature conditions closer to the thermodynamic values.
3.3. Kinetic Analysis of H2 Desorption: LiAlH4 with and without Electrolyte
To further explore the effect of an electrolyte on the rate of dehydrogenation in complex metal hydrides, we investigated dehydrogenation in LiAlH4 with and without an electrolyte. Similar to previous measurements, two samples were prepared: (1) a control, consisting of lithium aluminum hydride catalyzed with 3 mol% TiF3; and (2) an electrolyte-treated sample using the same catalyzed lithium aluminum hydride mixed with ~50 wt% Li-KBH4 eutectic (electrolyte). The dehydrogenation measurements were performed by linearly ramping the temperature up to 130 °C at a rate of 1 °C /min. The desorption results are presented in Figure 5, which show the total amount of desorbed hydrogen (Figure 5a) and the rate of desorbed hydrogen (Figure 5b). Both samples exhibit the characteristic 2-step desorption (Reactions (1) and (2)). The onset temperature for hydrogen release from the control sample is ~120 °C and is reduced by about 30 °C in the electrolyte-treated sample (90 °C). The peak desorption rates from the electrolyte-treated sample are 8.2 wt%/h for the first step and 1.2 wt%/h for the second step. The peak desorption rates from the control sample are 5.0 wt%/h for the first step and ~0.5 wt%/h for the second step. Similar to what was observed with NaAlH4, the second step is appreciably faster in the electrolyte-treated sample. From the onset of desorption, the electrolyte sample evolves 7.8 wt% H2 over ~3 h while the control sample evolves 7.8 wt% H2 over 25 h, suggesting a ~8× decrease in the reaction time with the addition of the electrolyte.
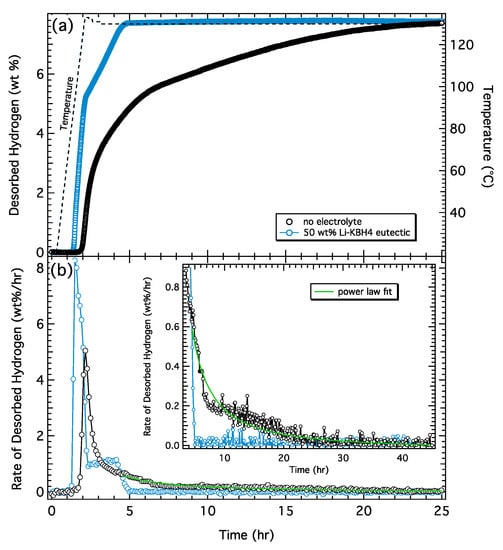
Figure 5.
(a) Hydrogen desorption from 50/50 wt% LiAlH4/Li-KBH4 eutectic (blue) and LiAlH4 control samples (black). Corresponding temperature profiles are indicated by the dashed lines. (b) Rate of desorbed hydrogen from both samples calculated from the derivative of the desorption curve with a magnified and expanded region of the data set shown in the inset. Green curve is a power law fit to the continuously slowing desorption in the control sample.
The desorption rate from the electrolyte-treated sample is essentially constant (Figure 5a) over both desorption steps and characterized by sharp transitions in the rate plot (Figure 5b). In contrast, the desorption from the control sample slows continuously as the reaction proceeds and is characterized by an extended “tail” in the rate plot. This occurs on both steps of the control sample, but is most prominent in the second step. The inset of Figure 5b shows a closeup of the desorption rate tail along with a power law fit indicating the rate goes to zero after ~25 h. These data clearly indicate that the addition of a (non-reactive) electrolyte significantly increases the rate of both dehydrogenation steps, but has the most significant effect on the second step (Li3AlH6 → LiH + Al).
A kinetic analysis was performed by fitting the fractional desorption curves from each step of the desorption to an A-E equation (Equation (6)). The fractional decomposition for the first desorption step (reaction 1) from the control sample and the electrolyte-treated sample are shown in Figure 6a,b, respectively. The full desorption curves (shown in Figure 5) were trimmed to isolate the first desorption step (defined as 0–5.2 wt%) and normalized. For the control sample the temperature ramp was complete after ~8 × 10³ s and therefore the A-E fit was performed on the isothermal region 8–20 × 103 s. The first desorption step in the electrolyte-treated sample occurs more rapidly and is complete before the temperature ramp reaches the setpoint (130 °C). Therefore, the A-E fit was performed as a function of temperature (Equation (6)), which varies linearly (1 °C /min) over the first desorption step. The fits and fitting parameters determined from the A-E model are shown in Figure 6 and Table 3.
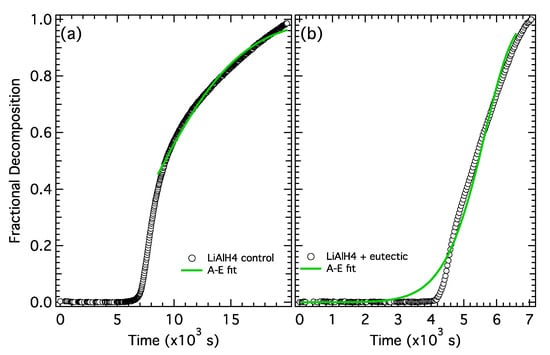
Figure 6.
Fractional decomposition from step 1 for (a) LiAlH4 control and (b) LiAlH4 + Li-KBH4 eutectic.
Table 3.
Fit parameters from an A-E fit to the first step of desorption (fractional decomposition) of LiAlH4 (control) and LiAlH4 + eutectic (electrolyte).
The general shape of the fractional decomposition curves and the fit parameters for the two samples have a few distinct differences. First, the decomposition rate slows continuously for the control sample and is essentially linear (constant) in the electrolyte-treated sample. The rate constant, k, at 110 °C is 5× larger in the electrolyte-treated sample while the growth parameter, n, is nearly the same for the two samples. This suggests that similar to NaAlH4, the electrolyte increases the rate constant, but does not significantly alter the growth mechanism in the first desorption step.
The fractional decomposition for the second desorption step (Reaction (2)) from the control and the electrolyte-treated sample are shown in Figure 7a,b, respectively. The full desorption curves (shown in Figure 5) were trimmed to isolate the second desorption step (defined as 5.2–7.8 wt% for both samples) and normalized. In this case, the lack of an induction period at the early stage of desorption may be indicative of a small amount of desorption from Li3AlH6 (second step) overlapping with the final stages of the LiAlH4 desorption (first step). To account for this, the time variable, t, in the A-E equation (Equation (6)) was replaced with t + t0 where t0 is an additional fit parameter that represents the amount of time (below 5.2 wt%) that resulted in some Li3AlH6 decomposition. The results from the A-E fit (Equation (6)) are shown in Figure 7 and Table 4.
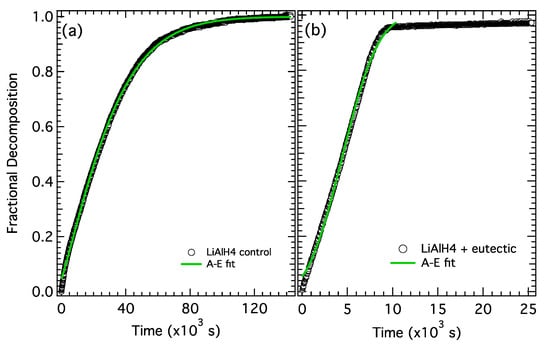
Figure 7.
Fractional decomposition from step 2 for (a) LiAlH4 control and (b) LiAlH4 + Li-KBH4 eutectic.
Table 4.
Fit parameters from an A-E fit to the second step of desorption (fractional decomposition) of LiAlH4 (control) and LiAlH4 + diglyme.
The general shape of the fractional decomposition curves and the fit parameters for the two samples also have a few distinct differences. First, similar to the first desorption step, the decomposition rate slows continuously for the control sample and is essentially linear (constant) in the electrolyte-treated sample. Second, the rate constant k (at 130 °C) is ~4× faster in the electrolyte-treated sample. More significantly, the growth constant, n, goes up from ~1.3 in the control sample up to 3.0 in the electrolyte-treated sample, indicating there is a clear increase in both the rate constant and the growth mechanism with the addition of an electrolyte.
4. Discussion
During an isothermal reaction, the kinetic characteristics are dependent upon two independent parameters, the area of the reactive interface, the nominal boundary surface area between the reactant and the solid product, and the velocity of the advancing interface into the reactant [21].
The velocity of the advancing interface can be quantified in a rate coefficient, k, which is temperature dependent and obeys an Arrhenius equation (Equation (5)). The pre exponential factor, A, is the reaction frequency factor, often described as the frequency of occurrence of the reaction configuration and Ea is the activation energy, the excess energy required during transformation. It is difficult to extract mechanistic details from these parameters, although there may be some use in relative comparisons of the activation energies. In this context, we compare the rate constants at a given temperature to extract some relative understanding of how quickly the reaction proceeds at the interface. In all cases investigated (steps 1 and 2 for NaAlH4 and LiAlH4), the addition of an electrolyte increases the rate parameter 3–5x. In all cases, the activation energy is decreased with the addition of an electrolyte. Therefore, the presence of an electrolyte increases the velocity of the reactant-product interfacial area due, at least in part, to a decrease in the activation energy.
The growth of the reactive interfacial area, the boundary between the reactant and product, is quantified in the A-E model by the growth parameter, n, which defines the number of dimensions in which the reaction interface advances. During an isothermal reaction, the rate is proportional to the area of the reactive interface, which is dependent upon the relative mobility of the constituent ions or molecules in the lattice of the reactant and/or product phases. Although it is difficult to be purely quantitative, changes in the fractional decomposition rate curves are directly related to changes in the reactive interfacial area. During nucleation and growth, described by the A-E model, the reactive area starts out small with individual nuclei, grows rapidly for a period as the nuclei grow, peaks, and then decreases as the growing particles begin to overlap leading to a decrease in reactive interfacial area. The growth parameter relates to the geometry of the reactive interfacial area between the reactant and product phases and is typically 1–3 for solid state reactions. For complex hydrogen storage materials, which are typically fine powders, reactant/product interfaces could occur within or between powder particles. Low growth parameters indicate more confined reaction geometry (tending to isolated point sources) while high parameters indicate more distributed geometries (tending to extended planer sources). The parameters include contributions from reaction sites inside powder particles as well as those on surfaces, ie at solid/gas boundaries. These contributions may be different because of different diffusion rates (and mechanisms) within a 3-dimensional solid environment versus over a 2-dimension surface.
A compilation of the growth parameters determined from the fits is given in Table 5. For the first step in the dehydrogenation, the growth parameters are essentially unaffected by the electrolyte: n ~ 2 for LiAlH4 and n ~ 1 for NaAlH4. For LiAlH4, there is a noticeable difference in the second half of the first decomposition (Figure 6) where the control sample exhibits a decreasing desorption rate, while the electrolyte-treated sample exhibits a more constant desorption. However, in both cases nucleation is complete and the rate reaches a maximum relatively quickly and thus the growth parameters are not significantly affected by the electrolyte. The reaction already proceeds quickly and although the electrolyte may provide some transport benefit, it does not substantially change the growth parameter. For NaAlH4, an increasing rate over most of the first step (Figure 2) suggests the desorption rate is more dominated by nucleation rather than growth. The nucleation rate is likely unaffected by an electrolyte and therefore the fractional decomposition curves and growth parameters are similar for both samples.
Table 5.
Comparison of growth parameters determined from A-E fits to the first and second desorption steps for NaAlH4 and LiAlH4 with and without electrolyte.
A more substantial difference is observed in the second decomposition step for both NaAlH4 and LiAlH4. In both cases the growth parameters without electrolyte are small, ~1. This indicates restrictive reaction geometries likely resulting from low mobilities of the reacting species. However, these growth parameters are increased significantly by inclusion of an electrolyte, to 3.0 for Li3AlH6 with a Li/KBH4 eutectic and to 3.5 for Na3AlH6 with diglyme. In the fractional decomposition curves (Figure 3 and Figure 7) this shows up as a continuously slowing desorption rate in the control samples and as a more constant rate or linear desorption profile in the electrolyte-treated samples. Because we expect an electrolyte to only affect mobility in between particles or along the surfaces of powder particles, the large influence of the electrolyte indicates that these processes contribute significantly to this reaction.
The results from hydrogenation measurements indicate a similar enhancement is occurring during the hydrogenation reaction. In this case, we are forming the product hydride phase (e.g., M3AlH6) from the reactants (e.g., MH, Al and H2). In the solid state, the formation of the hydride occurs exclusively at the boundary between these phases. In contrast, the electrolyte-treated sample provides additional pathways for the reaction to proceed by facilitating transport between different phases.
Figure 8 shows a cartoon of an alanate particle in an intermediate state of (de)hydrogenation (M3AlH6 ← → 3MH + Al + 3/2H2) in the pure material (control) and in the presence of an electrolyte. In this example, the reactive interface (shown in yellow) in the control sample is shown as a single point, defined by the 3-phase interface between M3AlH6, Al and MH. In three dimensions this interface is a line extending through the particle (assuming that H2 can escape when generated within the particle). In the electrolyte-treated sample, soluble species of M (shown in diagram as M+) and AlxHy (shown in diagram as X−) enable interparticle transport as well as intraparticle transport from species in solution (shown in gray) and traveling along the particle surface (shown in light blue). In this case, the reactive interface can possibly extend to a line, representing a planar geometry (in three dimensions) through the particle. For example along the M3AlH6/Al interface (upper right branch in Figure 8b), M3AlH6 could not dehydrogenate in solely the solid state because there is no (already nucleated) MH phase. However, the presence of an electrolyte might enable reaction by facilitating transport as M+ to a nearby (but not atomically adjacent) MH region. Although this is an oversimplified example and more is needed to better elucidate the details of the mechanisms involved, these results support our hypothesis that the addition of an electrolyte enables the hydrogenation and dehydrogenation reactions to proceed in higher dimensions, increasing the geometry/area of the reactive interface (yellow), and thereby decreasing reaction times.
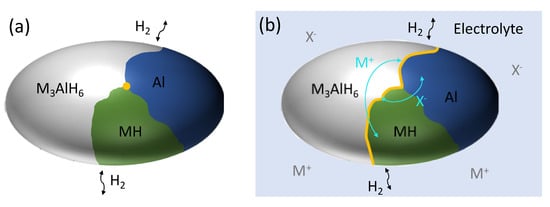
Figure 8.
Schematic of a particle in an intermediate state of the second step (M3AlH6 ← → 3MH + Al 3/2H2) for (a) a solid state (control) particle and (b) an electrolyte-treated sample showing possible solubilized species (M+ and X−) in the bulk electrolyte (grey) and on the surface (light blue). The reactive interfacial area is shown in yellow.
5. Future Outlook
This work, along with our previous work on destabilized hydrides and magnesium borohydride [15], confirms that the addition of a suitable electrolyte to a solid state hydrogen reaction can substantially reduce the kinetic barrier(s) and increase the reactive interfacial area, thereby reducing reaction times and enabling reactions that occur at pressures and temperatures closer to thermodynamic equilibrium. It is worth noting that the electrolytes used in this study (diglyme and the 0.725LiBH4/0.275KBH4 eutectic) were not optimized for these reactions. Other electrolytes were investigated with some undergoing an irreversible reaction with the alanate and others with essentially no effect on the reaction (see Table S1 from Supplementary Materials for additional information). However, there are likely other (possibly many other) electrolytes that could show enhanced hydrogen uptake and release and more work is needed to optimize these reactions. Future work should consider (1) the identification of electrolytes that enable the greatest reaction rates, (2) minimization of the electrolyte mass fraction (ideally <=20% of total mass), (3) methods to reduce or eliminate loss of electrolyte/solvent during the reaction, such as use of low vapor pressure solvents (e.g., ionic liquids) or solvent traps/reflux systems. The insights gleaned from these studies will be essential in determining if an electrolyte-assisted hydrogen reaction could ultimately be developed into a practical on-board hydrogen storage system.
6. Conclusions
An investigation of electrolyte-assisted hydrogen reactions in NaAlH4 and LiAlH4 reveals significant reduction in overall dehydrogenation times by ~4–8× with up to a 20× reduction for dehydrogenation of Na3AlH6. Using the Avrami-Erofe’ev model, desorption rate coefficients (k) increase in all cases by 3–5× suggesting the electrolyte increases the velocity of the reactant-product interfacial area, which is at least partially attributed to a decrease in the activation energy. In addition, the electrolyte increases the growth parameters (n), primarily in the second desorption step, resulting in kinetics with relatively constant rates over the full desorption window as opposed to rates that continuously decrease with the extent of reaction. Together these effects lead to the observed reduced reaction times. Similar improvements are seen for hydrogenation in NaAlH4.
Supplementary Materials
The following are available online at https://www.mdpi.com/1996-1073/13/22/5868/s1, Figure S1: Sodium aluminum hydride equilibrium pressure, Figure S2: Hydrogen cycling in sodium aluminum hydride, Figure S3: Rate constants for dehydrogenation of NaAlH4, Table S1: Additional electrolytes tried.
Author Contributions
Conceptualization, J.J.V. and J.G.; methodology, J.J.V. and J.G.; validation, J.J.V. and J.G. writing—original draft preparation, J.G.; writing, reviewing and editing, J.J.V.; funding acquisition, J.J.V. All authors have read and agreed to the published version of the manuscript.
Funding
This research was funded by U.S. Department of Energy, contract number DE-EE0007849.
Acknowledgments
We thank Dan Addison at Liox Power, Inc. for insightful discussions.
Conflicts of Interest
The authors declare no conflict of interest.
References
- Bogdanović, B.; Schwickardi, M. Ti-doped alkali metal aluminium hydrides as potential novel reversible hydrogen storage materials. J. Alloy Compd. 1997, 253, 1–9. [Google Scholar] [CrossRef]
- Graetz, J. New approaches to hydrogen storage. Chem. Soc. Rev. 2009, 38, 73–82. [Google Scholar] [CrossRef]
- Graetz, J.; Wegrzyn, J.; Reilly, J.J. Regeneration of Lithium Aluminum Hydride. J. Am. Chem. Soc. 2008, 130, 17790–17794. [Google Scholar] [CrossRef] [PubMed]
- Liu, X.; McGrady, G.S.; Langmi, H.; Jensen, C.M. Facile Cycling of Ti-Doped LiAlH4 for High Performance Hydrogen Storage. J. Am. Chem. Soc. 2009, 131, 5032–5033. [Google Scholar] [CrossRef] [PubMed]
- Srinivasan, S.S.; Brinks, H.W.; Hauback, B.C.; Sun, D.; Jensen, C.M. Long term cycling behavior of titanium doped NaAlH4 prepared through solvent mediated milling of NaH and Al with titanium dopant precursors. J. Alloy Compd. 2004, 377, 283–289. [Google Scholar] [CrossRef]
- Bogdanović, B.; Brand, R.A.; Marjanović, A.; Schwickardi, M.; Tölle, J. Metal-doped sodium aluminium hydrides as potential new hydrogen storage materials. J. Alloy Compd. 2000, 302, 36–58. [Google Scholar] [CrossRef]
- Zidan, R.A.; Takara, S.; Hee, A.G.; Jensen, C.M. Hydrogen cycling behavior of zirconium and titanium–zirconium-doped sodium aluminum hydride. J. Alloy Compd. 1999, 285, 119–122. [Google Scholar] [CrossRef]
- Jensen, C.M. Advanced titanium doping of sodium aluminum hydride: Segue to a practical hydrogen storage material? Int. J. Hydrog. Energy 1999, 24, 461–465. [Google Scholar] [CrossRef]
- Zaluska, A.; Zaluski, L.; Ström-Olsen, J. Sodium alanates for reversible hydrogen storage. J. Alloy Compd. 2000, 298, 125–134. [Google Scholar] [CrossRef]
- Sandrock, G.; Gross, K.; Thomas, G.; Jensen, C.; Meeker, D.; Takara, S. Engineering considerations in the use of catalyzed sodium alanates for hydrogen storage. J. Alloy Compd. 2002, 696–701. [Google Scholar] [CrossRef]
- Anton, D.L. Hydrogen desorption kinetics in transition metal modified NaAlH4. J. Alloy Compd. 2003, 400–404. [Google Scholar] [CrossRef]
- Sandrock, G.; Gross, K.; Thomas, G. Effect of Ti-catalyst content on the reversible hydrogen storage properties of the sodium alanates. J. Alloy Compd. 2002, 339, 299–308. [Google Scholar] [CrossRef]
- Mueller, T.; Ceder, G. Effect of Particle Size on Hydrogen Release from Sodium Alanate Nanoparticles. ACS Nano 2010, 4, 5647–5656. [Google Scholar] [CrossRef] [PubMed]
- Stavila, V.; Bhakta, R.K.; Alam, T.M.; Majzoub, E.H.; Allendorf, M.D. Reversible Hydrogen Storage by NaAlH4 Confined within a Titanium-Functionalized MOF-74(Mg) Nanoreactor. ACS Nano 2012, 6, 9807–9817. [Google Scholar] [CrossRef]
- Vajo, J.J.; Tan, H.; Ahn, C.C.; Addison, D.; Hwang, S.-J.; White, J.L.; Wang, T.C.; Stavila, V.; Graetz, J. Electrolyte-Assisted Hydrogen Storage Reactions. J. Phys. Chem. C 2018, 122, 26845–26850. [Google Scholar] [CrossRef]
- Ley, M.B.; Roedern, E.; Jensen, T.R. Eutectic Melting of LiBH4-KBH4. Phys. Chem. Chem. Phys. 2014, 16, 24194–24199. [Google Scholar] [CrossRef]
- Vajo, J.; Mertens, F.; Ahn, C.C.; Bowman, R.C.; Fultz, B. Altering Hydrogen Storage Properties by Hydride Destabilization through Alloy Formation: LiH and MgH2 Destabilized with Si. J. Phys. Chem. 2004, 108, 13977–13983. [Google Scholar] [CrossRef]
- Graetz, J.; Reilly, J.J.; Johnson, J.; Ignatov, A.Y.; Tyson, T.A. X-ray absorption study of Ti-activated sodium aluminum hydride. Appl. Phys. Lett. 2004, 85, 500–502. [Google Scholar] [CrossRef]
- Avrami, M. Kinetics of phase change I. J. Chem. Phys. 1939, 7, 1103–1112. [Google Scholar] [CrossRef]
- Erofeyev, B.V. Generalized equation of chemical kinetics and its application in reactions involving solids. Compt. Rend. Acad. Sci. USSR 1946, 52, 511–514. [Google Scholar]
- Bamford, C.; Tipper, C.H.F.; Compton, R.G. Electrode kinetics: Principles and methodology (Comprehensive chemical kinetics, vol. 26). Anal. Chim. Acta 1986, 201, 1–340. [Google Scholar] [CrossRef]
Publisher’s Note: MDPI stays neutral with regard to jurisdictional claims in published maps and institutional affiliations. |
© 2020 by the authors. Licensee MDPI, Basel, Switzerland. This article is an open access article distributed under the terms and conditions of the Creative Commons Attribution (CC BY) license (http://creativecommons.org/licenses/by/4.0/).