Abstract
The phenomenon of the floor upheaval occurs in virtually every type of rock mass and at every depth, accompanying the process of excavation of tunnels and headings. Despite its inconvenience, it is rarely studied because of the complexity of the process and the multiplicity of the factors causing deformations in floor rocks. To quantify the effect of the selected factors on floor upheaval, this article presents an analysis of results of in situ measurements carried out in three coal mine roadways at 15 measuring stations. These measurements were taken over varying periods of time, between 129 and 758 days. Groundwater and fault zones intersecting the excavations were considered as the key factors that affect floor upheavals. Therefore, the measurement bases were located at local faults and sites of water inflow. To compare the results, the stations were also located where the rock mass was not exposed to any factors other than stresses resulting from the depth of the excavation. The excavations were driven in various rocks and were located at different depths from 750 to 1010 m. The analyses of the study results show that the floor upheaval always depends on time and can be described in polynomial form: ufl = a·t2 + b·t + c or by a power function: ufl = a·tb. However, the further regression analyses show that roadway’s floor upheaval can be expressed by a complex form using the key parameters determining the phenomena. In the absence of an impact of geological factors on the stability of the excavation, the floor upheaval depends on floor rocks compressive strength σc and Young’s modulus E: ; in the case of rock mass condition affected by water depends on the rock compressive strength reduction after submerging rock in water σcs 6h: and in the case of fault depends on the fault’s throw f: . Statistical analysis has shown that the matching of the models to the measurement data is high and amounts to r = 0.841–0.895. Hence, in general, the analysis shows that the floor upheaval in underground excavation in any geological conditions may grow indefinitely.
1. The Mechanism of the Floor Upheaval in Roadways
It is difficult to prevent the floor upheaval, despite the high technology of headings drivage and support in underground mines. The arched or trapezoidal shape of the cross-section of the working, when using the open frame support or bolts built in the roof and the sidewalls, means that the widest exposed and unsupported surface is the floor therefore conducive to relaxation of floor layers. The process of the floor upheaval may begin as early as during the drivage and usually is continuous and of a mild rate (Figure 1a). However, an excessive or sometimes even dynamic floor upheaval may lead to the loss of stability of the excavation. Even the use of a closed frame support may not be sufficient to withstand the forces with which the floor rocks intrude the excavation (Figure 1b).
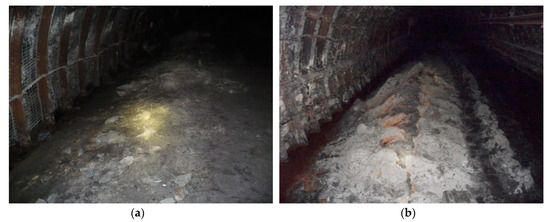
Figure 1.
(a) The floor upheaval during the excavation; (b) Broken floor arches as a result of the floor upheaval.
The main cause of the floor upheaval in the form of rock extrusion is the high stress in the rock mass surrounding the working [1,2,3,4,5,6,7,8], primarily horizontal [9]. Based on in situ observations and measurements as well as on theoretical solutions, it appears that the primary state of stress in the rock mass around the working changes significantly after the excavation. In the roadway sidewalls, the vertical compressive stress increases significantly (concentrates in the sidewalls) because of the exposed roof. Concentration of compressive stresses in the excavation sidewalls with simultaneous appearance of tensile stresses in the floor of the excavation may lead to the commencement of the process of rock failure and formation of a damaged zone in the floor, which is then subject to the uplift [2,10]. The compressive stresses in the sidewalls are transferred to certain areas of the floor, both in the part of the excavation and deep into the rock mass, creating the so-called floor load zone (I—Figure 2). As a result of straining the floor rocks, which are affected by the sidewall loads and concentration of tensile stress, a floor destruction zone occurs under the excavation (II—Figure 2) which depends on the angle of internal friction of the rocks φ and inclined at from the sidewalls deep into the rock mass [11,12]. The zone of destruction (III—Figure 2) is considered to be a zone of radial slippage of damaged rocks [4,11,13]. This zone is usually symmetrical [14], but the practice of Polish and foreign mining shows that it can assume different asymmetrical shapes [15,16].
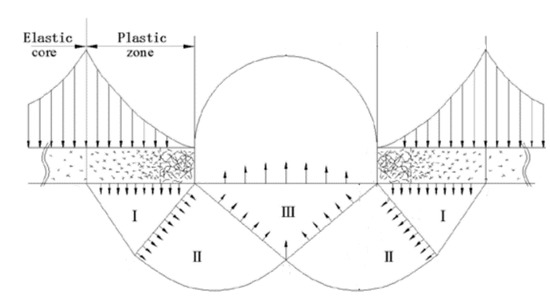
Figure 2.
The mechanism of the roadway’s floor uplift [2].
Observations of roadways show that if the floor rocks are weak and have lower strength parameters than the rocks in the side walls of the excavation, the floor upheaval occurs in the form of extrusion, bending and swelling of the floor layers (Figure 3a). This form of floor upheaval is described in papers e.g., by [7,11,14,17,18]. To prevent this phenomenon a combined support system with concrete slab is bolted to the floor [18,19].
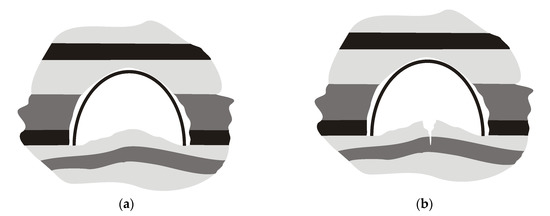
Figure 3.
The floor upheaval of the (a) weak rocks; (b) strong rocks.
Shearing takes place in headings driven in strong rocks and with strong stratified floors, where the upheaval occurs in the form of a threshold in a discontinuous manner (Figure 3b). This mechanism is also well described by [7,20] who underline that this type of damage mechanism can lead to rockburst from the floor beds. Hence the main parameter that “regulates” the mechanism of floor heaving and influences its intensity is rocks strength.
As the floor heaving intensity depends on elastic and plastic behaviors of rocks, elastic-plastic models are mainly employed to the analyses [12,17,18,21,22,23,24,25,26]. However, for example, Guo and Lu [27] suggest using visco-elastic model for floor upheaval prediction and for studying the creep deformation characteristics of floor rocks, for example in the vicinity of roadways cross-sections. Although such a model can effectively simulate the floor behavior there are usually very limited data about creep parameters of a rock mass.
According to [6,26], in general, the shape of the floor rocks failure zone resembles a funnel, and the maximum depth is usually in the middle of the excavation (Figure 4). This happens even when a steel yielding support is used. The depth of failure is usually up to 2.5–4 m [11,17,18,24,28], but can also reach values above 10 m [19] and the failure is progressing deep into the floor [7,28]. It refers to workings driven next to the gob area as well, which was proved by the complex study (physical, numerical, and analytical) by [8,18].
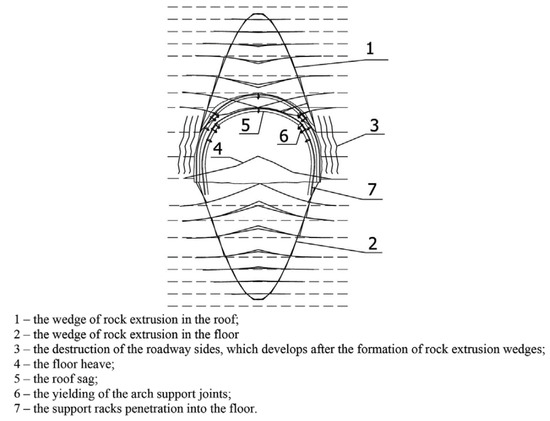
Figure 4.
Diagram of the mechanism of roadway’s floor deformation [6].
The floor failure mechanism is different in room and pillar mining systems [7] and in the situations where a pillar between the double pre-driven recovery rooms [25]. There, the fracture zone develops deep into the pillar first, and floor heaving develops asymmetrically from the side of the damaged pillar. Sun et al. [16] underlines that the improper support design can also lead to asymmetrical floor heaving.
Khalymendyk and Baryshnikov [6] stated that the floor upheaval and roadway deformation in the conditions of laminated rocks in deep mines are characterized by the formation of rock mass extrusion wedges in the roof and floor, which can lead to sudden and asymmetrical deformations.
Although research on the floor upheaval in underground excavations shows that its intensity primarily depends on the width of the working, its depth, and the properties of the rocks in the floor [1,2,9,11,12,15,18,26,29,30,31] there are, however, many more factors influencing the value of the floor upheaval. They can be divided into four main groups: geological, reactivity of rocks with water, geomechanical, as well as mining and technical parameters. Geological conditions include: type of rocks, rock mass stratification, structural properties of rocks, inclination of layers, and geological disturbances. Reactivity of rocks with water is characterized by, swelling, soaking, and content of clay minerals in rocks. Geomechanical parameters of rocks are strength, strain, and rheological properties. Mining and technical factors refer to the depth of excavation, vicinity of mining excavations, impact of mining edges, pillars, remnants or goafs left in the vicinity of the excavation, dimensions, and shape of the excavation as well as the load capacity and the type of the support used. The division of factors into subgroups is shown in Figure 5.
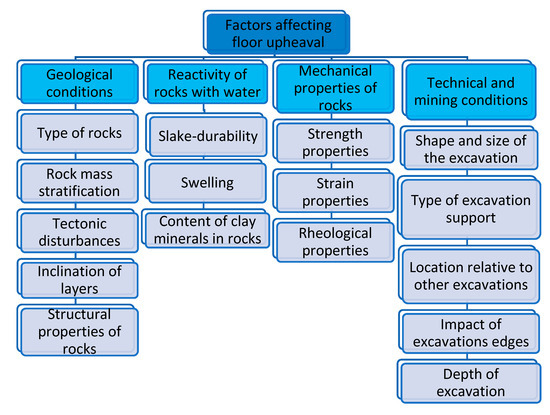
Figure 5.
Factors influencing the floor upheaval.
When considering the impact of tectonic disturbances on the value of the floor upheaval, the impact of faults, especially those that intersect the excavation, should be taken into account. If the rock layers are disrupted and displaced, in the footwall of the normal fault not only no additional compressive stresses are observed, but in this part of the fault the stresses are generally lower than it would result from the depth of deposition of the layers [29]. Stress concentrations can be observed in the dropped fault wall (hanging wall), where the convergence of the excavation is generally several times greater, and the layers below the exposed floor are the most deformed around the excavation [32]. This convergence is usually asymmetrical, manifested mainly in a compression of one of the sidewalls and asymmetrical floor upheaval [16,22,23]. Moreover, the extent of the damage zone increases 4–6 times, and the convergence doubles [22,23,33]. The intensity of deformations depends on a fault throw, the roadway position relative to a fault, and fault’s dip. In addition, the crevices in the fault are a frequent source of water or gas inflows to the excavations. To avoid under or overestimation of rock mass deformation next to the fault area Babets et al. [34] suggests to use the technique of rock mass strength estimation using structural factor based on statistical strength theory.
Groundwater is the second very important factor that affects rocks deformation. In general, Bondarenko et al. [35] floor stability criterion considers after division of the floor beds on three types, depending on their saturation and thickness. Groundwater can cause rocks slaking and swelling, which results in the loss of rock strength around the excavation and additionally promotes deformation of the rocks around the excavation. The phenomenon of volume increase in the presence of water is a characteristic of the rocks containing clay minerals, including montmorillonite, illite, kaolinite, smectite [11,36,37]. Particularly sensitive to water is claystone, which after just a few hours of water exposure show a large decrease in strength, loss of cohesion, and transforms into a plump mass with partial or complete loss of bearing capacity [11,37]. Along with the water absorption of the rocks, their volume density changes, which in the case of roof and sidewall layers will increase the load on both the support of an excavation and its floor, which may again increase the upheaval value [11,38]. The water contained in the rock pores creates a pore pressure, which reduces the friction on the surface of the cracks formed in the rock, which results in a much faster development of the fractures system in the rocks, reduced strength, and increased deformability [21,37,39,40]. The process of humidity diffusion during floor heave associated with failure evolution is thoroughly described in the paper by [39].
The lack of floor heaving measurements carried out in underground excavations in different mining and geological conditions seem to be the main research gap. Any methods designed for floor heave prediction need to be further tuned based on broad monitoring records. This article presents an analysis of the results of the floor heaving measurements carried out in three coal mine roadways. The built-in measuring bases were located at local faults, in locations of water inflow and were not affected by any factors other than stresses resulting from the depth of the excavation. The excavations were driven in various rocks and were located at different depths from 750 to 1010 m.
The obtained results were then statistically analyzed to find the empirical formula describing floor upheaval in the relation to the common factors present in the vicinity of mining excavation. For this purpose, a multiple regression analysis with residuals was carried out, assuming the confidence level of 0.95. The R-square value and residuals set show the precision of the fitting of the regression line to the measurements. The next step of the statistical analysis was correlation of the floor upheaval with time and convergence. The obtained 3D charts show the significance of both factors on floor upheaval in a given geological condition.
2. Location and Scope of Research
In order to analyze the phenomenon of floor rocks heaving, observations of the upheaval were conducted in three roadways of width: 6.1–6.5 m and height: 4025–4225 m. They were:
- (a)
- Roadway D-2 in the “Zofiówka” mine—average depth of 1010 m,
- (b)
- Roadway F-33b in the “Borynia” mine—average depth of 920 m,
- (c)
- Raise gallery IV in the “Piast” mine—average depth of 750 m.
In the cross-section of all the excavations there were layers of coal and claystone, in the floor—claystone and in their roof: claystones, mudstones, and sandstones, respectively. Table 1 shows the results of laboratory tests of the rocks located in the immediate vicinity of the above mentioned excavations (minimum, maximum, average value of the parameter, and standard deviation with coefficient of variation). The scope of tests included determination of bulk density (γ), uniaxial compressive strength (σc), modulus of elasticity (Young’s modulus—E), and Poisson’s ratio (ν). Thirty tests were done to determine each of these parameters. It can be noted that the bulk density of rocks occurring in the immediate vicinity of the tested excavations was typical for Carboniferous rocks, i.e., 20–24 kN/m3. For uniaxial compressive strength of the surrounding rocks, similar values were observed in D-2 and F-33b roadways (average: 40–60 MPa), while in the raise gallery IV the UCS was much lower −13.5–24.7 MPa. This translates into the value of Young’s modulus, which for the rocks around the first two excavations was approx. 5.2 GPa, and around the third one approx. 2.0 GPa. Poisson’s ratio for all rocks was between 0.26 and 0.3.

Table 1.
Range of values of physical and mechanical properties of rocks.
The floor upheaval investigations in each excavation were carried out with reference to two stages of the mining situation: stage I, when no excavation works were carried out in the vicinity, and stage II, when the longwall excavation had started. In the second stage, tests were carried out only in front of the face of the longwall, until the visible impact of the front of the exploitation on the convergence of the excavation. The impact of the excavation on the measurement results was therefore excluded. The convergence and the floor upheaval at each monitoring station was performed on array of four monitoring points (MP1, MP2, MP3, MP4). They were rock bolts of length of 1.2–1.5 m fully grouted in the rock mass to avoid their movements during the observation period. To determine the convergence, the distance H between the points MP2 and MP4 and the horizontal distance W between points MP1 and MP3 were measured with a tape measure, as shown in Figure 6. The measurement of the floor heaving consisted of a number of measurements of the distance between the floor of the excavation and the line connecting MP1 and MP3 measurement points. Depending on the width of the tested excavation, there were 10÷20 measurements, on points spaced approximately 400 mm along MP1–MP3 section. Measurements were taken at about 28 days intervals. The support of the excavations was a steel yielding support (3 or 4 elements) that enabled free deformation of the rock mass around the excavation. No bolts were used, and there was no support in the floor.
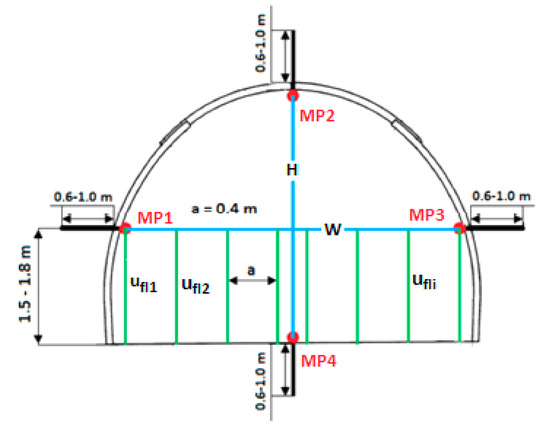
Figure 6.
Measurement station.
In each of the investigated excavations several measuring stations were established. Their locations corresponded to three possible situations:
- Tectonically disturbed zones (in the fault crossing the excavation),
- Waterlogged zones,
- Sections of the excavation without additional mining and geological factors influencing the deformation of the excavation.
In roadway D-2 measurements were carried out at seven stations, four of which were affected by tectonic disturbances, in two of which the floor rocks were wet, and one station was free of additional factors that could affect the floor upheaval (Figure 7). Both, in roadway F-33b and in raise IV gallery, four measuring stations were installed (Figure 7). Two stations in F-33b gallery were affected by the fault, while in raise IV gallery there was one such station. Three stations where the rocks in the floor were wet were located in the raise gallery IV and one in the roadway F-33b. Additionally, there was a station in the roadway F-33b with no additional factors that could influence the floor heaving.
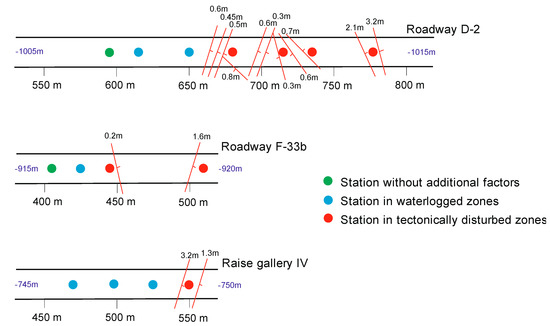
Figure 7.
The measurement stations layout in Roadway D-2, Roadway F-33b, and Raise IV gallery.
The faults that affected the measurements had the throws between 0.8 m and 9.9 m (Figure 7). Their widths were very small—several centimeters, and they were filled with debris of claystones and mudstones. The fault’s dip, given by geologists, varied from 60° to 72°. However, this parameter is very difficult to measure precisely.
The measurement stations were built with the progress of the excavation, so the total time of monitoring varied at each station. The longest time, i.e., 758 days was recorded in the roadway D-2 at the station not impacted by additional factors of floor upheaval. Whereas the shortest (129 days) monitoring period was in roadway F-33b at a station affected by tectonic disturbances.
3. Analysis of Test Results
3.1. Impact of the Duration of the Excavation on the Floor Upheaval
In the rock mass zones, where there are no diverse geological and no variable technical or mining conditions, the phenomenon of the floor upheaval is primarily time-dependent only. Two such measuring stations were built in the excavations—in the roadways D-2 and F-33b. Figure 8 illustrates the process of the floor heaving at both stations. It can be noted that the upheaval value, monitored over two years, was low. In roadway D-2 the maximum value of upheaval after almost 800 days of monitoring was 54 cm, and in roadway F-33b—60 cm. The upheaval is quite regular and covers the whole width of the excavation. In the sections of the excavations where there are no additional factors that may impact the floor upheaval, it can be described by a quadratic function with a general Formula (1):
where: t—time, in days.
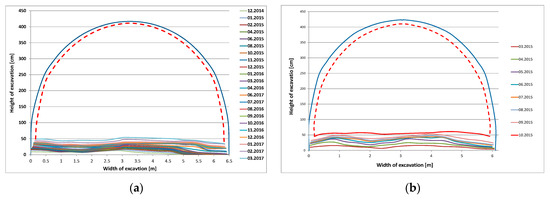
Figure 8.
Floor upheaval on monitoring stations not affected by additional geological and mining factors: (a) Roadway D-2—595 m; (b) Roadway F-33b—405 m.
Figure 9 shows the curves of the speed of heaving at stations in roadways D-2 and F-33b. The three curves represent the maximum, minimum, and average upheaval value over time. The adjustment of the quadratic function to the measurement results is remarkably high here, exceeding r2 = 0.8. The quadratic function describing the floor upheaval allows for estimation of the extreme, i.e., the maximum value of the upheaval after a certain number of days, but only after sufficient time of observations. Looking on the line course in Figure 9a it seems that the observation period should last minimum 400–450 days. According to the developed equation the maximum floor heave for Roadway D-2 should be reached after 1177 days. It is not possible to determine the floor upheaval in Roadway F-33b, because 175 days of measurements is still too short to design the empirical formula (Figure 9b). The visible difference between floor heaving value in both roadways shows that local mining conditions (e.g., the number of extracted seams, their thickness, distance between them, etc.,) can change the intensity of the phenomenon several times.
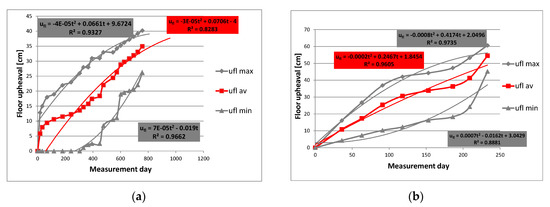
Figure 9.
Floor upheaval over time on measurement stations not covered by additional factors. (a) Roadway D-2—595 m; (b) Roadway F-33b—405 m.
The rock ability to deform depends on its mechanical parameters. It can be expressed as a ratio between compressive strength σc and Young’s modulus E. Usually, the relationship between these parameters, so called modulus ratio MR [41], is linear, but for heterogeneous sedimentary rocks the linear regression can show a medium fit [42,43] or a weak fit [42,44]. The coefficient of determination R-squared for σc and E of floor rocks in roadway D-2 and roadway F-33 was not too high—0.60 and 0.56 respectively (Figure 10). Hence, statistical analysis was carried out to involve independently compressive strength σc and Young’s modulus E to the equations determining the floor upheaval.
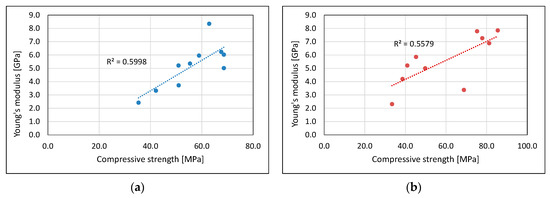
Figure 10.
The relationship between compressive strength and Young’s modulus of floor rocks, (a) in Roadway D-2, (b) in Roadway F-33.
A multiple regression analysis included dozens of linear, polynomial, and logarithmic functions of time, σc, and E. The aim of the analysis was not only to find the line of best fit, but also its intersection with the ordinate close to “0.” The result of multiple regression analysis is the Equation (2), where t refers to the time given in days, compressive strength σc in MPa and Young’s modulus E in GPa. The floor upheaval is calculated in centimeters.
The developed regression model can be characterized by the following statistical values: r = 0.934, r2 = 0.873, SE = 0.211. The authors realize that above equation was derived on the basis of two measurement stations only, and the research needs to be carried out further, however, low residuals for both variables are promising (Figure 11 and Figure 12). Diagrams of multiple regression analysis results are shown in Figure 13 and Figure 14. Table 2 shows the model statistics.
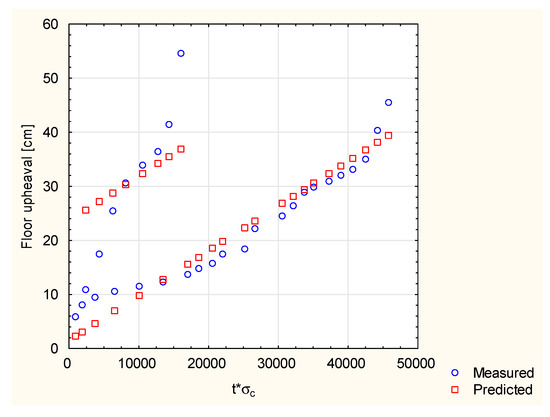
Figure 11.
Multiple regression analysis results—t × σc.
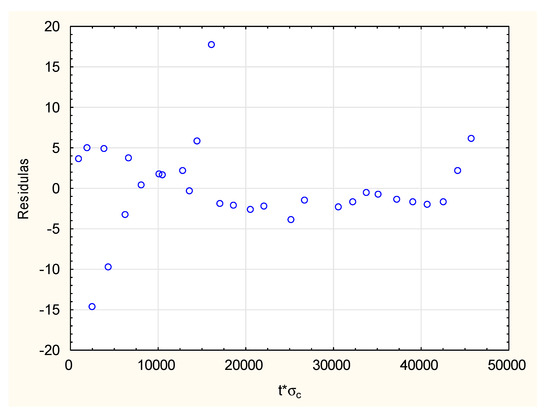
Figure 12.
Residual plots for the product: t × σc.
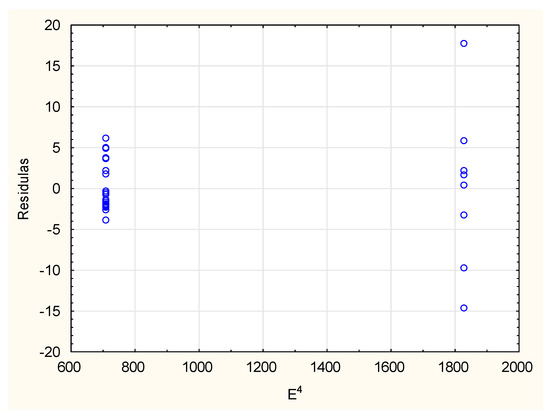
Figure 13.
Multiple regression analysis results—E4.
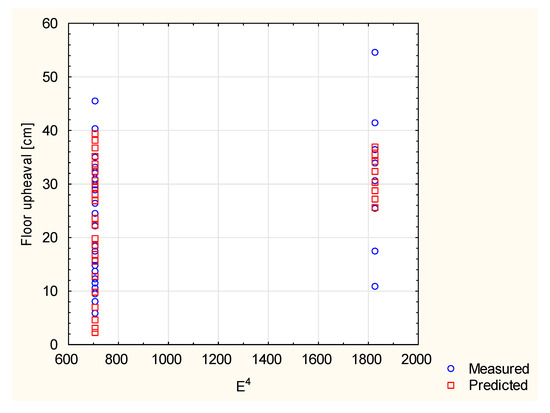
Figure 14.
Residual plots for E4.
Table 2.
Regression statistics of the model describing floor upheaval in undisturbed zones.
3.2. Impact of the Fault
In the three analyzed excavations there were a total of seven measurement stations within a fault impact zone. The faults’ throws did not exceed 3.8 m. Figure 14 shows measurements from two measurement stations located in roadway F33b and raise gallery IV, built in places of faults intersecting the excavation. It can be observed that over the cross-section of the excavations, the floor upheaval was uneven in shape and size. In roadway F-33b at a station located at 509 m the upheaval during the last measurement after 162 days was 88 cm (Figure 15a). On the other hand, in raise gallery IV at the station located at 550 m, after 414 days, the upheaval was twice as big and amounted to 196 cm (Figure 15b). In the beginning the shape of contour deformation is generally symmetrical, but after 7–10 months starts to be asymmetrical and inclining toward the fault throw. The inclination depends on the height of the throw.
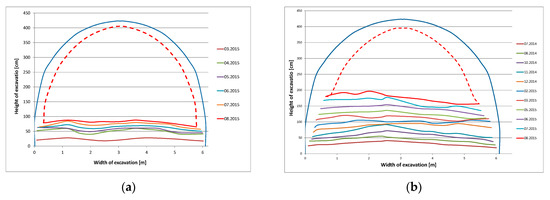
Figure 15.
Roadway floor upheaval on monitoring stations affected by faults: (a) Roadway F-33b—509 m; (b) Raise gallery IV—550 m.
The nature of the floor heaving at the measuring stations affected by tectonic disturbances varies for each station and excavation. This effect can be found on Figure 16 that shows the curves representing the floor upheaval versus time. Each curve runs in a slightly different way. However, it should be noted that in each case, the power function is best fit trendline to describe the floor heaving course. Coefficient r2 is in all cases above 0.9, which indicates a very good trend function match. The general equation describing the floor upheaval is , where t is the time variable given in days. The value of coefficients a and b varied greatly and was in the ranges: . The problem with fitting the trendline function to the measurement results arises when one best fit function is defined for all measuring stations (Figure 17). In our case the equation took the form of Equation (3), and the coefficient of determination fell to r2 = 0.352. Therefore, it is inaccurate to define a global function that describes the floor heaving (in cm) in the fault-affected areas, taking into account the time only.
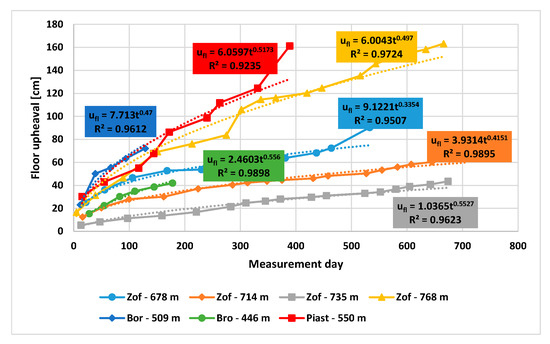
Figure 16.
The workings floor upheaval on successive measurement stations.
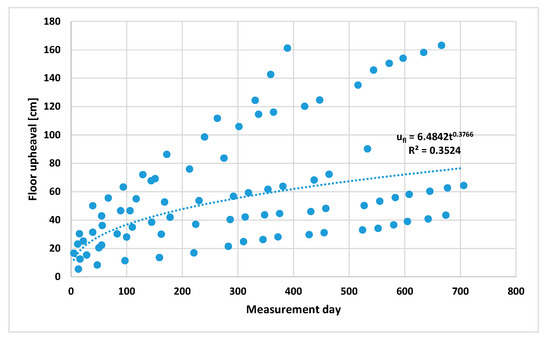
Figure 17.
Line of best fit to measurements from all stations.
The above analyses have shown that the floor upheaval in the faults zones depends on more factors than just time. For the purpose of quantifying the fault effect, a multiple regression analysis was carried out, taking into account, in addition to the time, the throw of the fault identified next to the measuring station. The build-in measuring stations were affected by one fault or a whole series of tectonic disturbances with different throws ranging from 0.2 m to 3.9 m. The result of multiple regression analysis was the Equation (4), where t refers to time given in days, while f refers to fault throw in centimeters.
The developed regression model is characterized by the following statistical values: r = 0.841, r2 = 0.708, SE = 19.71. Diagrams of the time t and throw f values measured and projected are shown in Figure 18 and Figure 19, while in Figure 20 and Figure 21 the residual plots for the model are presented. Table 3 shows the model statistics. It is important in the model that the residuals values do not increase considerably at the consecutive points.
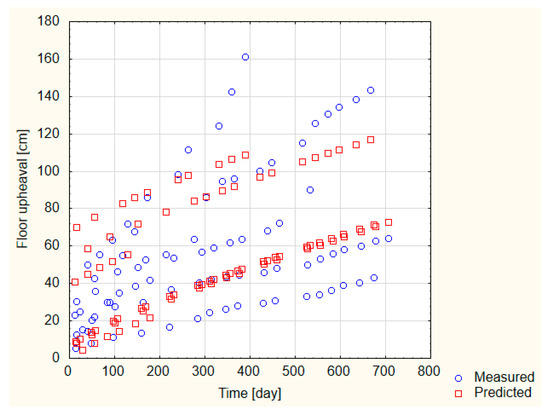
Figure 18.
Multiple regression analysis results—measurement time.
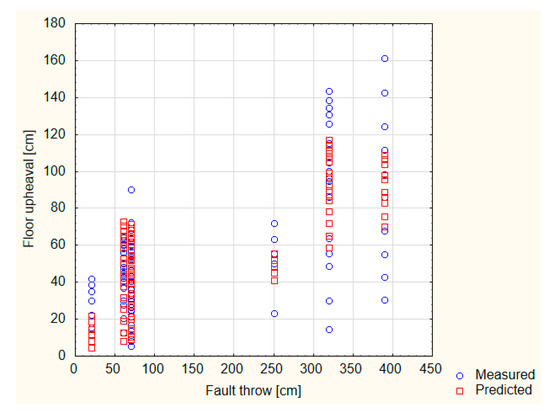
Figure 19.
Multiple regression analysis results—fault throw.
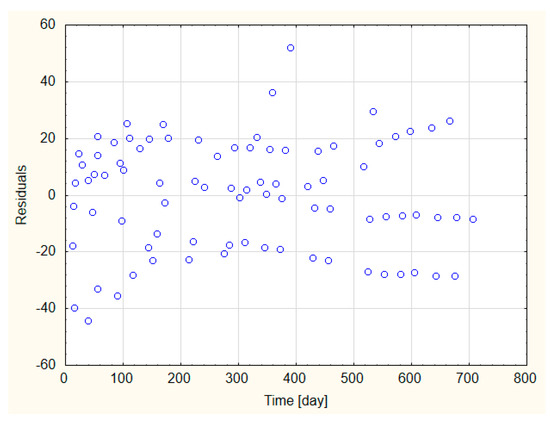
Figure 20.
Residual plots for measurement time.
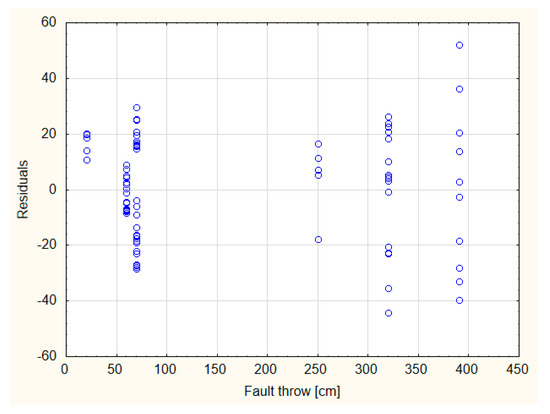
Figure 21.
Residual plots for the fault throw.
Table 3.
Regression statistics of the model describing the floor upheaval in the fault zone.
3.3. Groundwater in the Floor Rocks
The presence of waterlogged rocks in the floor is conducive to its swelling, slaking, and loss of cohesion and bearing capacity, which may also result in floor upheaval. In the course of the research, the occurrence of groundwater in the floor of the excavations was identified at six measuring stations in all three excavations under investigation. Analysis of the movements of the floor over time shows that water presence causes uniform upward displacement along the whole section of the excavation (Figure 22). Eventually, the highest recorded upheaval value in roadway D-2 at a station located at 650 m exceeded 100 cm (Figure 22a), while at a station located in the raise gallery IV—150 cm (Figure 22b). In this case, however, the upheaval was slightly less uniform.
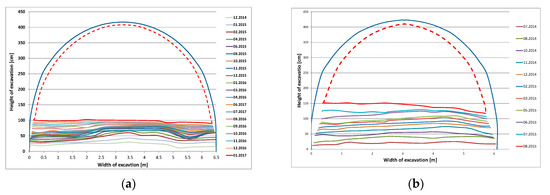
Figure 22.
Floor upheaval on monitoring stations with groundwater: (a) Roadway D-2—650 m; (b) Raise gallery IV—525 m.
The phenomenon of groundwater effect on the floor rocks, in contrast to tectonic disturbances, is of a different nature. In the event of water accumulation in the rocks, their movement takes place primarily toward the space above the floor that is free and unconfined by the support.
The analysis of the floor upheaval, which took place on successive measurement stations, shows that the magnitude of changes was different and depended on the excavation. This can be viewed in detail in Figure 23, where the course of floor heaving over time is shown for each monitored excavation. The behavior of the waterlogged rocks at the four measurement stations of the two mines was similar, but at two measurement stations in third mine—different. However, it can be found that each set of measurements over time can be approximated by a power curve with the general equation ufl = a·tb, with a very high coefficient of determination r2 ranging from 0.95 to 0.99. Coefficient a varies between <0.9; 10.5> and coefficient b ranges between <0.311; 0.817> and the exact equations are shown in Figure 23. For each excavation, after just a few measurements, it is possible to forecast the floor upheaval with a high degree of probability using the equations. Different courses of changes, hence different trendlines, for each excavation are related to a different behavior of rocks in the presence of water. The attempted regression analysis for all measurements produced the Equation (5), in which the coefficient of determination dropped to 0.74 (Figure 24). However, the equation still provides a reliable estimation of the upheaval (in cm) versus time.
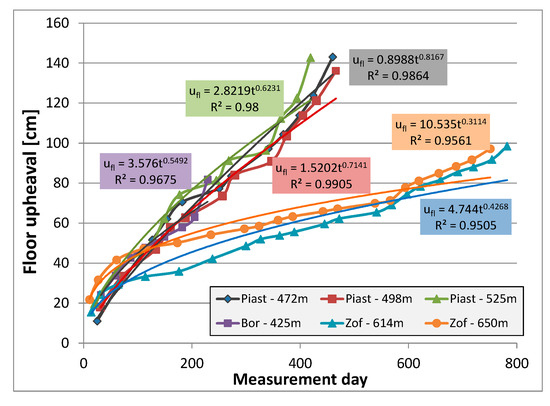
Figure 23.
Floor upheaval of working overtime on successive measurement stations.
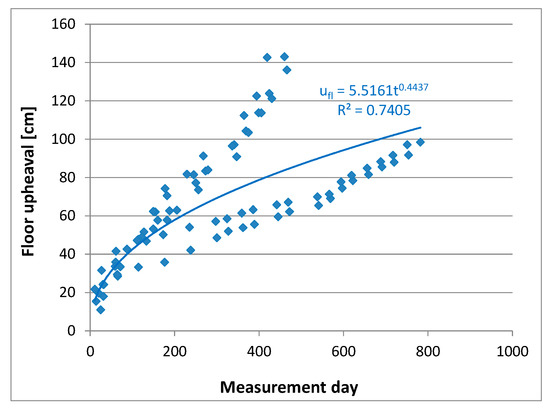
Figure 24.
Trendline of all floor upheaval measurements.
On the basis of the above analyses it can be concluded that in order to best determine the amount of floor upheaval in the sections of excavation with groundwater, it is necessary to look for a factor that would adjust better the statistical model to the measured values. The damage of floor rocks due to exposure to water, first of all is caused by reduction of Young’s modulus or compressive strength. Tests were carried out in the department laboratory to investigate σcs and E of rocks after their contact with water. For the analysis, a coefficient related to rock compressive strength reduction expressed as nw = σcs/σc, was used for the calculations. Because the clay rocks from the raise gallery IV disintegrated because of water exposure after approx. 8–9 h, tests performed after 3 h and 6 h were taken into account. Previous analyses, that suggested the use of power function vs. time for the trendline, were also taken into account. After many tests, the best match between the measured values and the model was obtained for Equation (6), where means the compressive strength of the floor rocks after 6 h of contact with water (total immersion in water) and σc the strength of rocks in the dry state. In the case of tested claystones in subsequent excavations the coefficient nw was determined as: 0.402, 0.593, and 0.829.
For the model thus developed, r = 0.895, r2 = 0.802, and SE = 13.57. Diagrams for the values measured and projected for time t and the decrease in nw strength are shown in Figure 25 and Figure 26, while in Figure 27 and Figure 28 residual plots for the model are presented. Table 4 shows the model statistics. It is remarkable in the model that the residuals values do not increase considerably for the consecutive points.
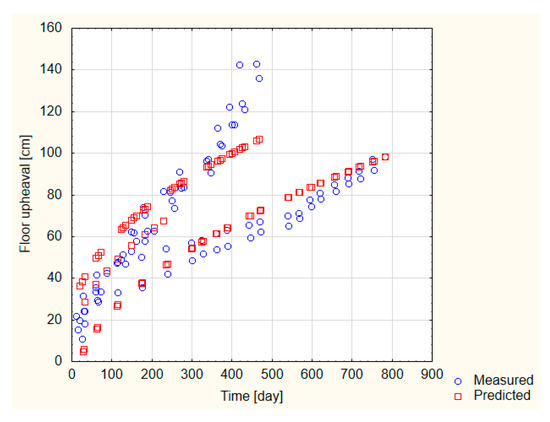
Figure 25.
Multiple regression analysis results—measurement time.
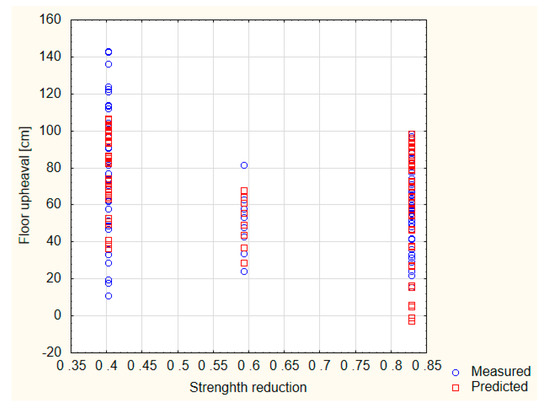
Figure 26.
Multiple regression analysis results—strength reduction due to water exposure.
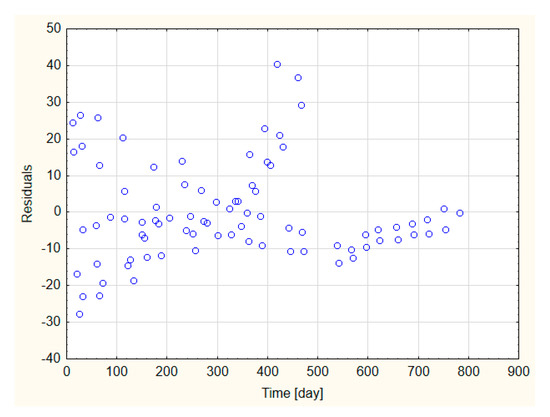
Figure 27.
Residual plots for measurement time.
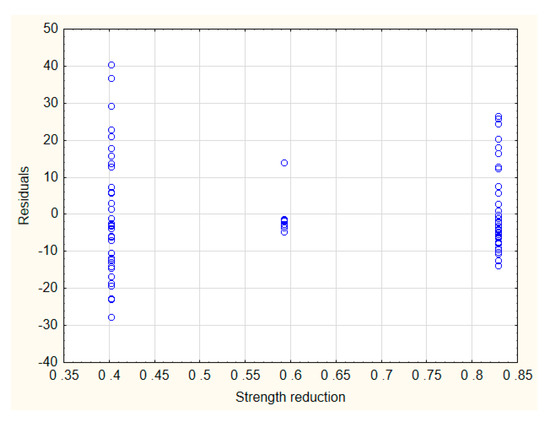
Figure 28.
Residual plots for strength reduction due to water exposure.
Table 4.
Regression statistics of the model describing the floor upheaval in the roadway sections with groundwater.
4. Discussion
Maintaining the stability of roadways is a problem for every underground mine. One of the key issues is the assessment and prevention of the floor heaving. The workings, which have a considerable length in relation to their transverse dimensions, are exposed to many different mining and geological factors that change the geomechanical situation. In this article the authors present the results of long-time measurement campaign in underground mines of floor heaving. Moreover, they present the results of the multiple regression of floor upheaval and chosen parameters that influence the phenomenon of floor upheaval in specific areas. In the study of floor upheaval two factors appear particularly conducive to its formation: the presence of faults and groundwater. Therefore, the in situ measurements in roadways were carried out in areas of presence of water or faults. The effect of these two factors were also compared with sections of excavations where they were absent. Convergence studies were carried out at 15 measurement stations in three coal mine excavations, where floor heaving measurements were carried out over up to 758 days. Such underground measurements are very rarely conducted.
Figure 29 shows the range of the floor upheaval recorded in a given excavation with a distinction between measuring stations due to the influence of tectonic disturbance (in red), water accumulation in floor rocks (in blue), and no additional factor (in green). All values were related to a common measurement time of maximum 129 days, which was determined by the shortest monitoring time at the station at 405 m in roadway F-33b.
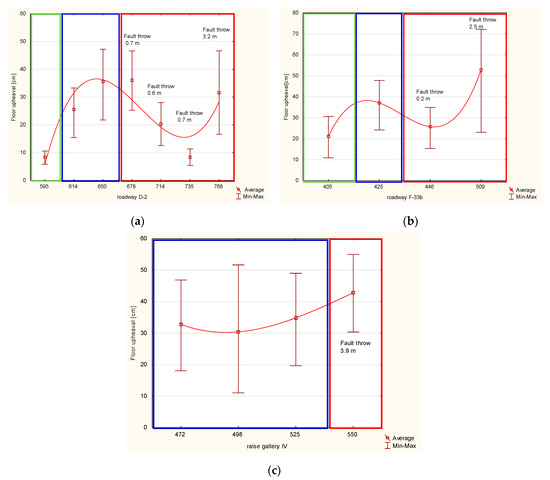
Figure 29.
Floor upheaval in a given excavation. (a) Roadway D-2; (b) Roadway F-33b; (c) Raise gallery IV.
The analysis of the research results showed that additional geological factors influencing the floor heaving cause two–four-fold increase in the upheaval value at the same time of observation. In the case of measurement points affected by waterlogged rocks, the floor upheaval is characterized by a relatively constant intensity, which emphasizes that the impact of water on the floor rocks with certain parameters is quite stable, i.e., the change in the strength of the rocks due to water exposure is constant. This is particularly evident in the case of the raise gallery IV (Figure 29c). It is interesting that employing the change of claystones Young’s modulus due to water exposure to regression analysis did not give the satisfactory results. Probably, the elastic character of Young modulus is lost after submerging claystone rock samples in water, and in such case this parameter does not reflect the real change of rock’s deformability. The fact that claystone samples broke apart after 7–9 h after submerging them in water did not allow for studying longer effects of water on strength reduction. Moreover, the reaction of claystones to water depends strictly on their mineral content, which can vary along the excavation [37].
At the points affected by the discontinuity of the rock mass in the form of faults, the magnitude of the upheaval varies, which is related to the magnitude of the faults throw (Figure 29a,b). In general, a larger throw of rock layers at the fault results in larger deformations of the floor, but this is not clear and requires further research in this area. The faults’ width was too small and too little varied to analyze its influence on floor upheaval. Similarly, the fault’s dip did not change considerably, so it could not influence the roadway floor upheaval substantially.
In order to illustrate the variability of the floor upheaval in each of the excavations in question, its average values were connected with an additional line, thus illustrating the magnitude of the floor heaving along the axis of the excavation.
One of the most important issues in designing of a new criterion for any phenomenon, is its validation. Unfortunately, the measurements of roadways floor heaving are very rarely carried out in mines, especially in sections of waterlogged or tectonically disturbed roadway. In this study, the obtained results were checked in only one dry and geologically undisturbed place in underground coal mine, so the Equation (2) was validated. It was the Drift W in another part of Borynia mine (Roadway F-33b was driven there). The measured and predicted floor upheaval observed over 5 years is shown in Figure 30. In this case the predicted values of floor deformation (red color) are 40–50% higher than measured, so the Equation (2) overestimates the real behavior of floor rock beds. However, it is worth noting that both floor heaving trends are very similar, which proves that the form of developed logarithmic equation is in principle correct. More data could help the improvement of the so far developed relationship.
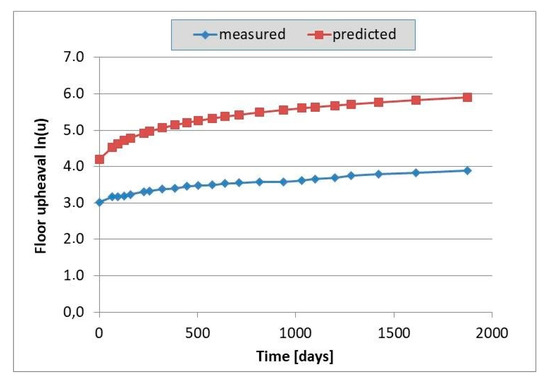
Figure 30.
Measured and predicted floor upheaval in Drift W.
It is obvious that floor upheaval is strongly correlated with a vertical convergence. In these cases R-squared value reaches even 0.978 (Table 5). But it is interesting that in the excavations driven in tectonic disturbed zones floor upheaval also highly correlated with the horizontal convergence, even though the participation of floor upheaval in vertical convergence can reach 93% (Table 5).
Table 5.
The relationship between floor upheaval and convergence.
In summary, because of the mining conditions (the exploitation fields layout, the number of extracted seams, their thickness, the distance to them, etc.,) the floor upheaval can differ several times. However, the intensity of the floor heaving phenomenon is primarily time-dependent. The global equations that allow to calculate the floor heaving require additional quantitative parameter related to geological situation. Then complex power equation or linear equation can be employed, that significantly improves the correlation between the analytical model of the floor upheaval and the in situ observations. The high coefficients of regression prove that additional parameters in derived equations are chosen correctly.
High precision of the empirical formulae for floor upheaval prediction can be achieved only through underground measurements over a long period of time.
5. Conclusions
The analysis of measurement results and statistical analysis showed that:
- The floor heaving phenomenon in undisturbed geological areas is time-dependent and for individual working the value of the upheaval ufl can be described by a quadratic equation: . The depth of excavation and the mechanical rocks parameters affect the parameters a, b, and c, which may vary significantly and should be selected on the basis of observations made in the excavation. The above equation allows to determine the extremum, i.e., the time after which the biggest deformations of the floor should be expected.
- In the case of absence of geological factors that can affect the rock mass structure, the multiple regression shows that the global floor upheaval can be determined quite good with the help of logarithmic equation, which take into consideration the mechanical rock parameters: compressive strength σc and Young’s modulus E. The equation is as follows and its correlation coefficient is 87.2%:
- In the case of waterlogged rocks or the vicinity of small faults for individual excavations, the floor upheaval can also be determined by a time function. This is a power function of a general form: for which the correlation coefficients are very high, ranging from 92.3% to 99.1%. Thus, in the case of a single excavation, the above equation can be successfully applied, previously determining constants a and b on the basis of several measurements taken in the selected excavation of the mining field.
- In order to unify the prediction of the floor upheaval for any given excavation, a multiple regression analysis was performed. On its basis, it has been shown that the floor upheaval can be determined by complex power equations, taking into account the additional parameters in addition to time t. After many tests, the following were selected, respectively: change of strength of waterlogged rocks after 6 h of immersion of the rock σcs 6h in water and the throw of an adjacent fault—f. These equations are as follows:Statistical analysis has shown that the matching of the above models to the measurement data is then high and amounts to r = 0.841 and r = 0.895, respectively.
- The equations determined on the basis of underground measurements conducted in one of the excavations in the common mining filed should allow for the prediction of floor heaving in other excavations driven in the given mining site.
Author Contributions
Conceptualization, P.M. and Ł.O.; Methodology, P.M. and Ł.O.; Investigations, Ł.O.; Validation, P.M. and Ł.B.; Formal Analysis, P.M. and Ł.B.; Writing-Original Draft Preparation, Ł.B. and P.M.; Writing-Review & Editing, P.M.; Visualization, Ł.O., Ł.B. and P.M.; Supervision, P.M. All authors have read and agreed to the published version of the manuscript.
Funding
This research received no external funding.
Conflicts of Interest
The authors declare no conflict of interest.
References
- Zaslavskij, U. Исследoвание прoявлений гoрнoгo давления в капитальных вырабoтках глубoких шахт Дoнецкoгo бассейна. [Investigation of Rock Pressure Manifestations in Capital Roadways of Deep Mines in Donbas]; Nedra: Moscow, Russia, 1966. (In Russian) [Google Scholar]
- Kidybiński, A. Podstawy Geotechniki Kopalnianej; Wydawnictwo Śląsk: Katowice, Poland, 1982. (In Polish) [Google Scholar]
- Bondarenko, V.; Simanovich, G.; Kovalevska, I.; Fomichov, V.; Serdiuk, V. Research of Rock Stresses and Deformations Around Mining Workings. In Technical, Technological and Economical Aspects of Thin-Seams Coal Mining, International Mining Forum, 2007; Informa UK Limited: Colchester, UK, 2007; pp. 47–56. [Google Scholar]
- Zhou, Z.; Zhu, C.; Li, Q.; Shi, Y. The Mechanism of Mining Roadway Floor Heave and Its Control Measures. Electron. J. Geotech. Eng. 2015, 20, 11467–11475. [Google Scholar]
- Galvin, J. Ground Engineering—Principles and Practices for Underground Coal Mining; Springer: Berlin/Heidelberg, Germany, 2016. [Google Scholar]
- Khalymendyk, I.; Baryshnikov, A. The mechanism of roadway deformation in conditions of laminated rocks. J. Sustain. Min. 2018, 17, 41–47. [Google Scholar] [CrossRef]
- Mo, S. Floor Heave Mechanisms in Underground Coal Mine Roadways. Ph.D. Thesis, Faculty of Engineering, UNSW, Sydney, NSW, Australia, September 2019. [Google Scholar]
- Liu, S.; Bai, J.-B.; Wang, X.; Wu, B.; Wu, W. Mechanisms of Floor Heave in Roadways Adjacent to a Goaf Caused by the Fracturing of a Competent Roof and Controlling Technology. Shock. Vib. 2020, 2020, 1–17. [Google Scholar] [CrossRef]
- Mo, S.; Tutuk, S.; Saydan, S. Management of floor heave at Bulga Underground Operations—A case study. Int. J. Min. Sci. Technol. 2019, 29, 73–78. [Google Scholar] [CrossRef]
- Wang, J.; Guo, Z.; Yan, Y.; Pang, J.; Zhao, S. Floor heave in the west wing track haulage roadway of the Tingnan Coal Mine: Mechanism and control. Int. J. Min. Sci. Technol. 2012, 22, 295–299. [Google Scholar] [CrossRef]
- Takuski, S. Niektóre Zagadnienia Wyciskania i Zwalczania Wyciskania Spodu Wyrobisk Górniczych. [Some Problems with Floor Squeezing and Its Controlling in Underground Excavations]; Zeszyty Naukowe AGH: Kraków, Poland, 1966; Rozprawy no 59. (In Polish) [Google Scholar]
- Jun-Jie, H.; Qin, Y.; Shuang, Z.; Wei, W.; Lei, W. Strength response characteristics and coupling support of deep roadway in soft rock masses. Cogent Eng. 2017, 4. [Google Scholar] [CrossRef]
- Zhao, B.; Liu, Z.; Tong, C. Research on Stress Distribution and Failure Depth of Mining Floor During the First Weighting of Main Roof. Open Civ. Eng. J. 2015, 9, 763–767. [Google Scholar] [CrossRef]
- Zhang, N.; Zhang, N.; Wang, H.; Ma, B.; Sun, Y.; Esterle, J. Floor failure depth of the roadway in soft rocks of deep coalmine: A case study. Electron. J. Geotech. Eng. 2016, 21, 1833–1845. [Google Scholar]
- Małkowski, P.; Ostrowski, Ł. Wpływ właściwości mechanicznych skał otaczających wyrobisko korytarzowe na zjawisko wypiętrzania spągu. Przegląd Górniczy 2014, 12, 78–90. (In Polish) [Google Scholar]
- Sun, X.; Wang, N.; Feng, J.; Zhang, C.; Chen, Y. Deformation control of asymmetric floor heave in a deep rock roadway: A case study. Int. J. Min. Sci. Technol. 2014, 24, 799–804. [Google Scholar] [CrossRef]
- Lai, X.; Xu, H.; Shan, P.; Kang, Y.; Wang, Z.; Wu, X. Research on Mechanism and Control of Floor Heave of Mining-Influenced Roadway in Top Coal Caving Working Face. Energies 2020, 13, 381. [Google Scholar] [CrossRef]
- Wang, K.; Huang, Y.; Gao, H.; Zhai, W.; Qiao, Y.; Li, J.; Ouyang, S.; Li, W. Recovery Technology of Bottom Coal in the Gob-Side Entry of Thick Coal Seam Based on Floor Heave Induced by Narrow Coal Pillar. Energies 2020, 13, 3368. [Google Scholar] [CrossRef]
- Kang, Y.; Liu, Q.; Gong, G.; Wang, H. Application of a combined support system to the weak floor reinforcement in deep underground coal mine. Int. J. Rock Mech. Min. Sci. 2014, 71, 143–150. [Google Scholar] [CrossRef]
- Xiao, Z.; Liu, J.; Gu, S.; Liu, M.; Zhao, F.; Wang, Y.; Ou, C.; Zhen, M. A Control Method of Rock Burst for Dynamic Roadway Floor in Deep Mining Mine. Shock. Vib. 2019, 2019, 1–16. [Google Scholar] [CrossRef]
- Zingano, A.C.; Koppe, J.C.; Costa, J.F. Floor heave in shallow room-and-pillar mining. In Proceedings of the 21st International Conference on Ground Control in Mining, Lakeview Scanticon Resort & Conference Center, Morgantown, WV, USA, 6–8 August 2002. [Google Scholar]
- Piotr, M.; Łukasz, O.; Piotr, B. Modelling the Small Throw Fault Effect on the Stability of a Mining Roadway and Its Verification by In Situ Investigation. Energies 2017, 10, 2082. [Google Scholar] [CrossRef]
- Piotr, M.; Łukasz, O.; Piotr, B. The Impact of the Low Throw Fault on the Stability of Roadways in a Hard Coal Mine. Stud. Geotech. Mech. 2017, 39, 63–72. [Google Scholar] [CrossRef]
- Guo, G.; Kang, H.; Qian, D.; Gao, F.; Wang, Y. Mechanism for Controlling Floor Heave of Mining Roadways Using Reinforcing Roof and Sidewalls in Underground Coal Mine. Sustainability 2018, 10, 1413. [Google Scholar] [CrossRef]
- Feng, G.; Li, S.; Wang, P.; Guo, J.; Qian, R.; Sun, Q.; Hao, C.; Wen, X.; Liu, J. Study on Floor Mechanical Failure Characteristics and Stress Evolution in Double Predriven Recovery Rooms. Math. Probl. Eng. 2020, 2020, 1–13. [Google Scholar] [CrossRef]
- Feng, Q.; Jiang, B. Analytical solution for stress and deformation of the mining floor based on integral transform. Int. J. Min. Sci. Technol. 2015, 25, 581–586. [Google Scholar] [CrossRef]
- Guo, B.; Lu, T. Floor Heave Behavior and Control of Roadway Intersection in Deep Mine. In Proceedings of the Geotechnical Aspects of Underground Construction in Soft Ground; Informa UK Limited: Colchester, UK, 2008. [Google Scholar]
- Mo, S.; Yee, P.; O’Sullivan, T.; Masoumi, H.; Canbulat, I. Floor Heave Monitoring Using Floor Instrumentation. Coal’s Operator’s Conference, University of Wollongong 2020. Available online: https://ro.uow.edu.au/coal/761/ (accessed on 25 June 2020).
- Goszcz, A. Elementy Mechaniki Skał Oraz Tąpania w Polskich Kopalniach Węgla i Miedzi; Biblioteka Szkoły Eksploatacji Podziemnej, seria z Lampką Górniczą nr 2; Wydaw; IGSMiE PAN: Kraków, Poland, 1999. (In Polish) [Google Scholar]
- Gong, P.; Ma, Z.; Ni, X.; Zhang, R.R. Floor Heave Mechanism of Gob-Side Entry Retaining with Fully-Mechanized Backfilling Mining. Energies 2017, 10, 2085. [Google Scholar] [CrossRef]
- Mo, S.; Ramandi, H.L.; Oh, J.; Masoumi, H.; Canbulat, I.; Hebblewhite, B.K.; Saydam, S. A new coal mine floor rating system and its application to assess the potential of floor heave. Int. J. Rock Mech. Min. Sci. 2020, 128, 104241. [Google Scholar] [CrossRef]
- Wang, H.; Jiang, Y.; Xue, S.; Mao, L.; Lin, Z.; Deng, D.; Zhang, D. Influence of fault slip on mining-induced pressure and optimization of roadway support design in fault-influenced zone. J. Rock Mech. Geotech. Eng. 2016, 8, 660–671. [Google Scholar] [CrossRef]
- Lozynskyi, V.; Saik, P.; Petlovanyi, M.; Sai, K.; Malanchuk, Y. Analytical Research of the Stress-Deformed State in the Rock Massif around Faulting. Int. J. Eng. Res. Afr. 2018, 35, 77–88. [Google Scholar] [CrossRef]
- Babets, D.; Sdvyzhkova, O.; Shashenko, O.; Kravchenko, K.; Cabana, E.C. Implementation of probabilistic approach to rock mass strength estimation while excavating through fault zones. Min. Miner. Deposits 2019, 13, 72–83. [Google Scholar] [CrossRef]
- Bondarenko, V.; Kovalevska, I.; Symanovych, H.; Barabash, M.; Snihur, V. Assessment of parting rock weak zones under the joint and downward mining of coal seams. E3S Web Conf. 2018, 66, 03001. [Google Scholar] [CrossRef]
- Erguler, Z.; Ulusay, R. Water-induced variations in mechanical properties of clay-bearing rocks. Int. J. Rock Mech. Min. Sci. 2009, 46, 355–370. [Google Scholar] [CrossRef]
- Małkowski, P.; Ostrowski, Ł.; Bożęcki, P. The impact of the mineral composition of Carboniferous claystones on the water-induced changes of their geomechanical properties. Geol. Geophys. Environ. 2017, 43, 43. [Google Scholar] [CrossRef]
- Li, C.; Zuo, J.; Wei, C.; Xu, X.; Zhou, Z.; Li, Y.; Zhang, Y. Fracture Development at Laminated Floor Layers Under Longwall Face in Deep Coal Mining. Nat. Resour. Res. 2020, 1–15. [Google Scholar] [CrossRef]
- Tang, S.; Tang, C. Numerical studies on tunnel floor heave in swelling ground under humid conditions. Int. J. Rock Mech. Min. Sci. 2012, 55, 139–150. [Google Scholar] [CrossRef]
- Yu, Y.; Gu, S.; Li, J.; Zheng, X. Study on the mechanism and control technology of floor heave in the laneway. In Proceedings of the Asia-Pacific Power and Energy Engineering Conference (APPEEC 2010), Chengdu, China, 28–31 March 2010; pp. 617–620. [Google Scholar]
- Hoek, E.; Diederichs, M. Empirical estimation of rock mass modulus. Int. J. Rock Mech. Min. Sci. 2006, 43, 203–215. [Google Scholar] [CrossRef]
- Palchik, V. On the Ratios between Elastic Modulus and Uniaxial Compressive Strength of Heterogeneous Carbonate Rocks. Rock Mech. Rock Eng. 2010, 44, 121–128. [Google Scholar] [CrossRef]
- Małkowski, P.; Ostrowski, Ł.; Brodny, J. Analysis of Young’s modulus for Carboniferous sedimentary rocks and its relationship with uniaxial compressive strength using different methods of modulus determination. J. Sustain. Min. 2018, 17, 145–157. [Google Scholar] [CrossRef]
- Malik, M.H.; Rashid, S. Correlation of some engineering geological properties of the Murree formation at lower Topa (Murree district), Pakistan. Geol. Bull. Univ. Peshawar 1997, 30, 69–81. [Google Scholar]


Publisher’s Note: MDPI stays neutral with regard to jurisdictional claims in published maps and institutional affiliations. |
© 2020 by the authors. Licensee MDPI, Basel, Switzerland. This article is an open access article distributed under the terms and conditions of the Creative Commons Attribution (CC BY) license (http://creativecommons.org/licenses/by/4.0/).