Abstract
An efficient method of simulating pressure loss in a separator with metal foam is reported. In this method, a metal foam is modeled as a porous media having homogenized permeability and inertial resistance coefficients. The permeability and inertial resistance coefficients were obtained by a numerical method that was validated by experimental data from a literature. Then the pressure drop in the separator with metal foam replaced by porous media was efficiently simulated under different working conditions, and the results were analyzed. It was found that the porous media had a great effect on the pressure drop in the separator. As pores per inch (PPI) and rotating speed increase and porosity decreases, the pressure drop of the separator increases. The results indicate that replacing metal foam by porous media is effective and simulating the pressure drop is feasible and effective in a separator with metal foam.
1. Introduction
The oil/air separator, also known as the breather, is an important component of an aero-engine lubricating oil system. Its function is to separate the oil droplets from the oil and gas mixture due to the sealed bearings and then retrieve the lubricating oil. Therefore, the oil consumption is reduced with less pollution. Traditional aero-engine separators [1] use centrifugal action to achieve oil and gas separation. Due to the relatively large mass of oil droplets and the action of the centrifugal force, the oil droplets will be thrown to the wall and then recovered. However, for traditional separators, a larger radial dimension and a faster rotating speed are required in order to provide sufficient centrifugal force, which is detrimental to the weight and compactness of the engine and also increases maintenance costs.
Metal foams, in which there is a continuous three-dimensional porous structure, are a new type of material. These have many useful features [2] such as lighter weight, higher porosity, and larger surface-to-volume ratio. All of these features make the metal foam suitable as filter media. Therefore, metal foams have been extensively used in engineered applications [3,4,5,6,7,8].
Metal foam can effectively increase the capture efficiency of oil droplets when used as a filter medium in a separator, and thus reduce the size and rotating speed of the separator. However, the improvement of the separation efficiency always results in the increase of the pressure drop [9]. That is, the pressure drop of the separator will become larger after metal foams are added, which may affect the bearing seal. Therefore, it is necessary to study the pressure loss changes in metal foam and the flow field characteristics of a separator with metal foam.
Previous work to study the metal foam experimentally has been carried out. Willenborg [10] investigated separation of small oil droplets and pressure drop in a rotating separator with metal foam by experiment. The results show that higher separation efficiency is always accompanied by larger pressure loss. This depends on the specific application that which of the pressure loss and separation efficiencies is more important to the separator design. Koltsakis [11] studied metal foam made of Ni-based superalloy. Those experiments tested flow, pressure drop and filtration efficiency. The results show that with a careful design and a proper selection of the pore size, the metal foam has a comparatively high separation efficiency with a low pressure loss. Mancin [12] investigated the pressure drop in six aluminum metal foams with different numbers of pores per inch (PPI), porosities, and air flow rates. Based on these experimental data, a new model was presented to describe pressure drop. Dukhan [13] experimentally studied the effect of the metal foams’ transverse size to the pressure loss. The authors concluded that the pressure drop was not affected by changes in diameter when the diameter is no less than a certain value. Ninad Trifale [14] researched the mechanical characteristics of metal foams. Azzi [6] tested the heat transfer and pressure loss in an open-cell metal foam.
Although experiments are a good choice for studying metal foam, computer simulation is a more efficient and less costly method to determine the flow field characteristics and pressure drop of metal foam in a separator. Thiago [15] presented a modeling methodology to simulate detailed structure in a porous medium, and a new geometry, Weaire–Phelan geometry, was established, although the results were inconclusive. Skibinski [16] studied the relationship between the size of the pores and the pressure loss in an open-cell metal foam. The foam structures were created using Laguerre–Voronoi tessellations based procedure, and pressure drop was solved by the finite volume method. The results showed the pressure drop had a strong relationship with the pore volume distribution, and a relationship between the pore volume and the pressure drop was also found. Koltsakis [17] used a computational fluid dynamic (CFD) method to obtain the macroscopic structure optimization for a metal foam. Fly [18] simulated liquid water transport in metal foams by volume of fluid (VOF) method, the computational domain is only 1.9 mm × 2.8 mm × 0.9 mm.
The previous works on simulation mostly focused on the detailed structure of the metal foam, which is hard to apply to a whole piece of metal foam directly due to huge computational consumption. The focus of the current research is to develop a numerical method to simulate the pressure drop of a separator with metal foam, which will be more efficient than the method of using the detailed structure of metal foams. The sketch of the separator is displayed in Figure 1. The mixture is pushed into a metal foam by blades, and the oil is filtered and separated by centrifugal force. The oil is thrown out of the radial orifices, and the air flows out through the center of the shaft. Since the oil volume fraction is quite small (<1%) [19] in an oil/air separator, and the oil has no significant effect on pressure drop, there is only air in simulation. The metal foam rebuilt by the BCC model was modeled as a continuum with homogenized permeability and inertial resistance coefficient. The coefficients were obtained by simulation. The flow field is solved by the Navier–Stokes (N-S) equation with a k-ε turbulence model. The pressure drop in a separator was simulated with different geometric parameters of the metal foam and the results were analyzed.
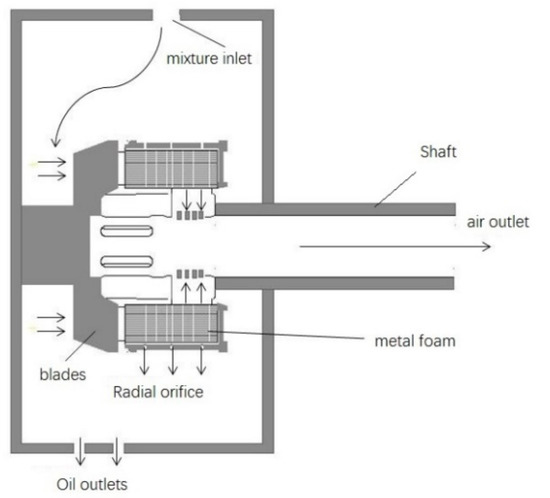
Figure 1.
Sketch of the air/oil separator.
2. Simulation Method of Metal Foam
The greatest challenge of simulating pressure drop in a metal foam separator is how to deal with the metal foam. The small holes in metal foam need millions of grids to describe, which will be time consuming. In order to simulate the pressure drop in the metal foam efficiently, simplification of metal foam is necessary. In this study, the metal foam was simplified as porous media with homogenized permeability and inertial resistance coefficient. Different metal foams have different resistance coefficients when they are treated as porous media. Obtaining the resistance coefficients of different metal foams is a key point to simulate pressure drop. In the current study, a simulation method was reported, which is described in the next two sub-sections.
2.1. Rebuilding the Structure of a Metal Foam
A metal foam is a complex disordered structure. It is difficult to create a geometric model of metal foam. In simulation, an orderly geometric model is usually used instead of the real disordered structure [20,21]. A geometric model should have the same porosity and PPI as the real metal foam. There are mainly three methods to simplify the metal foam. Those are the prism model [22,23], the face-centered cubic (FCC) model [24], and the body-centered cubic (BCC) model [25,26]. The prism model, shown in Figure 2a, is the simplest model and has good versatility. It can simulate almost all of the porosity in the metal foam. However, the defect is obvious. It has a wide range of straight channels in three dimensions, and as the droplets flow into the channel they are not allowed to change direction to reach the exit, which is clearly not the actual movement of oil droplets in metal foam. The FCC model, shown in Figure 2b, is formed by cutting a sphere in the center of a cube. A FCC model is geometrically similar to the prism model and has some characteristics of the prism model, such as simple modeling, but the channel is not straight. A BCC model is created by removing spheres from the center and each of the eight vertices of a cube, which is shown in Figure 3. The model has more channels and can be applied to higher porosity. A common method to generate real metal foam is to blow foaming gas into molten metal, and as the metal solidifies, the gas bubbles leave a porous material. In the process, gas bubbles can grow randomly from every direction. The BCC model assumes that bubbles grow from the center and the eight vertices of a cube, while the FCC model assumes that only one big bubble grows from the center of the cube. The BCC model more closely resembles a real metal foam structure and is, therefore, employed in this study.
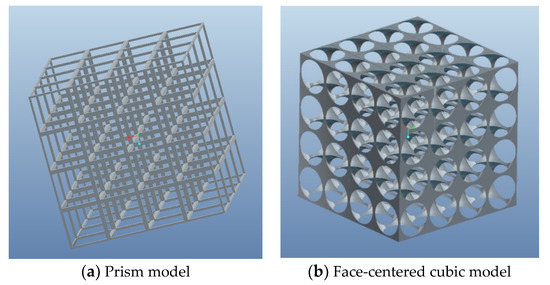
Figure 2.
The structure of metal foam described by different models.
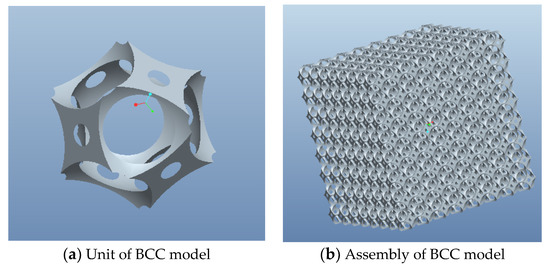
Figure 3.
Body-centered cubic (BCC) model.
The metal foam has two important geometric parameters: porosity and PPI. The BCC model also has two geometric parameters, namely the side length of the cube and the diameter of the sphere. Obtaining the relationship between these parameters is the first step to use the BCC model to simulate the metal foam structure.
As described before, the framework of a cell in metal foam is cut from a cube by spheres. Here, assuming the side length of the cube is “a”, and the diameter of the sphere is “d”. The PPI can be computed by Equation (1) directly. The unit of “a” and “d” is the centimeter.
According to geometric relationship, the diameter of sphere can be larger or smaller than the side length of cube, thus porosity can be computed by Equations (2) and (3).
where , . and have no specific meaning, only making the equations concise.
In order to ensure that the pores are connected to each other and at the same time the framework is also connected, “a” and “d” should satisfy the relationship as follows:
According to this relationship between “a” and “d”, the BCC model can simulate a metal foam porosity range of , which includes the range in this study.
2.2. Obtaining Resistance Coefficients
In the study, a metal foam is modeled as porous media with homogenized permeability and inertial resistance coefficient. In general, a porous media is simulated by adding a momentum source term to the flow equations. The source can be displayed by a Darcy–Forchheimer equation as follows:
where, is the permeability, and is known as the viscous resistance factor, is the inertial resistance factor. They are two important parameters for a porous media which are unknown for a metal foam. is the viscosity of the flow, is the density of the flow, and is the velocity of the flow. In this study, these two parameters are obtained by simulations which will described below [27,28]. In actual situations, the flow is the mixture of air and oil. In previous studies, the researchers found pressure loss can be generated by liquid holdup related to the multiphase flow properties [29,30,31]. However, considering the mixture is spare multiphase flow and the droplets are much smaller than the holes in metal foam [10], only air is taken into account in the simulation. The simulation based on six assumptions [27]:
- (1)
- the flow is steady;
- (2)
- the flow is non-Darcy flow, which satisfies the Darcy–Forchheimer law;
- (3)
- the Klinkenberg effect is neglected;
- (4)
- the porous media is rigid.
- (5)
- the temperature and viscosity are constant;
- (6)
- the porous media is rigid.
The fluid flow is in a straight pipe which has metal foam in it. The parameters are of density of velocity, of pressure on outlets, and , , and , , are on inlets. A sketch is displayed in Figure 4. On the base of these two sets of simulation parameters, one set of resistance coefficients can be obtained as follows.
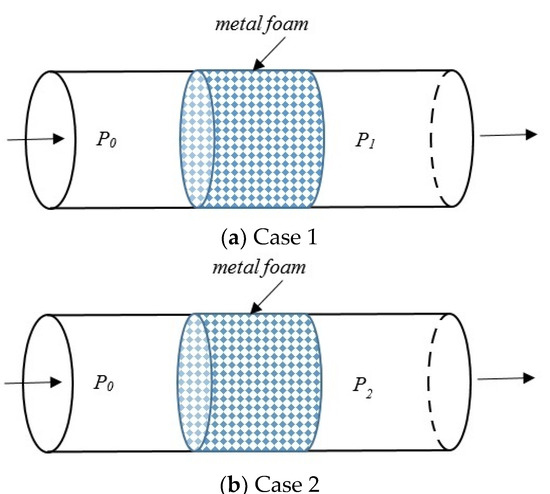
Figure 4.
Numerical experiments on obtaining porous media parameters.
The continuous equation of a one-dimensional pipe flow is as follows:
The state equation is:
where, Q is the mass flow rate and R is the gas constant.
According to Equations (6) and (7):
Substituting Equation (8) into Equation (5):
The integral of Equation (9) is:
The boundary conditions are that and , so .
When the fluid passes through the metal foam, the pressure becomes:
When the inlet velocity and the outlet pressure are specified, , , , can be obtained by simulation, then yields:
According to Equations (12) and (13), the viscous resistance coefficient and inertial resistance coefficient are derived as:
Several simulations are performed, which will give a best fit of the resistance coefficients.
In the current study, we follow the process described above to get the viscous resistance coefficient and inertial resistance coefficient.
3. Simulation Method of Pressure Drop in the Separator
3.1. Geometry of the Separator with Metal Foam
The geometry of the separator with metal foam is shown in Figure 5. The thickness of the metal foam in the axial direction is 45 mm, and the inner and outer diameters are 56 mm and 93 mm, consecutively. Figure 5 illustrates the internal structure. Part ③ was filled with metal foam. When the separator rotates, the oil-air mixture is pressed by a blade ① into the metal foam through the metal foam inlet (part ②). In the metal foam, most of the oil droplets are captured by the framework, and then the oil is scavenged through holes on the outside wall of the metal foam. The remaining oil and air are discharged through an exhaust (part ④). In this study, the aim is to investigate the pressure drop. To simplify the simulation and make the results clearer, the fluid is only air in the simulation.
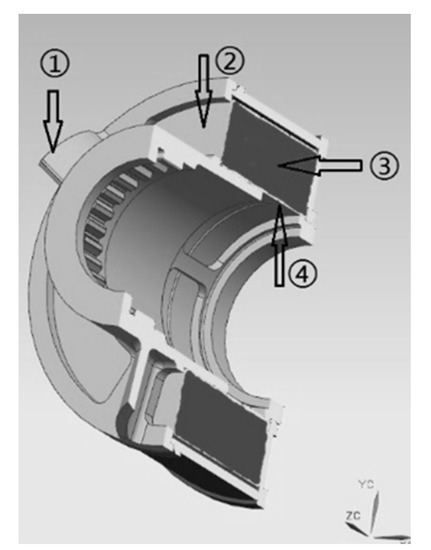
Figure 5.
Geometry of a separator with metal foam.
The computational domain is shown in Figure 6a,b. In order to reduce the outlet effect, the boundary of the outlet was extended by the length of the inner diameter to the downstream. Since the domain is rotating, it is difficult to determine the inlet boundary condition. In this study, a stationary domain is added around the rotating domain. The rotating domain is simulated by N–S equations with centrifugal force, and the velocity in N–S equation is relative velocity. The stationary domain is solved by the standard N–S equations, and the velocity is absolute velocity. Because the velocities are different in two domains, interface is employed between the stationary domain and the rotating domain. The metal foam is specified as a porous zone which is modeled by the addition of a momentum source term composed of a viscous loss term and inertial loss term. Other no-porous parts are solved by N–S equations with no loss term of momentum source. There is not interface between the porous part and the neighboring non-porous parts.
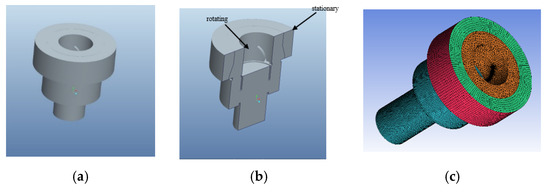
Figure 6.
Computational domain and meshes of the separator. (a) Computational domain of the separator. (b) Half of the computational domain of the separator. (c) Meshes of the computational domain.
3.2. Grid Dependence
A mixed grid scheme is used, as displayed in Figure 6c. Tetrahedral mesh is applied in the orange domain, and hexahedral mesh is adopted in other domains. The grids around the wall are dense with a dimensionless wall distance y+ of about 5, which is necessary to capture the near-wall turbulent region and be mesh independent. The total grid number is approximately 1.2 million. Pressure on the inner wall of metal foam is checked to investigate the grid dependence. The location is on the red line in Figure 7a. Pressure on three different sets of meshes is shown in Figure 7b. It appears that the numerical solution with smaller cells will not change significantly.
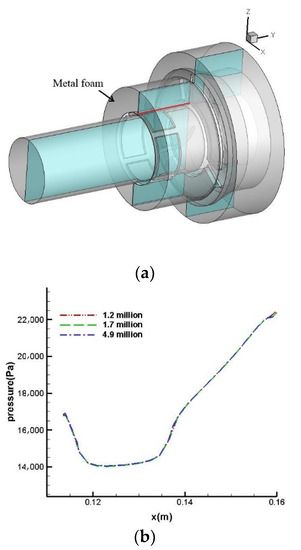
Figure 7.
Grid dependence. (a) Location of the inner wall. (b) Pressure on the inner wall of metal foam with different grids.
3.3. Boundary and Solutions
The commercial software Fluent (14, ANSYS, Canonsburg, PA, USA) [32] was employed in this study. The Navier–Stokes equations are solved according to a finite-volume approach. Centrifugal force and loss terms are added to N–S equations as a momentum source for the rotating domain and porous zone. A two-equation k-epsilon turbulence model with the enhanced wall function was used to close the governing equations. They are discretized by a second-order upwind scheme, and pressure-based implicit solver is employed using the Green–Gauss cell-based gradient option. Also, the SIMPLE algorithm is used in the solution controls. The inlet sets the mass flow rate boundary condition, and the outlet is the pressure boundary condition. Moving Reference Frame (MRF) is used to set rotating domain. Grid converged criterion was set to 10−3 for residuals.
4. Validation and Discussion
4.1. Validation
A metal foam with 88% porosity and 45 PPI [17] was selected to validate the simulation method of metal foam. Firstly, the BCC model was used to rebuild the tiny holes and framework in metal foam. A pipe with metal foam was shown in Figure 8. Since there is a huge number of grids to describe small holes in metal foam, half of the pipe was selected as a computational domain, which was shown in Figure 9. The details of the grids are shown in Figure 10. The grid number was about 6.9 million. Sixteen conditions were simulated as inlet velocity ranges from 0.5 m/s to 2 m/s with intervals of 0.1 m/s. The range of normal inflow Reynolds number is Re < 5.04 × 10⁴, which concludes that for metal foam in separator, Re < 4.01 × 10⁴. With the simulation results, viscous resistance coefficients and inertial resistance coefficients are computed according to Equations (11) and (12). After fitting, viscous resistance coefficient and inertial resistance coefficient are 3.36 × 10⁸ (1/m2) and 1.32 × 10⁴ (1/m) separately.
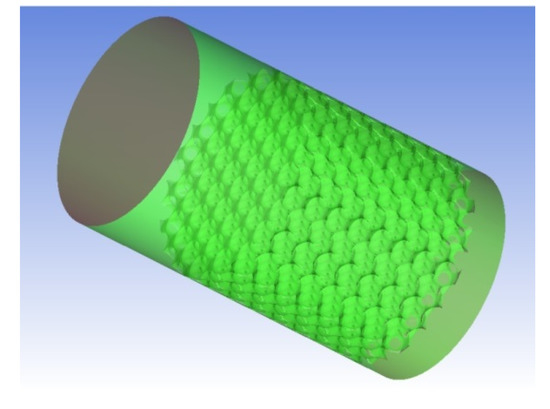
Figure 8.
Pipe with metal foam described by BCC model.
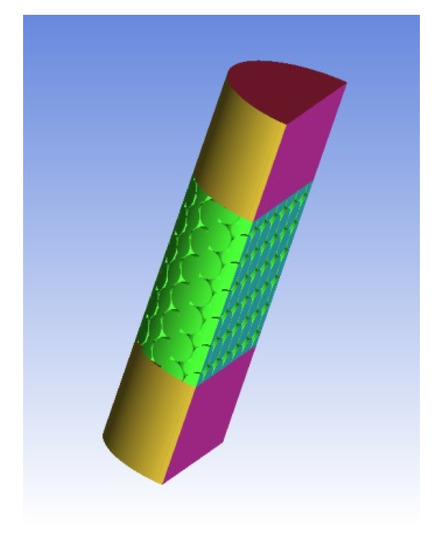
Figure 9.
Computational domain.
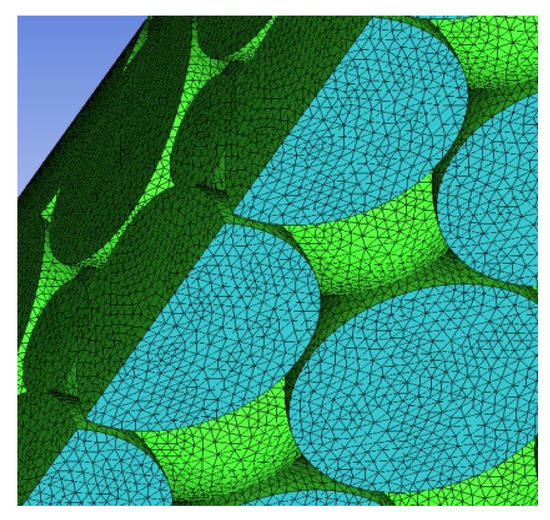
Figure 10.
Grids in metal foam.
Secondly, the metal foam was treated as porous media in the pipe simulation. A pipe with 140 mm diameter, which is accordance with literature [17], was selected to simulate the pressure drop. The length of the pipe is 260 mm. As shown in Figure 11, the yellow region in the middle of the pipe is the porous media with the resistance coefficient 3.3589 × 10⁸ (1/m2) and inertial resistance coefficient 1.3182 × 10⁴ (1/m). A hexahedral mesh was used, shown in Figure 12, and the number of grids was about 0.4 million.
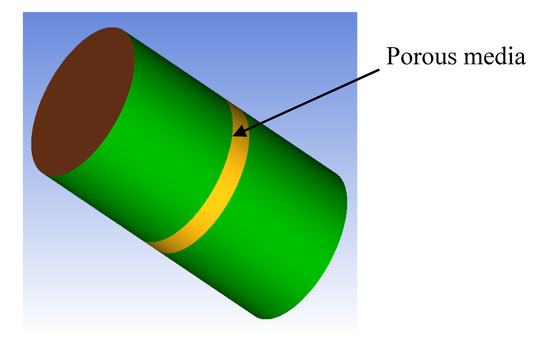
Figure 11.
Pipe simulation.
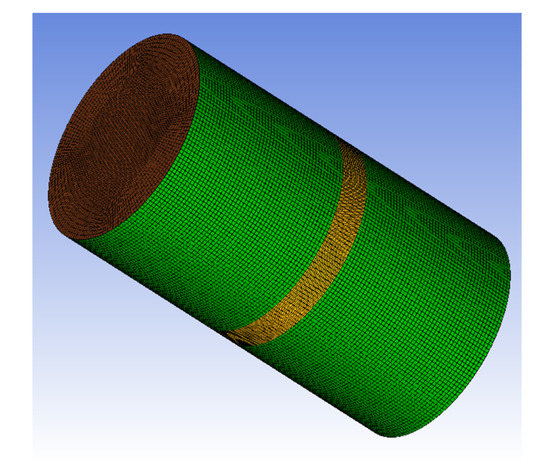
Figure 12.
Hexahedral mesh of the pipe.
Pipe simulations were performed with inlet velocity ranges from 0.5 m/s to 2 m/s. Figure 13a shows the contours of pressure with an inlet velocity of 1.5 m/s. Figure 13b shows the pressure at the centerline of the pipe. It can be seen that pressure drop occurs inside the metal foam which indicates the porous media here is effective.
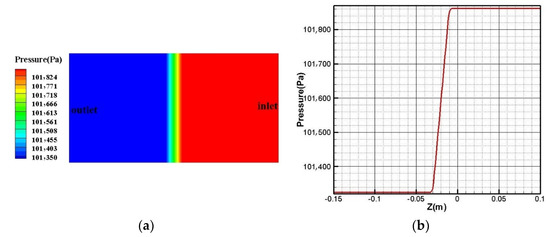
Figure 13.
(a) Contour of pressure. (b) Pressure at the centerline of the pipe.
Figure 14 is the comparison of the pressure drop in per unit thickness between simulation and experiment [17]. In [17], the foam material is a Ni-based superalloy and produced in sheets. The pressure drop in per unit length was measured as a function of velocity from 0–3 m/s. The result shows that high velocity gives rise to large pressure drop in per unit length. In Figure 14, the simulated result shows the higher the inlet velocity, the larger the pressure loss, which is in fairly good agreement with experimental data. Therefore, comparison indicates that this method can be used to simulate a metal foam.
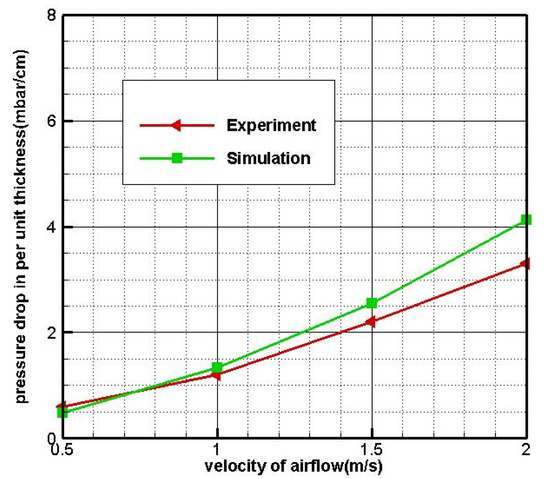
Figure 14.
Comparison between experiment and simulation.
4.2. Results and Discussion
In this section, the effects of rotating speed, PPI and porosity on pressure drop are analyzed. Different metal foams are used here. The resistance coefficients and inertial resistance coefficients are simulated by the above method, and the results are shown in Table 1.

Table 1.
Resistance coefficients for metal foams.
4.2.1. The Effect of Rotating Speed on Pressure Drop
The effect of rotating speed on pressure drop is analyzed. All of the cases have the metal foam with 92% porosity and 25 PPI, and mass flow rate is 30 g/s. The rotating speed varies from 0 rpm to 36,000 rpm.
First, the pressure drop in metal foam is analyzed. For easy observation, a cross section of the metal foam was selected to show the pressure change, as shown in Figure 15a, the red box area. Figure 15b–d show the pressure change with different rotating speeds in metal foam. When the separator is stationary, the high pressure is located at the inlet of the metal foam and the lower pressure is located at the outlet of the metal foam. From inlet to outlet, the pressure decreased. As the rotating speed increases, the pressure distribution in the metal foam changes. When the rotating speed is 18,300 rpm, the high pressure zone moves to the outside of the metal foam due to centrifugal force, as shown in Figure 15c. When the rotating speed reaches 36,000 rpm, the high pressure zone is almost all on the outside of the metal foam, as shown in Figure 15d. This indicates that centrifugal force is a main factor affecting the pressure distribution.
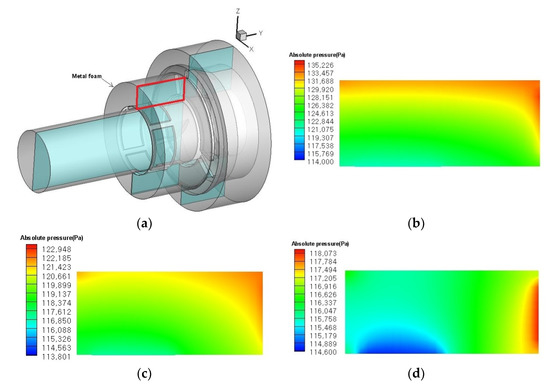
Figure 15.
Pressure distribution of a cross section of metal foam. (a) cross section; (b) 36,000 rpm; (c) 18,300 rpm; (d) 0 rpm.
Secondly, the pressure distribution on the metal foam inlet is discussed, as shown in Figure 16. In Figure 16a, there are three low pressure regions. That is because in the front of the metal foam there are three blades, where there is no air inflow. Meanwhile, there are three uniform high pressure regions. When the rotating speed is 0 rpm, the pressure of the inflow is uniform. As the rotating speed increase, the pressure distribution changes. On the suction side of the blades, there are three high pressure regions, which are closer to the outside of the metal foam. As the rotating speed increases, the pressure difference increases radially. High pressure concentrates on the outside of the metal foam.
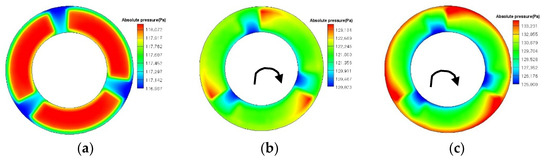
Figure 16.
Pressure distribution of the inlet of metal foam. (a) 0 rpm; (b) 18,300 rpm; (c) 36,000 rpm.
Thirdly, the change in pressure drop along the axial direction was analyzed. In order to analyze the pressure drop in metal foam, six section planes were created along the axial direction, as shown in Figure 17a. Figure 17b shows the average pressure on each section plane with different rotating speeds. Pressure decreases along the axial direction in the metal foam. The downward trend of pressure is relatively flat at all rotating speeds. As the rotating speed increases, the pressure in the metal foam also increases. Although the rotating speed increases at the same growth interval which is about 9000 rpm, the pressure increase becomes greater. This indicates rotating speed has a very important effect on pressure drop.
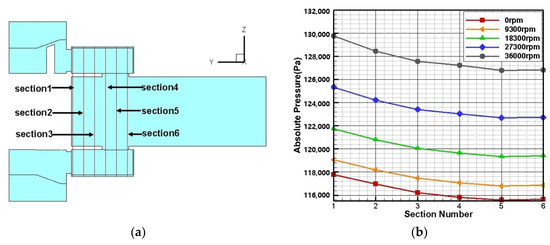
Figure 17.
Pressure drop along the axial direction in the metal foam (absolute pressure/Pa). (a) Six section planes were created along the axial direction. (b) The average pressure on each section plane with different rotating speeds.
Fourthly, the comparison of the pressure drop in the separator and the metal foam is discussed. Figure 18 shows the pressure drop changes with different rotation speeds in the separator and the metal foam. It can be seen that increasing the rotating speed leads to an increase in the pressure drop of the metal foam. However, as the rotating speeds increase, the difference becomes larger between the metal foam’s pressure drop and separator’s pressure drop. When the rotating speed is 9300 rpm, the ratio of the pressure drop in metal foam to that in the separator is 67.1%. However, when the rotating speed is 36,000 rpm, the ratio decreases to 52.2%. This indicates that when the rotating speed is high, rotation is a main cause of the pressure drop and the pressure drop of the metal foam becomes smaller.

Figure 18.
Pressure drop with different rotating speeds.
4.2.2. The Effect of Pores per Inch (PPI) on Pressure Drop
In this section, the effect of different PPI on pressure drop is discussed. The working conditions are as follows: mass flow rate is 30 g/s, rotating speed is 0 rpm, porosity is 92%, and pore density is 15 PPI, 25 PPI and 45 PPI.
Figure 19 shows pressure changing in the metal foam along the axial direction with different PPI. It can be seen that the pressure decreases in the metal foam along the axial direction. With smaller PPI, the pressure goes down more gradually. This is because smaller PPI means fewer pores in the same length of metal foam, which gives rise to smaller flow resistance. With the increase of PPI, the pressure change in the metal foam is very steep. In section plane 1 in particular, the pressure is very high. This means that the air flowing into the metal foam requires a higher pressure. In Figure 20, pressure drops are displayed in the metal foam and the separator. It can be seen that the pressure drop caused by the metal foam is a main factor in the pressure drop of the separator. When PPI is 15, the ratio of pressure loss in metal foam to that in the separator is 76.8%, while when the PPI is 45, the ratio becomes 81.8%. This indicates that metal foams with higher PPI have a greater effect on the pressure drop of the separator. From Figure 20, it can also be seen that the trends of pressure drop in the separator and in the metal foam with different PPI are approximately linear. It shows that a high PPI corresponds to a large pressure drop. The greater the PPI, the larger the pressure drop.
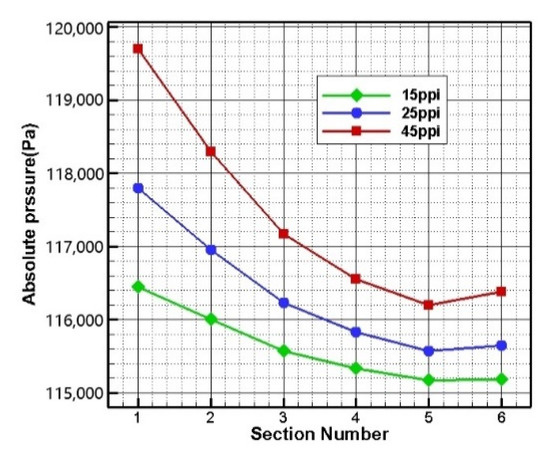
Figure 19.
Pressure changing in the metal foam along the axial direction with different PPI.
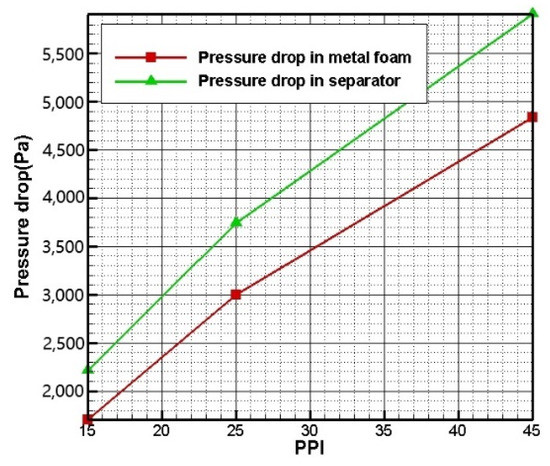
Figure 20.
Pressure drop with different PPI.
4.2.3. The Effect of Porosity on Pressure Drop
Porosity of the metal foam also affects the pressure drop. The working conditions are air flow rate of 30 g/s, rotating speed of 0 rpm, PPI of 25 and porosity of 80%, 86%, 92%. The pressure drops with different porosity are displayed in Figure 21. High porosity means less framework, more and bigger pores. As a result, the flow resistance and the pressure drop are small. Therefore, in Figure 21 it can be seen that the pressure in the metal foam with porosity of 92% changes more gradually, while the pressure in the metal foam with porosity of 80% changes sharply. For a porosity of 80%, the metal foam has a larger framework, which increases the flow resistance, so the inflow requires a larger pressure. In Figure 21, the porosity is decreasing at intervals of 6%, but the pressure increases in the metal foam inlet is not equal. From porosity of 92% to 86%, the metal foam inlet pressure increases 3323 Pa, while from porosity of 86% to 80%, the pressure increases 7739 Pa. This indicates that with lower porosity, much higher pressure is needed. Figure 22 displays the pressure drop changes with different porosity in metal foam and separator. It can be seen that lower porosity has a greater effect on pressure drop. As the porosity decreases, the pressure drop increases rapidly both in the metal foam and separator. However, as the porosity is 92%, 86%, 80%, the ratio of pressure loss in the metal foam to that in the separator is very close, about 81%. This indicates that metal foams with different porosity have no much effect on the ratio of the pressure drop in the metal foam to that in the separator.
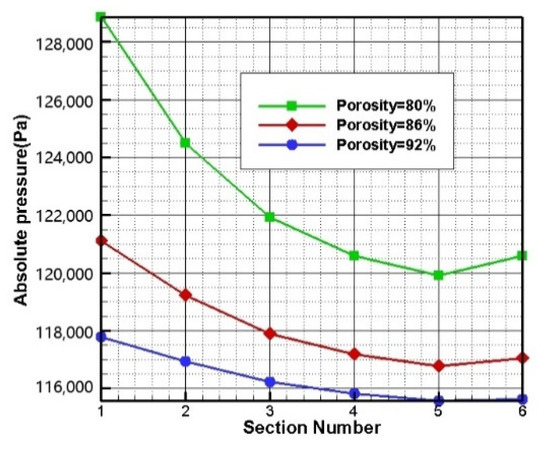
Figure 21.
Pressure changing in the metal foam along the axial direction with different porosity.
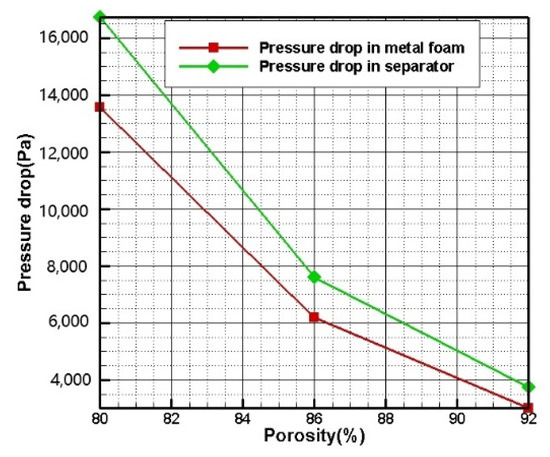
Figure 22.
Pressure drop with different porosity.
5. Conclusions
The method to simulate pressure drop in a metal foam in this study is feasible. A BCC model is effective for rebuilding the metal foam, and a porous media can be used to replace the metal foam. The viscous and inertial resistance coefficients which are necessary for porous media are obtained by simulations. The results of the comparison between simulation and experiment show fairly good agreement, which validates the method used in this study.
An air/oil separator with metal foam was simulated under different working conditions using this method. The metal foam has a great effect on pressure drop in the separator. Larger PPI and lower porosity correspond to greater pressure drop. Rotating speed also has a significant impact. When the rotating speed is high, rotation becomes a main cause of the pressure drop. The higher the rotating speed, the larger the ratio of pressure drop caused by rotation, and the smaller the ratio caused by metal foam. However, the pressure drop caused by the metal foam becomes a main factor without rotation.
In this study, as the first step, only air is used as a medium due to small oil volume fraction. In order to move closer to the actual application, and to better guide the metal foam separator design, a medium including air and oil should be studied in the future.
Author Contributions
Data curation, X.Z.; Funding acquisition, L.Z.; Investigation, L.Z.; Methodology, L.Z.; Project administration, Z.L.; Resources, L.Z.; Software, X.Z.; Supervision, Z.L.; Validation, L.Z.; Visualization, X.Z.; Writing—original draft, L.Z.; Writing—review and editing, L.Z. All authors have read and agreed to the published version of the manuscript.
Funding
This research was funded by Aeronautical Science Foundation of China, grant number 20140453006 and The APC was also funded by the same funding.
Conflicts of Interest
The authors declare no conflict of interest.
References
- Eastwick, C.N.; Simmons, K.; Wang, Y.; Hibberd, S. Study of aero-engine oil-air separators. Proc. Inst. Mech. Eng. Part A J. Power Energy 2006, 220, 707–717. [Google Scholar] [CrossRef]
- Orihuela, M.P.; Anuar, F.S.; Abdi, I.A.; Odabaee, M.; Hooman, K. Thermohydraulics of a metal foam-filled annulus. Int. J. Heat Mass Transf. 2018, 117, 95–106. [Google Scholar] [CrossRef]
- Abadi, G.B.; Kim, K.C. Enhancement of phase-change evaporators with zeotropic refrigerant mixture using metal foams. Int. J. Heat Mass Transf. 2017, 106, 908–919. [Google Scholar] [CrossRef]
- Li, S.; Sunden, B. Three-dimensional modeling and investigation of high temperature proton exchange membrane fuel cells with metal foams as flow distributor. Int. J. Hydrogen Energy 2017, 42, 27323–27333. [Google Scholar] [CrossRef]
- Lacroixa, M.; Nguyenb, P.; Schweichc, D.; Huua, C.P.; Savin-Poncetd, S.; Edouarda, D. Pressure drop measurements and modeling on SiC foams. Chem. Eng. Sci. 2007, 62, 3259–3267. [Google Scholar] [CrossRef]
- Azzi, W.; Roberts, W.L.; Rabiei, A. A study on pressure drop and heat transfer in open cell metal foams for jet engine applications. Mater. Des. 2007, 28, 569–574. [Google Scholar]
- Nihad, D.; Ahmed, S. Simulation of entry-region flow in open-cell metal foam and experimental validation. Transp. Porous Media 2014, 101, 229–246. [Google Scholar]
- Chen, X.; Li, X.; Xia, X.; Sun, C.; Liu, R. Thermal performance of a pcm-based thermal energy storage with metal foam enhancement. Energies 2019, 12, 3275. [Google Scholar] [CrossRef]
- Cordes, A.L.; Pychynski, B.T.; Schwitzke, C.C.; Bauer, D.H.J.; de Carvalho, A.T.P.; Morvan, B.H.P. Experimental study of the pressure loss in aero-engine air-oil separators. Aeronaut. J. 2017, 121, 1147–1161. [Google Scholar] [CrossRef][Green Version]
- Willenborg, K.; Klingsporn, M.; Tebby, S.; Ratcliffe, T.; Gorse, P.; Dullenkopf, K.; Wittig, S. Experimental analysis of air/oil separator performance. J. Eng. Gas Turbines Power 2008, 130, 062503. [Google Scholar] [CrossRef]
- Koltsakis, G.C.; Katsaounis, D.K.; Samaras, Z.C.; Naumann, D.; Saberi, S.; Böhm, A. Filtration and Regeneration Performance of a Catalyzed Metal Foam Particulate Filter. In Proceedings of the SAE 2006 World Congress & Exhibition, Detroit, MI, USA, 3–6 April 2006. [Google Scholar]
- Mancin, S.; Zilio, C.; Cavallini, A.; Rossetto, L. Pressure drop during air flow in aluminum foams. Int. J. Heat Mass Transf. 2010, 53, 3121–3130. [Google Scholar] [CrossRef]
- Dukhan, N.; Ali, M. Strong wall and transverse size effects on pressure drop of flow through open-cell metal foam. Int. J. Therm. Sci. 2012, 57, 85–91. [Google Scholar] [CrossRef]
- Trifale, N. Mechanical characterization of metal foams for contact resistance in thermal interface applications. In Proceedings of the ASME 2015 International Technical Conference and Exhibition on Packaging and Integration of Electronic and Photonic Microsystems collocated with the ASME 2015 13th International Conference on Nanochannels, Microchannels, and Minichannels, San Francisco, CA, USA, 6–9 July 2015. [Google Scholar]
- De Carvalho, T.P.; Morvan, H.P.; Hargreaves, D. Pore-level numerical simulation of open-cell metal foams with application to aero engine separators. In Proceedings of the ASME Turbo Expo 2014: Turbine Technical Conference and Exposition, American Society of Mechanical Engineers Digital Collection, New York, NY, USA, 18 September 2014. [Google Scholar]
- Skibinski, J.; Cwieka, K.; Kowalkowski, T.; Wysocki, B.; Wejrzanowski, T.; Kurzydlowski, K.J. The influence of pore size variation on the pressure drop in open-cell foams. Mater. Des. 2015, 87, 650–655. [Google Scholar] [CrossRef]
- Koltsakis, G.C.; Katsaounis, D.K.; Markomanolakis, I.A.; Samaras, Z.C.; Naumann, D.; Saberi, S.; Boehm, A. Design and Application of Catalyzed Metal Foam Particulate Filters. In Proceedings of the Powertrain & Fluid Systems Conference & Exhibition, Toronto, ON, Canada, 16–19 October 2006. [Google Scholar]
- Fly, A.; Kim, K.; Gordon, J.; Butcher, D.; Chen, R. Liquid water transport in porous metal foam flow-field fuel cells: A two-phase numerical modelling and ex-situ experimental study. Energies 2019, 12, 1186. [Google Scholar] [CrossRef]
- De Carvalho, T.P.; Morvan, H.P.; Hargreaves, D.; Cordes, L.; Hofler, C. Limitations of a state-of–the-art numerical modelling framework for two-phase flow in aero-engine air/oil separators. In Proceedings of the ASME Turbo Expo 2016: Turbomachinery Technical Conference and Exposition, Seoul, Korea, 13–17 June 2016. [Google Scholar]
- Boomsma, K.; Poulikakos, D. On the effective thermal conductivity of a three-dimensionally structured fluid-saturated metal foam. Int. J. Heat Mass Transf. 2001, 44, 827–836. [Google Scholar] [CrossRef]
- Konstantinidis, I.C.; Paradisiadis, G.; Tsipas, D.N. Analytical models for the mechanical behavior of closed and open-cell Al foams. Theor. Appl. Fract. Mech. 2009, 51, 48–56. [Google Scholar] [CrossRef]
- Liu, X.D.; Feng, Y.H.; Yang, X.F.; Zhang, X.X. Experimental and numerical simulation of the convective heat transfer in a metal-foam filled rectangular channel. Proc. CSEE 2010, 30, 56–60. [Google Scholar]
- Yao Yuanpeng, Wu Huiying, Liu Zhenyu, A new prediction model for the effective thermal conductivity of high porosity open-cell metal foams. Int. J. Therm. Sci. 2015, 97, 56–67. [CrossRef]
- Gauna, E.A.; Zhao, Y. Numerical simulation of heat transfer in porous metals for cooling applications. Metall. Mater. Trans. B Process Metall. Mater. Process. Sci. 2017, 48, 1925–1932. [Google Scholar] [CrossRef]
- Krishnan, S.; Murthy, J.Y.; Garimella, S.V. Direct simulation of transport in open-cell metal foam. J. Heat Transf. Trans. 2006, 128, 793–799. [Google Scholar] [CrossRef]
- Murtagh, R.; Whyte, D.; Weaire, D.; Hutzler, S. Adaptation of the Z-cone model to the estimation of the energy of a bcc foam. Philos. Mag. 2015, 95, 4023–4034. [Google Scholar] [CrossRef]
- He, F.; Zhang, X.W.; Li, H. Measurement of permeability and inertial coefficient for porous materials with the consideration of compressible effects of gas. J. Exp. Mech. 2002, 17, 326–332. [Google Scholar]
- International Organization for Standardization. International standard ISO 4022. In Permeable Sintered Metal Materials—Determination of Fluid Permeability, 3rd ed.; International Organization for Standardization: Geneva, Switzerland, 2018. [Google Scholar]
- Buckley, S.E.; Leverett, M. Mechanism of fluid displacement in sands. Trans. AIME 1942, 146, 107–116. [Google Scholar] [CrossRef]
- Standnes, D.C.; Evje, S.; Andersen, P.Ø. A novel relative permeability model based on mixture theory approach accounting for solid–fluid and fluid–fluid interactions. Transp. Porous Media 2017, 119, 707–738. [Google Scholar] [CrossRef]
- Andersen, P.Ø.; Standnes, D.C.; Skjæveland, S.M. Waterflooding oil-saturated core samples-analytical solutions for steady-state capillary end effects and correction of residual saturation. J. Pet. Sci. Eng. 2017, 157, 364–379. [Google Scholar] [CrossRef]
- Swanson Analysis Systems. Fluent 14 Theory Guide; ANSYS: Canonsburg, PA, USA, 2011. [Google Scholar]


© 2020 by the authors. Licensee MDPI, Basel, Switzerland. This article is an open access article distributed under the terms and conditions of the Creative Commons Attribution (CC BY) license (http://creativecommons.org/licenses/by/4.0/).