Abstract
To guarantee the reliable and efficient development of wind power generation, oscillation problems in large-scale wind power bases with Type-IV generators are investigated from the view of resonance stability in this paper. Firstly, the transfer characteristics of disturbances in Type-IV wind generators are analyzed to establish their impedance model, based on the balance principle of frequency components. Subsequently, considering the dynamic characteristics of the transmission network and the interaction among several wind farms, the resonance structure of a practical wind power base is analyzed based on the s-domain nodal admittance matrix method. Furthermore, the unstable mechanism of the resonance mode is further illustrated by the negative-resistance effect theory. Finally, the established impedance model of the Type-IV wind generator and the resonance structure analysis results of the wind power bases are verified through the time-domain electro-magnetic transient simulation in PSCAD/EMTDC. Case studies indicate that there is a certain resonance instability risk in large-scale wind power bases in a frequency range of 1–100 Hz, and the unstable resonance mode is strongly related to the negative-resistance effect and the capacitive effect of Type-IV wind generators.
1. Introduction
Wind energy will play an important role in the field of energy due to its clean and renewable characteristics. As reported, global electricity generation from wind energy increased by about 150 TWh year-on-year, raising its share of electricity supply from 4.7% to 5.2%, the most of any renewable power generation technology in 2019 [1]. However, with the large-scale integration of wind power generation, some oscillation phenomena have appeared in wind energy power systems [2,3,4]. Due to the power electronic characteristics of wind generators, the oscillation frequency is distributed in a wide frequency range, which is very different from the previous oscillation phenomena in traditional power systems [5]. To guarantee the reliable and efficient development of wind power generation, it is necessary to investigate these oscillation problems in wind energy power systems, especially in the large-scale wind power bases with Type-IV wind generators. The Type-IV wind generator is a variable speed wind generator with a fully rated frequency converter connecting the generator to AC power systems [6], which has more obvious power electronics characteristics. With the development of wind energy, large-scale wind power bases with Type-IV wind generators will be popular in future power systems.
For the oscillation problems in wind energy power systems, there are three main methods to investigate in the existing research—i.e., the time-domain electro-magnetic transient simulation analysis method [7], the state-space analysis method [8,9] and the frequency-domain impedance-based analysis method [10,11]. The core of the electro-magnetic simulation analysis method is the emulation of the power electronics characteristics of wind generators [12], which can reproduce the existing oscillation phenomena. However, it is hard to illustrate the internal mechanism of these oscillation problems. The core of the state-space analysis method is the eigenvalue analysis of the state-matrix [13], which can determine the unstable oscillation mode and its main influencing factors. Its results are complete and detailed for analyzing the oscillation mechanism, but to establish the state-space model of the power systems with a high proportion of power electronic devices is not easy, due to the inductive and capacitive effect of the transmission network and the detailed controller dynamics of the power electronic devices. The core of the frequency-domain impedance-based analysis method is the Nyquist stability criterion of the single port-impedance [14,15], which could judge the oscillation stability of wind energy power systems. The impedance model of wind generators is relatively easy to be established, and has many modelling methods—e.g., the small-disturbance modelling method [16], the harmonic linearization modelling method [17] and the measurement modeling method [18]. Therefore, the frequency-domain impedance-based analysis method receives more attention for analyzing these oscillation problems. Nevertheless, the impedance model of the AC power system is usually very simplified in this method, which influences the unstable oscillation modes, due to the wide range of oscillation frequencies. In addition, the interaction among several wind farms in large-scale wind power bases is difficult investigate through the single port-impedance only. In summary, there are some limitations in the previous analysis methods for large-scale wind power bases with several wind farms.
In [19], the s-domain nodal admittance matrix analysis method is proposed to analyze the oscillation problems in power systems with a high proportion of power electronic devices from the view of resonance stability. In this method, the dynamic characteristics of power electronic devices could be considered by their impedance model, which is an advantage of the impedance model for power electronic devices. Moreover, the dynamic characteristics of the transmission network and the interaction among several wind farms could be considered through the nodal admittance matrix, which overcomes the limitation of the previous analysis methods. Thus, for investigating the oscillation problems in the wind power bases with quantities of Type-IV wind generators, the s-domain nodal admittance matrix analysis method is adopted in this paper. Ref. [19] focuses on the theoretical analysis of the s-domain admittance matrix more, but this paper mainly aims to verify its application and simulation in large-scale wind power bases. There are also some differences in their case studies, as shown in Table 1. In addition, the transfer characteristics of disturbances in Type-IV wind generators are analyzed based on the balance principle of frequency components, and the unstable mechanism of the resonance mode is illustrated based on the negative-resistance effect theory [20] in this paper.

Table 1.
Comparison between case studies in both Ref. [19] and this manuscript.
The rest of the paper is organized as follows. In Section 2, the transfer characteristics of disturbances in the Type-IV wind generator are analyzed and its impedance model is established based on the balance principle of frequency components. In Section 3, the resonance stability of a practical wind power base with quantities of Type-IV generators is investigated based with the s-domain nodal admittance matrix method, and the mechanism of the unstable resonance mode is illustrated based on the negative-resistance effect theory. In Section 4, the established impedance model of the Type-IV wind generator and the resonance structure analysis results of wind power bases are verified through the time-domain electro-magnetic transient simulation in PSCAD/EMTDC [21]. Finally, this paper ends with some conclusions in Section 5.
2. Modelling of Type-IV Wind Generators
To investigate the resonance stability of wind power bases with Type-IV wind generators, the transfer characteristics of disturbances in a Type-IV wind generator are first analyzed to establish its impedance model, based on the balance principle of frequency components.
2.1. Transfer Characteristics of Disturbances in Type-IV Wind Generators
The Type-IV wind generator is one of the most popular wind generators in wind farms, due to its better adjustment characteristics of power and voltage. It is connected to an AC power system by a back-to-back converter, whose structure [12] is shown in Figure 1.
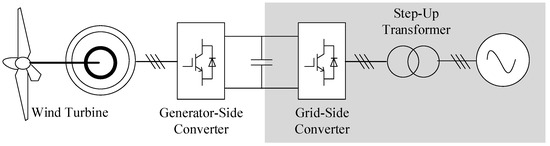
Figure 1.
Structure schematic diagram of Type-IV wind generator.
Moreover, the back-to-back converters of the Type-IV wind generator contain a generator-side converter and the grid-side converter. The generator-side converter controls the torque of the generator to capture the maximum wind power, and the grid-side converter controls the DC-side voltage and output reactive power to maintain normal system operations.
Generally, these oscillation problems that appear in wind energy power systems have a higher oscillation frequency [4]. Due to the slower response characteristics of the outer-loop controller, these disturbance components of higher frequency have less influence on the DC-side voltage of the back-to-back converters. Therefore, the DC-side voltage could be assumed to be kept as constant, and the grid-side converter is independent from the generator-side converter, the generator and the wind turbine. When analyzing the influence of a Type-IV wind generator on these oscillation problems, it is acceptable to only consider the influence of the grid-side converter—the shadow in Figure 1.
Assuming that there appear some disturbances in the AC-side voltage, the influencing trajectory is shown in Figure 2.
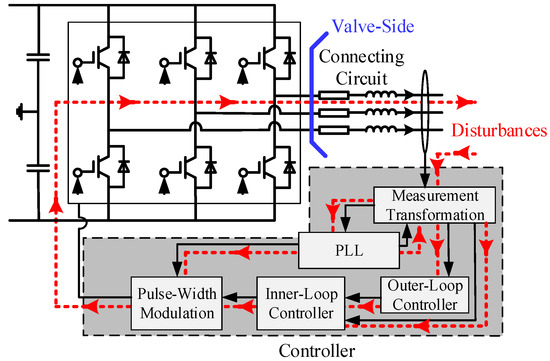
Figure 2.
Influencing trajectory of disturbances in grid-side converter.
Firstly, these voltage disturbances will enter the controller through the measurement transformation module. Then, they will enter the phase-locked loop (PLL), the outer-loop controller and the inner-loop controller, respectively. Note that the disturbances in the PLL will feed back to the measurement transformation module. Finally, they will all have an influence on the valve-side voltage and the output current through the pulse-width modulation module. Furthermore, the disturbances in the output current will send feedback to the controller through the measurement transformation module.
Generally, the influence of the outer-loop controller could be ignored, due to its slower response characteristics. Assuming that there is one positive-sequence disturbance of the fp frequency in the AC-side voltage and the output current, the transfer process of these disturbances in the internal variables of the grid-side converter could be described as Figure 3.
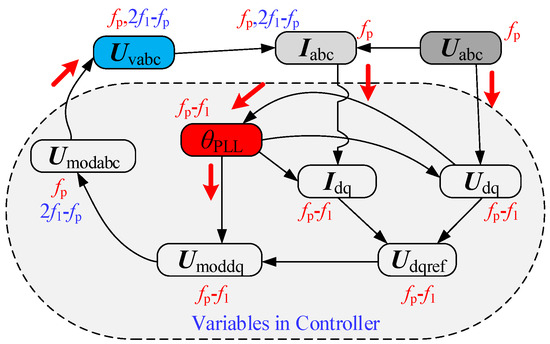
Figure 3.
Transfer process of disturbances in internal variables of grid-side converter.
Figure 3 shows the positive-sequence disturbance of the fp frequency in the AC-side voltage—the output current will enter the variables in the controller and finally have an influence on the valve-side voltage. Thus, the AC-side voltage and the output current could be regarded as the input variables, and the valve-side voltage could be regarded as the output variable in the transfer process of disturbances.
Moreover, the disturbance in the q-axis component of the measured voltage will enter the PLL output phase, and the disturbance in the PLL output phase will send feedback to the d- and q-axis components of the measured voltage and enter the measured current and the modulation voltage. Therefore, the PLL output phase could be regarded as the important middle variable in the transfer process of disturbances.
Note that, due to the coordinate transformation, the positive-sequence disturbance of the fp frequency in the abc frame will be transformed to the disturbance of the fp − f1 frequency in the dq frame. In addition, due to the asymmetrical d- and q-axis components of the modulation voltage, an additional positive-sequence disturbance of the 2f1 − fp frequency will appear in the valve-side voltage and the output current, but not the positive-sequence disturbance of the fp frequency.
Subsequently, the corresponding transfer function of disturbances could be obtained based on the balance principle of frequency components. The balance principle of frequency components is similar to harmonic linearization modeling methods [17], which represent the corresponding relationship among disturbances in the style of frequency-domain phasors.
(1) Transfer function of disturbances from the AC-side voltage to the PLL output phase.
Figure 3 indicates that the disturbances in the PLL output phase are only related to the disturbances in the AC-side voltage. Their quantitative relationship is shown as Equation (1).
where GPLL(j(ωp − ω1)) represents the quantitative relationship between the disturbance of the fp frequency in the AC-side voltage and the disturbance of the fp − f1 frequency in the PLL output phase; i.e., the transfer function of disturbances from the AC-side voltage to the PLL output phase.
(2) Transfer function of disturbances from the AC-side voltage, the output current and the PLL output phase to the valve-side voltage.
Figure 3 shows that the disturbances in the valve-side voltage are related to the disturbances in the AC-side voltage, the output current and the PLL output phase. Moreover, there are two positive-sequence disturbances of the fp and 2f1 − fp frequency in the valve-side voltage. The quantitative relationship among the disturbance of the fp frequency in the valve-side voltage and the disturbances in the AC-side voltage, the output current and the PLL output phase are shown as Equation (2).
where GUv_U(j(ωp − ω1)) represents the quantitative relationship between the disturbance of the fp frequency in the valve-side voltage and the disturbance of the fp frequency in the AC-side voltage; i.e., the transfer function of disturbances from the AC-side voltage to the valve-side voltage. GUv_I(j(ωp − ω1)) represents the quantitative relationship between the disturbance of the fp frequency in the valve-side voltage and the disturbance of the fp frequency in the output current; i.e., the transfer function of disturbances from the output current to the valve-side voltage. GUv_θ(j(ωp − ω1)) represents the quantitative relationship between the disturbance of the fp frequency in the valve-side voltage and the disturbance of the fp − f1 frequency in the PLL output phase; i.e., the transfer function of disturbances from the PLL output phase to the valve-side voltage.
In addition, the quantitative relationship of the disturbance of the 2f1 − fp frequency in the valve-side voltage and the disturbances in AC-side voltage, the output current and the PLL output phase are shown in Equation (3). Note that the AC system is assumed to be the ideal voltage source, which has no positive-sequence disturbance of the 2f1 − fp frequency.
where GUv_I(j(ω1 − ωp)) represents the quantitative relationship between the disturbance of the 2f1 − fp frequency in the valve-side voltage and the disturbance of the 2f1 − fp frequency in the output current. GUv_θ(j(ω1 − ωp)) represents the quantitative relationship between the disturbance of the 2f1 − fp frequency in the valve-side voltage and the disturbance of the fp − f1 frequency in the PLL output phase. The superscript “^” represents the conjugate of the complex.
2.2. Impedance Model of Type-IV Wind Generators
Assuming the connecting circuit of the grid-side converter is modelled by the series-connected circuit of resistance and inductance (see Figure 2), the disturbances in the output current could be further described as Equations (4) and (5), based on the electrical circuit theory.
Furthermore, by considering the disturbances of the same frequency in the output current and the AC-side voltage, the port-impedance model of the grid-side converter—i.e., the port-impedance model of the Type-IV wind generator—could be established as Equation (6).
where ZWG-IV(s) represents the port-impedance of the Type-IV wind generator.
Note that, due to the similar grid-connected structure, the above simplification for the Type-IV wind generator could be also applied to a simple UPS or PV inverter when investigating their wide-band oscillation problems.
3. Resonance Stability Analysis of Wind Power Bases
Considering the dynamic characteristics of the transmission network and the interactions among several Type-IV wind farms, the oscillation problems in a practical wind power base are investigated from the view of the resonance stability, based on the s-domain nodal admittance matrix method [19]. Furthermore, the mechanism of the unstable resonance mode is further illustrated based on the negative-resistance effect theory [20]. Note that unstable oscillation phenomena in the practical wind power bases once appeared [4].
3.1. System Parameters of Wind Power Bases
The transmission network of wind power bases is shown in Figure 4. The highest voltage level of the transmission network is 220 kV, including Bus1, Bus2 and Bus3. The lowest voltage level of the transmission network is 0.69 kV; i.e., the port voltage of the Type-IV wind generator. The voltage level sequence of the transmission network is 0.69, 35, 110, and 220 kV.
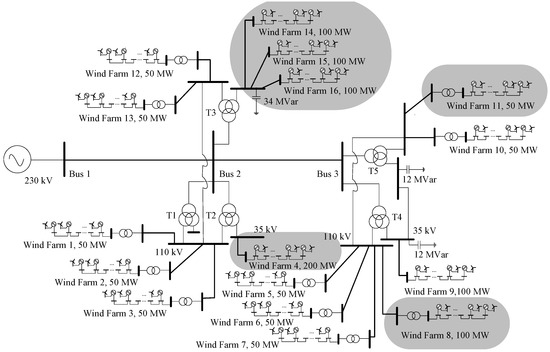
Figure 4.
Schematic structure diagram of wind power bases with Type-IV wind generators.
There are sixteen wind farms composed of Type-IV wind generators, including one wind farm of 200 MW, five wind farms of 100 MW and ten wind farms of 50 MW. The transformer substation in Bus2 has three three-winding transformers, which are connected to one wind farm of 200 MW, three wind farms of 100 MW and five wind farms of 50 MW. Moreover, the transformer substation in Bus3 has two three-winding transformers, which are connected to two wind farms of 100 MW and five wind farms of 50 MW. The parameters of the main power equipment in the wind power bases are listed in Table 2 and Table 3. Note that the base value of the system capacity is 100 MVA and the base value of the system voltage is 230 kV.
Table 2.
Parameters of transformers and transmission lines.
Table 3.
Parameters of Type-IV wind generators.
3.2. Analysis on Resonance Structure of Wind Power Bases
To investigate the resonance stability of the wind power bases with Type-IV wind generators, their resonance structure is analyzed based on the s-domain nodal admittance matrix method [19].
In the s-domain admittance matrix method, the dynamic characteristics of all the Type-IV wind generators are considered in the style of the impedance model. In addition, the transmission network of the wind power bases is considered in the style of the nodal admittance matrix, which is easy establish. The core of the s-domain nodal admittance matrix method is to calculate the zero roots of the determinant of the s-domain nodal admittance matrix, represented by Equation (7).
where sk represents the k-th resonance mode of the system, σk and ωk represent its damping coefficient and resonance frequency; if σk < 0, it means the resonance mode is unstable. Y(s) represents the s-domain nodal admittance matrix of the system, and det[Y(s)] represents its determinant. yij(s) represents the element in the i-th row and j-th column of the nodal admittance matrix of the system, and ZWG-IV,k(s) represents the port-impedance of the Type-IV wind generator connected to the k-th node.
Based on the above system parameters of the wind power bases, the analysis results of the resonance modes in the frequency range of 1–100 Hz are listed in Table 4.
Table 4.
Analysis results of resonance modes in wind power bases.
Table 4 indicates that there are two resonance modes in the wind power bases in the frequency range of 1 Hz–100 Hz, whose frequency are 55.7 and 77.1 Hz, respectively. Moreover, the resonance mode of 77.1 Hz is unstable, due to its negative damping coefficient. Therefore, there is certain resonance instability risk in the wind power bases.
Furthermore, the mode shape and influencing area of the unstable resonance mode are further analyzed based on the nodal voltage mode shape vector and the participation factor matrix [19].
The nodal voltage mode shape vector represents the relative magnitude and phase of each nodal voltage under one resonance mode, seen in Equation (8). It could be used to describe the shape of the resonance mode. If the phases of all the nodal voltages are similar, it means the resonance mode appears in the port circuit of one node group. If there are two node groups with an inverse phase, it means the resonance mode appears in the connecting circuit of the two node groups.
where R(sk) represents the nodal voltage mode shape vector of the resonance mode sk; i.e., the right eigenvector about the zero eigenvalue of Y(sk), ri represents its i-th element. Vnode represents the nodal voltage vector, Umode represents the main modal voltage under the resonance mode sk.
The participation factor matrix represents the contribution of each nodal injection current to each nodal voltage under one resonance mode, seen in Equation (9). It could be used to describe the participation extent of each node in resonance mode to determine the influencing area.
where P(sk) represents the participation factor matrix of the resonance mode sk; i.e., the product of the right eigenvector and the left eigenvector of the zero eigenvalue of Y(sk), pij represents the element in its i-th row and j-th column. Inode represents the nodal injection current, λmin−1 represents the minimal eigenvalue of Y(sk), L(sk) represents the left eigenvector about the zero eigenvalue of Y(sk).
Based on Equations (8) and (9), the nodal voltage mode shape vector and the participation factor matrix of the 77.1 Hz resonance mode could be obtained, as shown in Figure 5 and Table 5.
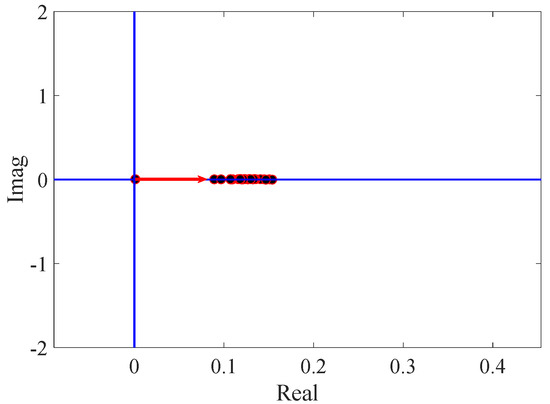
Figure 5.
Nodal voltage mode shape of 77.1 Hz resonance mode.
Table 5.
Elements in participation factor matrix of 77.1 Hz resonance mode (descending order).
Figure 5 indicates that the phases of all nodal voltages are similar, which means the 77.1 Hz resonance mode mainly appears in the port circuit of one node group. Moreover, Table 5 indicates that the participation factor among the nodes in wind farms 4, 15, 16, 14, 11 and 8 are relatively large, which means the influencing area of the 77.1 Hz resonance mode is located in wind farms 4, 15, 16, 14, 11 and 8, as the shadow in Figure 4. It is noted that the influencing area of the 77.1 Hz resonance mode is relatively scattered, but it is strongly related to the wind farms with Type-IV wind generators.
3.3. Mechanism Illustration for Unstable Resonance Mode
To further investigate the unstable mechanism of the resonance mode, the input-impedance characteristics of the 0.69 kV node in wind farm 4 were firstly analyzed in the frequency range of 1–100 Hz, as shown in Figure 6.
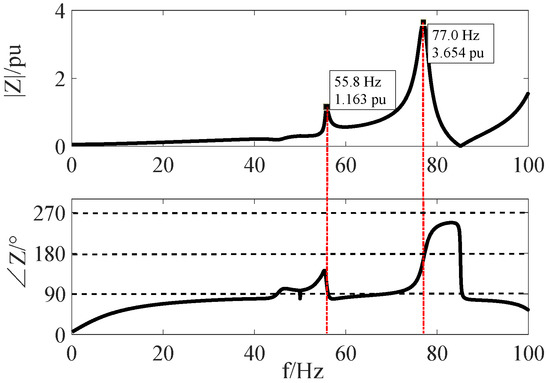
Figure 6.
Input-impedance characteristics of 0.69 kV node in wind farm 4.
Figure 6 indicates that there are two resonance points in the input-impedance of the 0.69 kV node in wind farm 4, whose frequency are 55.8 and 77.0 Hz, respectively. This is consistent with the resonance mode analysis results in Table 4. In addition, the phase of the input-impedance at 55.8 Hz is close to 90°, which means when the 55.8 Hz resonance mode is excited, and the system circuit mainly presents the inductance effect. However, the phase of the input-impedance at 77.0 Hz is close to 180°. This means that when the 77.0 Hz resonance mode is excited, the system circuit mainly presents the negative-resistance effect, which will induce the unstable oscillation phenomenon.
Furthermore, the port-impedance characteristics of the Type-IV wind generator are also analyzed in the frequency range of 1–100 Hz, as shown in Figure 7.
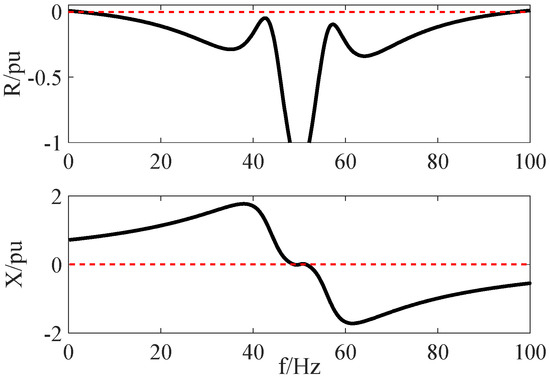
Figure 7.
Port-impedance characteristics of Type-IV wind generator.
Figure 7 indicates that there is a wide frequency range of the negative-resistance effect in the port-impedance of Type-IV wind generators. Moreover, the reactance term in the port-impedance under the super-synchronous frequency range mainly presents the capacitive effect, which will interact with the inductance of the transmission network to cause a resonance point with a lower frequency. Based on the negative-resistance effect theory [20], it is known that there are certain resonance instability risks when the resonance point is located in the frequency range of the negative-resistance effect. Therefore, the unstable resonance mode is mainly caused by the negative-resistance effect and the capacitive effect of the Type-IV generator.
4. Verification Based on Electro-Magnetic Transient Simulation
To verify the above analysis on the resonance structure of the wind power bases, a simulation model of the Type-IV wind generator and the wind power bases were built in the PSCAD/EMTDC software [21]. PSCAD/EMTDC is a professional and commonly used time-domain electro-magnetic transient simulation software for power system transient analysis.
4.1. Verification on Impedance Model of Type-IV WG
To verify the analytical port-impedance model of the Type-IV wind generator, the port-impedance characteristics based on the analytical model were compared with that based of the simulation model. In the simulation, the port-impedance characteristics of the Type-IV wind generator could be obtained by the frequency scanning method; i.e., adding the voltage disturbances with different frequencies to measure the corresponding current responses. Note that these disturbances should not have an influence on the normal steady component.
In the frequency range of 1–100 Hz, the comparison between the simulation results and analytical results of the port-impedance are shown in Figure 8.
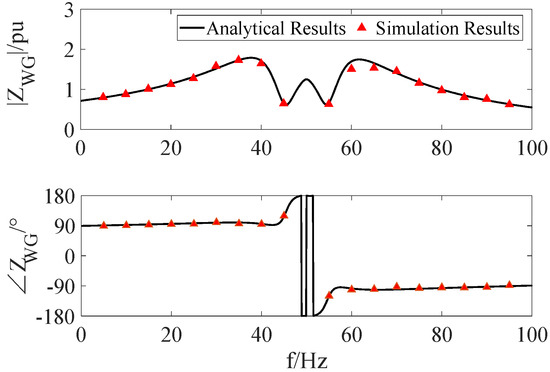
Figure 8.
Comparison between simulation results and analytical results.
Figure 8 shows that the analytical results of the port-impedance are almost consistent with the simulation results of the port-impedance, which verifies the accuracy of the analytical port-impedance model of the Type-IV wind generator.
4.2. Verification on Resonance Structure Analysis of Wind Power Bases
To verify the resonance structure analysis results, the oscillation phenomenon caused by the unstable resonance mode was reproduced based on the simulation model of the wind power bases. In the simulation, the wind power bases operate in the steady state, then the parameters of wind farms were changed to the parameters used in the resonance structure analysis at t = 2.0 s. Note that the parameters changed in the simulation are the controller parameters of the Type-IV wind generator, including the proportion parameter of the PLL and the inner-loop controller. Finally, wind farms 4, 15, 16, 14, 11 and 8 were cut off at t = 4.0 s. The transmission power from Bus2 to Bus1 was observed and analyzed, as shown in Figure 9.
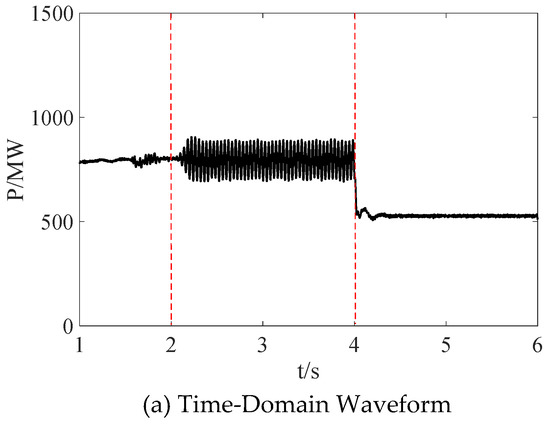
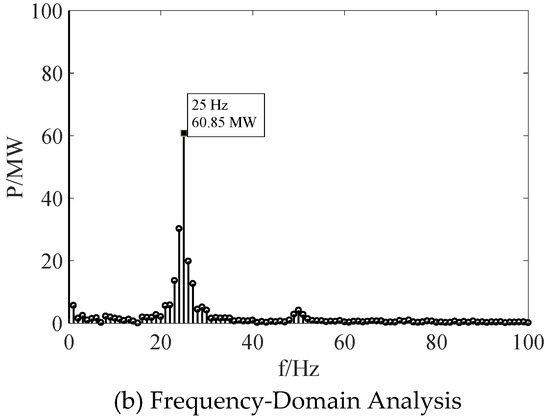
Figure 9.
Observation results of transmission power in line Bus2-Bus1.
Figure 9 shows that there appears the unstable oscillation phenomenon in the transmission power from Bus2 to Bus1, when the parameters of wind farms are changed. Moreover, the unstable oscillation phenomenon disappears, when wind farms 4, 15, 16, 14, 11 and 8 were cut off. In addition, the oscillation frequency in the transmission power is about 25 Hz, which is almost consistent with the unstable resonance mode of 77.1 Hz in Table 4, which verifies the accuracy of the resonance structure analysis results. Note that the oscillation frequency in the transmission power should be the difference value of the resonance frequency of the resonance mode and the working-frequency of the AC system; i.e., 77.1–50 Hz, f = 27.1 Hz.
5. Conclusions
Considering the dynamic characteristics of the transmission network and the interaction among several wind farms, the oscillation problems in a practical wind power base with quantities of Type-IV wind generators are investigated from the view of resonance stability, based on the s-domain nodal admittance matrix method. Moreover, the unstable mechanism of the resonance mode is illustrated by the negative-resistance effect theory. Finally, the main conclusions of this paper are listed as follows:
(1) Case studies indicate that there are some unstable resonance modes in wind power bases with Type-IV wind generators under the frequency range of 1–100 Hz; i.e., there are certain resonance instability risks. Moreover, the unstable resonance mode is strongly related to wind farms with Type-IV wind generators.
(2) There is a wide frequency range of the negative-resistance effect in the port-impedance of the Type-IV wind generator. Moreover, the reactance term in the port-impedance under the super-synchronous frequency range mainly presents the capacitive effect. It will interact with the inductance of the transmission network to make the resonance point located in the frequency range of the negative-resistance effect, causing the unstable resonance mode.
(3) The time-domain electro-magnetic transient simulation in PSCAD/EMTDC indicates the established impedance model of the Type-IV wind generator is accurate, and the s-domain nodal admittance matrix analysis method is acceptable to analyze the oscillation problems of the large-scale wind power bases.
Author Contributions
Conceptualization, Z.X.; Methodology, F.X.; Validation, F.X.; Formal Analysis, F.X.; Investigation, F.X., Z.Z., Y.D., Y.Z.; Resources, Y.D., Y.Z.; Funding acquisition, Y.D., Y.Z.; Writing—Review and Editing, F.X., Z.X., Z.Z.; Supervision, Z.X. All authors have read and agreed to the published version of the manuscript.
Funding
This research is supported by Science and Technology Project of State Grid Zhejiang Electric Power Co., Ltd. (5211JY170011).
Conflicts of Interest
The authors declare no conflict of interest.
Abbreviations
The following abbreviations are used in this manuscript:
| AC | Alternating current |
| DC | Direct current |
| PI | Proportional integral |
| PLL | Phase-locked loop |
| PSCAD/EMTDC | Power systems computer aided design/Electromagnetic transients including DC |
| PV | Photovoltaic |
| UPS | Uninterruptible Power Supply |
| WG | Wind generator |
| Uabc | The a-, b- and c-phase AC-side voltage |
| Ua(jωp) | The phasor style of the disturbance component of fp frequency in the a-phase AC-side voltage |
| ωp | The frequency of disturbance component |
| Iabc | The a-, b- and c-phase output current of the grid-side converter |
| Ia(jωp) | The phasor style of the disturbance component of fp frequency in the a-phase output current |
| Im | The magnitude of the steady component in the a-phase output current |
| φIa | The phase of the steady component in the a-phase output current |
| Uvabc | The a-, b- and c-phase valve-side voltage |
| Uva(jωp) | The phasor style of the disturbance component of fp frequency in the a-phase valve-side voltage |
| Udq | The d- and q-axis measured voltage in controller |
| Idq | The d- and q-axis measured current in controller |
| Udqref | The d- and q-axis reference voltage from the inner-loop controller |
| Udref, Uqref | The steady component in the d- and q-axis reference voltage |
| Umoddq | The d- and q-axis component correspond to the a-, b- and c-phase modulation voltage |
| Umodabc | The a-, b- and c-phase modulation voltage |
| θPLL | The output phase of the PLL |
| θPLL(j(ωp − ω1)) | The phasor style of the disturbance component of fp − f1 frequency in the output phase of the PLL |
| ω1 | The working-frequency of the system |
| Udc | The DC-side voltage |
| Gv | The standard coefficient in the voltage measurement module |
| Gi | The standard coefficient in the current measurement module |
| HPLL(s) | The transfer function of the PI regulator in the PLL |
| GDelay(s) | The transfer function of the control delay |
| Hin(s) | The transfer function of the PI regulator in the inner-loop controller |
| Kv | The feedforward coefficient of voltage in the inner-loop controller |
| Ki | The decoupled compensation coefficient of current in the inner-loop controller |
| Km | The modulation ratio of amplitude |
| R, L | The resistance and inductance of the connecting circuit |
References
- IEA. Global Energy Review 2019. IEA, Paris. 2020. Available online: https://www.iea.org/reports/global-energy-review-2019 (accessed on 5 April 2020).
- Adams, J.; Pappu, V.A.; Dixit, A. ERCOT experience screening for Sub-Synchronous Control Interaction in the vicinity of series capacitor banks. In Proceedings of the 2012 IEEE Power & Energy Society General Meeting, San Diego, CA, USA, 22–26 July 2012. [Google Scholar]
- Buchhagen, C.; Rauscher, C.; Menze, A.; Jung, J. BorWin1-first experiences with harmonic interactions in converter dominated grids. In Proceedings of the 2015 International ETG Congress, Bonn, Germany, 17–18 November 2015. [Google Scholar]
- Li, M.; Yu, Z.; Xu, T.; He, J.; Wang, C.; Xie, X.; Liu, C. Study of complex oscillation caused by renewable energy integration and its solution. Power Syst. Technol. 2017, 41, 1035–1042. [Google Scholar]
- Kundur, P.; Balu, N.J.; Lauby, M.G. Power System Stability and Control; McGraw Hill: New York, NY, USA, 1994. [Google Scholar]
- Pourbeik, P. Modeling and Dynamic Behavior of Wind Generation as it Relates to Power System Control and Dynamic Performance; CIGRE: Paris, France, 2007. [Google Scholar]
- Li, R.; Lu, Y.; Liu, H.; Han, B. Mechanism analysis on sub-synchronous oscillation caused by grid-integration of doubly fed wind power generation system via series compensation. Power Syst. Technol. 2013, 37, 3073–3079. [Google Scholar]
- Ostadi, A.; Yazdani, A.; Varma, R.K. Modeling and stability analysis of a DFIG-based wind-power generator interfaced with a series-compensated line. IEEE Trans. Power Deliv. 2009, 24, 1504–1514. [Google Scholar] [CrossRef]
- Fan, L.; Kavasseri, R.; Miao, Z.L.; Zhu, C. Modeling of DFIG-based wind farms for SSR analysis. IEEE Trans. Power Deliv. 2010, 25, 2073–2082. [Google Scholar] [CrossRef]
- Sun, J. Modeling and mitigation of harmonic resonance between wind turbines and the grid. In Proceedings of the 2011 Energy Conversion Congress and Exposition (ECCE), Phoenix, AZ, USA, 17–22 September 2011. [Google Scholar]
- Miao, Z. Impedance-model-based SSR analysis for type 3 wind generator and series-compensated network. IEEE Trans. Energy Convers. 2012, 27, 984–991. [Google Scholar] [CrossRef]
- Wu, B.; Lang, Y.; Zargari, N.; Kouro, S. Power Conversion and Control of Wind Energy Systems; Wiley: New York, NY, USA, 2011. [Google Scholar]
- Mei, F.; Pal, B.C. Modal analysis of grid-connected doubly fed induction generators. IEEE Trans. Energy Convers. 2007, 22, 728–736. [Google Scholar] [CrossRef]
- Sun, J. Impedance-based stability criterion for grid-connected inverters. IEEE Trans. Power Electron. 2011, 26, 3075–3078. [Google Scholar] [CrossRef]
- Fan, L.; Miao, Z. Nyquist-stability-criterion-based SSR explanation for Type-3 wind generators. IEEE Trans. Energy Convers. 2012, 27, 807–809. [Google Scholar] [CrossRef]
- Harnefors, L.; Bongiorno, M.; Lundberg, S. Input-admittance calculation and shaping for controlled voltage-source converters. IEEE Trans. Ind. Electron. 2007, 54, 3323–3334. [Google Scholar] [CrossRef]
- Sun, J. Small-signal methods for AC distributed power systems—A review. IEEE Trans. Power Electron. 2009, 24, 2545–2554. [Google Scholar]
- Cespedes, M.; Sun, J. Three-phase impedance measurement for system stability analysis. In Proceedings of the 2013 IEEE 14th Workshop Control and Modeling for Power Electronics, Salt Lake City, UT, USA, 23–26 June 2013. [Google Scholar]
- Xu, Z.; Wang, S.; Xing, F.; Xiao, H. Study on the method for analyzing electric network resonance stability. Energies 2018, 11, 1–8. [Google Scholar]
- Harnefors, L.; Wang, X.; Yepes, A.G.; Blaabjerg, F. Passivity-based stability assessment of grid-connected VSCs—An overview. IEEE J. Emerg. Sel. Top. Power Electron. 2016, 4, 116–125. [Google Scholar] [CrossRef]
- Ino, T.; Mathur, R.M.; Iravani, M.R.; Sasaki, S. Validation of digital simulation of DC links—Part II. IEEE Trans. Power Appar. Syst. 1985, 104, 2596–2603. [Google Scholar] [CrossRef]


© 2020 by the authors. Licensee MDPI, Basel, Switzerland. This article is an open access article distributed under the terms and conditions of the Creative Commons Attribution (CC BY) license (http://creativecommons.org/licenses/by/4.0/).