Abstract
The movable water saturation of tight sandstone reservoirs is an important parameter in characterizing water production capacity, and there is a great need to understand the relationship between movable water saturation and water production characteristics. However, movable water behavior in this context remains unclear. In this study, four groups of tight sandstone cores from the Sulige gas field are measured to understand the movable water saturation characteristics. Then, the effects such as reservoir micropore throat, clay mineral and physical properties on movable water saturation are analyzed, and the movable water saturation and water production characteristics are discussed. The results show that higher movable water saturation will result in a greater amount of water in the gas drive. There is a critical pressure difference of the gas drive, and a large amount of movable water will flow out. Movable water saturation is independent of the porosity, permeability and initial water saturation, while it is closely related to the reservoir micropore throat and clay mineral content. Movable water is mainly distributed in the medium and large pores; the larger the proportion of such pores, the higher the degree of movable water saturation. A lower mineral content will lead to higher movable water saturation in tight sandstone gas reservoirs. These results provide clues for identifying gas–water bearing reservoirs and evaluating and predicting the water production characteristics in gas wells in tight sandstone gas reservoirs.
1. Introduction
Tight sandstone gas, as an important unconventional resource, is widely distributed in major gas-bearing basins around the world, and has become a subject of unconventional gas exploration globally [1,2,3,4]. According to a survey from the U.S. Energy Information Administration, the global remaining technically recoverable resource of tight sandstone gas is estimated as 110 × 1012 m3, and the proportion of gas production in the United States from tight sandstone reservoirs will reach 22% by 2040 [5]. Tight sandstone gas in China is rather abundant, mainly in the Ordos Basin, Sichuan Basin, Qaidam Basin, and other basins; the proven recoverable reserves are up to 13.4 × 10⁸ m3, and gas production is increasing rapidly [6]. Thus, there is great interest in developing the tight sandstone gas extraction techniques and guaranteeing a stable gas supply for the national economy and energy security.
The Sulige gas field lies in the center of northwestern China. It is the largest tight sandstone gas field in China. The reservoir is a monoclinic structure inclined from northeast to southwest with an exploration area of about 4.0 × 10⁴ km2; it had been stably yielding about 230 × 108 m3 per year for five consecutive years at the end of 2018 [7]. The tight sandstone reservoirs are characterized by low-porosity and low-permeability, low-structure, high water saturation, strong heterogeneity and widespread distribution. The accumulation of natural gas in tight sandstone reservoirs is controlled by lithological characteristics, and tends to be widely regionally distributed; generally, obvious gas–water interfaces are absent, and the gas–water distribution relationship is very complicated [8,9,10]. There are many challenges in tight gas reservoir exploration and exploitation; water saturation is a key reservoir parameter for controlling the gas production from tight sandstone gas reservoirs. Some studies show that the main source of water production wells is movable water trapped in reservoir pores. The water production will turn the gas single-phase flow into a gas–water two-phase flow, which results in a stronger fluid percolation resistance [11,12]. Moreover, water production will hinder gas production and reduce the efficiency of the depletion mechanism and overall recovery [13,14]. Consequently, understanding the movable water characteristics in reservoir pores is essential to optimizing extraction conditions and ultimately maximizing gas production in tight sandstone gas reservoirs.
The problem of movable water in tight sandstone gas reservoirs has always been one of the major concerns in terms of productivity and increased operating costs. Some studies on movable water in tight gas reservoirs have been conducted over the past years [15]. Yang et al. [16] considered the stress sensitivity of irreducible water saturation (Swir). Guo et al. [17] pointed out that gas formation around irreducible water was a physical variable in relation to gas phase percolation velocity, which was sensitive to velocity. Taktak et al. [18] used the weighing method to measure the irreducible water saturation in the tight gas reservoirs. Ye et al. [19] studied movable water saturation (Swm) through an experimental method and used their findings to predict and characterize the nature of gas wells according to the relationship between the water production characteristics and movable water saturation. Sheng et al. [20] suggested that increased water saturation would result in decreased gas phase percolation capacity, and would ultimately damage the recovery in tight sandstone gas reservoirs. Bear et al. [21] and Zhang et al. [22] analyzed the irreducible water saturation in the tight gas reservoirs using the mercury injection capillary pressure method. Tian et al. [23] studied different factors that affect the threshold pressure gradient in tight sandstone gas reservoirs with high levels of water saturation. Even though there are a few studies on the flow behavior of movable water in tight sandstone gas reservoirs, the movable water characteristics and their effects on gas production are still not fully understood. Therefore, there is a necessity to understand movable water characteristics in tight sandstone gas reservoirs to optimize gas production.
In this study, four groups of tight sandstone cores with similar physical properties but different water saturation levels were selected to study the movable water behavior in the Sulige tight sandstone gas field. We performed a set of experiments, including NMR (nuclear magnetic resonance), XRD (X-ray diffraction) and SEM (scanning electron microscope) to investigate the influence of reservoir micropore throats, clay minerals and physical properties on movable water saturation. Furthermore, a gas flooding experiment and the NMR technique were adopted to determine the movable water saturation and water production characteristics. These results may deepen our understanding of movable water, thereby improving gas recovery and leading to more efficient exploitation of tight sandstone gas reservoirs.
2. Materials and Methods
2.1. Experimental Materials
The tight sandstone gas reservoir is characterized by low porosity, low permeability, high water saturation and high capillary pressure; the reservoir geological conditions are very complicated. To understand the inherent property of movable water in tight sandstone reservoirs, it is necessary to select cores with different physical properties in the experiments. In this study, four groups of tight sandstone cores with similar physical properties but different movable water saturation levels were selected. These cores are among the more than 100 cores in the main producing layers of the Sulige tight sandstone gas field. The basic physical properties of the sandstone cores are summarized in Table 1.

Table 1.
Basic properties of sandstone cores used in this study.
2.2. Movable Water Measurement
During the process of filling and forming tight sandstone gas reservoirs, the water in the reservoir pores could not be completely displaced due to the physical properties of the reservoir. Consequently, the original water saturation was generally high in tight sandstone reservoirs. Residual water in tight sandstone reservoirs was mainly divided into two types: irreducible and movable. These typologies exist in different forms in different microscopic regions in the reservoir rocks. The irreducible water was mainly present on the surface of mineral particles or on the edges and corners of pores, and it was a discontinuous phase, making it difficult to transport during production and development. In contrast, the movable water was mainly present on larger connected pore throats. When tight gas production is developed, movable water will be produced due to fracturing communication or the increase in the driving pressure gradient. In this study, the NMR experiment was conducted to determine the movable water saturation degree in the tight sandstone gas reservoirs, and an experimental apparatus was used to measure movable water saturation, as shown in Figure 1.
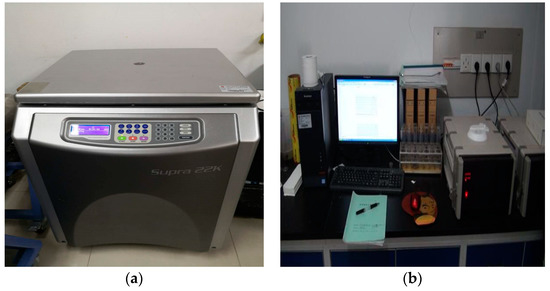
Figure 1.
Experimental apparatus used for measuring movable water saturation: (a) High speed centrifuge; (b) Nuclear magnetic resonance (NMR) detector.
NMR measurement is a powerful, nondestructive analytical technique which can obtain reservoir parameters such as porosity, permeability, irreducible water content and other parameters that characterize the reservoir [24,25,26,27]. In this study, the main steps to determine movable water saturation were as follows: First, the T2 cutoff value of the experimental core was determined using a combination of nuclear magnetic resonance and the centrifugation technique. After comparing the original water saturation with that after centrifugation at different centrifugal forces, 300 psi was determined to be the centrifugal force corresponding to the original water saturation of the Sulige tight sandstone reservoir. Thus, the water state after centrifuging the saturated core at 300 psi represented the initial state of the reservoir core. From the corresponding NMR T2 spectrum line after centrifugation at 300 psi and the T2 spectrum line of the core with 100% saturated water, the calculated T2 value is the T2 cutoff value of the core representing the reservoir. Then, the area surrounded by the T2 spectrum line and the horizontal axis after 300 psi centrifugation represents the original water saturation of the core. The area between the T2 line of the core in the saturated water state and the T2 line after centrifugation represents the original gas saturation. The area surrounded by the right side of the T2 cutoff calibration line and the T2 spectral line after 300 psi centrifugation is the movable water saturation. A schematic diagram and the calculation method of movable water saturation based on the NMR measurements are illustrated in Figure 2.
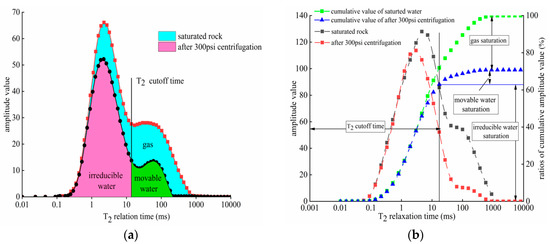
Figure 2.
Schematic diagram (a) and calculation method (b) of movable water saturation.
2.3. Water Production Experiment
Water production from gas producing wells is a common occurrence in gas fields, which increases the cost and reduces overall recovery. To study the water production characteristics in the exploitation of tight sandstone gas reservoirs, a combination of gas flooding experiments and the NMR technique were adopted in this study. The gas flooding experiments with pressure drawdown served to simulate the water production of gas wells under different pressure drops; the main experimental processes were as follows:
- The selected core was vacuumed to saturate 8000 mg/L sodium chloride solution. After saturation, the core wet weight was measured, and then a nuclear magnetic resonance test was performed to obtain the T2 spectrum curve of the saturated rock sample.
- The core was centrifuged at 300 psi. Then, the core weight was measured and a T2 spectrum test was performed. The T2 cut-off value was calibrated, and the core water saturation was calculated.
- The initial core was centrifuged at 300 psi, placed into the holder and connected to the experimental process. The core outlet pressure was set to 2 MPa through the backpressure valve, and various pressures were used for the gas drive with humidified nitrogen. The pressure difference was set to 0.2 MPa, 0.5 MPa, 1 MPa, 2 MPa, 3 MPa, 4 MPa, 6 MPa and 8 MPa. After 2 h of gas flooding at each differential pressure, the core weight was measured and a T2 spectrum test was performed.
3. Results and Discussion
3.1. Pore Water Occurrence
NMR T2 spectra are based on the NMR signal generated by the hydrogen nuclei of water molecules and their changes, that are dependent on the water distribution in the cores [28]. Different relaxation times in the NMR T2 spectrum correspond to different pore radii. From the NMR T2 spectrum, the number and distribution of pores of different sizes can be obtained in the core. When the core is fully saturated, the NMR T2 spectral curves reflect the total volume of water in the pores. The NMR T2 spectral curves and the area under the horizontal axis represent the total pore volume of the core. Generally, the pores with a T2 relaxation time of less than 1ms are micropores; those between 1–10 ms are small pores; those between 10–100 ms pores are mesopores; those between 100–1000 ms are macropores; and those with a relaxation time greater than 1000 ms belong to holes. The NMR T2 curve tested when the core was fully saturated with water reflected the total volume of water in the pores. The T2 curve and the area under the horizontal axis represent the total pore volume of the core. In this study, the gas flooding experiments under different differential pressures were conducted on the cores with initial water saturation, and then the NMR measurements were performed on cores. The envelope area under different T2 spectral curves reflects the pore space filled with water in this state [29]. The area between adjacent T2 spectra curves represents the amount of water change in the core caused by the corresponding change in pressure difference.
The T2 spectrum curve and cumulative curve are illustrated in Figure 3 and Figure 4, respectively. In Figure 3, the whole T2 spectrum curve of the same core shows a moving tendency to the lower left, and there is a decreasing trend of the T2 spectrum cumulative curve in Figure 4. This means that the overall water saturation in the core is decreasing and the occurrence of water in the core pore space is changing with the increase of the differential pressures in gas flooding process. At the initial stage with small differential pressures, an NMR signal which is greater than the T2 cut-off value gradually weakens, while a signal that is below the cut-off value is basically unchanged, implying that only the movable water in the larger pore throat is displaced under smaller differential pressures. With further increases in differential pressure, the NMR signal and the peak corresponding to the smaller relaxation time in the T2 spectrum curve also decrease slightly, which indicates that the gas flooding displaces a small amount of irreducible water in the small pores. These phenomena suggest that movable water in the large pore throat can flow with a small differential pressure of gas flooding, while the water in the core pore throat is basically immobile under low differential pressure. Even when there is a large differential pressure, only a little water will be converted into movable water and then participate in the flow production. Moreover, as can be seen in Figure 3, a core with high movable water saturation will have more water in the large and medium pore throats. With the increase of displacement pressure, the water in its pores is gradually expelled. Thus, the T2 spectrum curve and the ratio of the cumulative amplitude of the T2 spectrum change significantly with different differential pressures. The core with low movable water saturation has less water in its large and mesoporous throats; the water is mainly present in the microporous throats. Even when the differential pressure of the gas drive is very high, the water in it resists movement. Consequently, there are no obvious changes of the T2 spectral curve and the ratio of the cumulative curve under different differential pressures.
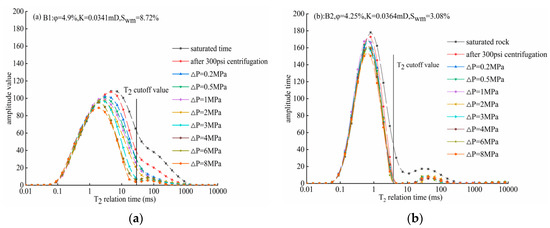
Figure 3.
T2 spectrum curve of tight sandstone cores B1 (a) and B2 (b) in different differential pressures.
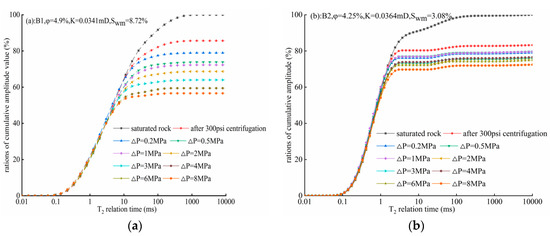
Figure 4.
T2 spectrum accumulation curve of tight sandstone cores under different differential pressures: (a) Core B1; (b) Core B2.
3.2. Effects on Movable Water Saturation
3.2.1. Effect of Reservoir Micropore Throat
Tight sandstone reservoirs have complex reservoir spaces with multiscale pore throat characteristics. The microscopic pore throat structure and distribution in the reservoir control the macrophysical parameters such as initial water saturation, porosity, permeability and reservoir seepage characteristics, which determine the reservoir quality and the gas reservoir development [30,31]. Thus, it is very important to quantitatively determine the dominant pore and throat parameters. The mercury intrusion method is a powerful technique for the evaluation of capillary pressure, porosity, pore size distribution and throat size in the oil and gas reservoir [32]. In this study, high-pressure mercury intrusion was adopted in four groups of tight sandstone cores to characterize the microscopic pore structure of a tight sandstone reservoir. The pore throat structure characteristics obtained from the high-pressure mercury intrusion are illustrated in Table 2 and Figure 5.
Table 2.
Pore throat structure of tight sandstone cores.
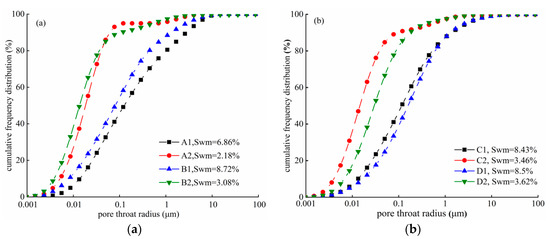
Figure 5.
Microscopic pore distribution of tight sandstone cores: (a) Core A1, A2, B1 and B2; (b) Core C1, C2, D1 and D2.
From the result of Table 2 and Figure 5, we can see that there are still large differences in the micropore-throat structure heterogeneity for the cores with similar macropermeability and porosity. For the same group of comparative cores, the higher the movable water saturation in the core, the larger the proportion of large and mesopore throats. Conversely, the lower the movable water saturation in the core, the smaller its proportion of large and mesopores. The core A1 and A2 are similar in their porosity and permeability, but the movable water saturations are 6.86% and 2.18%, respectively. According to the high-pressure mercury intrusion analysis, the proportion of macropore and mesopore in A1 reached 54%. As shown in Figure 5, when the cumulative distribution frequency of pore throat radius is 90%, the corresponding pore throat radius is 2.59 μm. By contrast, the proportion of macropore and mesopore in A2 is only 5%, and the corresponding pore throat radius is only 0.06 μm when the cumulative distribution frequency of pore throat radius is 90%. The movable water saturation in the core B1 and B2 is 8.72% and 3.08%, respectively. The proportion of macropore and mesopore in B1 reached 47%, and the corresponding pore throat radius is 1.34 μm when the cumulative distribution frequency of pore throat radius is 90%. However, the proportion of macropore and mesopore in B2 is only 10%, and the corresponding pore throat radius is only 0.149 μm when the cumulative distribution frequency of pore throat radius is 90%. Other groups of tight sandstone cores also show the same characteristics, and thus, it can be seen that the tight sandstone core with the low higher movable water saturation will have a larger the proportion of large and mesopore throats.
In the laboratory, different centrifugal forces are often applied to the core with completely saturated water to simulate the filling and accumulation of gas flooding. Different centrifugal forces correspond to different reservoir formation forces. Figure 6 shows the percentage of water-bearing pores in different types of pores in the core after centrifugation with different centrifugal forces. As shown, with a continuous increase of centrifugal force, the water in the macropores and mesopores in the core is gradually displaced, while the water in the micropores and small holes is replaced. Even when the centrifugal force reaches 350 psi, the water-bearing pores in the micro and small pores still occupy a high proportion, and water that is not completely displaced in large and mesoporous throats is the main source of movable water. Therefore, the level of movable water saturation is generally related to the microscopic pore throat characteristics in tight sandstone gas reservoirs: the larger the proportion of large and mesopore throats, the higher the movable water saturation.
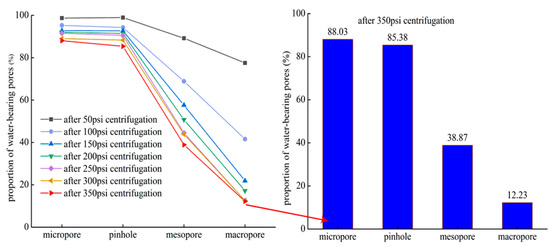
Figure 6.
Proportion of water-bearing pores in different pores of tight sandstone cores after the application of centrifugal force.
3.2.2. Effect of Clay Mineral
According to the XRD and SEM analyses, the mineral composition of the four groups of tight sandstone cores is mainly quartz and feldspar; the total content of the two minerals is about 77.77%. The average contents of quartz, potassium feldspar and plagioclase are 60.7%, 6.85% and 10.15%, respectively. Clay minerals are generally developed in the reservoir core, and the proportion of authigenic clay minerals in the rock mineral composition ranges from 13.2% to 44.4%, with an average proportion is 30.125%. The authigenic clay mineral types mainly include illite, chlorite, mixed illite/smectite and rare kaolinite, as shown in Figure 7.
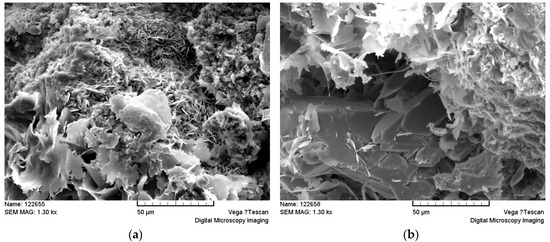
Figure 7.
Scanning electron microscope image of tight sandstone cores: (a) Intragranular chlorite, illite; (b) Quartz, mixed illite/smectite.
Clay mineral content versus movable water saturation in the tight sandstone cores is illustrated in Figure 8. As shown, there is a significant negative correlation between these two parameters; the higher the clay mineral content in the core, the lower the movable water saturation. This is because the movable water mainly occurs in the connected large pore throat, while the clay mineral composition in the core will have a negative effect on the pore throat size and connectivity of the reservoir. Chlorite (Figure 7a) is mainly coniferous, filled in the pore throat of the reservoir, although a small amount occurs on the surface of particles in thin film. Illite mainly occurs between the particles in the form of a crimp sheet and filiform. On the one hand, the network bridging distribution cuts a large number of pore throats into tiny bound pores, which results in the reduction of pore throat connectivity. On the other hand, after contact with groundwater, some illite will expand weakly and the filiform illite will also be dissolved and destroyed, which spreads, transfers and blocks the throat [33]. Clay minerals such as montmorillonite and mixed illite/smectite exhibit a semicellular distribution (Figure 7b). When they contact water expansion, they absorb water and expand to various degrees, which makes the pore throat of the reservoir smaller, even blocking it occasionally, resulting in a decrease in permeability [34].
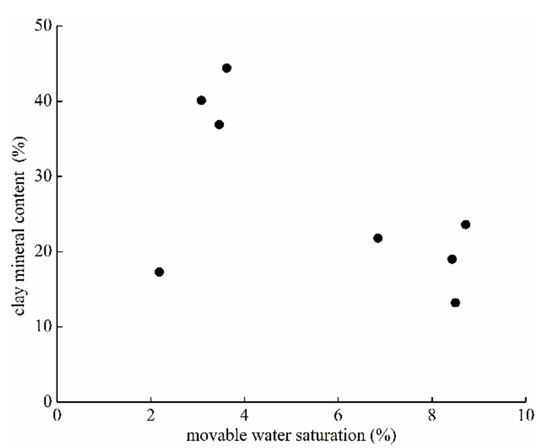
Figure 8.
Clay mineral content versus movable water saturation.
3.2.3. Effect of Reservoir Physical Properties
To understand the effect of the reservoir physical properties on the movable water in rock pores, more than 100 representative cores were obtained from the Sulige tight sandstone gas reservoirs. The core permeability ranged from 0.0003 × 10⁻³ μm2 to 4.024 × 10⁻³ μm2. The porosity was between 2.4% and 16.57%, and the initial water saturation ranged from 22.6% to 92.25%. The movable water saturation of these cores was distributed from 3.19% to 17.53%. Figure 9 shows the movable water saturation versus porosity, permeability and initial water saturation in the tight sandstone cores. As shown in Figure 9, there was no obvious correlation between the porosity, permeability, initial water saturation and movable water saturation. The low-porosity cores can have high movable water saturation, while the high-porosity cores can have low movable water saturation. The D1 porosity was 5.5%, and its movable water saturation was 8.5%; the D2 porosity was 9.34%, while its movable water saturation was only 3.62%. Compared with their microscopic pore throat characteristics as mentioned the above, the proportion of mesopore throat in the D2 was only 11%, which was far lower than 51% of the D1. The reason for this was that the porosity is only a percentage of the effective pores in the reservoir, and cannot effectively reflect the pore connectivity and pore throat quality. Although permeability can characterize pore-throat connectivity, it cannot reflect the distribution of pore-throats in the reservoir. The proportion of pore-throat distribution has a great effect on the movable water saturation. There is no corresponding relationship between the movable water saturation and the original water saturation. Macroscopic factors such as reservoir formation dynamics, structure, deposition and diagenesis and the original water saturation are known to be affected by the microscopic pore throat distribution, physical properties of the rock surface, capillary pressure and Jamin effect. Therefore, there is a complex relationship between the porosity, permeability, initial water saturation and movable water saturation.
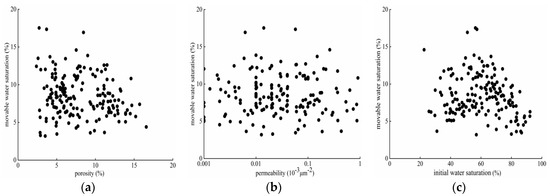
Figure 9.
Movable water saturation versus porosity (a), permeability (b) and initial water saturation (c).
3.3. Water Production Characteristics
To understand the water production characteristics during the development of tight sandstone gas reservoirs, gas flooding experiments and the NMR measurement were conducted in this study. The core water saturation under different differential pressures after gas flooding is shown in Figure 10. As shown, a breakthrough point exists of critical water production during the flow of movable water, i.e., only a small part of the movable water in the macropores can flow out when it is below a critical differential pressure. When the gas flooding pressure is larger than the critical pressure difference, the water production of the core increases sharply and the gas flooding force power is more abundant. The large amount of movable water occurring in the macropores can go out, and the residual water limited by capillary force in some micropores will also be driven to flow; that is why some gas wells suddenly produce water or increase water production when the drawdown pressure is increased. In such cores, the lower the core permeability, the higher the critical gas drive pressure difference. As it is shown in Figure 10, the critical pressure differences of cores A1, B1 and C1 (K < 0.1 mD) were about 2 MPa, 3 MPa, and 2 MPa, respectively, while that of D1 (K > 0.1 mD) was only 0.5 MPa. When the gas drive pressure difference reaches the critical breakthrough point, the decrease of water saturation will decrease. Taking core D1 as an example, as shown in Figure 10d, when the pressure difference of the gas drive reached the critical breakthrough point of 0.5 MPa, the water saturation of the core decreased by 13.16%, while the water saturation of the core decreased by only 4.56% when the pressure difference increased to 8 MPa.
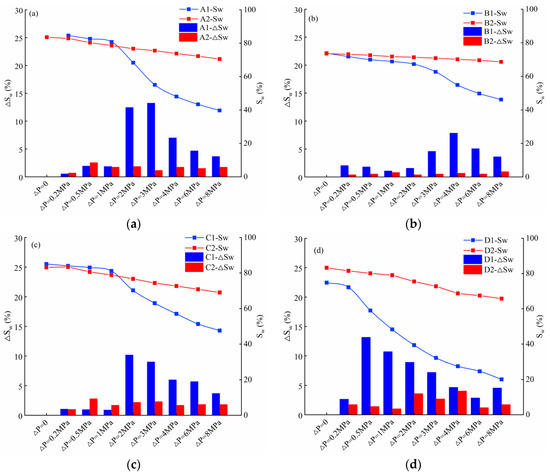
Figure 10.
Core water saturation versus different differential pressures after gas flooding: (a) Core A1, A2; (b) Core B1, B2; (c) Core C1, C2; (d) Core D1, D2.
Moreover, there were obvious differences among the cores with similar permeabilities and porosities but different movable water saturation. The higher the movable water saturation, the greater the water production. The initial water saturations of cores A1 and A2 were 85.12% and 83.57%, and the movable water saturation was 6.85% and 2.15%, respectively. Water production was not significant under a low-pressure difference of gas drive in the early stage, but the production at the core A1 was much larger than that at the core A2 at the later stage. At the end of the experiment, the water saturation of the A1 core was 39.72%, which decreased by 42.37%, while that of the A2 core was 70.51%, which decreased by 9.09%. The decreases of the water saturation in cores B1, B2, C1, C2, D1 and D2 were 25.12%, 2.59%, 45.03%, 15.74%, 57.80% and 17.50%, respectively. Therefore, there was is a strong positive correlation between movable water saturation and water production in the tight sandstone cores. The movable water saturation can effectively characterize the water production characteristics of gas wells in the tight sandstone gas reservoirs.
3.4. Movable Water Saturation and Water Production Characteristics
In order to understand the movable water and water production characteristics in tight sandstone gas reservoirs, more than 300 cores were selected from the Sulige gas field and the Xujiahe Formation in the Sichuan Basin, China. The movable water saturation versus porosity in tight sandstone cores is illustrated in Figure 11. As shown, there were significant differences in the distribution range of the movable water saturation in different tight sandstone gas reservoirs. In the Sulige gas field, the movable water saturation of the tight gas reservoirs was low, i.e., most of them were below 8%, with very few reservoirs ranging from 8% to 11%. The distribution range of movable water saturation in the Xu-6 gas reservoir was similar to that of Sulige gas field, while the movable water saturation in the Xu-2 and Xu-4 gas reservoirs was obviously higher than 8%, with half of them being more than 11%. The movable water saturation measured is in good agreement with the overall characteristics of tight sandstone gas reservoirs. There is little or no water production in gas wells in the central and eastern Sulige gas fields, while there is a large amount of water production in the Xu-2 and Xu-4 gas reservoirs, except for the Xu-4 gas reservoirs. Compared with the relationship between the water production and the movable water saturation, it can be seen that there is a significant positive correlation between them, as shown in Figure 12. When the movable water saturation of tight sandstone reservoirs is less than 6%, gas wells will not produce water; in contrast, when the movable water saturation of tight sandstone reservoirs is between 6% and 8%, gas wells will produce a small amount of water, and when saturation is more than 8%, gas wells will produce a large amount of water or even flood. In summary, the higher the movable water saturation in tight sandstone reservoirs, the more serious the water production in gas wells.
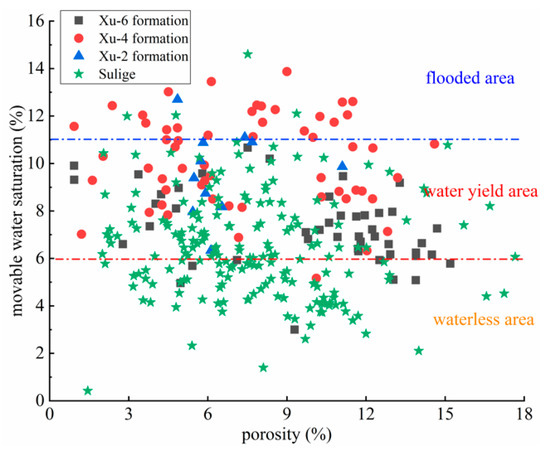
Figure 11.
Movable water saturation versus porosity in tight sandstone cores.
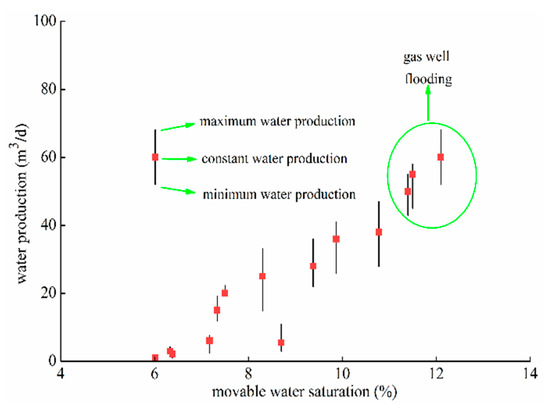
Figure 12.
Water production versus movable water saturation.
4. Conclusions
In this study, measurements of the behavior of movable water in the Sulige tight sandstone gas field were taken at different differential pressures. Then, NMR, XRD and SEM analyses were performed to determine the influence of reservoir micropore throats, clay minerals and physical properties on movable water saturation. Furthermore, a combination of gas flooding experiments and the NMR technique was used to determine the movable water saturation and water production characteristics. According to the above results, the following conclusions can be drawn from this study: (1) There is a complex relationship between porosity, permeability, initial water saturation and movable water saturation. However, movable water saturation is related to the reservoir micropore throat and clay mineral content; the larger the proportion of macropore throat, the higher the movable water saturation. In contrast, the lower the mineral content, the higher the movable water saturation. (2) Movable water saturation is consistent with the water production characteristics in the tight sandstone gas reservoirs. The higher the movable water saturation, the more water the gas well produces. The gas well will not produce water when the movable water saturation is less than 6%, while it will produce a large amount or even flood once the movable water saturation is more than 8%. (3) There is a critical pressure difference in the flow of movable water. Only a small amount of movable water can flow out at smaller pressure differences, while there is a large amount of movable water when the gas drive pressure is larger than the critical pressure difference. Movable water saturation can be used to characterize, evaluate and predict the water production characteristics in tight sandstone gas reservoirs.
Author Contributions
This paper is a collaborative work of all the authors. J.Z. and S.G. proposed the idea and wrote the manuscript. H.L., L.Y. and F.F. cored the sandstone core and carried out the experiment. W.S. and X.L. helped with the analysis of the experimental data. J.Z. and W.S. revised and perfected the paper. All authors have read and agreed to the published version of the manuscript.
Funding
This research received no external funding.
Acknowledgments
This research was funded by the National Natural Science Foundation of China, grant number U1762216, 11802312, and the Open Fund of State Key Laboratory of Oil and Gas Reservoir Geology and Exploitation (Southwest Petroleum University), grant number PLN201810. We also thank the support from the Youth Foundation of Key Laboratory for Mechanics in Fluid Solid Coupling Systems, Chinese Academy of Sciences.
Conflicts of Interest
The authors declare no conflict of interest.
References
- Holditch, S.A. Tight gas sands. J. Pet. Technol. 2006, 58, 86–93. [Google Scholar] [CrossRef]
- Nelson, P.H. Pore-throat sizes in sandstones, tight sandstones, and shales. AAPG Bull. 2009, 93, 329–340. [Google Scholar] [CrossRef]
- Shen, W.J.; Song, F.Q.; Hu, X.; Zhu, G.M.; Zhu, W.Y. Experimental study on flow characteristics of gas transport in micro- and nanoscale pores. Sci. Rep. 2019, 9, 10196. [Google Scholar] [CrossRef] [PubMed]
- Hughes, J.D. Energy: A reality check on the shale revolution. Nature 2013, 494, 307. [Google Scholar] [CrossRef]
- IEA. World Energy Outlook 2019; IEA: Paris, France, 2019; Available online: https://www.iea.org/reports/world-energy-outlook-2019 (accessed on 13 November 2019).
- Li, X.Z.; Guo, Z.H.; Hu, Y.; Luo, R.L.; Su, Y.H.; Sun, H.D.; Liu, X.H.; Wan, Y.J.; Zhong, Y.Z.; Li, L. Efficient development strategies for large ultra-deep structural gas fields in China. Pet. Explor. Dev. 2018, 45, 111–118. [Google Scholar] [CrossRef]
- Li, X.Z.; Liu, X.H.; Su, Y.H.; Wu, G.M.; Liu, H.X.; Lu, L.L.; Wan, Y.J.; Guo, Z.H.; Shi, S. Correlation between per-well average dynamic reserves and initial absolute open flow potential (AOFP) for large gas fields in China and its application. Pet. Explor. Dev. 2018, 45, 1020–1025. [Google Scholar] [CrossRef]
- Qiao, J.; Zeng, J.; Jiang, S.; Feng, S.; Feng, X.; Guo, Z.; Teng, J. Heterogeneity of reservoir quality and gas accumulation in tight sandstone reservoirs revealed by pore structure characterization and physical simulation. Fuel 2019, 253, 1300–1316. [Google Scholar] [CrossRef]
- Lai, F.; Li, Z.; Zhang, T.; Zhou, A.; Gong, B. Characteristics of microscopic pore structure and its influence on spontaneous imbibition of tight gas reservoir in the Ordos Basin, China. J. Pet. Sci. Eng. 2019, 172, 23–31. [Google Scholar] [CrossRef]
- Li, X.Z.; Lu, D.T.; Luo, R.L.; Sun, Y.P.; Shen, W.J.; Hu, Y.; Liu, X.H.; Guan, C.X.; Guo, H. Quantitative criteria for identifying main flow channels in complex porous media. Pet. Explor. Dev. 2019, 46, 998–1005. [Google Scholar] [CrossRef]
- Ye, L.Y.; Gao, S.S.; Yang, H.Z.; Xiong, W.; Hu, Z.M.; Liu, H.X.; Du, S. Water production mechanism and development strategy of tight sandstone gas reservoirs. Nat. Gas Ind. 2015, 35, 41–46. [Google Scholar]
- Shen, W.J.; Liu, X.H.; Li, X.Z.; Lu, J.L. Investigation of water coning mechanism in Tarim fractured sandstone gas reservoirs. J. Cent. South Univ. (Engl. Edn.) 2015, 22, 344–349. [Google Scholar] [CrossRef]
- Gao, S.S.; Hou, J.R.; Yang, H.Z.; Xiong, W.; Hu, Z.M. Water production mechanism of Xujiahe low-permeability sandstone gas reservoirs in middle Sichuan Basin. Nat. Gas Ind. 2012, 32, 40–42. [Google Scholar]
- Li, Y.; Xiao, F.; Xu, W.; Wang, J. Performance evaluation on water-producing gas wells based on gas & water relative permeability curves: A case study of tight sandstone gas reservoirs in the Sulige gas field, Ordos Basin. Nat. Gas Ind. B 2016, 3, 52–58. [Google Scholar]
- Cao, R.Y.; Ye, L.Y.; Lei, Q.H.; Chen, X.H.; Ma, Y.Z.; Huang, X. Gas-water flow behavior in water-bearing tight gas reservoirs. Geofluids 2017, 9745795. [Google Scholar] [CrossRef]
- Yang, M.P.; Li, Y.; Peng, C.Z. Analysis of stress sensitivity for irreducible water of gas reservoir. Nat. Gas Geosci. 2004, 15, 391–394. [Google Scholar]
- Guo, P.; Huang, W.G.; Jiang, Y.W.; Bi, J.X.; Chen, Z.Y. Research on the irreducible and movable water of tight sandstone gas reservoir. Nat. Gas Ind. 2006, 26, 99–101. [Google Scholar]
- Taktak, F.; Rigane, A.; Boufares, T.; Kharbachi, S.; Bouaziz, S. Modelling approaches for the estimation of irreducible water saturation and heterogeneities of the commercial Ashtart reservoir from the Gulf of Gabès, Tunisia. J. Pet. Sci. Eng. 2011, 78, 376–383. [Google Scholar] [CrossRef]
- Ye, L.Y.; Gao, S.S.; Xiong, W.; Hu, Z.M.; Guo, H.K. Demonstration of mobile water saturation as evaluation parameter of low-permeability sandstone gas reservoir. J. Oil Gas Technol. 2011, 33, 57–59. [Google Scholar]
- Sheng, J.; Sun, W.; Duan, B.H.; Liu, Y.N.; Tao, Z.; Cao, L. Water lock effect mechanism of tight sandstone gas reservoir: An example of the He 8 reservoir of the Upper Paleozoic in the southeast region of Sulige Gasfield. Nat. Gas Geosci. 2015, 26, 1972–1978. [Google Scholar]
- Bear, J.; Rubinstein, B.; Fel, L. Capillary pressure curve for liquid menisci in a cubic assembly of spherical particles below irreducible saturation. Transp. Porous Med. 2011, 89, 63–73. [Google Scholar] [CrossRef]
- Zhang, L.; Tong, J.; Xiong, Y.; Zhao, Y. Effect of temperature on the oil-water relative permeability for sandstone reservoirs. Int. J. Heat Mass Transf. 2017, 105, 535–548. [Google Scholar] [CrossRef]
- Tian, W.; Li, A.; Ren, X.; Josephine, Y. The threshold pressure gradient effect in the tight sandstone gas reservoirs with high water saturation. Fuel 2018, 226, 221–229. [Google Scholar] [CrossRef]
- Timur, A. Pulsed nuclear magnetic resonance studies of porosity, movable fluid, and permeability of sandstones. J. Pet. Technol. 1969, 21, 775–786. [Google Scholar] [CrossRef]
- Wuthrich, K. Protein structure determination in solution by nuclear magnetic resonance spectroscopy. Science 1989, 243, 45–50. [Google Scholar] [CrossRef] [PubMed]
- Slijkerman, W.F.; Hofman, J.P.; Looyestijn, W.J.; Volokitin, Y. A practical approach to obtain primary drainage capillary pressure curves from NMR core and log data. Petrophysics 2001, 42, 1–10. [Google Scholar]
- Zhou, C.; Liu, Z.; Zhang, L.; Dai, D.; Zhang, L.; Li, C.; Liu, G. Applications of NMR logs to complex lithology interpretation of ordos basin. In Proceedings of the SPWLA 48th Annual Logging Symposium, Austin, TX, USA, 3–6 June 2007; pp. 100–110. [Google Scholar]
- Hu, Y.B.; Guo, Y.H.; Zhang, J.J.; Shangguan, J.W.; Li, M.; Quan, F.K.; Li, G.L. A method to determine nuclear magnetic resonance T2 cutoff value of tight sandstone reservoir based on multifractal analysis. Energy Sci. Eng. 2020, 8, 1135–1148. [Google Scholar] [CrossRef]
- Zhu, H.Y.; Xu, X.; An, L.Z.; Guo, C.M.; Xiao, J.R. An experiment on occurrence and mobility of pore water in tight gas reservoirs. Acta Pet. Sin. 2016, 37, 230–236. [Google Scholar]
- Gao, H.; Li, H.A. Pore structure characterization, permeability evaluation and enhanced gas recovery techniques of tight gas sandstones. J. Nat. Gas Sci. Eng. 2016, 28, 536–547. [Google Scholar] [CrossRef]
- Lai, J.; Wang, G. Fractal analysis of tight gas sandstones using high-pressure mercury intrusion techniques. J. Nat. Gas Sci. Eng. 2015, 24, 185–196. [Google Scholar] [CrossRef]
- Gao, H.; Li, T.; Yang, L. Quantitative determination of pore and throat parameters in tight oil reservoir using constant rate mercury intrusion technique. J. Pet. Explor. Prod. Technol. 2016, 6, 309–318. [Google Scholar] [CrossRef]
- Puntervold, T.; Mamonov, A.; Aghaeifar, Z.; Frafjord, G.O.; Moldestad, G.M.; Strand, S.; Austad, T. Role of Kaolinite Clay Minerals in Enhanced Oil Recovery by Low Salinity Water Injection. Energy Fuels 2018, 32, 7374–7382. [Google Scholar] [CrossRef]
- Mamonov, A.; Puntervold, T.; Strand, S.; Hetland, B.; Andersen, Y.; Wealth, A.; Nadeau, P.H. Contribution of feldspar minerals to pH during Smart Water EOR processes in sandstones. Energy Fuels 2020, 34, 55–64. [Google Scholar] [CrossRef]


© 2020 by the authors. Licensee MDPI, Basel, Switzerland. This article is an open access article distributed under the terms and conditions of the Creative Commons Attribution (CC BY) license (http://creativecommons.org/licenses/by/4.0/).