Abstract
One potential opportunity for the decarbonisation of heat supply in the UK is the repurposing of onshore hydrocarbon wells for the production and/or storage of geothermal heat. This paper reports an investigation into the most favourable candidate sites for such repurposing, taking into consideration the available thermal energy outputs and technological options for heat use. A GIS mapping model was generated, combining public domain data on onshore wells and production data from onshore fields, provided by the UK Oil and Gas Authority, with available subsurface temperature data. This model has thus integrated information on location, depth, operational status, and bottom-hole temperature for onshore hydrocarbon wells with production rates from onshore fields in the UK. Of the 2242 onshore hydrocarbon wells thus reported, 560 have the potential to be repurposed, 292 of which are currently operating. Using aggregated water production data for all operating wells in each field, the fields with the greatest potential for geothermal repurposing are ranked. Two of these, the Wytch Farm and Wareham fields, are selected for more detailed analysis. Wytch Farm, the largest onshore oilfield in western Europe, produces water at ~65 °C that might yield a feasible thermal power output of ~90 MW. If an end use could be found where it might substitute for burning of natural gas, the value of this output would be ~£90,000 per day or ~£30 million per year. However, this field is located in a protected landscape where local development would be restricted by planning regulations. The Wareham field is not in a protected landscape, but the low temperature, ~44 °C, and low flow rate limit the scope of potential end uses. Nonetheless, these and the other highly ranked fields have potential heat outputs that are significant compared with other geothermal heat projects, thus offering the possibility of making useful contributions to the decarbonisation of UK energy use.
1. Introduction
Geothermal energy exploration is driven by the need to supply low-carbon energy, which is becoming increasingly important in the UK energy mix, particularly given the need to address the energy ‘trilemma’: providing sustainable, equitable and secure energy supply. Geothermal energy has the capability to address each of these issues; its associated technologies are low carbon, clean, and sustainable and do not suffer from the intermittency issues experienced by other renewable energy sources such as wind and solar (e.g., [1,2]).
Use of low-temperature geothermal heat from relatively shallow wells is well established in volcanic regions with high geothermal gradients (e.g., [3,4]). For sites in intraplate regions with moderate heat flow, such as the UK, many workers have identified the combination of social, technical, economic, and regulatory barriers to the adoption of this technology (e.g., [5,6,7]). The most significant issue is recognised as economic, due to the capital cost of drilling being such a high proportion of project lifecycle costs [6]. The repurposing of hydrocarbon wells provides a potential solution to this issue, by adding additional value to previous capital expenditure.
In June 2019, in response to recommendations from the Committee on Climate Change [8], an advisory body to the government, the UK became the first major jurisdiction to legislate for net-zero greenhouse gas emissions by 2050 (2045 for Scotland), superseding its previous target of reducing emissions by at least 80% from 1990 levels. In the UK, heat represents ~45% of total energy demand, ~28% of energy being used on an annual basis for space heating. This heating demand is dominated by the burning of natural gas, 62% of the total gas consumption being for domestic heating and cooking and a further 18% being used by industry [9]. Summer 2018 having been the joint hottest on record in the UK, low-carbon cooling systems may also soon be in high demand. The UK horticulture sector is another large energy consumer and greenhouse gas emitter and is exposed to fluctuating energy prices; it might also benefit from geothermal heat, as has been supplied on a large scale in recent years in this sector in the Netherlands (e.g., [10,11]). Geothermal heating and cooling thus have the potential to play a key role in the decarbonisation of energy supply in the UK.
One potential opportunity is the repurposing of onshore hydrocarbon wells for the production and/or storage of geothermal heat. The current UK regulatory framework does not contemplate geothermal co-production from existing hydrocarbon wells, or their retrospective repurposing for geothermal use; once hydrocarbon production ceases, wells must be plugged and abandoned by the operator. Subject to appropriate regulatory provision in the future, there is the potential for reusing existing infrastructure to provide sustainable, low-cost heat from these wells. In this study, it is assumed that regulations will indeed be changed, in recognition of the added value of repurposing hydrocarbon wells for geothermal energy production and/or storage. The wealth of infrastructure, expertise and subsurface data that exists within the UK onshore hydrocarbon sector thus potentially provides a formidable asset for the development of low-carbon geothermal energy resources.
Previous consideration of geothermal repurposing of hydrocarbon wells (e.g., by [12]) has concentrated on generation of electricity. Some jurisdictions offer subsidies for geothermal electricity, reflecting its potential contribution to the environmental benefits of decarbonisation. For example, geothermal electricity generated at sites in the Upper Rhine Graben has attracted subsidies from the French or German governments of >20 euro cents (~20 p) per kWh. However, in the UK (and in many other jurisdictions), no specific subsidy exists for geothermal electricity. Furthermore, at present (June 2020), the UK has ~14 GW of offshore and ~10 GW of onshore wind-generating capacity [13], with the government committed to expanding the offshore capacity to ~40 GW by 2030 [14]. Adding a small component of geothermal electricity generation to this would make no significant difference to the overall decarbonisation achieved, whereas much less progress has been achieved towards the decarbonisation of heat; geothermal heat indeed has many potential end uses (Figure 1). There is no global inventory of hydrocarbon wells, but estimation on the basis of available data including the many tens of thousands of oil and gas fields worldwide [15] and the circa 1 million operational onshore hydrocarbon wells in the USA alone [16], the potential worldwide number of wells available for geothermal repurposing for heat is many millions. A significant resource thus exists; we envisage its development will involve many steps including demonstration and pilot projects.
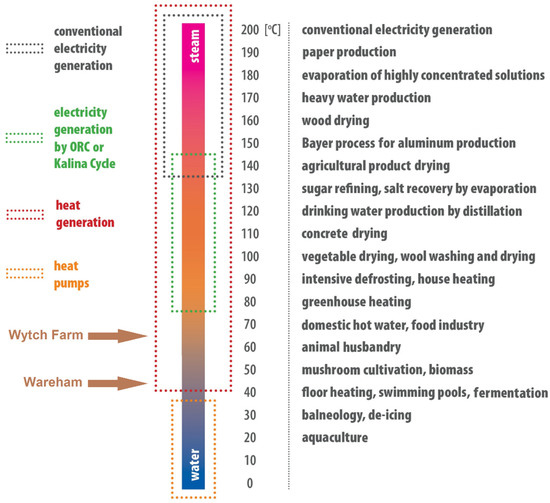
Figure 1.
Modified Lindal diagram showing applications for geothermal fluids as a function of their temperature, modified after [17]. ORC denotes the Organic Rankine Cycle. The arrows on the left indicate the low temperature range of interest for the sites analysed in this study.
As an initial step in this process, this paper summarises key findings of an investigation into the most favourable candidate sites for geothermal repurposing of onshore hydrocarbon wells in the UK. In addition to providing results, identifying the UK onshore fields with greatest potential for repurposing for heat, this study demonstrates a workflow that will be more widely applicable. We shall initially summarise the range of technological options for such repurposing. Next, taking into consideration this range of options, we assess favourable candidate sites where UK onshore hydrocarbon wells could be repurposed for geothermal energy production or storage. This is achieved in three stages. First, a screening survey is conducted of potential candidate sites using GIS mapping and database compilation of available public domain information. Second, the most favourable candidate sites are selected for further analysis, including detailed calculations of potential heat output. Next, a Decline Curve Analysis of production rates is conducted for two selected fields to extrapolate geofluid production to determine the recoverable heat resources and, thus, the end uses that might be sustained, over an assumed project lifetime. Finally, the resources thus identified are compared with those available in other low-temperature geothermal projects, and technical and environmental constraints affecting use of the available heat are discussed.
2. Repurposing Hydrocarbon Wells and Technology Options
The geothermal potential of hydrocarbon wells has been investigated by several authors, with pilot projects implemented worldwide and pre-feasibility studies carried out (e.g., [18,19,20,21,22,23,24]). Although offshore hydrocarbon fields offer geothermal energy potential (e.g., [19,23,25]), it is likely that only electricity generation would be appealing in such remote environments and exclusively for in-project utilisation, unless interconnecting export grids become available (e.g., from Iceland). However, as reported by [26,27] for the East Midlands Petroleum Province in the UK, an opportunity may exist whereby onshore hydrocarbon wells could be repurposed to provide geothermal heat, which may contribute significantly to meeting the heat demand of local housing stock or indeed of commercial or agricultural users (Figure 1).
The UK has more than 2000 onshore petroleum exploration wells, compared with ~9000 offshore wells, drilled since the beginning of the twentieth century [28]. From assessment of the onshore hydrocarbon well database held by the Oil and Gas Authority (OGA), the regulator of the oil and gas sector in the UK, the majority of onshore wells are drilled to depths of ≤2 km [29], in contrast with the depths of ~3 to >5 km typical offshore. However, given the regional geothermal gradients and heat flows within sedimentary basins in the UK, onshore hydrocarbon wells may be suited for repurposing for geothermal heat production.
There are several options for technological synergies between production of hydrocarbons and production of geothermal energy. For mature producing onshore fields, hydrocarbon operations could continue, but with the inclusion of geothermal infrastructure, as studied at the Wytch Farm [22,24] and Trecate-Villafortuna [18] fields. Depending on its temperature, the substantial volume of co-produced water presents opportunities, including for electricity generation, direct use of heat by nearby users, district heating and cooling, industrial heating and cooling and combined heat and power generation (Figure 1). Such use of the co-produced water has the potential for offsetting operational expenditure, extending the life of the hydrocarbon field, improving ultimate hydrocarbon recovery and delaying decommissioning liabilities. Depending on the long-term infrastructure of the field and the regulatory framework, the hydrocarbon operator might eventually transfer a field to a geothermal operator. For abandoned exploration wells, or wells that have ceased hydrocarbon production, there are a variety of technological options for repurposing. A well might be re-drilled into a deeper aquifer zone to enable some wells in a field to be converted to geothermal production wells and others to water re-injection wells. This option could likewise be used for aquifer thermal storage; the structural/stratigraphic traps in permeable lithologies such as Carboniferous limestone would be suitable targets for this [30]. Another option might be to drill multiple slim lateral holes from an existing or deepened well-bottom to increase water withdrawal, as the original mother bore completions could host more water following the depletion of hydrocarbons. A further variant has been proposed [31], to develop a geothermal project with a production well in the water leg of a gas reservoir, near a gas production well. Water production for geothermal use in this configuration can reduce the water pressure acting on the gas reservoir, slowing water encroachment into the gas cap and thus prolonging gas production. Such a configuration might indeed be managed to optimise the combined value of gas production and heat production.
An alternative to re-drilling a well might be to re-complete the well to implement a closed-loop wellbore heat exchanger system [32,33]. This would depend on favourable geological conditions and local heat requirements [34]. Application of this technology would remove the cost of drilling a new deep geothermal well. If required, enlargement of the near-wellbore region could be conducted to artificially enhance the downhole thermal properties [33].
3. Screening Survey
Starting with public domain datasets, the first objective of this study was to conduct a screening survey of candidate hydrocarbon wells with potential for geothermal repurposing. As discussed in [35], the UK currently has no dedicated mapping tool or mechanism to assess the potential geothermal resource at any location analogous to ThermoGIS [36] in the Netherlands [37,38] or GeotIS [39] in Germany [40]. There has also been no attempt so far to apply the United Nations Framework Classification for Resources (UNFC) to the UK; the UNFC is the only international standard for the classification and reporting of oil and gas, mineral resources, nuclear fuel resources, renewable energy, injection projects and anthropogenic resources [41]. Thus, to facilitate this study and to map potential candidate sites, a GIS mapping model integrating onshore hydrocarbon well data with subsurface temperature data was required.
In the absence of a UK equivalent of ThermoGIS or GeotIS, a GIS model of the extent, depth and thickness of potential UK geothermal aquifers was generated (Figure 2), using data from [42]. This allows the areal extent of potential geothermal resources to be established and the proximity of hydrocarbon wells to these areas to be examined at a regional, or basin-wide, scale. The process of data collection, integration, and analysis, to produce this GIS model, is described in [43].
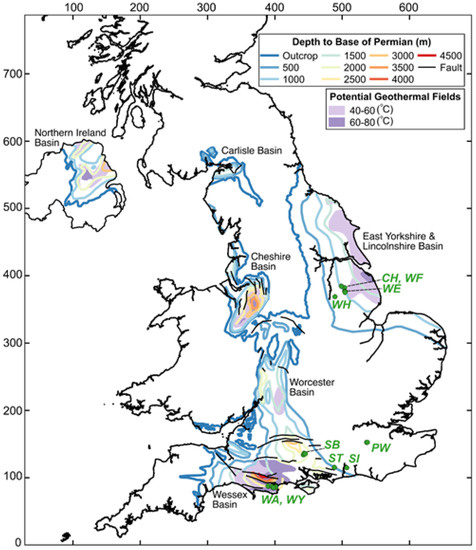
Figure 2.
Map showing the extent and depth of Triassic and Permian aquifers in the UK. The extents of potential low-temperature geothermal fields in these aquifers are also shown. The fields detailed in Table 1, shown as green dots, fall into two groups: in the Wessex Basin in the south; and in the East Midlands farther north. CH, Cold Hanworth; PW, Palmer’s Wood; SB, Stockbridge; SI, Singleton; ST, Storrington; WA, Wareham; WE, Welton; WF, West Firsby; WH, Whisby; and WY, Wytch Farm. Modified after [42]. British National Grid co-ordinates (north and east) are in 100 km intervals.
We now summarize the application of this GIS model to implement our screening survey. We thus use this model to identify candidate wells with potential for geothermal repurposing, basing the overall selection on the water production rate, operational status, depth, and estimated reservoir temperature.
3.1. UK Onshore Hydrocarbon Well Data
Water production rate is the first screening criterion noted above. The OGA Petroleum Production Reporting System database [44] reports production rates of hydrocarbons and co-produced water aggregated for all operational wells in each onshore field, but not on a well by well basis. Based on this source, Table 1 lists the ten onshore fields with the highest annual water production rates. In contrast, screening by depth and operational status was possible on a well by well basis. To enable this, a database of all 2242 UK onshore hydrocarbon wells (Figure 3a) was compiled using the OGA online Data Centre and public wellbore search tool [29,43].

Table 1.
Water production rates in UK onshore oilfields.
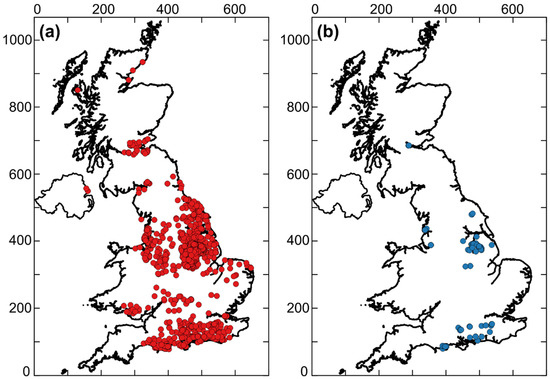
Figure 3.
UK onshore hydrocarbon wells with OGA records: (a) all UK onshore hydrocarbon wells; (b) operating wells selected as potential candidates for geothermal repurposing. British National Grid co-ordinates (north and east) are in 100 km intervals.
The OGA’s Well Operations Notification System (WONS) [45] reports the operational status of UK hydrocarbon wells. Wells are thus classified as: drilling, completed (operating), completed (shut in), plugged, or at abandonment phase 1, phase 2, or phase 3 [45]. Thus, a status of ‘drilling’ denotes a well that is under construction, and a status of ‘completed (operating)’ denotes a well that is operational for some purpose such as hydrocarbon production or water injection. ‘Completed (shut in)’ denotes a well that is shut in, either at the wellhead or at a subsurface safety valve. ‘Plugged’ means that the reservoir has been isolated from the surface, potentially temporarily, by a plug. ‘Abandonment phase 1’ means that a permanent barrier has been installed in the well to permanently isolate the reservoir. ‘Abandonment phase 2’ means that the reservoir and all permeable zones above it have been permanently isolated from each other and from the surface. Finally, ‘abandonment phase 3’ means that the surface installation at the well site has been removed and will never be used again. For the screening by operational status, wells at phase 2 or phase 3 of abandonment were excluded. Wells at phase 1 of abandonment were included as, although the hydrocarbon reservoir has been made permanently inaccessible, such a well might potentially be re-purposed with a closed-loop borehole heat exchanger (see above).
When screening by depth, wells with a true vertical depth (TVD) of <500 m were disregarded, as this threshold value reflects the regulatory boundary between ‘shallow’ and ‘deep’ geothermal under the UK Renewable Heat Incentive (RHI) subsidy scheme [46]. The RHI scheme has itself been criticised (e.g., [47]) because, instead of stimulating a diverse renewable heat sector, as was the original intention, it has acted mainly to incentivise the burning of biomass. Much of the subsidized biomass burning occurs in large power plants that formerly burnt coal; whether this is a low-carbon solution depends on whether the forests (mainly located in the USA and Canada) that supply the wood pellets are managed without overall depletion of stored carbon biomass, which is difficult to establish (e.g., [48]). The RHI has certainly not yet stimulated a deep geothermal heat sector, the number of projects in this sector accredited for subsidy between the start of the RHI in 2011 and March 2020 being zero [49]. Furthermore, UK government policy is that “no fossil fuel heat is to be supported” by the RHI [50]; this includes industrial waste heat produced by burning fossil fuels, but it is unclear at this stage whether it would also exclude heat co-produced with hydrocarbon production. Nonetheless, application of these criteria, including the RHI definition of deep geothermal, reduced the number of candidate wells from 2242 to 560 (Table 2). Of these, currently operating wells are considered the most favourable and have been taken forward for further investigation in this study (Table 2; Figure 3b).
Table 2.
Status of UK onshore hydrocarbon wells.
3.2. Temperature Data
The temperature of co-produced water has been noted as another screening criterion; it determines potential geothermal end uses of a well or field (Figure 1). We now summarize the sources of subsurface temperature information available in this study. First, [51] reported the regional variation of subsurface temperature at 1 km depth across Britain, based on many subsurface temperature measurements (Figure 4). Second, in their assessment of the potential geothermal resource of the East Midlands Petroleum Province, [26] presented temperature data from well records in 21 hydrocarbon fields. The Horner Correction was applied to correct bottom-hole temperature measurements for the cooling effect of drilling. From these corrected data, these authors determined representative temperature gradients for these 21 fields. Third, for the Welton field (Figure 2), [27] presented a detailed examination of well records; a typical temperature gradient of 29 °C km−1 was determined.
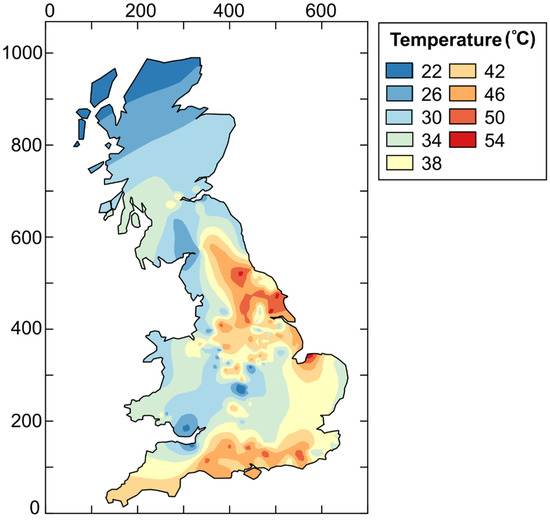
Figure 4.
Regional temperature variation at 1 km depth across the UK, modified after [51]. British National Grid co-ordinates (north and east) are in 100 km intervals.
For candidate wells in the East Midlands Petroleum Province, we have calculated bottom-hole temperatures using the temperature gradients reported by [26,27], given a surface air temperature of 10 °C and the known TVD of each well. Locations of wells outside the East Midlands were overlain onto Figure 4, enabling QGIS geo-processing tools to extract the local temperature at 1 km depth. Again assuming a surface air temperature of 10 °C, the resulting temperature gradient to 1 km depth was extrapolated to a representative depth, to estimate bottom-hole temperature for each field. This part of the screening survey was described in more detail in [43].
The estimates of reservoir temperature thus obtained are subject to some uncertainty due to approximations made in the calculations. For more detailed analysis, the harmonic mean thermal conductivity of each part of the geological sequence at each well site should be established to account for variations in the geothermal gradient due to changes in stratigraphy. However, because the typical reservoir depths are <2 km, uncertainties in extrapolation from 1 km depth do not have major effects. Furthermore, the temperatures estimated at 1 km depth by [51] (Figure 4) were largely based on measurements at depths of <300 m and not corrected for effects of palaeoclimate. The location of Britain, currently warmed by the Gulf Stream but formerly glaciated, means that correction for palaeoclimate will increase the predicted geothermal gradient at greater depths by ~30% [52]. As a result, some of the bottom-hole temperatures estimated in our survey (Table 3) might be underestimated.
Table 3.
The ten most favourable onshore hydrocarbon fields for geothermal repurposing.
3.3. Screening Survey Results
Proceeding as described in Section 3.1 and Section 3.2, we have assessed UK onshore hydrocarbon fields regarding the potential for geothermal repurposing. Table 3 lists the ten most favourable fields thus identified.
4. Calculations of Theoretical Thermal Output
The Wytch Farm field in the Wessex Basin has a significantly higher water production rate and many more operating wells than any other onshore field in the UK; it is indeed the largest onshore oilfield in western Europe [53]. In addition, the estimated reservoir temperature is high enough to support multiple potential applications of the recoverable heat from the co-produced water. We now present calculations of theoretical thermal output for the Wytch Farm and Wareham fields (Figure 5). The history of oilfield development in this area has been explained by many workers (e.g., [53,54,55,56]). In summary, exploration following the discoveries of the small Kimmeridge field in 1959 and Wareham field in 1964 led to the discovery of the Wytch Farm field in 1973. The latter field was developed mainly in the 1980s and 1990s; production started in 1978 and peaked in the period 1996–1997, the field now experiencing declining production and heading towards decommissioning. Production is primarily from the Triassic Sherwood Sandstone at ~1580 m depth and ~65 °C temperature, with subsidiary output from the Jurassic Bridport Sand Formation at ~920 m depth and ~44 °C temperature. The Wytch Farm onshore facility consists of a tie-back of well sites to a central gathering and processing station (W in Figure 6). The produced fluids are transferred from the well sites to this gathering station via infield pipelines, after which oil is sent via a 91 km pipeline to the Hamble Oil Terminal in Southampton, natural gas is sold via a 64 km pipeline to the Southern Gas Pipeline, and LPG is exported by road tankers. All produced water is treated and reinjected. The wells produce with the aid of downhole pumps. The Wareham field produces from the Bridport Sand at two production and injection wellsites, WC and WD (C and D in Figure 6), the production being via beam pumps. Fluid produced at the WC site is piped to the WD site (1.1 km away), where it is commingled with production from WD and exported via a 10 km pipeline to the Wytch Farm gathering station. Injection water is supplied by pipeline from this gathering station to the WD site and thence to the WC site. In 2016, the operator was granted permission (by Dorset County Council) to extend the life of the Wytch Farm field until 2037 [54,57]. On the basis of this factor, as well as the screening exercise summarized in Table 3, the Wytch Farm and Wareham fields have been selected for more detailed analysis of potential heat output.
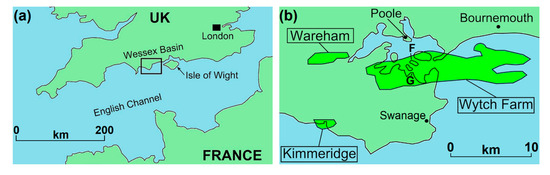
Figure 5.
Location of the Wytch Farm and Wareham fields, modified after [53]. Their geological setting is also depicted in Figure 2. (a) General location map, with inset showing location of (b). (b) Local summary map. F denotes Furzey Island; G denotes the Goathorn Peninsula. The part of the Wytch Farm field beneath the sea south of Bournemouth was developed using Extended Reach Drilling, the wells being drilled from an onshore pad in the Goathorn Peninsula and deviated eastward.
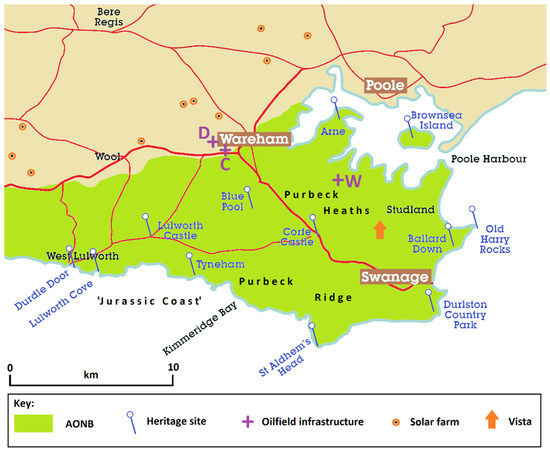
Figure 6.
More detailed map, adapted after [58], showing the locations of the Wytch Farm gathering station (W) and the Wareham WC and WD sites (C and D). Also shown is the designated area of the Dorset Area of Outstanding Natural Beauty (AONB), some of its principal geological, biological, and historical heritage sites, and the locations (from Ordnance Survey topographic maps; [59] provides additional details) of solar farms in the vicinity. Well pads, connected by pipelines to the Wytch Farm gathering station (not shown; [54] provides details), are located in the northern part of the Purbeck Heaths from Arne eastward, as well as on the small Furzey Island to the SW of Brownsea Island. ‘Vista’ denotes the viewpoint for Figure 12.
4.1. Decline Curve Analysis
To predict field performance until 2037, Decline Curve Analysis (DCA) has been applied to the Wytch Farm and Wareham fields. DCA was first introduced in the 1940s [60] and is a standard method for evaluating the future production potential of hydrocarbon wells. A rate vs. time exponential and hyperbolic DCA was performed, using production data retrieved from the OGA database (on a field basis) up to December 2019, with the hyperbolic decline returning the best fit. Average monthly rates were used, that is monthly production values divided by calendar days in the month, which embeds operating efficiency, although it may not capture extended well downtime. One profile per field was generated, which is taken as a ‘mid-case scenario’. Given the age of the wells and facilities, there is inevitably some uncertainty regarding the operating efficiency and how it may change over time. However, given that the ‘mid-case scenario’ profile has been matched to the recent production history, it is implicit that this profile already incorporates the current operating efficiency. Figure 7 and Figure 8 show the DCAs for the Wytch Farm and Wareham fields, assuming that all currently operating wells remain active until 2037.
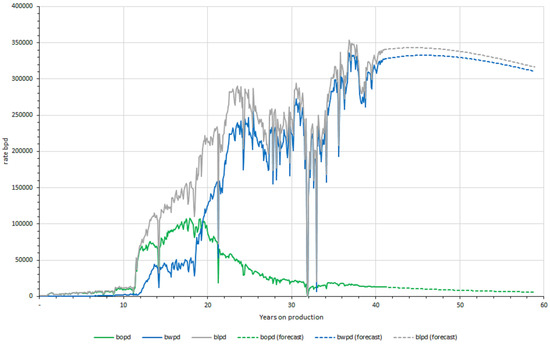
Figure 7.
Decline Curve Analysis of the Wytch Farm field until 2037, time being measured from zero on 1 March 1979. Blpd = barrels of geofluid per day; bopd = barrels of oil per day; bwpd = barrels of water per day.
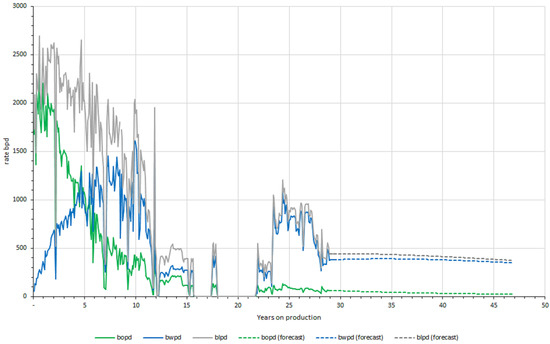
Figure 8.
Decline Curve Analysis of the Wareham field until 2037, in the same format as Figure 7 except time is measured from zero on 1 March 1991.
4.2. Theoretical Thermal Power Output
Given the declining and considerably smaller oil flow rates, as well as the lower heat capacity of oil compared to that of water, only the forecast water production has been considered in this study for estimating thermal output. Thermal power output, Q was thus calculated as:
where cp, ρw and qw are the specific heat capacity, density and volumetric flow rate of the produced fluid and ∆T is the difference in fluid temperature in and out of the heat exchanger. For water, cp and ρw are both sensitive to salinity, which is known to be high for Wytch Farm produced water [61], and also to vary with temperature. Neglecting the temperature dependence, we have used standard calculators [62,63] to estimate cp and ρw. Based on salinities (expressed as equivalent NaCl concentrations) of 209,700 mg L−1 at Wytch Farm and 93,822 mg L−1 at Wareham, cp is estimated as 3300 J kg−1 °C−1 for Wytch Farm and 3900 J kg−1 °C−1 for Wareham, with ρw 1140 kg m−3 for Wytch Farm and 1064 kg m−3 for Wareham. These salinity data were kindly provided by the operator; previously, for Wytch Farm, salinities ranging from 209,000 to 230,000 mg L−1 had been reported [61], apparently reflecting mixing of different sources of brine. For this preliminary assessment of thermal potential, the electrical energy consumed by any circulating pump in the primary distribution pipe network, and any temperature losses through piping between the field separator and heat exchanger, are neglected. For these calculations, ∆T has been assigned a conservative nominal value of 20 °C, although for Wytch Farm, this value might realistically be doubled to 40 °C (see below). The produced water at Wareham has a lower temperature than that at Wytch Farm (see Table 3), hence ∆T could be <20 °C for a hypothetical end use of heat at site WD, although—as noted above—the output from this field is currently commingled with the warmer Wytch Farm geofluid. Subject to these assumptions, the range of estimates for thermal power output is listed in Table 4.
Table 4.
Estimated thermal outputs.
5. Discussion
A key assumption underpinning the previous analysis is that all wells currently operational in the Wytch Farm and Wareham fields will maintain their present pattern of (slowly declining) production until 2037. For Wytch Farm, a previous study [22] considered the alternative production profile shown in Figure 9, which assumes instead that many wells are taken offline from 2027, in preparation for decommissioning, effectively cutting the water production rate by ~60%. This might well be a more realistic approach, as it is unlikely that future geothermal revenue would support maintaining the entire oilfield infrastructure operational. On the other hand, a future geothermal revenue stream might supplement the revenue from sale of hydrocarbons sufficiently that the economic life of the field might be significantly extended. To illustrate the potential importance of this effect, it is noted that the oil from Wytch Farm, produced at ~10,000 barrels per day (Figure 7), might be sold for ~US $40 or ~UK £30 per barrel, thus generating a revenue of ~£300,000 per day. The associated thermal output of ~90 MW, estimated in Table 4 for ΔT = 40 °C, might substitute, as a heat source, for natural gas costing ~4p per kWh. If so, the revenue from heat sales would be ~£90,000 per day, a significant supplement to the revenue from oil sales. On the other hand, contracts for heat supply to end users would undoubtedly require substantial periods of notice to be offered ahead of the ultimate shutdown of oil (and heat) production, which might necessitate continuing production after it ceases to be economic. Figure 7 and Figure 8 indicate that if the oilfields continue to be managed with the same number of wells, roughly constant thermal power outputs can be expected throughout their remaining lifetime, to the year 2037 under current planning constraints, justifying investment in geothermal infrastructure.
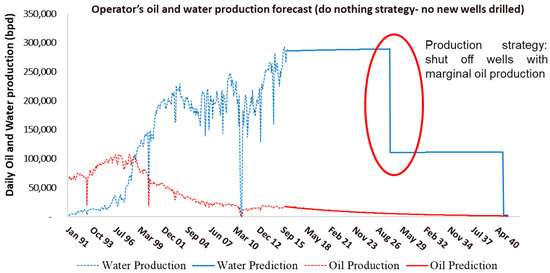
Figure 9.
Possible future water production profile for the Wytch Farm field involving stepping down in output, from [22].
We now discuss three issues in detail: possible uses of the heat output from the Wytch Farm and Wareham fields; comparison of the heat output from these sites with other extant and potential low-temperature geothermal heat projects; and environmental issues.
5.1. Potential Uses of the Heat Output
The co-produced water is highly saline [61], as already noted, and contains oil even after separation (e.g., 100 ppm of oil at Wytch Farm [22]). Given that additional water treatment facilities would add costs, only indirect uses are considered in this study, where the produced geofluid would pass through a heat exchanger and transfer heat to a secondary fluid in a ‘clean’ pipe loop.
The spectrum of geothermal energy applications as a function of temperature can be depicted using a Lindal diagram, as in Figure 1. It is thus evident that the potential range of applications relevant to this study lies at the low-temperature end of this spectrum. In principle, for example, a fourth-generation indirect district heating system, such as that summarised in Figure 10, might have inlet and return temperatures of 65 and 25 °C, and might thus be compatible with heat supplied from the Wytch Farm field with ΔT = 40 °C (cf. Table 4). However, given the rural character of the Wytch Farm/Wareham area, greater scope exists in principle for end uses in the agricultural/horticultural sector. The dramatic expansion of deep geothermal energy in the Netherlands, which by the start of 2019 amounted to 18 projects with a combined thermal output of 221 MW, mostly for horticulture [10,11], illustrates the potential scale of this sector in the UK. This expansion followed the demonstration in 2007 that geothermal heating of greenhouses in the Netherlands would be competitive on cost at ~3 p per kWh with heating using natural gas [64]. Other factors that have facilitated this dramatic development of geothermal heat include open access to subsurface data, with standard software tools for evaluating the potential of projects, a government insurance scheme covering drilling risks, a feed-in tariff for produced heat, and a clear regulatory framework (e.g., [11,37,38,65,66]). A consequence of such developments is that the Netherlands has emerged as the world’s leading producer of sustainably sourced fruit and vegetables and—despite its small size—the second-largest exporter of agricultural goods worldwide, after the USA, with annual exports over US $100 billion (e.g., [67]).
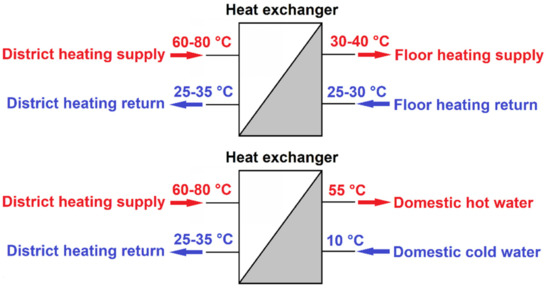
Figure 10.
Example of low temperatures in a district heating circuit interfaced via heat exchangers to underfloor heating and domestic hot water circuits. Modified after [68].
Nonetheless, temperature alone is not sufficient to guarantee the feasibility of a given geothermal application—thermal power output is also key. To heat a greenhouse, for example, the geofluid temperature should be between 60 and 80 °C (Figure 1), and the quantity of hot fluid required will depend on the optimum growing temperature for the selected crop (Table 5), the size of the greenhouse, and the lowest expected outside temperature [69]. For example, as reported by [69], the maximum thermal power required by a 28 m × 90 m greenhouse with a floor area of 2520 m2 and an internal volume of 8911 m3, a crop growing temperature of 28 °C and a minimum outside temperature of 4 °C, is 595 kW. Given this calculation and the thermal power values in Table 4, possible scenarios for the number of greenhouses of this design that could theoretically be powered by geothermal heat at the studied sites are listed in Table 6. From local meteorological data [70], daily air temperatures in the Wareham area average as ~4 °C in winter, but night-time minima average as ~2 °C, so the thermal power output required for a greenhouse of the stated design would exceed 595 kW, indicating a slightly lower maximum number of greenhouses of the stated size (below that listed in Table 6) or the stated number would apply to slightly smaller greenhouses; nonetheless, the approximate scale of the horticultural industry that might be sustainable from this source is apparent.
Table 5.
Growing temperatures for typical greenhouse crops [69].
Table 6.
Numbers of 595 kW greenhouses.
As a guide to the potential economic value of an industry of this type, one may consider the horticulture sector in the Canadian province of Alberta. Here, the combination of a harsh climate, limiting the crops that might be grown outdoors, and abundant supplies of natural gas has led to the development of an extensive horticultural sector using greenhouses. Significant crops thus produced, with typical annual revenue from sales per square metre of greenhouse area, include tomatoes (£55), peppers (£52), bedding plants (£89) and tree seedlings (£49) [71]. It has indeed been proposed that the high cost of fresh food in northerly parts of Canada, where crops cannot be grown outdoors, might be mitigated by utilising geothermally heated greenhouses; it has indeed been stated, for example, that tomatoes thus produced (using heat drawn from purpose-drilled wells, not repurposed wells) in the Canadian arctic might be bought by consumers for ~£2.50 per kilogramme [72], similar to the £2.10 typical retail price in the UK (for April 2020) [73]. At present, ~30% of the UK’s food supply, including 40% of vegetables and 37% of fruit, comes from other European Union (EU) countries [74]. It is generally accepted that if the UK does not negotiate a Trade Agreement with the EU before it leaves at the end of 2020, tariffs imposed on food imports will cause increases in food prices [74]. This is because, under World Trade Organisation rules, the UK will be required to impose the same tariffs on imports from EU countries as it does from other countries with whom it has no Trade Agreement. However, the effect this will have on prices of fruit and vegetables is currently unclear: estimates for fruit in the range 3% to 18% have been reported [74]. Such considerations, and the associated greater complexity of managing food imports and the potential risk of disruption of supply, might well favour the economics of domestic production of food crops in geothermally heated greenhouses, drawing on the present case studies (Table 4) as an exemplar.
A second potential use of the geothermal resource associated with the water co-produced by the hydrocarbon fields could be for heated residential or commercial swimming pools. According to [75], swimming pools have a preferred temperature of ~27 °C, although this can vary by up to 5 °C. When the geofluid cannot be used directly, as for this assessment (see above), a heat exchanger is necessary and the required geofluid temperature is ~15 °C above that of the pool water (e.g., 45 °C for 30 °C pool water). The case study reported by [76] can serve as an exemplar: an outdoor swimming pool with a public part of 455 m3 volume and a teaching part of 72.2 m3, required 4.25 kg s−1 of geofluid at 80 °C to maintain a desired pool temperature of 30.2 °C. With a lower geofluid temperature, but the same pool water volume and temperature, a greater flow rate would be required, according to the governing equation for heat exchangers at steady state:
where
- m1 = mass flow rate of pool water as the heat load (kg s−1);
- m2 = mass flow rate of geothermal water as the heat source (kg s−1);
- cp1 = specific heat capacity of pool water (J kg−1 °C−1);
- cp2 = specific heat capacity of geothermal water (J kg−1 °C−1);
- T1 = temperature of pool’s cold water before being heated by heat exchanger (°C);
- T2 = temperature of pool’s warm water after being heated by heat exchanger (°C);
- T3 = temperature of inlet geothermal water at heat exchanger (°C);
- T4 = temperature of outlet geothermal water at heat exchanger (°C);
- Q = thermal power required to heat the pool (W).
Neglecting any heat losses due to convection, evaporation, radiation, conduction, or rainfall, a reduction in geofluid temperature from 80 °C to the 65 °C at Wytch Farm would require an increased geofluid mass flow rate of 6.08 kg s−1. Given the predicted rates of water production for the oilfields under analysis, Table 7 summarises the numbers of swimming pools of the above characteristics that might theoretically be heated.
Table 7.
Numbers of swimming pools.
The above potential applications, horticulture and heated swimming pools, are only theoretical examples of notional uses of the geothermal potential of the Wessex Basin oilfields; other such application might be for breweries (‘fermentation’) or aquaculture (cf. Figure 1). More detailed calculations would be required to assess the technical and viability of each potential mode of use. A thorough economic analysis would also need to be carried out, taking into account existing operating costs to continue running the oilfield infrastructure (wholly or in part), the reducing revenues from the declining hydrocarbon production rates, and the costs and revenues of the incremental ‘green’ component. The required economic analysis would be much more complicated than that necessary for a project involving drilling of new wells solely for geothermal use (cf. [72]). Thus, although we note that sale of heat at commercially competitive rates might significantly increase the revenue for a combined hydrocarbon/geothermal project (using data for Wytch Farm; see above) over a hydrocarbon only project, we cannot at this stage demonstrate that the capital, operating and maintenance costs of the geothermal infrastructure would make such a project economic.
5.2. Comparisons with Other Geothermal Projects
The next consideration concerns how the heat resources available from the Wareham and Wytch Farm fields compare with those available for other low-temperature geothermal heat projects. We will make comparisons for both operational projects and potential projects. In the former case, values for both source temperature and thermal power output are usually readily available. In the latter case, source temperatures are known but the thermal power output has to be estimated. To provide a common basis for comparison for heat sources with a wide range of temperatures, in accordance with previous works (e.g., [34,77]) thermal power output for potential projects will be estimated using Equation (1) by equating ΔT to the difference between source temperature TO and annual mean ambient temperature TS, and are reported in Table 8. The resulting estimates of thermal power output are thus idealized upper bounds, which exceed those that might be calculated assuming a specific end use of the energy as in Table 6 and Table 7. The comparisons with existing projects in this section, also reported in Table 8, are, therefore, with peak outputs of heat, where reported, rather than with other measures such as annual mean outputs. It should also be noted that the datasets compiled in Table 8 are not of the same vintage and therefore do not account for the decline in pressure and temperature that affect some hydrocarbon reservoirs. Indeed, some of the production infrastructure for the North Sea fields listed has already been decommissioned.
Table 8.
Comparison of low-temperature geothermal sites.
Table 8 illustrates the results of this comparison, including the Wytch Farm and Wareham sites from this study and other potential low-temperature UK geothermal heat projects. This ‘potential’ category includes the three oilfields in the northern North Sea with the largest outputs of produced water, using data from [19], to demonstrate the very large heat outputs that would be possible from these installations if any local heat demand existed. Next are the potential sources of heat from Meerbrook Sough, a drainage adit created for historic lead mining in the Peak District uplands of north-central England, and the Kibblesworth mine dewatering scheme in northeast England, which remains in operation to keep the water table low to avoid surface pollution in the abandoned Durham coalfield. The potential value of both these heat sources was discussed by [77]. Next are the hypothetical minewater geothermal scheme at Polkemmet in central Scotland and the Glasgow Geothermal Energy Research Field Site (GGERFS), both as discussed by [78]. Nominal calculations have been provided for the Stockbridge and Welton oilfields, in addition to the analyses of the Wytch Farm and Wareham fields. The list of operational projects is headed by four examples of modern geothermal doublets in the Netherlands: Agriport, Trias Westland, and Vogelaer for horticulture; and the Leyweg scheme for district heating in The Hague. Next are minewater geothermal schemes, at Heerlen, Dannenbaum, Springhill, and Dawdon, the heat production well at Southampton in southern England, and example projects in the Paris Basin of central France (Issy-les-Moulineaux) and the Aquitaine Basin of SW France (Jonzac).
Results of this comparison are illustrated in Figure 11. It is thus evident, first, that the potential thermal power output available at Wytch Farm is large in comparison with other successful projects, as might be expected from the scale of outputs that might be powered from this field, as already discussed. Except for environmental issues, to be considered below, this field would be a very strong candidate for geothermal repurposing. These issues indicate that careful thought will be necessary to design suitable geothermal end uses for this site, such considerations being beyond the scope of this study. Second, as calculated in Table 8, geothermal repurposing of the Stockbridge and Welton oilfields might yield thermal power outputs of up to 638 and 251 kW. Calculated on the same basis, the remaining fields listed in Table 3 would have outputs of 133 (Palmer’s Wood), 114 (Cold Hanworth), 94 (Storrington), 68 (Singleton), 59 (West Firsby), and 45 kW (Whisby). The above outputs in the ~0.1–1 MW range are comparable in terms of thermal power with mid-scale minewater geothermal projects such as Dannenbaum and Springhill. However, these latter projects are managed as components of integrated energy systems for seasonal heating and cooling, including summer storage of waste heat, rather than solely for heat supply (e.g., [88,90,91,92]). It is difficult to see how this type of energy management might be combined with oil co-production. As already discussed, the low reservoir temperatures in these fields impose significant restrictions on end uses of heat following potential repurposing for geothermal heat production. Finally, two projects, the operational Dawdon minewater heat project and the GGERFS, stand out on account of their low (actual, or potential) thermal power outputs. The GGERFS is a test site for minewater geothermal heat production [94,95] and is not currently used for heat production or storage (hence its inclusion here as a ‘potential’ site), but has been strongly criticized [78] as some of its design features impose severe constraints on the potential heat output. Notable features are its shallow depth, <100 m, and resulting very low reservoir temperature, and its close spacing of candidate injection and production wells, <100 m to several hundred metres (e.g., [96,97]), which compare with horizontal scales of many hundreds of metres to kilometres and depths of hundreds of metres at other modern minewater geothermal projects such as Heerlen [82] and Dannenbaum [88]. From the point of view of achieving significant decarbonisation, the recent emphasis in the UK on these very small-scale projects [93,94,95] (and, in the case of the GGERFS, commitment of significant funding, the budget being £9 million [78]) seems unfortunate, when other much more promising geothermal heat sources are readily available.
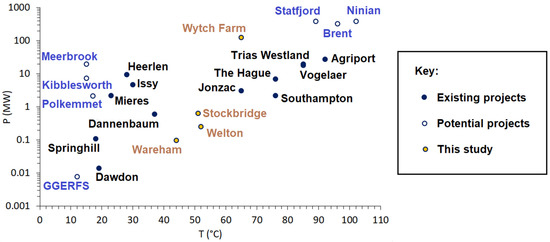
Figure 11.
Comparison of thermal output power, P, versus output temperature for the suite of low-temperature geothermal sites listed in Table 8. Note the logarithmic scale for power, which means that the difference in calculation procedure compared with that used for Table 6 and Table 7 has little effect on where projects plot.
5.3. Environmental Issues
Having addressed technical and economic aspects earlier, the final discussion point concerns environmental issues that bear on the feasibility of geothermal repurposing of the Wytch Farm and Wareham oilfield infrastructure. As Figure 6 shows, the Wytch Farm field is located within the Dorset Area of Outstanding Natural Beauty (AONB). An AONB is a form of protected landscape designation in the UK (excluding Scotland), created by parliament through the National Parks and Access to the Countryside Act 1949. The level of landscape protection provided in an AONB is the same as in a National Park; a key distinction is that a National Park authority makes planning decisions for its own designated area, whereas planning decisions within AONBs are made by the respective local authority, after consultation (for AONBs in England) with the government advisory agency Natural England. From 1974 to 31 March 2019, the authority responsible for local planning decisions (such as approval of the solar farms depicted in Figure 6) was Purbeck District Council. Concurrently, the higher-tier Dorset County Council had responsibility for ‘strategic’ planning, hence its involvement in approving 39 concurrent planning applications in 2016 to permit continued operation of the Wytch Farm field [57]. However, from 1 April 2019, a new Dorset unitary authority came into being, covering most of the historical area of Dorset and superseding the previous county and most of its districts, and is now responsible for both local and strategic planning decisions in the area.
The designation of the Dorset AONB reflects the geological, biological and historic heritage of the area. The Purbeck area (or ‘Isle of Purbeck’) straddles the southern margin of the Cenozoic Hampshire Basin. The landscape consists of low-lying heathland in the north, in areas of unlithified Eocene sands and clays, flanked to the south by the upland ‘Purbeck Ridge’ formed in an anticline where Cretaceous and Jurassic rocks are exposed. Its south coast forms the eastern part of the Dorset and East Devon Coast World Heritage Site, England’s only geological World Heritage Site [98], popularly known as the ‘Jurassic Coast’ [99]. The Upper Jurassic rocks exposed along this coastline not only create attractive scenery, they have also been of immense significance to the development of geoscience, having for example yielded fossil evidence that led to the earliest discoveries of dinosaurs [100,101]. In addition to these general designations, many smaller areas of land have separate status as nature reserves of various categories, some having high levels of statutory protection in their own right. Given its landscape and heritage, the Purbeck area is a major centre for tourism: Swanage is the principal resort; Studland and Corfe Castle, the two villages closest to the Wytch Farm gathering plant, are tourist ‘honeypots’.
The development of the Wytch Farm field took place after the Dorset AONB was created in 1959 and was carried out to high environmental standards reflecting the value of the landscape [53] (Figure 12). The planning guidelines for AONBs state that “particular regard should be paid to promoting sustainable forms of social and economic development that in themselves conserve and enhance the environment” [58]. Providing geothermal heat is clearly a form of sustainable development, but whether any project receives planning permission will depend on whether it is deemed to achieve a favourable balance between the benefit of providing low-carbon heat and the downside of environmental impact. Regarding this balance, it is notable (Figure 6) that solar photovoltaic farms (some covering >10 hectares of land) have been extensively developed on relatively unproductive farmland within the Eocene outcrop of the Hampshire Basin outside the Dorset AONB, yet none has been developed within the AONB itself. This AONB is thus effectively ‘encircled’ by solar farms, in a matter that resembles how, as a result of similar planning considerations, AONBs and National Parks in upland parts of Britain have become ‘fenced in’ by wind farms (e.g., [102]). Trying to draw inferences for the future from past planning decisions in this area is potentially problematic, because of the recent creation of the new Dorset unitary local authority. Experience elsewhere, for example in the historic City of Durham in northeast England (another World Heritage Site [103]), where the former local authority was merged into a new unitary authority in 2009, has resulted in a tendency for insensitive development plans (e.g., [104]). The reason appears to be because planning decisions are henceforth taken by councillors who, being not local, are more likely to favour economic development over conservation. Nonetheless, it seems clear that a planning application for, say, a complex of geothermally heated greenhouses in the sensitive landscape adjoining the Wytch Farm gathering station (Figure 12) would have little chance of success.
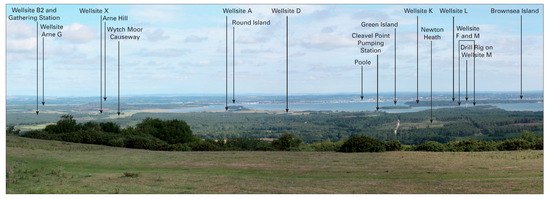
Figure 12.
View looking northward from Ailwood Down (circa BNG reference SY 99562 81558; see Figure 6 for location), part of the steeply north-dipping monoclinal ridge in Upper Cretaceous Chalk, which forms the southern margin of the Hampshire Basin. This monocline was formed during the Cenozoic as a result of reverse-slip reactivation of a south-dipping Mesozoic normal fault (e.g., [61]). This panoramic view (from [54]) shows Wytch Farm oilfield sites hidden in the landscape of coniferous forest and heathland characteristic of the Hampshire Basin interior. The Wytch Farm gathering station (Figure 6) occupies a ~8 hectare site in the forest, in the locality marked near the western edge of this view, but is not visible in this photo. This oilfield won The Queen’s Award for Environmental Achievement in 1995 and remains largely unnoticed by the general public, as the planners had hoped. Further details of the structural geology, petroleum geology, and environmental setting of this oilfield are provided by [105].
The Wareham well sites are located just outside the AONB (Figure 6), so geothermal projects exploiting heat from the produced geofluid there would encounter fewer planning issues. However, as already noted, the potential end uses of the heat available at this site are severely limited, as a result of both the low temperature and the low production rate (see above). In principle, a solution to deal with the sensitivity of the area surrounding the Wytch Farm gathering plant might be to install a highly insulated pipe to transport hot water, in a ‘clean’ loop after a heat exchanger, to Wareham or another locality with potential heat demand. A solution analogous to this has been implemented for the Rittershoffen geothermal project in eastern France to provide industrial process heat for a biotechnology plant in Beinheim, ~15 km away (e.g., [106,107]). This ~€55 million project draws hot fluid above 160 °C from a depth of ~2600 m. The clean pipe loop, costing ~€15 million, provides a thermal power output of ~25 MW and a flow rate of ~70 L s−1 with a temperature drop of only a few °C. The current water production rate at the Wytch Farm gathering plant is ~327,000 bpd (Figure 7) or ~600 L s−1, so any highly insulated ‘clean’ pipe loop leading from it would have to be wider than that at Rittershoffen, thus potentially costing more than the ~€0.5 million per kilometre typical there. This high overhead cost might well make this option unviable. Nonetheless, setting this issue aside, a potential end use for the heat from the Wytch Farm gathering plant, transported via a network of pipe loops, might be to provide heat for amenities (such as swimming pools; cf. Table 7) in hotels in the nearby resort town of Swanage and neighbouring villages (Figure 6).
6. Conclusions
We have carried out a systematic screening analysis of the dataset of onshore hydrocarbon wells in the UK to determine the most suitable candidate sites for geothermal repurposing. A GIS mapping model has been generated, integrating data provided by the UK Oil and Gas Authority. Of the 2242 onshore hydrocarbon wells thus reported, 560 are recognised as having potential for repurposing, 292 of which are currently operating. The results of this analysis identify the ten oilfields with greatest potential for geothermal repurposing (Table 3), the four most suitable candidates being Wytch Farm, Stockbridge and Wareham in the Wessex Basin and Welton in the East Midlands Basin (Figure 2). Detailed investigations of the potential heat output that might be obtained by co-production of oil and heat during the remaining field life have been carried out for the Wytch Farm and Wareham fields using Decline Curve Analysis (Figure 7 and Figure 8) and demonstrate that the available heat outputs can add significant value to these fields. Notwithstanding the current regulatory hurdles to the repurposing of any UK hydrocarbon well, uses for the resulting geothermal heat that are technically feasible have been established (Table 6 and Table 7). Comparisons with operational geothermal projects (Figure 11) confirm that each of the investigated fields has the potential for sufficient thermal power outputs at high enough temperatures to be of practical use, although some potential uses would not be feasible during co-production of oil. From a technical and economic point of view, the Wytch Farm field, the largest onshore oilfield in western Europe, producing water at ~65 °C, has especially great geothermal potential. However, its location in a highly protected landscape (an Area of Outstanding Natural Beauty; Figure 6 and Figure 12) limits the options for geothermal repurposing, excluding some possibilities such as greenhouses for growing high-value crops, which would otherwise be feasible. Other potential end uses of its heat at distances of several kilometres can be identified, involving the supply of heat to hotels in this tourist area for amenities such as swimming pools, but the cost of transporting the heat to these locations might be prohibitive and requires further investigation. Nonetheless, the recognition of a potential geothermal heat output of ~90 MW at Wytch Farm, and hundreds of kilowatts at the Stockbridge and Welton fields, indicates a promising set of targets for more detailed assessment. It indeed reveals onshore oilfields to be much more valuable, from the point of view of the decarbonisation of UK energy use, than the minewater geothermal projects with ~10 kW potential outputs that have been the focus of much recent effort and funding.
Author Contributions
Conceptualisation, G.F.; methodology, G.F.; software, S.M.W. and G.F.; formal analysis, S.M.W. and G.F.; data curation, S.M.W.; writing—original draft preparation, S.M.W.; writing—review and editing, S.M.W., G.F. and R.W.; supervision, G.F. and R.W.; project administration, G.F.; funding acquisition, G.F. and R.W. All authors have read and agreed to the published version of the manuscript.
Funding
This research and the APC were funded by UK Research and Innovation through EPSRC-CESI grant number FFC1-024.
Acknowledgments
We thank the industrial partners in this project, Perenco UK Limited and Schlumberger Cambridge Research Limited, for providing data, advice and guidance. We also thank all three anonymous reviewers for their thoughtful and constructive comments.
Conflicts of Interest
We declare that no conflict of interest exists.
References
- Younger, P.L. Missing a trick in geothermal exploration. Nat. Geosci. 2014, 7, 479–480. [Google Scholar] [CrossRef]
- Gluyas, J.G.; Adams, C.A.; Busby, J.P.; Craig, J.; Hirst, C.; Manning, D.A.C.; McCay, A.; Narayan, N.S.; Robinson, H.L.; Watson, S.M.; et al. Keeping warm: A review of deep geothermal potential of the UK. Proc. Inst. Mech. Eng. Part A J. Power Energy 2018, 232, 115–126. [Google Scholar] [CrossRef]
- Feliks, M.E.J.; Elliott, T.P.; Day, G.D.; Percy, G.D.; Younger, P.L. Direct use of low enthalpy deep geothermal resources in the East African Rift Valley. In Proceedings of the World Geothermal Congress 2015, Melbourne, Australia, 19–25 April 2015; Available online: https://www.geothermal-energy.org/pdf/IGAstandard/WGC/2015/28032.pdf (accessed on 27 June 2020).
- Sbrana, A.; Marianelli, P.; Pasquini, G.; Costantini, P.; Palmieri, F.; Ciani, V.; Sbrana, M. The integration of 3D modeling and simulation to determine the energy potential of low-temperature geothermal systems in the Pisa (Italy) sedimentary plain. Energies 2018, 11, 1591. [Google Scholar] [CrossRef]
- Rybach, L. Geothermal power growth 1995–2013: A comparison with other renewables. Energies 2014, 7, 4802–4812. [Google Scholar] [CrossRef]
- Younger, P.L. Geothermal energy: Delivering on the global potential. Energies 2015, 8, 11737–11754. [Google Scholar] [CrossRef]
- Colmenar-Santos, A.; Palomo-Torrejón, E.; Rosales-Asensio, E.; Borge-Diez, D. Measures to remove geothermal energy barriers in the European Union. Energies 2018, 11, 3202. [Google Scholar] [CrossRef]
- Bell, M.; Gault, A.; Thompson, M.; Hill, J.; Joffe, D. Next Steps for UK Heat Policy; Committee on Climate Change: London, UK, 2016; Available online: https://www.theccc.org.uk/publication/next-steps-for-uk-heat-policy/ (accessed on 24 May 2020).
- BEIS. Energy Consumption in the UK (ECUK); Department for Business, Energy and Industrial Strategy: London, UK, 2019. Available online: https://www.gov.uk/government/statistics/energy-consumption-in-the-uk (accessed on 24 May 2020).
- Provoost, M.; Albeda, L.; Godschalk, B.; van der Werff, B.; Schoof, F. Geothermal energy use, country update for The Netherlands. In Proceedings of the European Geothermal Congress 2019, The Hague, The Netherlands, 11–14 June 2019; Available online: http://europeangeothermalcongress.eu/wp-content/uploads/2019/07/CUR-19-Netherlands.pdf (accessed on 25 June 2020).
- Mijnlieff, H.F. Introduction to the geothermal play and reservoir geology of the Netherlands. Neth. J. Geosci. 2020, 99, e2. [Google Scholar] [CrossRef]
- Gluyas, J.G.; Auld, A.; Adams, C.; Hirst, C.M.; Hogg, S.; Craig, J. Geothermal potential of the global oil industry. In Renewable Geothermal Energy Explorations; Ismail, B.I., Ed.; InTechOpen: London, UK, 2018. [Google Scholar] [CrossRef]
- RenewableUK. Wind Energy Statistics; RenewableUK: London, UK; Available online: https://www.renewableuk.com/page/UKWEDhome (accessed on 25 June 2020).
- PM’s Office. The Queen’s Speech 2019; Prime Minister’s Office: London, UK. Available online: https://assets.publishing.service.gov.uk/government/uploads/system/uploads/attachment_data/file/853886/Queen_s_Speech_December_2019_-_background_briefing_notes.pdf (accessed on 25 June 2020).
- Li, G. World Atlas of Oil and Gas Basins; Wiley-Blackwell: Oxford, UK, 2011; p. 496. [Google Scholar]
- EIA. U.S. Oil and Natural Gas Wells by Production Rate; U.S. Energy Information Administration: Washington, DC, USA, 2019. Available online: https://www.eia.gov/petroleum/wells/ (accessed on 25 June 2020).
- Kaczmarczyk, M.; Tomaszewska, B.; Operacz, A. Sustainable utilization of low enthalpy geothermal resources to electricity generation through a cascade system. Energies 2020, 13, 2495. [Google Scholar] [CrossRef]
- Alimonti, C.; Falcone, G.; Liu, X. Potential for harnessing the heat from a mature high-pressure-high-temperature oil field in Italy. In Proceedings of the 2014 SPE Annual Technical Conference and Exhibition, Amsterdam, The Netherlands, 27–29 October 2014. [Google Scholar] [CrossRef]
- Auld, A.; Hogg, S.; Berson, A.; Gluyas, J. Power production via North Sea Hot Brines. Energy 2014, 78, 674–684. [Google Scholar] [CrossRef]
- AL-Mahrouqi, J.; Falcone, G. An expanded matrix to scope the technical and economic feasibility of waste heat recovery from mature hydrocarbon fields. In Proceedings of the 41st Workshop on Geothermal Reservoir Engineering, Stanford University, Stanford, CA, USA, 22–24 February 2016; Available online: https://pangea.stanford.edu/ERE/pdf/IGAstandard/SGW/2016/Almahrouqi.pdf (accessed on 25 June 2020).
- Westaway, R. Repurposing of disused shale gas wells for subsurface heat storage: Preliminary analysis concerning UK issues. Q. J. Eng. Geol. Hydrogeol. 2016, 49, 213–227. [Google Scholar] [CrossRef]
- Singh, H.; Falcone, G.; Volle, A.; Guillon, L. Harnessing geothermal energy from mature onshore oil fields, The Wytch Farm case study. In Proceedings of the 42nd Workshop on Geothermal Reservoir Engineering, Stanford University, Stanford, CA, USA, 13–15 February 2017; Available online: https://pangea.stanford.edu/ERE/pdf/IGAstandard/SGW/2017/Singh.pdf (accessed on 25 June 2020).
- Gluyas, J.G.; Mathias, S.; Goudarzi, S. North Sea/next life: Extending the commercial life of producing North Sea fields. In Proceedings of the Petroleum Geology of NW Europe: 50 Years of Learning, Proceedings of the 8th Petroleum Geology Conference, London, UK, 28 September 2015; Levell, B., Bowman, M., Eds.; Geological Society of London: London, UK, 2018; Volume 8, pp. 561–570. [Google Scholar] [CrossRef]
- Liu, X.; Falcone, G.; Alimonti, C. A systematic study of harnessing low-temperature geothermal energy from oil and gas reservoirs. Energy 2018, 142, 346–355. [Google Scholar] [CrossRef]
- Lefort, P.L. Geothermal Potential of Offshore Mature Hydrocarbon Fields. Master’s Thesis, Cranfield University, Bedford, UK, 2016. [Google Scholar]
- Hirst, C.M.; Gluyas, J.G. The geothermal potential held within Carboniferous sediments of the East Midlands: A new estimation based on oilfield data. In Proceedings of the World Geothermal Congress 2015, Melbourne, Australia, 19–25 April 2015; Available online: https://www.geothermal-energy.org/pdf/IGAstandard/WGC/2015/16079.pdf (accessed on 25 June 2020).
- Hirst, C.M.; Gluyas, J.G.; Mathias, S.A. The late field life of the East Midlands Petroleum Province: A new geothermal prospect? Q. J. Eng. Geol. Hydrogeol. 2015, 48, 104–114. [Google Scholar] [CrossRef]
- Davies, R.J.; Almond, S.; Ward, R.; Jackson, R.; Adams, C.; Worrall, F.; Herringshaw, L.G.; Gluyas, J.G.; Whitehead, M.A. Oil wells and their integrity: Implications for shale and unconventional resource exploitation. Mar. Petrol. Geol. 2014, 56, 239–254. [Google Scholar] [CrossRef]
- OGA. OGA Onshore Wells BNG; Oil and Gas Authority: Aberdeen, UK, 2020; Available online: https://data-ogauthority.opendata.arcgis.com/datasets/oga-onshore-wells-bng (accessed on 24 May 2020).
- Narayan, N.; Gluyas, J.G.; Adams, C. Is the UK in hot water? Geoscientist 2018, 28, 10–15. [Google Scholar] [CrossRef]
- van der Molen, J.; Peters, E.; Jedari-Eyvazi, F.; van Gessel, S.F. Dual hydrocarbon–geothermal energy exploitation: Potential synergy between the production of natural gas and warm water from the subsurface. Neth. J. Geosci. 2020, 98, e12. [Google Scholar] [CrossRef]
- Alimonti, C.; Soldo, E.; Bocchetti, D.; Berardi, D. The wellbore heat exchangers: A technical review. Renew. Energy 2018, 123, 353–381. [Google Scholar] [CrossRef]
- Falcone, G.; Liu, X.; Okech, R.R.; Seyidov, F.; Teodoriu, C. Assessment of deep geothermal energy exploitation methods: The need for novel single-well solutions. Energy 2018, 160, 54–63. [Google Scholar] [CrossRef]
- Westaway, R. Deep Geothermal Single Well heat production: Critical appraisal under UK conditions. Q. J. Eng. Geol. Hydrogeol. 2018, 51, 424–449. [Google Scholar] [CrossRef]
- Westaway, R.; Watson, S.; Williams, A.; Harley, T.; Middlemiss, R. Geometry of the Butterknowle Fault at Bishop Auckland (County Durham, UK) from gravity survey and structural inversion. Earth Space Sci. Open Arch. 2019, 10501104, 2019. [Google Scholar] [CrossRef]
- ThermoGIS Geothermal Mapping. Available online: https://www.thermogis.nl/ (accessed on 25 June 2020).
- Van Wees, J.D.; Kronimus, A.; Van Putten, M.; Pluymaekers, M.; Mijnlieff, H.; Van Hoof, P.; Obdam, A.; Kramers, L. Geothermal aquifer performance assessment for direct heat production—Methodology and application to Rotliegend aquifers. Neth. J. Geosci. 2012, 91, 651–665. [Google Scholar] [CrossRef]
- Vrijlandt, M.A.W.; Struijk, E.L.M.; Brunner, L.G.; Veldkamp, J.G.; Witmans, N.; Maljers, D.; van Wees, J.D. ThermoGIS update: A renewed view on geothermal potential in The Netherlands. In Proceedings of the European Geothermal Congress, The Hague, The Netherlands, 11–14 June 2019; Available online: http://europeangeothermalcongress.eu/wp-content/uploads/2019/07/226.pdf (accessed on 25 June 2020).
- GeotIS Geothermal Information System. Available online: https://www.geotis.de/geotisapp/geotis.php (accessed on 25 June 2020).
- Agemar, T.; Alten, J.; Ganz, B.; Kuder, J.; Kuehne, K.; Schumacher, S.; Schulz, R. The Geothermal Information System for Germany—GeotIS. Ger. J. Geosci. 2014, 165, 129–144. [Google Scholar] [CrossRef]
- UNECE. UNFC and Sustainable Resource Management; United Nations Economic Commission for Europe: Geneva, Switzerland, 2020; Available online: https://www.unece.org/energy/se/reserves.html (accessed on 25 June 2020).
- Downing, R.A.; Gray, D.A. Geothermal Energy—the Potential in the United Kingdom; Her Majesty’s Stationery Office: London, UK, 1986. [Google Scholar]
- Watson, S.M.; Falcone, G.; Westaway, R. Repurposing hydrocarbon wells for geothermal use in the UK: A preliminary resource assessment. In Proceedings of the World Geothermal Congress, Reykjavik, Iceland, 26 April–2 May 2020; Available online: https://pangea.stanford.edu/ERE/db/WGC/papers/WGC/2020/16024.pdf (accessed on 25 June 2020).
- OGA. Petroleum Production Reporting System; Oil and Gas Authority: Aberdeen, UK, 2019; Available online: https://www.ogauthority.co.uk/media/5572/oga-pprs-help-guide-v5-april-2019.pdf (accessed on 25 June 2020).
- OGA. Guidance for Applications for Suspension of Inactive Wells; Oil and Gas Authority: Aberdeen, UK, 2018; Available online: https://www.ogauthority.co.uk/media/5108/oga-suspended-wells-guidance.pdf (accessed on 24 May 2020).
- OFGEM. Non-Domestic Renewable Heat Incentive (RHI); Office of Gas and Electricity Markets: London, UK, 2020. Available online: https://www.ofgem.gov.uk/environmental-programmes/non-domestic-rhi (accessed on 25 June 2020).
- Lowes, R.; Woodman, B.; Fitch-Roy, O. Policy change, power and the development of Great Britain’s renewable heat incentive. Energy Policy 2019, 131, 410–421. [Google Scholar] [CrossRef]
- Evans, S. Does the UK’s Biomass Burning Help Solve Climate Change? Carbon Brief Ltd.: London, UK, 11 May 2015; Available online: https://www.carbonbrief.org/investigation-does-the-uks-biomass-burning-help-solve-climate-change (accessed on 25 June 2020).
- BEIS. RHI Monthly Deployment Data: March 2020 (Quarterly Edition); Department for Business, Energy & Industrial Strategy: London, UK, 2020. Available online: https://www.gov.uk/government/statistics/rhi-monthly-deployment-data-march-2020-quarterly-edition (accessed on 25 June 2020).
- OFGEM. Non-Domestic Renewable Heat Incentive. Guidance Volume 1: Eligibility and How to Apply; Office of Gas and Electricity Markets: London, UK, 2020. Available online: https://www.ofgem.gov.uk/system/files/docs/2020/04/non-domestic_rhi_guidance_volume_one.pdf (accessed on 25 June 2020).
- Busby, J.; Kingdon, A.; Williams, J. The measured shallow temperature field in Britain. Q. J. Eng. Geol. Hydrogeol. 2011, 44, 373–387. [Google Scholar] [CrossRef]
- Westaway, R.; Younger, P.L. Accounting for palaeoclimate and topography: A rigorous approach to correction of the British geothermal dataset. Geothermics 2013, 48, 31–51. [Google Scholar] [CrossRef]
- Thornton, W. Wytch Farm ploughs ahead. GEO ExPro 2013, 10, 54–56. Available online: https://www.geoexpro.com/articles/2014/02/wytch-farm-ploughs-ahead (accessed on 8 June 2020).
- Perenco UK. Town and Country Planning Act 1990, Section 73, Applications to Extend the Operational Life of the Wytch Farm, Wareham and Kimmeridge Oilfields through the Variation of Existing Planning Conditions, Environmental Statement, Non-Technical Summary August 2012; Perenco UK Limited: London, UK, 2012; Available online: https://www.iema.net/assets/nts/Nicholas_Pearson_Associates/Wytch_Farm_Wareham_and_Kimmeridge_NTS_August_2012.pdf (accessed on 8 June 2020).
- Gluyas, J.G.; Evans, I.J.; Richards, D. The Kimmeridge Bay oilfield, Dorset, UK Onshore. In United Kingdom Oil and Gas Fields; Gluyas, J.G., Hichens, H.M., Eds.; Geological Society of London: London, UK, 2003; pp. 943–948. [Google Scholar] [CrossRef]
- OGA. Relinquishment Document, Licence P1022 (Block 98/11); Oil and Gas Authority: Aberdeen, UK, 2009; Available online: https://itportal.ogauthority.co.uk/web_files/relinqs/p1022.pdf (accessed on 25 June 2020).
- DCC. Wytch Farm, Wareham and Kimmeridge Oilfields; Agenda, Regulatory Committee/Cabinet, 15 and 28 September 2016; Dorset County Council: Dorchester, UK. Available online: http://moderngov.dorsetcouncil.gov.uk/Data/277/201609151000/Agenda/Wytch%20Farm,%20Wareham%20and%20Kimmeridge%20Oilfields.pdf (accessed on 25 June 2020).
- DAONB. Management Plan 2019–2024; Dorset Area of Outstanding Natural Beauty: Dorchester, UK, 2018; Available online: https://www.dorsetaonb.org.uk/wp-content/uploads/2019/04/DAONB_Managmentplan.pdf (accessed on 25 June 2020).
- UK Electricity Production. Available online: https://electricityproduction.uk/plant/map/ (accessed on 25 June 2020).
- Arps, J.J. Analysis of decline Curves. Soc. Pet. Eng. 1945, 160, 228–247. [Google Scholar] [CrossRef]
- Worden, R.H.; Manning, D.A.C.; Bottrell, S.H. Multiple generations of high salinity formation water in the Triassic Sherwood Sandstone: Wytch Farm oilfield, onshore UK. App. Geochem. 2006, 21, 455–475. [Google Scholar] [CrossRef]
- CSGNetwork. Water Density Calculator; Computer Support Group, Inc.: Palm Springs, CA, USA, 2011; Available online: http://www.csgnetwork.com/h2odenscalc.html (accessed on 25 June 2020).
- Engineering ToolBox: Sodium Chloride and Water. Available online: https://www.engineeringtoolbox.com/sodium-chloride-water-d_1187.html (accessed on 25 June 2020).
- van’t Ooster, A.; van Henten, E.J.; Janssen, E.G.O.N.; Bot, G.P.A.; Dekker, E. Development of concepts for a zero-fossil-energy greenhouse. Acta Hortic. 2008, 801, 725–732. [Google Scholar] [CrossRef]
- Schoof, F.; van der Hout, M.; van Zanten, J.; van Hoogstraten, J.W. Master Plan Geothermal Energy in the Netherlands; Stichting Platform Geothermie: Delft, The Netherlands, 2018; Available online: https://geothermie.nl/images/bestanden/Masterplan_Aardwarmte_in_Nederland_ENG.pdf (accessed on 25 June 2020).
- Jharap, G.; van Leeuwen, L.; Mout, R.; van der Zee, W.; Roos, F.; Muntendam-Bos, A. Ensuring safe growth of the geothermal energy sector in the Netherlands by proactively addressing risks and hazards. Neth. J. Geosci. 2020, 99, e6. [Google Scholar] [CrossRef]
- WEF. These Dutch tomatoes can teach the world about sustainable agriculture. In Proceedings of the World Economic Forum, Cologny, Switzerland, 22–25 January 2019; Available online: https://www.weforum.org/agenda/2019/11/netherlands-dutch-farming-agriculture-sustainable/ (accessed on 25 June 2020).
- Ramboll. Design Overview for District Energy, Activity 1.5: Energy Technologies and District Energy Designs; Ramboll Energy: Copenhagen, Denmark, 2015. Available online: https://www.stpaul.gov/DocumentCenter/Government/Planning%20&%20Economic%20Development/Planning/Ford%20Site%20A%2021st%20Century%20Community/Energy%20Technologies%20and%20DE%20designs%20-%20DRAFT%201-21-15_201501251419146962.pdf (accessed on 25 June 2020).
- Thain, I.; Reyes, A.G.; Hunt, T.A. Practical Guide to Exploiting Low Temperature Geothermal Resources; GNS Science Report 2006/09; Institute of Geological and Nuclear Sciences Ltd.: Lower Hutt, New Zealand, 2006; Available online: http://shop.gns.cri.nz/sr_2006-009-pdf/ (accessed on 25 June 2020).
- Wareham Climate (United Kingdom). Available online: https://en.climate-data.org/europe/united-kingdom/england/wareham-6851/ (accessed on 25 June 2020).
- Laate, E.A. Economics of Production and Marketing Greenhouse Crops in Alberta; Alberta Agriculture and Forestry, Government of Alberta: Edmonton, AB, Canada, 2018. Available online: https://www1.agric.gov.ab.ca/$Department/deptdocs.nsf/all/econ16749/$FILE/2017GreenhouseCOP.pdf (accessed on 25 June 2020).
- Kinney, K.; Dehghani-Sanij, A.; Mahbaz, S.B.; Dusseault, M.B.; Nathwani, J.S.; Fraser, R.A. Geothermal energy for sustainable food production in Canada’s remote Northern Communities. Energies 2019, 12, 4058. [Google Scholar] [CrossRef]
- ONS. RPI: Ave Price—Tomatoes, per Kg; Office for National Statistics: London, UK, 2020. Available online: https://www.ons.gov.uk/economy/inflationandpriceindices/timeseries/cznj/mm23 (accessed on 25 June 2020).
- House of Lords. Brexit: Food Prices and Availability; House of Lords European Union Committee, 14th Report of Session 2017—2019; House of Lords: London, UK, 2018; Available online: https://publications.parliament.uk/pa/ld201719/ldselect/ldeucom/129/129.pdf (accessed on 25 June 2020).
- Chiasson, A. Direct use of geothermal energy. In Handbook of Clean Energy Systems, vol. 1: Renewable Energy; Yan, J., Ed.; John Wiley & Sons: Hoboken, NJ, USA, 2015; pp. 621–633. [Google Scholar]
- Nasrabadi, S.J.J. Open Heat Exchanger for Improved Energy Efficiency in the Heating of Hot Spas. Master’s Thesis, United Nations University Geothermal Training Programme, Reykjavík, Iceland, 2008. [Google Scholar]
- Westaway, R.; Younger, P.L. Unravelling the relative contributions of climate change and ground disturbance to subsurface temperature perturbations: Case studies from Tyneside, UK. Geothermics 2016, 64, 490–515. [Google Scholar] [CrossRef]
- Watson, S.M.; Westaway, R. Borehole temperature log from the Glasgow Geothermal Energy Research Field Site: A record of past changes to ground surface temperature caused by urban development. Scott. J. Geol. 2020, sjg2019-033. [Google Scholar] [CrossRef]
- Platform Geothermie. Agriport A7; Platform Geothermie: Delft, The Netherlands, 2017; Available online: https://geothermie.nl/index.php/nl/geothermie-aardwarmte/geothermie-in-nederland/projectoverzicht/50-agriport-a7 (accessed on 25 June 2020).
- Trias Westland. Trias Westland: Feiten op een rij; Trias Westland: Naaldwijk, The Netherlands; Available online: http://www.triaswestland.nl/nieuws/trias-westland-feiten-op-een-rij (accessed on 25 June 2020).
- Platform Geothermie. Aardwarmte Vogelaer; Platform Geothermie: Delft, The Netherlands, 2017; Available online: https://geothermie.nl/index.php/nl/geothermie-aardwarmte/geothermie-in-nederland/projectoverzicht/55-aardwarmte-vogelaer (accessed on 25 June 2020).
- Verhoeven, R.; Willems, E.; Harcouët-Menou, V.; De Boever, E.; Hiddes, L.; Op’t Veld, P.; Demollin, E. Minewater 2.0 project in Heerlen, The Netherlands: Transformation of a geothermal mine water pilot project into a full scale hybrid sustainable energy infrastructure for heating and cooling. Energy Procedia 2014, 46, 58–67. [Google Scholar] [CrossRef]
- Platform Geothermie. Haagse Aardwarmte Leyweg (HAL); Platform Geothermie: Delft, The Netherlands, 2017. Available online: https://geothermie.nl/index.php/nl/geothermie-aardwarmte/geothermie-in-nederland/projectoverzicht/45-haagse-aardwarmte-leyweg (accessed on 25 June 2020).
- Loredo, C.; Ordóñez, A.; Garcia-Ordiales, E.; Álvarez, R.; Roqueñi, N.; Cienfuegos, P.; Peña, A.; Burnside, N.M. Hydrochemical characterization of a mine water geothermal energy resource in NW Spain. Sci. Total Environ. 2017, 576, 59–69. [Google Scholar] [CrossRef]
- GRC. Spain: 2.2 MWth Geothermal District Heating Network from Abandoned Coal Mine Wins European Award; Geothermal Resources Council: Davis, CA, USA; Available online: http://geothermalresourcescouncil.blogspot.com/2019/10/spain-geothermal.html (accessed on 25 June 2020).
- Boissavy, C.; Grière, O. New geothermal targets in the Paris Basin (France). GRC Trans. 2014, 38, 577–582. Available online: http://pubs.geothermal-library.org/lib/grc/1033591.pdf (accessed on 25 June 2020).
- Boissavy, C.; Henry, L.; Genter, A.; Pomart, A.; Rocher, P.; Schmidlé-Bloch, V. Geothermal energy use, country update for France. In Proceedings of the European Geothermal Congress 2019, The Hague, The Netherlands, 11–14 June 2019; Available online: http://europeangeothermalcongress.eu/wp-content/uploads/2019/07/CUR-11-France.pdf (accessed on 25 June 2020).
- Bussmann, G.; Appelhans, K.; Hahn, F.; Jagert, F.; Bracke, R.; Seidel, T.; König, C. Reutilization of mine water for heating and cooling in the abandoned colliery Dannenbaum in Bochum. In Proceedings of the European Geothermal Congress 2019, The Hague, The Netherlands, 11–14 June 2019; Available online: http://europeangeothermalcongress.eu/wp-content/uploads/2019/07/71.pdf (accessed on 25 June 2020).
- Ungemach, P. Geothermal research in the European community: Objectives and reality. In Advances in European Geothermal Research, Proceedings of the Second International Seminar on the Results of EC Geothermal Energy Research, Strasbourg, France, 4–6 March 1980; Strub, A.S., Ungemach, P., Eds.; Springer: Berlin, Germany, 1980; pp. 9–36. [Google Scholar]
- CADDET. Geothermal Mine Water as an Energy Source for Heat Pumps; Report 122; Center for the Analysis and Dissemination of Demonstrated Energy: Sittard, The Netherlands, 1992; Available online: https://www.nrcan.gc.ca/sites/oee.nrcan.gc.ca/files/pdf/publications/infosource/pub/ici/caddet/english/pdf/R122.pdf (accessed on 25 June 2020).
- Jessop, A.M.; MacDonald, J.K.; Spence, R. Clean energy from abandoned mines at Springhill, Nova Scotia. Energy Sources 1995, 17, 93–106. [Google Scholar] [CrossRef]
- Jessop, A.M. Geothermal energy from old mines at Springhill, Nova Scotia, Canada. In Proceedings of the World Geothermal Congress 1995, Florence, Italy, 18–31 May 1995; Barbier, E., Ed.; International Geothermal Association: Auckland, New Zealand, 1995; pp. 464–468. Available online: https://www.geothermal-energy.org/pdf/IGAstandard/WGC/1995/1-jessop2.pdf (accessed on 25 June 2020).
- Satterley, C.J.; Chamberlain, S.; Broughton, P. Integration of heat recovery and renewables within a mine water treatment scheme: A UK case study. In Mine Water and Circular Economy, Proceedings of the 13th International Mine Water Association Congress, Lappeenranta, Finland, 25–30 June 2017; Wolkersdorfer, C., Sartz, L., Sillanpää, M., Häkkinen, A., Eds.; pp. 907–914. Available online: http://www.imwa.info/docs/imwa_2017/IMWA2017_Satterley_907.pdf (accessed on 25 June 2020).
- Monaghan, A.A.; Ó Dochartaigh, B.É.; Fordyce, F.; Loveless, S.; Entwisle, D.; Quinn, M.; Smith, K.; Ellen, R.; Arkley, S.; Kearsey, T.; et al. UKGEOS—Glasgow Geothermal Energy Research Field Site (GGERFS): Initial Summary of the Geological Platform; Open Report OR/17/006; British Geological Survey: Nottingham, UK, 2017; Available online: http://nora.nerc.ac.uk/id/eprint/518636/13/OR17006.pdf (accessed on 25 June 2020).
- Monaghan, A.A.; Starcher, V.; Ó Dochartaigh, B.É.; Shorter, K.; Burkin, J. UK Geoenergy Observatories: Glasgow Geothermal Energy Research Field Site Science Infrastructure; Open Report OR/18/037; British Geological Survey: Nottingham, UK, 2018; Available online: http://nora.nerc.ac.uk/id/eprint/521444/1/OR_18_037_GGERFS_Science_infrastructure_reportv8.pdf (accessed on 25 June 2020).
- Stephenson, M. Final Design; Natural Environment Research Council: Swindon, UK, 2018; Available online: https://nerc.ukri.org/funding/available/capital/ukgeos/communityevent/final-design-stephenson/ (accessed on 25 June 2020).
- Adams, C.; Monaghan, A.; Gluyas, J. Mining for heat. Geoscientist 2019, 29, 10–15. [Google Scholar] [CrossRef]
- UNESCO. Dorset and East. Devon Coast; United Nations Educational, Scientific and Cultural Organization: Paris, France, 2020; Available online: https://whc.unesco.org/en/list/1029 (accessed on 25 June 2020).
- Jurassic Coast Trust. Protecting 185 Million Years of History; Jurassic Coast Trust: Bridport, UK, 2020; Available online: https://jurassiccoast.org/ (accessed on 25 June 2020).
- Forde, H.A. The Heroine of Lyme Regis: The Story of Mary Anning the Celebrated Geologist; Wells Gardner & Co.: London, UK, 1925. [Google Scholar]
- Torrens, H. Presidential address: Mary Anning (1799–1847) of Lyme; ’The greatest fossilist the world ever knew’. Br. J. Hist. Sci. 1995, 28, 257–284. [Google Scholar] [CrossRef]
- DCC. The County Durham Plan: Wind Turbine Evidence Paper; Durham County Council: Durham, UK, 2013; Available online: http://durhamcc-consult.limehouse.co.uk/file/2896750 (accessed on 25 June 2020).
- UNESCO. Durham Castle and Cathedral; United Nations Educational, Scientific and Cultural Organization: Paris, France, 2020; Available online: https://whc.unesco.org/en/list/370 (accessed on 25 June 2020).
- CDT. County Plan. City of Durham Trust Bulletin, 2015. Available online: https://durhamcity.org/bulletins/bul79.pdf (accessed on 25 June 2020).
- West, I.M. Petroleum Geology of the South of England. 2019. Available online: http://www.southampton.ac.uk/~imw/Oil-South-of-England.htm (accessed on 7 July 2020).
- Richter, A. Rittershoffen Project in France to Deliver Heat for Industrial Use by Early 2016; Think GeoEnergy ehf: Reykjavik, Iceland, 22 September 2015; Available online: https://www.thinkgeoenergy.com/rittershoffen-project-in-france-to-deliver-heat-for-industrial-use-by-early-2016/ (accessed on 25 June 2020).
- Laenen, B.; Bogi, A.; Manzella, A. Financing Deep Geothermal Demonstration Projects. European Technology & Innovation Platform on Deep Geothermal, 2019. Available online: http://www.etip-dg.eu/front/wp-content/uploads/4.5-Financing-deep-geothermal-Final-1.pdf (accessed on 25 June 2020).


© 2020 by the authors. Licensee MDPI, Basel, Switzerland. This article is an open access article distributed under the terms and conditions of the Creative Commons Attribution (CC BY) license (http://creativecommons.org/licenses/by/4.0/).