Communication

Lessons Learned from an Experimental Campaign on Promoting Energy Content of Renewable Biogas by Injecting H2 during Anaerobic Digestion

1
Department of Manufacturing and Civil Engineering, Norwegian University of Science and Technology (NTNU), 2815 Gjøvik, Norway
2
Department of Chemical Engineering, Norwegian University of Science and Technology (NTNU), 7491 Trondheim, Norway
3
Department of Energy and Process Engineering, Norwegian University of Science and Technology (NTNU), 7491 Trondheim, Norway
*
Author to whom correspondence should be addressed.
Energies 2020, 13(14), 3542; https://doi.org/10.3390/en13143542
Submission received: 13 June 2020 / Revised: 3 July 2020 / Accepted: 7 July 2020 / Published: 9 July 2020
(This article belongs to the Special Issue Bioenergy from Organic Waste)

Abstract

:
Direct injection of H2 to an anaerobic reactor enables biological fixation of CO2 into CH4 (biomethanation) and consequently boosts methane content in the produced biogas. However, there has been only a small amount of literature reporting results on this technique in a continuous reactor framework to date. To fill this gap, the present study devoted an experimental work to direct H2 addition to a fed-batch semi-continuous reactor, where the injected H2 concentration increased gradually (~3–30 mmol), spanning a moderate operational period of about 70 days. As the results revealed, the reactor continued anaerobic operation for each level of H2 dosing and produced an average methane content in the biogas ranging between 65% and 72%. The exhibited biogas upgrading trend appeared to be under-developed, and thereby suggests the need for further research.

Graphical Abstract

1. Introduction

Fossil fuel-based energy is predicted to become obsolete in the future, given the diminishing resources and increasing population. This has led to accelerated generation of renewable energy from all available sources, e.g., wind, solar, biomass, and geothermal, among others. As a part of renewable sources, wind and solar energy are not available throughout the year and their production compared to demand does not coincide, resulting in generation of surplus or deficient energy at times [1]. Thus, the integration of a long-term storage as well as conversion of surplus electricity are indispensable requirements in incorporating these renewable resources into grid-based energy systems.
In a conventional approach, power-to-gas (P2G) technology enables conversion of electrical power to gas fuels [2]. Employing P2G, surplus electricity produced from seasonal renewable sources can be utilized to split water via electrolysis into H2 and O2, and subsequently H2 synthesis into methane in the presence of CO2 in a catalytic chemical reaction (the so-called “Sabatier process”). This approach, however, is energy intensive, less efficient (η < 80%), and characterized by a high operating temperature (250–700 °C), high pressure, and the use of a catalyst (e.g., nickel) [2,3]. On the contrary, the bio-Sabatier process (i.e., biomethanation), mediated by archaea (i.e., a domain of single-cell microorganisms), occurs at a relatively lower temperature and normal pressure according to Equation (1) [4]:
CO 2 + 4 H 2 = CH 4 + 2 H 2 O ;   G ° = 130 . 7   kJ / mol
In an anaerobic digestion (AD) process (i.e., a set of complex biochemical reactions convert organic feedstocks into biogas, e.g., predominantly 60% CH4 and 40% CO2, under an anoxic environment and moderate temperature, e.g., 20–70 °C), bio-Sabatier proceeds through hydrogenothrophic methanogenesis (i.e., methane generation by hydrogenothrophes). Normally, less methane is produced via this route compared to acetoclastic methanogenesis (i.e., methane generation from acetic acid by acetoclasts) [5]. However, the syntrophy between methanogenesis archaea and fermentative bacteria (i.e., microbes present in the pre-methanogenesis steps), responsible for the degradation of various acids (e.g., proprionate, butarate), only becomes thermodynamically feasible if hydrogenotrophes remove H2 quickly, which in turn depends on H2 partial pressure [6,7]. With the objective of promoting hydrogenotrophic methanogenesis, direct injection of external hydrogen can interrupt optimum H2 partial pressure [8], influencing syntrophy and consequently reducing pH level outside the microbes’ operating limit [5], eventually causing formation of flocs, granules, and/or biofilms, or in the worst case process failure [9].
While keeping H2 partial pressure within a safe limit is a pivotal requirement as far as process balance is concerned, mass transfer of H2 from gas to liquid plays a vital role in effectively contributing to biomethanation [10,11], when H2 is added directly. Among other factors, mass flow rate depends on volumetric mass flow rate as well as concentration gradient of H2 between the different phases [12]. Previously, several efforts were made to improve mass flow rate, including varied mixing speeds [4,13], direct injection using different membranes [14,15,16] and alumina ceramic sponges [11], changing diffusion devices [17,18], as well as the use of modified reactor types [11,19]. It has been reported that direct injection allows bubble-free hydrogen input, greater biomass–substrate contact, less H2 off-gasing, and even easier mass flow control [20]. Besides, direct injection eliminates the need for an additional reactor by allowing methane enrichment to proceed in the existing reactor, making the process financially compelling [4]. However, since pure H2 is not a readily available gas and its production is associated with high cost and emissions, depending on the sources and technologies used (e.g., steam reforming, partial oxidation, biomass gasification, electrolysis, etc.), interest has been growing in the direct injection of alternative hydrogen-based compounds as well as microbial fuel cells (MFC) [12,21,22].
Biogas enrichment through bio-Sabatier by means of H2 injection to AD is considered an easily retrofittable technology for commercial application, where the infrastructure for gas storage and connections for gas grids are easily accessible and well established. However, the commercial implementation of bio-Sabatier so far is rare or next to none [23,24]. In fact, the focus of the existing literature on bio-Sabatier is mostly based on lab or small scales, emphasizing batch mode feeding [25]. As a result, there is a lack of knowledge, experience, and R&D efforts on the viability of this approach in continuous reactor plants. Considering this, an experimental trial using a fed-batch semi-continuous reactor operated with cattle manure was carried out where externally produced H2 with variable concentration was introduced directly to the reactor’s headspace. The purpose of the work was to determine the feasible H2 injection regime by identifying the threshold of reactor operation and using this experience to develop future experiments, focusing more on enhancing technological robustness and addressing the current challenges so that further improvement of the energetic content of the upgraded biogas can be achieved.

2. Materials and Methods

Anaerobic digestion used for the present study was carried out by means of a 5 L working volume 6.6 L bioreactor (Biostat® A, Sartorius, UK) integrated with built-in sensors for real-time automatic measurement of temperature (provided by a surrounding heating element), pH, and mixer rpm, and interfaced with a programmable logic controller (PLC) to enable user-defined customization and data acquisition. The experimental procedure involved in different processing steps is shown in Figure 1a.
At start-up, ~2000 g of inoculum and ~11 g of cattle manure (CM), collected from a food waste biogas plant (63.75° N, 11.92° E, Ecopro AS, Trondheim, Norway) and a cattle farm (63.67° N, 9.49° E, Trondheim, Norway), respectively, were added to the reactor. The feeding was given to an inlet port located at the top of the reactor (Figure 1b), where three additional ports served as options for gas release (normally open and connected with a 5 L Tedlar bag, Sigma-Aldrich, Darmstadt, Germany), liquid sampling, and gas sampling. After feeding, an anaerobic environment was established by purging the reactor with N2 (99.99% purity, Linde-gas AS, Oslo, Norway) for 20–30 min at 4–5 bar. At this point, incubation began, and the reactor was run at constant 39 ± 1 °C (mesophilic temperature) throughout, with routine feeding of CM 3 to 4 times a week. The feeding scheme undertaken for the selected period of the experiment is listed in Table 1.
As the reactor had been supplemented with CM, and there was no withdrawal of digestate, the substrate to inoculum ratio (S:I) inside the reactor accumulated and varied from 0.05 at day 1 to 6.29 at day 88 (at the end), making the mode of the reactor operation fed-batch. The S:I was calculated based on the volatile solids of substrate and inoculum, while the characterization of substrate, inoculum, and digester liquids was done using in situ facilities and an external laboratory (Eurofins AS, Trondheim, Norway), when needed (Table 2). Among the parameters analyzed, total solids (TS) and volatile solids (VS) were measured according to the protocol American Public Health Association (APHA) 2005 [26], as described by Sarker [27]; total ammonium nitrogen (TAN) using spectrophotometry (Specroquant Pharo 300 with Spectroquant® kit:1.14559.0001, Merck, Kenilworth, NJ, USA) according to the standard APHA 1995 [28]; and volatile fatty acids (VFA) using gas chromatography (Hewlett Plackard 6890), as described by Bergland et al. [29]. pH values were obtained directly from the pH sensor measurement through PLC, and carbohydrates, lipids, and proteins were evaluated by Eurofins AS. The biogas, as produced, filled the connected gas bag (5 L Tedlar PLV bag, Sigma-Aldrich, Darmstadt, Germany), which was disconnected every time for measurement and analyzed separately for biogas quantity (calibrated at standard temperature and pressure (STP)) using liquid displacement equipment (Figure 1a), and then connected back to the reactor to enable filling until the next measurement. In parallel to biogas quantity, the quality of biogas in terms of CH4 and CO2 was also measured using gas chromatography (SRI 8610C, SRI Instruments, Torrance, CA, USA) (Figure 1a), analyzing samples collected regularly in glass vials of 10 mL (Apodan A/S, Hørsholm, Denmark) [27].
After the reactor had reached a steady state in terms of stable biogas production [30], biogas upgrading through biological conversion of CO2 to CH4 (bio-Sabatier process) was attempted. Accordingly, H2 produced from an external water electrolyzer (PROTON G400, Wallingford, USA) (Figure 1a) was introduced manually into the reactor headspace through the biogas exit port using a needle and a gas-tight glass syringe (Hamilton 101 RN, Sigma-Aldrich, Darmstadt, Germany). However, an option to inject hydrogen automatically via a mass flowmeter (8711 MFC, Burkert Norway AS, Skjetten, Norway) (Figure 1a) interfaced with LabView for flow control has been under development for future campaigns.
With gradual increases in quantity (between 70 and 670 mL, or 3 and 30 mmol; Table 3), H2 was successfully injected at 9 instances (between days 40 and 71), resulting in available stoichiometric H2:CO2 varying between 0.40 and 2.86. Attempts to further increase H2:CO2 constrained the reactor, forcing the discontinuation of H2 injection after day 71 followed by the end of the experiment at day 88.

3. Results and Discussions

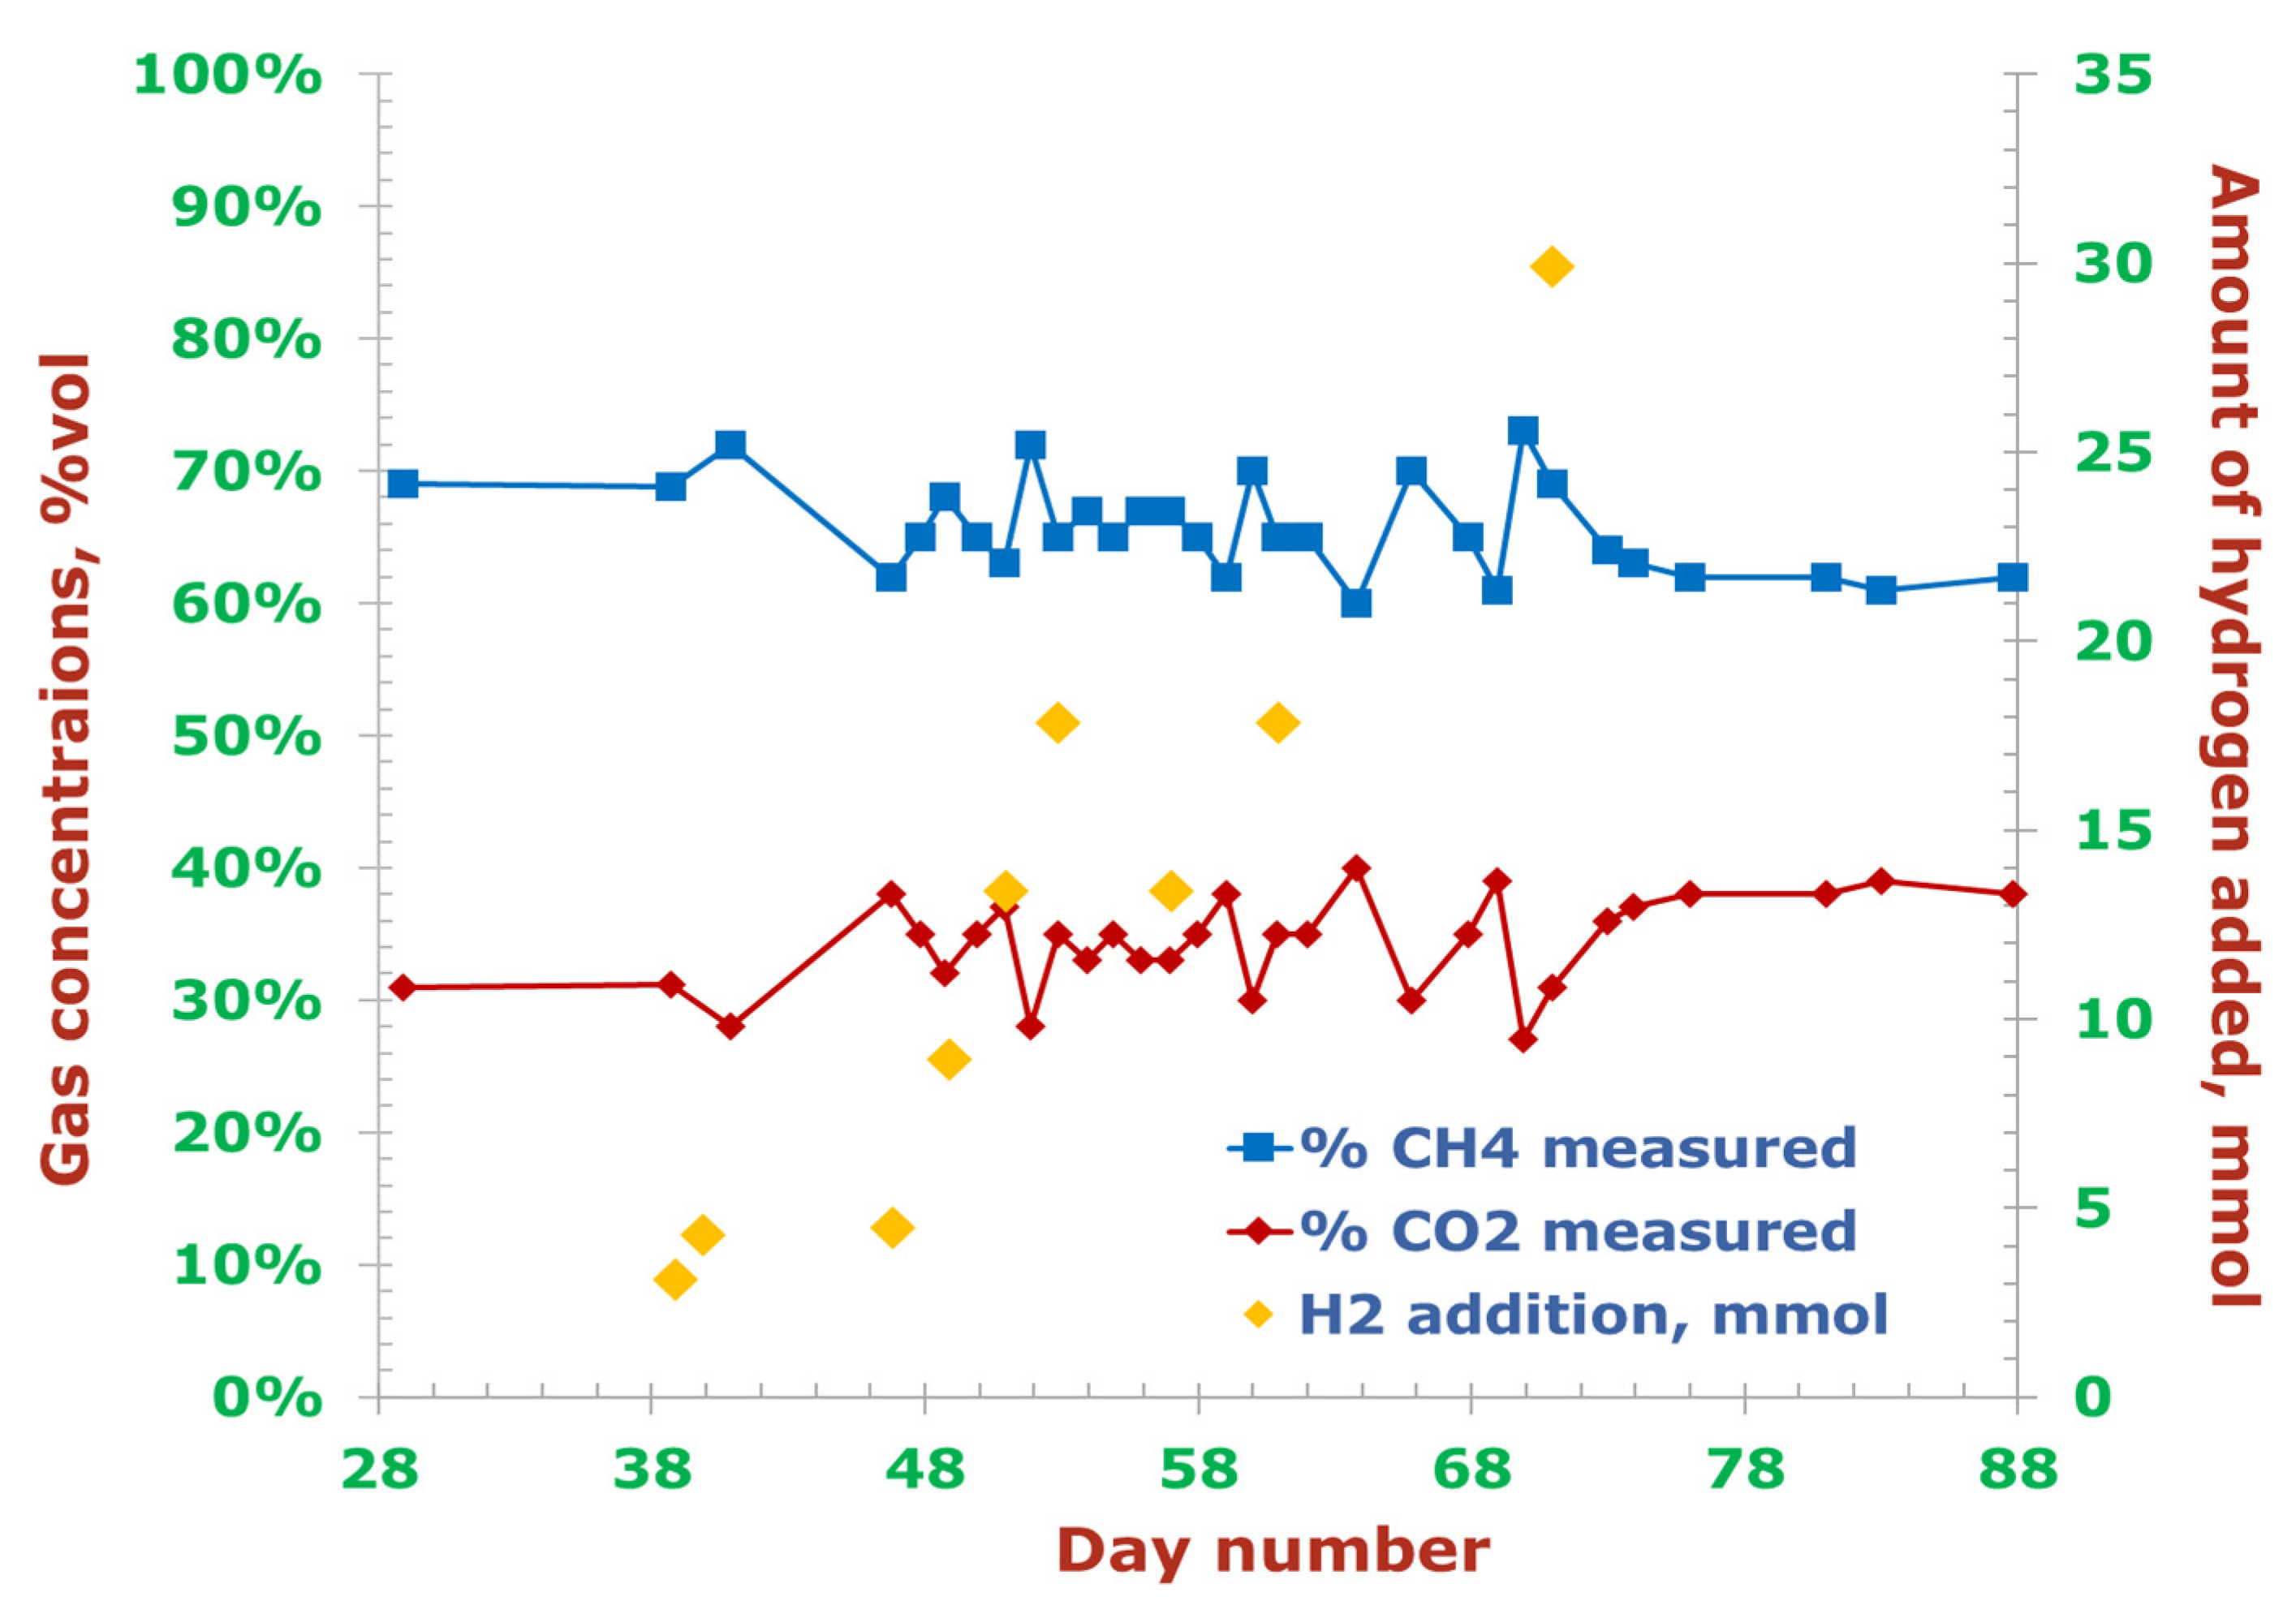
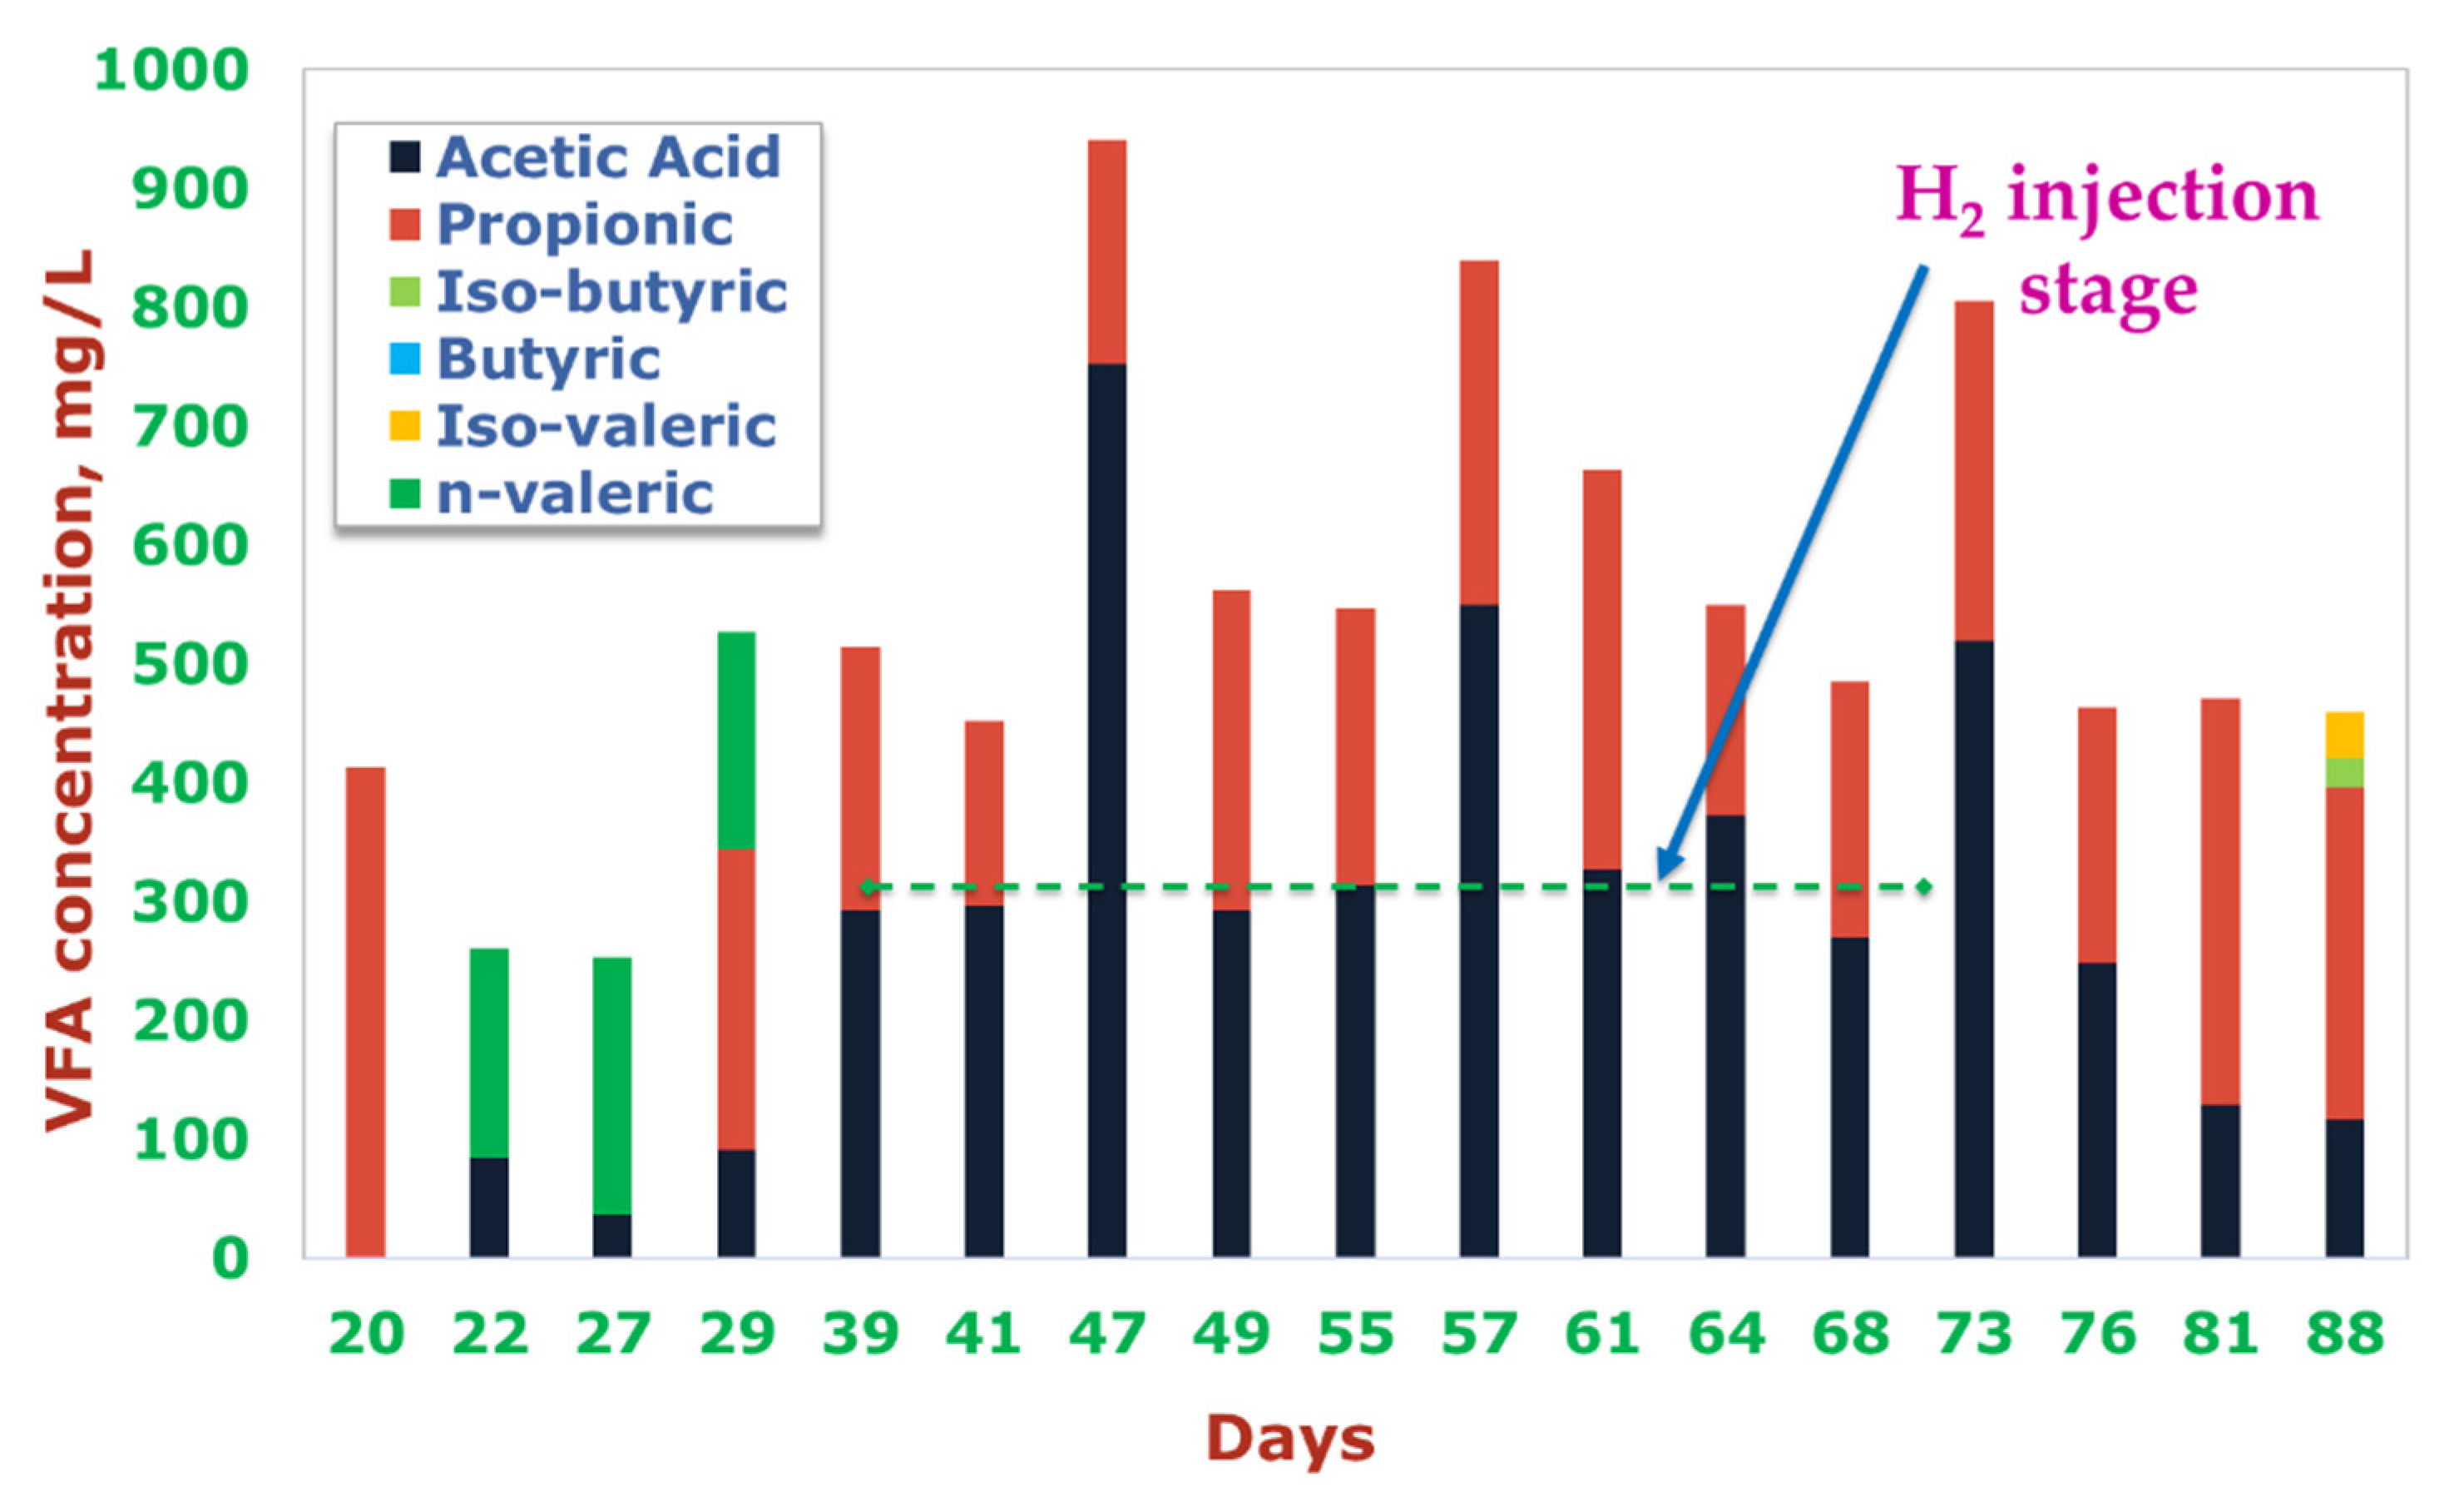
The H2 injection strategy together with the corresponding development of H2:CO2, biogas amount, and methane content in the biogas are displayed in Table 3, while Figure 2 and Figure 3 illustrate the effect of H2 injection on biogas composition and VFA development, respectively.
After start-up, at around day 39, the biogas production stabilized, i.e., 5% variation of biogas yield between the two/three successive days [30], with average biogas yield of 525 mL/d, methane content of ~69%, pH of 7.2, and total VFA of 500 mg/L corresponding to a cumulative S:I of 2.5. At this point, the “Batch 1” (Table 3) of H2 was introduced through the biogas exit port, which was then closed so that no H2 could potentially leak through the system unreacted. About 24 h after the H2 augmentation, the biogas port was opened, immediately causing the produced biogas to fill the connected gas bag. At the same time, the digester liquid was sampled and the real-time temperature, pH, and rpm values from the PLC display were recorded. As measured, the biogas yield, methane content, pH, and VFA after 24 h of H2 addition amounted to the following: 591 mL/d, 72%, and ~450 mg/L, respectively. The biogas yield and methane content at this point improved compared to the steady state without H2 supplement. This indicates that the small doses of H2 did not inhibit the digestion process, and since the target was to gradually achieve a headspace H2:CO2 molar ratio of 4:1, an increased dose of H2 was supplemented at the second instance at day 41 and onward using the same protocol of injection and samplings as “Batch 1”.
Measured biogas yield and methane content after “Batch 2” (Table 3) injection remained almost constant since the “Batch 1” with 590 mL/d and 72%, respectively, indicating that the increased H2 feeding did not contribute to improving the spontaneity of hydrogenotrophic methanogenesis, and hence the methane content. Meanwhile, the VFA and pH at this stage settled to an average of 480 mg/L and 7.1, respectively. The stable pH implies that the process presumably was not affected by the hydrogen partial pressure. However, since the H2 was input directly to the reactor headspace, liquid mass transfer might not be effective, resulting in poor hydrogen utilization efficiency, and in turn no effect on methane content improvement. Jensen et al. [16] reported that mass transfer of hydrogen is more dependent on injected bubble size and distribution than on the amount of H2 injected. Their computational fluid dynamics (CFD) modeling results demonstrated that smaller H2 bubble sizes dispersed through the reactor more evenly, resulting in greater contact area and consequently enhanced gas–liquid mass transfer. The injected H2 bubble sizes and distribution however were not investigated and therefore could not be confirmed in the present context.
While the biogas yield, methane content, and pH after H2 addition during “Batch 2” remained almost constant, surprisingly, total VFA formation almost doubled near to the H2 feed during “Batch 3” (Table 3). This perhaps was due to the slight substrate overloading, as S:I input kept increasing (Table 1) [7,31], which ultimately resulted in imbalance between acedogenesis and methanogenesis and/or acetogenesis and methanogenesis. However, since the level of developed VFA was still below 1 g/L and the pH remained stable at around 7.2, the increased VFA neither compromised the reactor stability nor was it directly correlated to the elevated level of H2 feed.
After “Batch 3” and “Batch 4” (Table 3) injections, which made H2:CO2 increase from 0.27 to 0.61, the biogas yield improved from 666 to 778 mL/d, while methane content kept constant at 65%. This again implies that external H2 did not have any influence in enriching biogas with enhanced methane. However, the increased biogas yield at this stage may indicate that the reactor experienced improved biodegradability [32] as a result of the available S:I feed, i.e., between 3.19 and 3.48 (see Table 1), which could also be correlated with the reduced VFA level (~550 mg/L; Figure 3).
“Batch 5” to “Batch 7” (Table 3) of H2 addition resulted in a steady decline of biogas yield from around 686 to 493 mL/d with corresponding downfall of methane content from 72% to 65%, respectively. In contrast, the VFA concentration increased (~820 mg/L; Figure 3), which however was less likely to contribute to any process imbalance [7]. Despite the increased H2 loading, the decreased biogas yield at this stage maybe attributed to overdosed S:I, while the methane content might be correlated with weaker methanogenesis spontaneity, either caused by inefficient H2 mass transfer or by thermodynamic instability [33]. In fact, during this period of operation, foam/scum formation on the top of the reactor fluid was observed to have overgrown regardless of a constant mixing at 100 rpm. Although this occurs frequently with cattle manure AD [34], the enlarged foam layer reduces the possibility of efficient H2 mass transfer by reducing close contact between feed and microorganisms and also with H2. With the H2 injection strategy undertaken in the current work, this phenomenon was likely to be aggravated at the back end of the experiment, resulting in compromised biogas yield as well as the formation of methane.
Further declines in methane content (i.e., from 65% to 64%) and biogas yield (i.e., from to 325 mL/d) were evidenced after “Batch 9” (Table 3) injection, although VFA content tended to stabilize (Figure 3) and pH kept constant at ~7.2, as normal. It can thus be concluded that step-wise increase of H2 concentration coupled with elevated S:I might lead to decreased process performance as a result of multiple phenomena associated with a poor hydrogen utilization efficiency [35], elevated residual substrate accumulation [36], and decreased activity of acetogens or methanogens [37]. Nevertheless, the reactor did not show any sign of collapse during and after the H2 injection stint and kept producing biogas with reasonable methane content (Figure 2) for the whole duration of the experiment. However, as there was not a great deal of methane content improvement during the H2 input phase, reaching a H2:CO2 level of 4:1 as per the original target was found to be irrelevant, causing H2 injection to stop at day 71 with a H2:CO2 of 2.86. Approaching a H2:CO2 of 4:1 and more thus remains the scope of future experiments to be developed based on the present campaign. It is worthwhile to note that, as per the literature [37], greater methane content improvement can be achieved by utilizing a H2:CO2 of more than 4:1 and up to 10:1. However, several process difficulties including elevated VFA development were evidenced when H2:CO2 extended beyond 4:1 [37].

4. Conclusions

The feasibility of a H2 injection window in a realistic anaerobic digestion context was examined, and based on the obtained results, the following concluding points are revealed: (a) the methane and VFA compositions, although developed erratically, were not found to be directly correlated with the H2 partial pressure, as the reactor pH stayed stable (~7.2) throughout; (b) because H2 was manually injected directly to the reactor headspace, the H2 gas–liquid mass transfer was not effective, and thereby the desired level of methane content in the produced biogas could not be obtained; (c) poor H2 mass transfer appeared to be aggravated by the elevated foam formation on digester liquid at the back end of the process, resulting in compromised methane content and biogas yield; (d) due to the unsatisfactory methane content improvement, the H2 injection at stoichiometric 4:1 H2:CO2 or more could not be justified and hence was not exploited.
As for future experimental campaigns, the focus should be placed more on circumventing the challenges encountered here (i.e., inefficient liquid mass transfer, poor methane upgrading performance) and on developing avenues for further improvement taking into consideration wider operational H2:CO2, continuous long-term production of high-quality biomethane (e.g., volumetric CH4 content at or over 90%), and assessment of techno-economic and environmental soundness (e.g., life cycle assessment).

Author Contributions

Conceptualization, K.M.L. and S.S.; methodology, S.S. and S.N.W.; software, S.N.W.; validation, S.S. and S.N.W.; formal analysis, S.S. and S.N.W.; investigation, S.N.W. and S.S.; resources, K.M.L. and S.S.; data curation, S.S. and S.N.W.; writing—original draft preparation, S.S.; writing—review and editing, S.S.; visualization, S.S. and S.N.W.; supervision, S.S. and K.M.L.; project administration, K.M.L.; funding acquisition, K.M.L. All authors have read and agreed to the published version of the manuscript.

Funding

This research received no external funding.

Acknowledgments

The authors gratefully acknowledge the lab facility provided by the Department of Energy and Process Technology at NTNU (Norwegian University of Science and Technology) throughout the course of this work. Special thanks go to ENERSENSE (Energy and Sensor Systems, NTNU) for support with the finance. In addition, Rune Bakke, Carlos Dinamarca, and Eshetu Janka Wakjera from the Department of Energy, Process and Environmental Engineering at the University of South Eastern Norway are acknowledged for their assistance with some sample analyses in their lab.

Conflicts of Interest

The authors declare no conflict of interest. The funders had no role in the design of the study; in the collection, analyses, or interpretation of data; in the writing of the manuscript, or in the decision to publish the results.

Abbreviations

ADAnaerobic Digestion
APHA
CM
American Public Health Association
Cattle Manure
CFDComputational Fluid Dynamics
MFCMicrobial Fuel Cells
P2GPower to Gas
PLCProgrammable Logic Control
R&DResearch and Development
S:ISubstrate to Inoculum ratio
STPStandard Temperature and Pressure
TANTotal Ammonium Nitrogen
TSTotal Solids
VFAVolatile Fatty Acids
VSVolatile Solids

References

  1. Weschenfelder, F.; Leite, G.N.P.; da Costa, A.C.A.; de Castro Vilela, O.; Ribeiro, C.M.; Ochoa, A.A.V.; Araújo, A.M. A review on the complementarity between grid-connected solar and wind power systems. J. Clean. Prod. 2020, 257, 120617. [Google Scholar] [CrossRef]
  2. Götz, M.; Lefebvre, J.; Mörs, F.; Koch, A.M.; Graf, F.; Bajohr, S.; Reimert, R.; Kolb, T. Renewable Power-to-Gas: A technological and economic review. Renew. Energy 2016, 85, 1371–1390. [Google Scholar] [CrossRef] [Green Version]
  3. Liu, W.; Wen, F.; Xue, Y. Power-to-gas technology in energy systems: Current status and prospects of potential operation strategies. J. Mod. Power Syst. Clean Energy 2017, 5, 439–450. [Google Scholar] [CrossRef] [Green Version]
  4. Luo, G.; Angelidaki, I. Integrated biogas upgrading and hydrogen utilization in an anaerobic reactor containing enriched hydrogenotrophic methanogenic culture. Biotechnol. Bioeng. 2012, 109, 2729–2736. [Google Scholar] [CrossRef]
  5. Bassani, I.; Kougias, P.G.; Treu, L.; Angelidaki, I. Biogas upgrading via hydrogenotrophic methanogenesis in two-stage continuous stirred tank reactors at mesophilic and thermophilic conditions. Environ. Sci. Technol. 2015, 49, 12585–12593. [Google Scholar] [CrossRef]
  6. McCarty, P.L.; Smith, D.P. Anaerobic wastewater treatment. Environ. Sci. Technol. 1986, 20, 1200–1206. [Google Scholar] [CrossRef]
  7. Sarker, S.; Lamb, J.J.; Hjelme, D.R.; Lien, K.M. A review of the role of critical parameters in the design and operation of biogas production plants. Appl. Sci. 2019, 9, 1915. [Google Scholar] [CrossRef] [Green Version]
  8. Hattori, S. Syntrophic acetate-oxidizing microbes in methanogenic environments. Microbes Environ. 2008, 23, 118–127. [Google Scholar] [CrossRef] [Green Version]
  9. Mulat, D.G.; Mosbæk, F.; Ward, A.J.; Polag, D.; Greule, M.; Keppler, F.; Nielsen, J.L.; Feilberg, A. Exogenous addition of H 2 for an in situ biogas upgrading through biological reduction of carbon dioxide into methane. Waste Manag. 2017, 68, 146–156. [Google Scholar] [CrossRef]
  10. Pauss, A.; Andre, G.; Perrier, M.; Guiot, S.R. Liquid-to-gas mass transfer in anaerobic processes: Inevitable transfer limitations of methane and hydrogen in the biomethanation process. Appl. Environ. Microbiol. 1990, 56, 1636–1644. [Google Scholar] [CrossRef] [Green Version]
  11. Bassani, I.; Kougias, P.G.; Angelidaki, I. In-situ biogas upgrading in thermophilic granular UASB reactor: Key factors affecting the hydrogen mass transfer rate. Bioresour. Technol. 2016, 221, 485–491. [Google Scholar] [CrossRef] [PubMed] [Green Version]
  12. Sarker, S.; Lamb, J.J.; Hjelme, D.R.; Lien, K.M. Overview of recent progress towards in-situ biogas upgradation techniques. Fuel 2018, 226, 686–697. [Google Scholar] [CrossRef]
  13. Bhattacharyya, D.; Singh, K.S. Understanding the mixing pattern in an anaerobic expanded granular sludge bed reactor: Effect of liquid recirculation. J. Environ. Eng. 2009, 136, 576–584. [Google Scholar] [CrossRef]
  14. Oyama, S.; Lee, D.; Hacarlioglu, P.; Saraf, R. Theory of hydrogen permeability in nonporous silica membranes. J. Membr. Sci. 2004, 244, 45–53. [Google Scholar] [CrossRef]
  15. Luo, G.; Angelidaki, I. Hollow fiber membrane based H2 diffusion for efficient in situ biogas upgrading in an anaerobic reactor. Appl. Microbiol. Biotechnol. 2013, 97, 3739–3744. [Google Scholar] [CrossRef]
  16. Jensen, M.B.; Kofoed, M.V.W.; Fischer, K.; Voigt, N.V.; Agneessens, L.M.; Batstone, D.J.; Ottosen, L.D.M. Venturi-type injection system as a potential H2 mass transfer technology for full-scale in situ biomethanation. Appl. Energy 2018, 222, 840–846. [Google Scholar] [CrossRef]
  17. Díaz, I.; Pérez, C.; Alfaro, N.; Fdz-Polanco, F. A feasibility study on the bioconversion of CO2 and H2 to biomethane by gas sparging through polymeric membranes. Bioresour. Technol. 2015, 185, 246–253. [Google Scholar] [CrossRef]
  18. Luo, G.; Angelidaki, I. Co-digestion of manure and whey for in situ biogas upgrading by the addition of H2: Process performance and microbial insights. Appl. Microbiol. Biotechnol. 2013, 97, 1373–1381. [Google Scholar] [CrossRef]
  19. Rachbauer, L.; Voitl, G.; Bochmann, G.; Fuchs, W. Biological biogas upgrading capacity of a hydrogenotrophic community in a trickle-bed reactor. Appl. Energy 2016, 180, 483–490. [Google Scholar] [CrossRef]
  20. Kim, H.W.; Marcus, A.K.; Shin, J.H.; Rittmann, B.E. Advanced control for photoautotrophic growth and CO2-utilization efficiency using a membrane carbonation photobioreactor (MCPBR). Environ. Sci. Technol. 2011, 45, 5032–5038. [Google Scholar] [CrossRef]
  21. Linville, J.L.; Shen, Y.; Ignacio-de Leon, P.A.; Schoene, R.P.; Urgun-Demirtas, M. In-situ biogas upgrading during anaerobic digestion of food waste amended with walnut shell biochar at bench scale. Waste Manag. Res. 2017, 35, 669–679. [Google Scholar] [CrossRef]
  22. Shen, Y.; Linville, J.L.; Urgun-Demirtas, M.; Schoene, R.P.; Snyder, S.W. Producing pipeline-quality biomethane via anaerobic digestion of sludge amended with corn stover biochar with in-situ CO2 removal. Appl. Energy 2015, 158, 300–309. [Google Scholar] [CrossRef] [Green Version]
  23. Zhang, L.; Kuroki, A.; Tong, Y.W. A Mini-Review on In situ Biogas Upgrading Technologies via Enhanced Hydrogenotrophic Methanogenesis to Improve the Quality of Biogas from Anaerobic Digesters. Front. Energy Res. 2020. [Google Scholar] [CrossRef]
  24. Satyanarayana, T.; Johri, B.N.; Das, S.K. Microbial Diversity in Ecosystem Sustainability and Biotechnological Applications: Volume 1. Microbial Diversity in Normal & Extreme Environments; Springer: Berlin/Heidelberg, Germany, 2019. [Google Scholar]
  25. Hupfauf, S.; Winkler, A.; Wagner, A.O.; Podmirseg, S.M.; Insam, H. Biomethanation at 45 °C offers high process efficiency and supports hygienisation. Bioresour. Technol. 2020, 300, 122671. [Google Scholar] [CrossRef]
  26. APHA. Standard Methods for the Examination of Water and Wastewater, 21st ed.; American Public Health Association: Washington, DC, USA, 2005. [Google Scholar]
  27. Sarker, S. By-products of fish-oil refinery as potential substrates for biogas production in Norway: A preliminary study. Results Eng. 2020, 6, 100137. [Google Scholar] [CrossRef]
  28. APHA; WPCF. Standard Methods for the Examination of Water and Wastewater; American Public Health Association/American Water Works Association/Water Environment Federation: Washington, DC, USA, 1995. [Google Scholar]
  29. Bergland, W.H.; Dinamarca, C.; Toradzadegan, M.; Nordgård, A.S.R.; Bakke, I.; Bakke, R. High rate manure supernatant digestion. Water Res. 2015, 76, 1–9. [Google Scholar] [CrossRef] [PubMed] [Green Version]
  30. Varel, V.; Isaacson, H.; Bryant, M. Thermophilic methane production from cattle waste. Appl. Environ. Microbiol. 1977, 33, 298–307. [Google Scholar] [CrossRef] [Green Version]
  31. Sarker, S.; Møller, H.B. Regulating feeding and increasing methane yield from co-digestion of C 5 molasses and cattle manure. Energy Convers. Manag. 2014, 84, 7–12. [Google Scholar] [CrossRef]
  32. Carlsson, M.; Lagerkvist, A.; Morgan-Sagastume, F. The effects of substrate pre-treatment on anaerobic digestion systems: A review. Waste Manag. 2012, 32, 1634–1650. [Google Scholar] [CrossRef]
  33. De Bok, F.; Plugge, C.; Stams, A. Interspecies electron transfer in methanogenic propionate degrading consortia. Water Res. 2004, 38, 1368–1375. [Google Scholar] [CrossRef]
  34. Ong, H.; Greenfield, P.; Pullammanappallil, P. Effect of mixing on biomethanation of cattle-manure slurry. Environ. Technol. 2002, 23, 1081–1090. [Google Scholar] [CrossRef] [PubMed]
  35. Angelidaki, I.; Karakashev, D.; Batstone, D.J.; Plugge, C.M.; Stams, A.J. Biomethanation and its potential. In Methods in Enzymology; Elsevier: Amsterdam, The Netherlands, 2011; Volume 494. [Google Scholar]
  36. Velmurugan, B. Anaerobic digestion of vegetable wastes for biogas production in a fed-batch reactor. Int. J. Emerg. Sci. 2011, 1, 478. [Google Scholar]
  37. Agneessens, L.M.; Ottosen, L.D.M.; Voigt, N.V.; Nielsen, J.L.; de Jonge, N.; Fischer, C.H.; Kofoed, M.V.W. In-situ biogas upgrading with pulse H 2 additions: The relevance of methanogen adaption and inorganic carbon level. Bioresour. Technol. 2017, 233, 256–263. [Google Scholar] [CrossRef] [PubMed]
Figure 1. Experimental set-up: (a) different processing steps; (b) top view of the reactor Biostat® A showing location of different ports and sensors.
Energies 13 03542 g001
Figure 2. Effect of H2 injection on biogas composition (v/v) in terms of standard temperature and pressure (STP) normalized CH4 and CO2 contents.
Energies 13 03542 g002
Figure 3. Effect of H2 injection on the digester’s volatile fatty acids (VFA) development. The VFA data presented in this graph correspond to the values at sampling days on which analyses were conducted, and hence should not be interpreted as the actual VFA effect on those days. The day-specific actual VFA effect corresponding to the experimental progress might remain undetected, as the interval between the measurements was high and the analysis results obtained were dependent on an external lab. Regardless, the VFA formation trend is clearly demonstrated.
Energies 13 03542 g003
Table 1. Cattle manure (CM) feeding scheme with corresponding digester substrate to inoculum (S:I) ratios.
Day394047495153576171
CM input, g/d64.17169.370.56171.969.564.372.5
S:I2.322.613.193.483.734.034.65.086.29
Table 2. Measured properties of inoculum and substrate.
PropertiesUnitInoculum before Exp.Substrate before Exp.
TSwt%0.83 ± 0.0312.11 ± 0.07
VSwt%0.39 ± 0.049.54 ± 0.04
Carbohydrateswt%0.05.3
Proteinswt%<0.301.56
Lipidswt%2.180.93
pHpH7.387.41
TANmg/L5841590
Total VFAmg/L52.95 ± 1.35518.23 ± 19.1
Acetic acidmg/Ln.d.4263.85 ± 17.2
Propionic acidmg/Ln.d.694.18 ± 0.6
Iso-butyric acidmg/Ln.d.118.00 ± 0.1
n-butyric acidmg/Ln.d.240.38 ± 0.4
Iso-valeric acidmg/Ln.d.201.82 ± 1.2
n-valeric acidmg/Ln.d.n.d.
n.d.: not detected.
Table 3. H2 injection strategy with corresponding methane content in biogas (methane content values after 24 h of H2 injections are highlighted with underlined numbers).
H2 Injection BatchDayH2 Injection Amount, mLH2 Injection Amount, mmolH2:CO2CH4 Content in BiogasBiogas Amount, mL/d
Batch 13970.03.120.4069%525
Batch 24095.84.270.7672%591
41- - 0.7672%590
Batch 347100.04.460.2762%
48- - 0.2765%666
Batch 449200.08.920.6268%
50- - 0.6265%778
Batch 551300.013.380.7163%
52- - 0.7172%686
Batch 653400.017.850.9765%
54- - 0.9767%690
Batch 757300.013.381.1167%
58- - 1.1165%493
Batch 861400.017.851.7865%
62- - 1.7865%391
Batch 971670.029.892.8669%
72- - 2.8664%325