1. Introduction
Today, lithium-ion batteries are the most common option for energy storage in portable devices. However, sodium and lithium systems were studied in parallel back in the 1970s. It was the higher energy density delivered by the lithium-ion battery that made it the first commercially available technology in 1991 [
1]. Since then, sodium-ion battery research was left behind. The suitability of graphite material as anode also drove lithium-ion battery commercialization [
1]. Graphite delivers a theoretical specific capacity against lithium ions of 372 mAh·g
−1, given the formation of the intercalation compound LiC
6 [
1,
2]. Even if lithium and sodium chemistries are very similar, intercalation compounds of sodium into graphite such as NaC
48 or NaC
64 deliver a specific capacity of only 35 mAh·g
−1, for the latter [
1,
2]. The poor capacity of graphite to intercalate sodium ions is related to the competition between the ionization energy, and the ion-substrate coupling that leads to the weak chemical binding of sodium ions towards numerous substrates [
2].
Because of the increasing development and demand of lithium-ion batteries, there is a general concern about the limited abundance of lithium resources and other elements used in the battery, such as cobalt, nickel, and copper [
3,
4]. Therefore, the sodium-ion battery started to gain increased attention as an appealing alternative to lithium-ion, given the vast abundance of sodium sources and its cheaper price, together with the possibility of replacing copper with aluminum in the current collector. Moreover, the work of Stevens and Dahn in the 2000s introduced a disordered carbonaceous material synthesized from glucose, which delivered an outstanding reversible capacity of 300 mAh·g
−1 against sodium [
5]. This material is now widely known as hard carbon. Hard carbon is a disordered, mainly sp
2, carbonaceous material that is nongraphitic, and nongraphitizable [
6]. Therefore, it has a turbostratic structure containing locally stacked graphene layers without a long-range arrangement, in a strong cross-linked carbon network, creating nanovoids or ultramicropores.
Hard carbon is normally obtained from pyrolysis of organic precursors at temperatures above 1000 °C and heating rates between 1–10 °C/min, under inert atmospheres. The nature of the precursor is of vital importance for the final microstructure of the material [
4]. The chemical composition of the precursor will determine its nongraphitizable nature. Hydrocarbons with high hydrogen content tend to develop graphitic carbons with thermal treatment, while organic compounds with lower hydrogen and high oxygen content tend to develop nongraphitic structures with temperature [
4,
6]. Most used precursors for hard carbons are monomers, such as sucrose or glucose—polymers such as poly-acetonitrile, polyaniline, phenolic resins, and naturally occurring polymers such as cellulose and lignin. Mixtures of graphitizing and nongraphitizing materials have also been studied, such as pitch with lignin [
4].
Additionally, lignocellulosic biomass plays an important role as a low-cost and sustainable precursor for hard carbon [
7]. Lignocellulosic biomass, is mainly composed of three structural biopolymers found in the secondary cell wall of plants: cellulose, hemicellulose and lignin [
8]. Biomass also contains other minor nonstructural compounds such as extractives, inorganic compounds and moisture [
9]. Cellulose is a linear and almost crystalline polymer of β-D glucose units, organized in microfibrils. Hemicelluloses are amorphous heteropolymers, composed mainly of linear backbones of pentoses such as xylose or arabinose, and hexoses such as glucose, mannose, or galactose. Lignin is a complex amorphous heteropolymer of 3 different phenylpropane units: p-hydroxyphenyl (H-), guaiacyl (G-), and syringyl (S-) [
8,
10]. Hemicellulose and cellulose microfibrils form a cohesive network by hydrogen bonds, while lignin and hemicelluloses polysaccharides are cross-linked by covalent bonds, sealing the polysaccharides in the cell wall and providing waterproof, mechanical reinforcement, and a strong barrier to microbial digestion [
11,
12]. The nonstructural extractives compounds are organic molecules that are not part of the structure itself such as oils and terpenoids, which can be easily extracted by solvents [
13]. Finally, the principal inorganic elements found in lignocellulosic biomass are: nitrogen, chlorine, calcium, potassium, magnesium, sulphur, silicon, manganese, sodium, phosphorus, iron, and heavy metals [
13]. These elements can be present in the organic matrix as water-soluble compounds, salts, minerals or mineraloids or organically bound to carbon, hydrogen and oxygen in the biopolymers [
14]. Inorganic matter in lignocellulosic biomass is mostly nonvolatile and thus gathered as the remaining fraction after combustion called ash.
Biomass chemical composition varies strongly in terms of the basic monomer constituents of the biopolymers and regarding the inorganic species in it. The composition can vary from one specie to another or even in the same plant in between different types of cells [
9].
Recently, several studies have explored hard carbon production from lignocellulosic biomass and many different types of biomass have been used, such as fruit wastes and fruit peels [
15,
16,
17,
18,
19,
20,
21], grains, shells, stems, husk, leaves and forestry species [
22,
23,
24,
25,
26,
27,
28,
29,
30,
31,
32,
33,
34,
35,
36].
Biochar obtained from biomass is normally obtained at temperatures between 400 °C and 700 °C. At these temperatures, the biochar structure and composition is not suitable to be used as active material in an electrode. Biochar structure is not properly organized into turbostratic domains, therefore, sodium uptake will be very limited. Additionally, there is still an important content of heteroatoms in the biochar composition, which will affect the conductivity of the electrode and its interactions with the electrolyte. Finally, biochars normally develop surface areas that are not suitable for Na-ion electrodes application (higher than 10 m2·g−1). High surface areas will induce higher irreversibility in the electrodes.
However, a biochar can be upgraded to a hard carbon if high temperature pyrolysis is done, over 1000 °C. This thermal treatment gives the intermediate biochar the particular properties of a hard carbon, such as high carbon purity, turbostratic structure, and low surface area.
Besides the low-cost and sustainability of the biomass precursors, they are also appealing, thanks to their naturally occurring internal structure and morphology, which is preserved among the slow pyrolysis treatment. Intrinsic hierarchical structures found in plants, can be used to enhance the electrolyte percolation and the ionic and electronic conductivity. Zhang et al. [
31] for example, had analyzed the performance of a hard carbon obtained from lotus stems, containing an intrinsic hierarchical structure of channels in the longitudinal axis, which led to the formation of a controlled three-dimensional structure after pyrolysis. The resultant hard carbon pyrolyzed at 1400 °C exhibited a first reversible capacity of 351 mAh·g
−1 with an initial coulombic efficiency (ICE) of 70% at a current density of 40 mA·g
−1. Li et al. [
37] also explored this feature using hard carbon obtained from bee pollen grains. Pollen grains have a unique natural structure consisting in hollow spheres. By exposing the hollow carbon reticulate matrix, the ions diffusion was enhanced and the electronic conductivity was improved. The best reversible capacity was obtained for the material treated at 600 °C, presenting 150 mAh·g
−1 at 100 mA·g
−1 and a retention of 90% after 1000 cycles.
Despite their interesting natural structure, biomass precursors can present up to 46% of their dry mass in inorganic matter [
9]. In the previous studies, the biomass precursors underwent an acid wash before or after the thermal treatment, to remove the inorganics. Indeed, many studies use acid washing to remove the inorganic fraction of biomass, however, there are few systematic studies dealing with the characterization of the inorganic species and the understanding of the impact of these inorganics in the structure and performance of the hard carbon electrodes. Zhang et al. [
32] studied a purified and nonpurified hard carbon from pinecone. Pinecone biomass was first prepyrolyzed until 500 °C, a part of the resulted char was then washed with KOH and HCl solutions, and further pyrolyzed until 1400 °C. The nonwashed sample underwent a second pyrolysis until the same temperature. Pinecone impurities were identified by energy-dispersive X-ray spectroscopy (EDX) and were mainly composed of potassium, and much lower quantities of silicon, phosphorus and calcium. Both samples had similar first reversible capacities and ICE, however, washed sample exhibited better capacity retention, 328 mAh·g
−1 compared to 299 mAh·g
−1 for the unwashed sample after 100 cycles. Authors attributed this diminution to metal impurities occupying possible sodium storage sites. In parallel, Dahbi et al. [
26] evaluated the influence of acid washing in the electrodes performance using argan shell as precursor. The raw biomass and HCl washed biomass were pyrolyzed at different temperatures. Again, potassium was found to be the most abundant impurity in this biomass, and was completely removed after the acid treatment. Acid treatment led to different structural characteristics than the nontreated samples, such as higher graphitization degree, fewer defects and consequently higher thermal stability. Additionally, acid treatment strongly increases the specific surface area of the materials. The acid washed samples showed, at all pyrolysis temperatures, a higher reversible capacity and ICE, than the nonwashed samples. The washed sample treated at 1200 °C delivered a reversible capacity of 333 mAh·g
−1 at 25 mA·g
−1 with an ICE of 79%. As Zhang et al. discussed, they attributed this behavior to higher active sites available to sodium uptake in the structure. Nevertheless, an identification of the specific mechanisms behind the structural modification and performance enhancement by the inorganic washing is still missing.
Moreover, as for the inorganic fraction, there is a general lack of biomass composition characterization in terms of biopolymers in most of the studies dealing with hard carbon preparation from biomass. Therefore, the correlation of the electrochemical properties is mainly related to the structural parameters of hard carbon, which cannot be associated with the biomass properties. A first attempt to correlate the biomass composition to the hard carbon performance was made by Dou X. et al. [
38] by using precursors rich in pectin (apple waste), in hemicellulose (corncob) and in lignin (peanut shell), to compare the performance of the resulting electrodes. They observed that the lignin-rich peanut shell hard carbon showed the best electrochemical performance because of its favorable surface area, degree of graphitization, and elemental composition, which was correlated with its high lignin content. Conder et al. [
39] also explored the role of the biomass composition in the performance of hard carbon by preparing chitin and chitosan derived materials. Even if the parent biomolecules were very similar, the derived hard carbons presented different physicochemical and electrochemical properties. They attributed this difference to the inorganic impurities in chitosan and further compared an acid-washed chitosan derived hard carbon. Results showed again, that the removal of the inorganic matter improves performance, as the cycling stability was enhanced. They attributed this improvement to the removal of insulating species contained in the chitosan impurities.
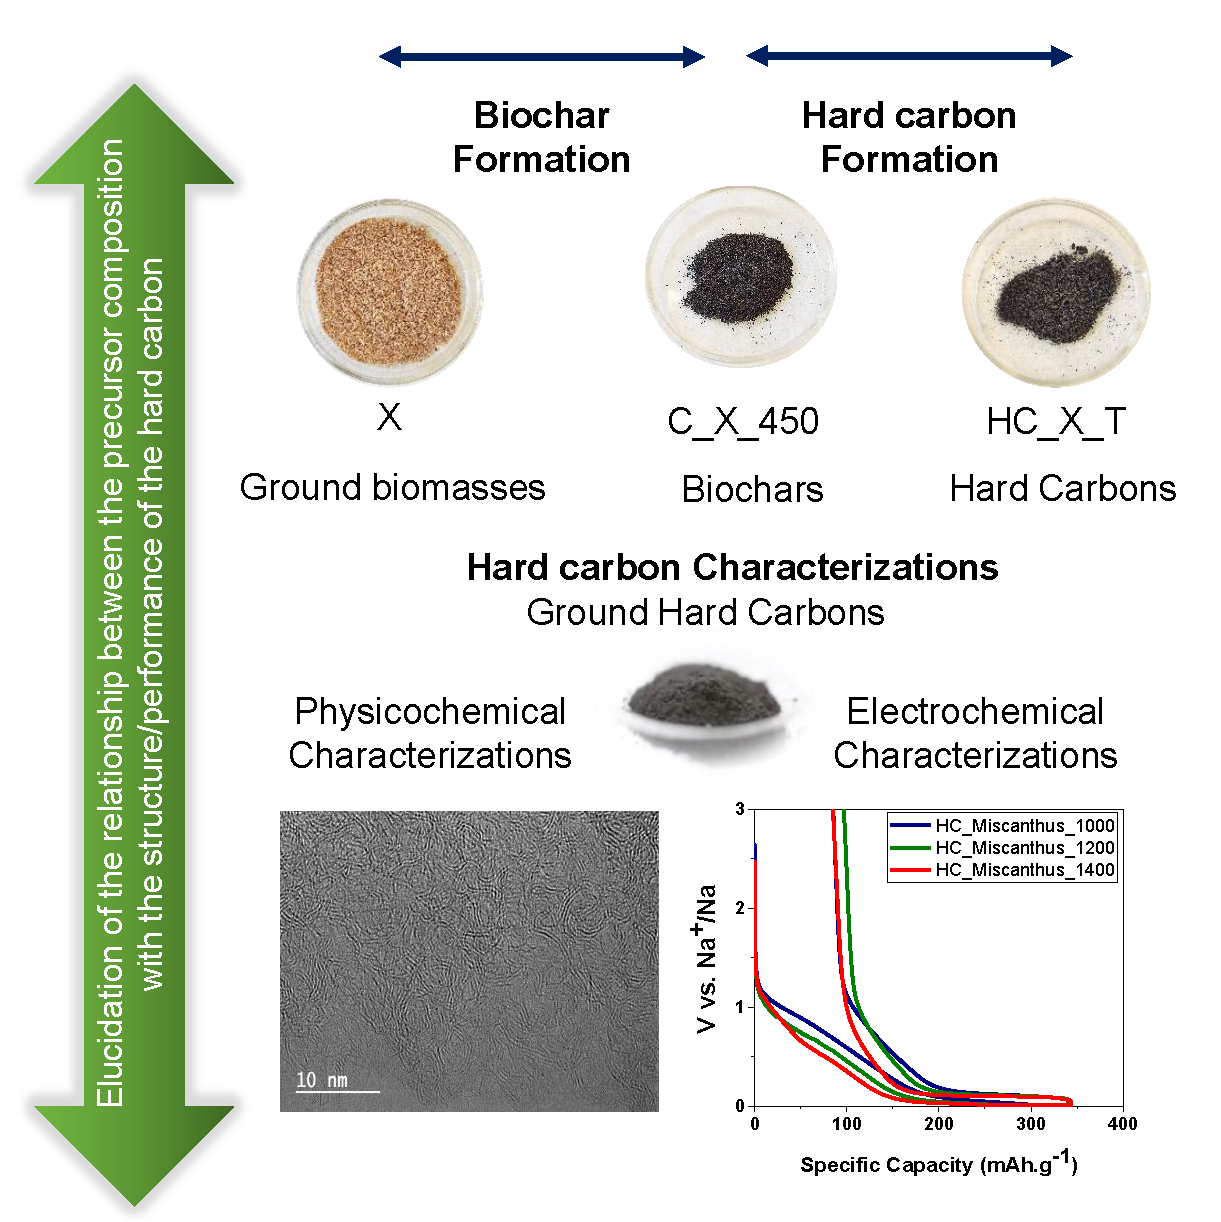
As the literature suggests, there is still a lack of comprehension regarding the impact of the biomass composition, both organic and inorganic fractions, in the achievement of the hard carbon properties among thermal treatment. Therefore, the present study aims to fill in this gap and elucidate the main influence of the biomass composition in the hard carbon properties and performance. This was achieved by studying four biomasses with different compositions, treated at different pyrolysis temperatures.
3. Results and Discussion
3.1. Biomass, Biochar, and Hard Carbon Composition
Table 1 summarizes the composition of the four selected biomasses. Overall, elemental analysis indicated that the four biomasses are mainly composed of carbon and oxygen, containing between 45% and 52% of carbon and 39% to 44% of oxygen, on a weight-moisture-free basis (
wmf). Pine exhibited the highest carbon content while wheat straw presented the lowest content. Beechwood and miscanthus exhibited the highest oxygen content. Hydrogen is the third most abundant element (around 6%wmf), followed by nitrogen, which is present in a lower magnitude than the latter elements (from 0.1% to 0.8%wmf). A high amount of carbon in the biomass precursor may assure a richer carbon content in the final hard carbon, thus enhancing the conductivity of the active material. A higher oxygen content may result in a higher reticulate structure [
6], therefore reducing the graphitic domains and enhancing the sodium uptake.
Regarding the structural biopolymers, cellulose content ranged between 33% and 45%wmf, while hemicellulose and lignin contents were both between 20% and 28%wmf. Woody biomasses, pine and beechwood, showed a higher amount of lignin in the structure. In addition, hemicelluloses in coniferous woods such as pine, were mainly composed of mannan, which is a six-carbon units polysaccharide, while for deciduous wood such as beechwood, the main hemicellulose polysaccharide was xylan (five-carbon units). Xylan is also the major hemicellulose component for grasses such as miscanthus and some agricultural species, such as wheat straw [
8,
41]. Wheat straw presented the highest ash content, followed by miscanthus. Importantly, the major inorganic element in wheat straw ash, and also in miscanthus ash, was silicon, coming from the mineral silica present in the structure [
9]. It is associated with the presence of biological bodies called phytoliths, which are thought to be important for the growing, mechanical strength, rigidity, defense and cooling of the plant [
42]. Additionally, calcium and potassium elements were found in high concentration on these biomasses. On the other hand, pine and beechwood ash were mainly composed of calcium, together with potassium and silicon in the case of pine. Inorganic compounds present in biomass may play an important role during the pyrolysis process in the whole temperature range, and consequently, they may affect the final structure of the hard carbon and the sodium storage processes during the electrochemical cycling. In particular, potassium and calcium can participate as catalytic agents enhancing char formation and solid yield [
14]. Some metals present in biomass such as calcium, magnesium, or iron can enhance the graphitization of nongraphitic carbons during the thermal treatment [
43,
44], therefore producing hard carbons with a lower sodium uptake capacity. Potassium and sodium are also activation agents for the carbonaceous structure, producing a higher surface area, thus promoting a higher Solid Electrolyte Interface (SEI) formation in hard carbon during the first cycles [
45]. However, the role of silicon in biomass pyrolysis, char formation or hard carbon structure, is not well identified in the literature.
The obtained values for the elemental and macromolecular compositions of all the biomasses precursors were in the ranges reported in the literature [
9,
11].
The evolution of the carbon and oxygen content of the resulting biochars and hard carbons is presented in
Figure 2. All the biochars exhibited a significant increase of carbon content and a sharp diminution of heteroatoms, especially oxygen, with temperature. The woody and miscanthus biochars showed an increase of over 50% in their carbon content compare to their biomass precursors. For wheat straw biochar, carbon content increased only in 40%. Regarding oxygen evolution, all the biochars showed a significant loss of 60% in their oxygen content, concerning the biomass precursor. This major evolution is explained by the macromolecules degradation reactions. Until 450 °C, the initial stage of pyrolysis takes place and comprises the main degradation stages for cellulose and hemicelluloses. Lignin degradation is completed at higher temperatures, around 800 °C. Several reactions take place simultaneously in this initial stage and are classified as primary and secondary reactions. Primary reactions comprise the char formation, the depolymerization, and the fragmentation of the macromolecules. Secondary reactions occur within the products of the primary reactions and the remaining reactants to undergo cracking or recombination. These reactions produce permanent gases (CO, CO
2, CH
4, and H
2) and condensable species called tars (water vapor, carbonyls, alcohols, heterocyclic compounds, carbohydrates, phenolic compounds, aromatics of single ring and polyaromatic hydrocarbons) [
14]. At low temperatures and slow heating rates, the char formation reaction is enhanced; therefore, carbon concentration increases while oxygen and hydrogen are released in the gas and the tar products, as was seen for all the obtained biochars. While the extractive compounds are also volatilized through primary pyrolysis, the inorganic fraction is fully preserved at 450 °C [
14], thus explaining the lower carbon content of the wheat straw biochar. Biochar yields can be expressed on a dry ash free basis (DAF) at this temperature and were, 26%, 28%, 25% and 24% for C_pine_450, C_beechwood_450, C_miscanthus_450 and C_wheat straw_450, respectively.
During the second pyrolysis stage of the obtained biochars, the macromolecules degradation reactions that produce permanent gases and tars are almost completed at 1000 °C. From this temperature, mostly a structural reorganization of the carbon matrix is taking place. This high temperature treatment leads to an increase of the aromatization of the solid releasing mainly hydrogen as the gas product [
46,
47]. This is confirmed by the fast decrease of the H/C ratio with temperature (
Figure 2b), indicating the increase of the aromatization degree of all the samples.
Overall, with the increase of the pyrolysis temperature from 1000 °C to 1400 °C, an increase of the carbon content and a decrease of the oxygen and hydrogen content was seen for all the resulting hard carbons, as evidenced in
Figure 2a.
HC_pine_1000, HC_Beecwood_1000 and HC_miscanthus_1000 gained 20%, 18% and 16% of carbon content in their structures, compared to the biochar. HC_wheat straw_1000 only gained 12%. From 1000 °C to 1400 °C, HC_pine_1400 and HC_Beecwood_1400 only gained 5% additional carbon, presenting a final carbon content of over 98%wmf. HC_miscanthus_1400 and HC_wheat straw_1400 gained 7% and 18% of carbon, with 93%wmf and 83%wmf of final carbon content, respectively. Miscanthus and wheat straw derived hard carbons concentrated more carbon at higher temperatures than pine and beechwood derived hard carbons, however, their final carbon content was lower. Moreover, wheat straw derived materials, presented a more important carbon concentration from 1000 °C to 1400 °C than from 450 °C to 1000 °C. This might be related to the late volatilization of inorganic compounds trapped in the carbonaceous matrix at higher temperatures. Moreover, the lower carbon content of miscanthus and wheat straw derived hard carbons might not be only related to their higher inorganic fraction content, but also, to their catalytic effect. Considering the important concentration of potassium in miscanthus and wheat straw precursors, an intrinsic activation of the carbonaceous matrix could proceed, generating porosity and therefore, consuming carbon that is lost in the form of CO or CO2 gases (Equations (1) and (2)).
The transition from biochar to hard carbon at 1000 °C implies another important reduction of 70% and 62% of oxygen for HC_pine_1000 and HC_Beecwood_1000, respectively. However, the decrease of oxygen content from the biochars to HC_miscanthus_1000 and HC_wheat straw_1000 only accounts for 38% and 21%, respectively. From 1000 °C to 1400 °C, HC_pine_1400 and HC_Beecwood_1400 lost 58% and 71% of oxygen, respectively, while HC_miscanthus_1400 and HC_wheat straw_1400 lost 75% and 73%, respectively. Oxygen content for all the hard carbons obtained at 1400 °C is very similar and ranged between 2 and 3.5%wmf. However, as for carbon evolution, the most important oxygen loss for miscanthus and wheat straw materials occurred at elevated temperatures, suggesting that there is also inorganic oxygen that is released with volatilization.
These results seemed to indicate that from 450 °C to 1000 °C, biochars rich in inorganic compounds, such as miscanthus and wheat straw, present a rather stable behavior. They exhibited smaller variations of their carbon and oxygen contents, than woody derived samples, because of the ash fraction concentration. The catalytic effect towards char formation of calcium and potassium in the former samples could also be responsible for this stability. Moreover, the arrangement of the biopolymers might also have a role in this temperature range. Wheat straw and miscanthus cell walls present a more complex and cross-linked arrangement, within more chemical functionalities than the one of woods [
41], possibly requiring higher amounts of energy for decomposing.
With further thermal treatment, the interaction within inorganic compounds and the carbonaceous substrate may be stronger, because of the concentration of inorganics. The volatilization of this important fraction can promote side reactions such as intrinsic activation by the action of potassium compounds or the formation of more thermally stable inorganic phases such as carbides, which might contribute to important fluctuations in the hard carbons composition. In here, woody biochars degradation is faster, and at 1000 °C a high content of carbon and a negligible content of oxygen is reached, that slightly fluctuates with further thermal treatment, most probably related to their limited inorganic content.
3.2. Structural Results
The XRD patterns for the biomass precursor, the intermediate biochar, and the final hard carbons are presented in
Figure 3. All the biomass precursors showed the typical XRD pattern characterized by the presence of two broad diffraction peak lines of Iβ-cellulose: (110) around 15-2θ degrees, and (200) around 22-2θ degrees [
48], while hemicellulose and lignin only contributed to the diffuse scattering given their amorphous nature [
49]. XRD patterns also evidenced the inorganic compounds contained in the biomass precursor. This is the case for beechwood and wheat straw, where silica peaks (SiO
2 quartz PDF 04-15-7194) were detected. For pine and miscanthus, there were no peaks for crystalline SiO
2 in the patterns. However, silicon is normally present in biomass as Opal, a hydrated silica with no long-range order of the crystals, which exhibits a XRD signature with a diffuse scattering in the zone of 20–30 2θ degrees [
50].
At 450 °C, the biochar patterns confirmed the degradation of the crystalline cellulose, a very broad feature can be seen near 22-2θ degrees, and SiO2-Quartz peaks (PDF 01-089-1961) were present for all the biochars, together with calcium carbonate (CaCO3 PDF 04-012-0489) in C_miscanthus_450. For the hard carbons obtained from 1000 °C, there were two distinct signatures in the XRD patterns. The analysis was separated into the woody derived hard carbons (from pine and beechwood biomass precursors) and the nonwoody derived hard carbons (from miscanthus and wheat straw biomass precursors).
For the woody derived hard carbons, the XRD patterns exhibit the typical pattern of hard carbon with the (002) and the (100) peaks around 23 and 41-2θ degrees, respectively. The interlayer space, d
002 distances calculated from the baseline-corrected patterns are reported in
Table 2. The (002) peak shifted towards higher angles with the thermal treatment, and consequently, the average interlayer spaces decreased with temperature for beechwood derived hard carbons. For the pine derived hard carbons, HC_Pine_1000 and HC_Pine_1400 showed very close 2θ peak positions and hence, d
002 interlayer space.
For miscanthus and wheat straw hard carbons, the characteristic hard carbon pattern was seen for the samples obtained at 1000 and 1200 °C, presenting SiO
2 and potassium carbonate (K
2CO
3 PDF 00-011-0655) peaks. The presence of K
2CO
3 might evidence the intrinsic activation phenomena of the carbonaceous matrix mentioned before. K
2CO
3 could be produced from the decomposition of potassium containing minerals present in the parent biomass. Equations (1) and (2) describe the general activation mechanisms of carbon by K
2CO
3 [
51]. K
2CO
3 decomposes at high temperature, normally over 700 °C, producing CO
2 (Equation (1)) that will further react with the carbonaceous substrate to create microporosity (Equation (2)) [
51]. Notice that the potassium carbonate is hydrated; however, this water does not come from the pyrolysis products, but rather from the ambient moisture absorbed by the sample.
Furthermore, at 1400 °C, the miscanthus and wheat straw derived hard carbon patterns strongly differed from those of woody biomasses. They presented an asymmetric (002) peak and there were important peaks related to silicon carbide (SiC) compounds that overlap in the patterns. According to the diffraction database, the detected peaks correspond mainly to Si
3CaC
4 (PDF 01-82-3652), to SiC (Moissanite, PDF 00-29-1129), and to a lower extend to SiCN (PDF 01-074-2308). The SiC compounds peaks are better developed for HC_wheat-straw_1400 because of the higher silicon content in the precursor. Calculations for d
002 interlayer space of miscanthus and wheat straw hard carbons were difficult to interpret, given the nonasymmetric nature of the (002) peak. Moreover, near 26-2θ degrees, HC_miscanthus_1400 and HC_wheat-straw_1400 exhibited a sharper fraction of the 002 peak, related to a carbonaceous phase with a higher degree of graphitization [
52].
Previous studies have suggested the catalytic effect for graphite formation when organic precursors are co-pyrolyzed with calcium-containing compounds [
44]. Therefore, the sharp embedded 002 peak for miscanthus and wheat straw hard carbons at 1400 °C could indicate the presence of a highly oriented graphitic domain in the structure of these hard carbons. Miscanthus and wheat straw precursors presented indeed, larger calcium content in the parent precursors when compared to the woody biomasses, as can be seen from
Table 1.
TEM images obtained for HC_miscanthus_1400 and HC_wheat-straw_1400 (
Figure 4c,d) revealed the typical disordered arrangement of short-range stacked graphene layers and ultramicropores. Additionally, these hard carbons also presented regions where numerous graphene layers stacked along several nanometers, creating long-range graphitic domains. These observations confirmed that the peak observed near 2θ-26 degrees in the XRD patterns, corresponds to a graphitic-like domain. Moreover, TEM images revealed the presence of whiskers at the carbonaceous surface and embedded nanoparticles (
Figure S1 of Supplementary Materials), both containing a significant amount of silicon, according to the EDX analysis (
Table S1 of Supplementary Materials). TEM images for HC_pine_1400 and HC_beechwood_1400 (
Figure 4a,b) evidenced the typical disordered arrangement of short-range stacked graphene layers for both hard carbons. However, HC_pine_1400 revealed the presence of more organized zones (
Figure S2 of Supplementary Materials), with the presence of confined nanoparticles in the carbonaceous structure too, although, not as important as for HC_miscanthus_1400 and HC_wheat straw_1400. Silicon content in pine is lower than for miscanthus and wheat straw, however, is higher than in beechwood. This concentration might not be enough to produce homogeneous silicon carbide particles in the sample, and are not detected XRD phases such as for miscanthus or wheat straw hard carbons.
The important graphitic domains present in miscanthus and wheat straw derived hard carbons might strongly affect the sodium uptake of the material, limiting the reduction capacity of the electrodes or even irreversibly trapping the ions that could be inserted in these organized domains.
The I
D/I
G ratios derived from the Raman measurements are reported in
Table 2 and the fitted spectra are shown in
Figure S3 of Supplementary Materials. The I
D/I
G ratio is commonly used to analyze the degree of organization of the carbon structure in hard carbons. The D band is related to the graphitic lattice vibration mode with in-plane imperfections, such as defects or heteroatoms, and the G band is related to the stretching vibration mode in the aromatic layers of a graphitic crystal [
53,
54]. Raman results interpretation can be ambiguous, and different explanations for the variation of the I
D/I
G ratio are found in the literature for hard carbons. In this study, the I
D/I
G ratio decreased with thermal treatment for all the hard carbons. This is in agreement with the higher aromatization degree and the lower quantities of heteroatoms at higher temperatures. This behavior indicated that there is a more organized structure at higher temperatures with a lower content of structural defects. The lowest I
D/I
G ratio was found for HC_wheat straw_1400, which is in correlation with its higher graphitic-like domain as shown by XRD and TEM observations. Interestingly, HC_miscanthus_1400 showed the highest I
D/I
G ratio, indicating that despite its graphitic domains, its defects quantity is significant at 1400 °C. Additionally, I
D/I
G ratio for pine hard carbons did not significantly vary with temperature, confirming also the XRD results, where a stable value of d
002 interlayer space was found. The particular observations for the structure of pine derived hard carbons could suggest that this material does reach a very stable structure at lower pyrolysis temperatures than for the other precursors. The reason behind this behavior might be related to its higher carbon content, lower content of ash and less complex macromolecular arrangement, when compared to beechwood precursor.
3.3. Surface Results
The images revealed that the morphology of hard carbons derived from woody precursors remained stable with the thermal treatment. Given the natural macroporosity of biomass, the volatiles formed at slow heating rates are able to transport through the carbon matrix without major morphological alterations [
14]. The EDX analysis reported in
Table S2 of Supplementary Materials, showed that mainly carbon is present in the surface of these samples, followed by oxygen. Very small peaks of potassium and calcium were detected on the surface, which is consistent with the inorganic composition of the biomass precursor. For the miscanthus and wheat straw series of hard carbons, an evolution of the surface morphology is seen. For HC_miscanthus_1200, spherical agglomerates are formed all over the surface that are related to an intermediate state of silica (SiO
2)
, prior to a carbothermal reduction reaction to produce SiC (see
Figure S6b of Supplementary Materials). This behavior has been observed by other authors [
42] using babasu coconut as a precursor. Furthermore, HC_miscanthus_1400 rather exhibited whiskers on the surface (
Figure 5e,f), confirming the formation of SiC whiskers, as observed as well by Yapachura et al. [
42] and Chiew et al. [
55]. The formation of SiC whiskers is more obvious for HC_wheat_straw_1400, because of the higher initial content of silicon in wheat straw biomass (
Figure 5g,h). An EDX cartography over the surface of HC_wheat straw_1400 is shown in
Figure S8 of Supplementary Materials, where silicon and carbon are detected in the whiskers locations. The EDX analysis further confirmed a significant content of silicon for the formed whiskers, while over the surface without whiskers, carbon was the main element present (see
Table S3 of Supplementary Materials). The latter results confirmed the formation of the SiC phase detected by the XRD observations for HC_miscanthus_1400 and HC_wheat straw_1400.
The nitrogen (N
2) adsorption/desorption isotherms for all the hard carbons are shown in
Figure 6 while the carbon dioxide (CO
2) isotherms are shown in
Figure S9 of Supplementary Materials. Regarding the woody precursors, N
2 isotherms presented the typical curves of microporous materials, which are more evident for the hard carbons synthesized at 1000 °C. Miscanthus samples also presented a microporous curve signature, while wheat straw hard carbons developed the typical isotherm of mesoporous materials at 1400 °C, presenting some hysteresis related to the condensation of the adsorbate on the surface. The CO
2 isotherms for all the samples are characteristic of microporous materials, as observed for other hard carbons [
56].
Figure 6e reports the N
2 specific surface area (SSA) of all the obtained hard carbons. As expected, most of the obtained hard carbons presented very low and stable values of N
2 SSA at this range of temperature, of under20 m
2·g
−1. In carbon materials derived from biomass, micro and mesoporosity is created upon pyrolysis, and a maximum in the surface area is commonly seen between 600 and 800 °C, for woody biomass [
14]. Furthermore, at higher temperatures, the surface area decreases because of the pore blocking by the tar’s secondary reaction products, giving place to closed pores, explaining the rather stable behavior of the N
2 SSA of obtained hard carbons from 1000 °C [
57]. However, there were some unusual behaviors. First, regarding the HC_pine_1000, note that it exhibited a very high N
2 SSA of 141 m
2·g
−1, compared to the hard carbon obtained at the same temperature for beechwood (16 m
2·g
−1). This could be explained by their different organic composition, pine being a coniferous wood and beechwood being a deciduous wood. This affects the macromolecular arrangement of the plant cell wall, inducing different types of macro and mesoporosity in the biomass precursor [
58], which are further enhanced by thermal treatment and might even remain at 1000 °C. Darmawan et al. [
58] suggest in their study that coniferous woods such as pine have a higher potential to produce porous carbons, given the particular arrangement of cellulose microfibrils in the structure that degrades easily compared to those of deciduous woods, such as beechwood. Nevertheless, N
2 SSA for pine significantly drops at 1200 °C, presenting the same trends of N
2 SSA values as beechwood. In contrast, the N
2 SSA for the hard carbons derived from wheat straw increased with temperature. This augmentation of the N
2 SSA can be explained by two important contributions. First, there is the effect of the SiC whiskers growth over the carbonaceous surface, that might contribute to an increase of the mesoporous volume. As seen by XRD and SEM results, these whiskers are only present at 1400 °C, explaining why their effect is more important at higher temperature. Second, the presence of K
2CO
3 revealed by the XRD data suggests that intrinsic activation of the carbonaceous structure has occurred in this material because of the content of potassium in the raw biomass. Potassium compounds such as K
2CO
3 are used to activate carbons and produce porous materials, by the mechanisms described before (Equations (1) and (2)).
Regarding the CO
2 isotherms, the obtained CO
2 SSA values for all the hard carbons at 1000 °C are significantly higher than the N
2 SSA values (see
Figure 6f). This is in agreement with the better accessibility of the CO
2 molecule to smaller pores (<1 nm) given the faster kinetics of this measurement. In this case, the CO
2 SSA strongly decreased with temperature for all the samples. The decrease in CO
2 SSA and pore volume can be explained by the coalescence of the micropores that were present at 1000 °C. Given that at these elevated temperatures, almost all of the volatiles have been removed from the solid structure, the coalescence of the pores is thought to come from a microstructural reorganization, rather than from a tar recondensation on the pore walls [
59]. Notice that the HC_miscanthus_1000 presented the highest CO
2 SSA of all the samples. For miscanthus, it is possible that the intrinsic activation of this sample has taken place before 1000 °C given the lowest concentration of potassium when compared to wheat straw. Moreover, it seemed that the miscanthus activation gave place to microporosity development rather than to mesoporosity, as in the case of wheat straw hard carbons.
For almost all of the obtained hard carbons, the CO
2 SSA values were higher than the N
2 SSA values at 1400 °C, as seen in
Figure 6f. This suggests that the structure at this temperature presented an important quantity of small inaccessible micropores. However, wheat straw hard carbon exhibited a higher N
2 SSA than CO
2 SSA at 1400 °C, thereby suggesting that all its pores are accessible and are rather big, even at 1400 °C.
The pore size distributions for the samples are presented in
Figures S10 and S11 of Supplementary Materials for all the hard carbons. The average pore size does not clearly change with the temperature treatment for both N
2 and CO
2 isotherms. Instead, most of the distributions are not centered in a single pore size, but have two main values. This behavior is more visible for wheat straw derived hard carbons in the N
2 isotherms, showing a microporous (0.9 nm) and a mesoporous (22 nm) pore size, which does not vary significantly with temperature. Pore sizes from CO
2 isotherms for all the hard carbons seem to be center at 0.5 nm.
SAXS observations for woody derived hard carbons confirmed that the size of the micropores did not vary significantly in this range of temperature.
Figure 7c reports the obtained values for the radius of gyration (Rg) of these materials, which were around 5 to 7 Å. These values are consistent with the CO
2 pore size distributions. This behavior is coherent with the observations of Simone et al. over hard carbons derived from cellulose, were the Rg was rather constant between 1000 °C and 1400 °C [
40]. For miscanthus and wheat straw derived hard carbons, the SAXS patterns exhibited an unusual shape with a limited Guinier domain (
Figure 7b), because of the effect of silicon compounds that seems to mask the diffusion signal of the carbonaceous matrix. This indicates that silicon compounds are not only present over the surface but also in the bulk of these materials, as elucidated by the spherical nanoparticles found by TEM observations. Additionally, the intensity at higher Q values is higher for wheat straw derived hard carbons, than for the other derived hard carbons, which indicates that there is a higher surface area contribution for the former hard carbons, in agreement with the N
2 SSA obtained values.
3.4. Electrochemical Results
We have seen in the previous section that woody derived hard carbons exhibited different structural and surface characteristics than miscanthus and wheat straw derived hard carbons. These differences are expected to impact the electrochemical performance of the electrodes. Given the high carbon purity of the woody derived hard carbons, together with their typical turbostratic structure, these hard carbons are expected to show the best electrochemical performances.
Figure 8 shows the profiles for the first reduction–oxidation cycle of all the hard carbons. The reduction capacity accounts for the total amount of sodium ions that the material can store, while the oxidation capacity quantifies the sodium ions that are recovered from the structure, and thus is referred to as the reversible capacity of the material. Woody derived hard carbons presented the best performances for all three temperatures, with rather close values of reversible capacity and ICE. HC_pine_1400 exhibited the highest reversible capacity with 315 mAh·g
−1 and an ICE of 84%, while HC_pine_1200 showed the highest reduction capacity with 380 mAh·g
−1, together with a high reversible capacity of 304 mAh·g
−1. These are outstanding values when compared to the performance of the hard carbon derived from commercial cellulose at 1400 °C previously reported by Simone et al., with 310 mAh·g
−1 and 83% of ICE [
40]. For HC_beechwood, the highest reversible capacity was obtained at 1200 °C (309 mAh·g
−1), while its best ICE was obtained at 1400 °C (85%). Hard carbons from wheat straw showed the lowest values of both reduction and reversible capacities and ICE for all the temperature range. The best performance was for HC_wheat straw_1400 with 200 mAh·g
−1, while the ICE was barely 60%. Hard carbons from miscanthus exhibited an intermediate performance between woody derived hard carbons and HC_wheat-straw, whatever the temperatures. Its highest reversible capacity was given at 1400 °C with 254 mAh·g
−1 and 74% of ICE.
When analyzing the electrochemical performance as a function of the thermal treatment, the results showed that the reduction capacity does not vary in the same way for all of the hard carbons. It remains almost constant for pine and miscanthus derived hard carbons. For beechwood hard carbons, it presents a maximum at 1200 °C, while for wheat straw, it increases significantly with temperature. Normally, the reduction capacity is associated, among other properties, with a higher SSA of the material. However, notice that not N2 SSA nor CO2 SSA seem to be correlated with the fluctuations of the reduction capacity for woody and miscanthus hard carbons. However, in the particular case of wheat straw hard carbons, the increase of the reduction capacity is in agreement with the increase of their mesoporous surface area. However, HC_wheat straw_1400 showed the lowest reduction capacity, despite its highest N2 SSA, because of its low carbon content. The final carbon content seemed to be correlated to the reduction capacity for all hard carbons at each temperature. This is in agreement with a lower quantity of impurities in the active material that are not participating in the sodium uptake mechanisms. Additionally, TEM observations revealed the presence of graphitic domains in the structure of miscanthus and wheat straw derived hard carbons. These graphitic structures do not favor the uptake of sodium ions and therefore, the reduction capacity is expected to be reduced.
Moreover, the growth of SiC whiskers over the surface of the carbonaceous matrix in these materials also might contribute to the decrease of the sodium uptake capacity. SiC compounds are isolating materials, which might damage the electronic and ionic conductivity of the electrode and be inert to the electrochemical reactions in the system. These observations suggest that a single parameter cannot be correlated to the reduction capacity of each material, as several phenomena are taking place in the carbon structure at the same time, especially for the hard carbons with an important inorganic fraction, such as miscanthus and wheat straw derived hard carbons.
The reversible capacity did not show either a clear trend with temperature for any of the hard carbons, but it presented again the lowest values for wheat straw derived hard carbons. This confirms the detrimental role of poor carbon content, SiC whiskers and the graphitic domains in these structures, however, the dominant detrimental effect is difficult to identify with the performed observations and further research is needed. Coulombic efficiency for woody hard carbons presented a small increase with temperature, but for wheat straw hard carbons, it decreased with temperature. In this case, the higher N2 SSA area of the wheat straw hard carbon at 1400 °C can explain its lower reversible capacity because of a higher SEI formation over its surface. However, pine hard carbon obtained at 1000 °C showed N2 SSA four times bigger than the one of wheat straw hard carbon at 1400 °C, and the former hard carbon did not show a lesser reversible capacity, nor a significant increase with temperature. Therefore, for wheat straw hard carbons, it is again the combination of several structural factors that account for its high irreversibility. The important graphitic domains of miscanthus and wheat straw hard carbons, might contribute to the low ICE and reversible capacity of these hard carbons, as the few inserted sodium ions might not be able to leave the carbonaceous matrix during oxidation. This suggests that the generated irreversibility is not only coming from the formation of the SEI layer over the carbonaceous surface for these hard carbons, but also, from structural trapping of sodium ions in the hard carbon. For HC_wheat-straw_1400, this is in agreement with the lowest observed ID/IG ratio, indicating a higher degree of graphitization in this material.
Remarkably, the plateau and the slope capacities of the first reversible capacity clearly varied with temperature treatment for all the hard carbons. Plateau capacity increased while the slope capacity decreased with temperature, as can be seen from
Figure 9. Overall, the increase of the plateau capacity with temperature seemed to be correlated to the decrease of the CO
2 SSA and volume, for all the hard carbons, even miscanthus and wheat straw derived. As suggested recently in previous works [
56], the plateau capacity might be related to the insertion of the sodium ions in the interlayer space of the turbostratic domains (non-long-range graphene stacked layers). Therefore, a decrease in the CO
2 SSA and volume implies a densification of the turbostratic domains, explaining the increase of the contribution of the plateau capacity with temperature. Even if miscanthus and wheat straw hard carbons presented actual graphitic zones (long-range stacked graphene layers), they also exhibit turbostratic domains as demonstrated by TEM observations, and therefore, the sodium uptake from these disordered domains followed the same trends as for woody hard carbons.
On the other hand, Bommier et al. [
60] had correlated the diminution of the slope capacity with temperature to the diminution of microstructural defects, observed by the diminution of the I
D/I
G ratio. They attributed the slope capacity to the interaction of sodium ions with a wide morphological variety of defects in the hard carbon structure, such as dangling and sp
3 bonded carbon at the edges of the pseudographitic domains, mono and di vacancies, stone wales defects and extreme graphene curvature. The results clearly followed the same trend for the hard carbons derived from woody precursors, which presented the purest carbon structures. Note that the diminution of the slope capacity is less important for pine than for beechwood derived hard carbons, which is consistent with the rather stable structure of pine derived hard carbons in this range of temperature. On the other hand, miscanthus and wheat straw hard carbons also exhibited a diminution of the slope capacity with temperature, but the correlation to their defects concentration is not as direct as for woody precursors. Once again, it is difficult to attribute a single structural parameter to the mechanisms of sodium ions storage in these hard carbons, because of the parallel effects of the graphitic domains, the porosity and the SiC whiskers.
The average oxidation voltage also decreases with temperature (see
Table 3), as the plateau capacity increases, flattening the galvanostatic curves. HC_wheat-straw_1400 does not follow this trend as its plateau capacity did not significantly vary with temperature, harmed by its structural characteristics and low carbon content.
A higher carbon purity of a hard carbon implies that there will be more available active material to store sodium ions. Moreover, the lower content of impurities also improves the electronic and ionic conductivity of the hard carbon electrode. A low N2 SSA in a hard carbon will limit the formation of the Solid Electrolyte Interface formation (SEI) that occurs during the first reduction of the electrodes and irreversibly consumes sodium ions, therefore reducing the capacity of the electrode. Finally, the turbostratic structure is of major importance, as sodium ions are not favorable to be stored in organized graphitic-like domains. The turbostratic arrangement of the graphene sheets in a hard carbon, together with the presence of ultramicropores, will ensure the storage of sodium ions. The mechanisms that are responsible for the sodium ions storage at each point of the reduction are still under debate; however, it is well known that these parameters are crucial to obtaining higher capacities.
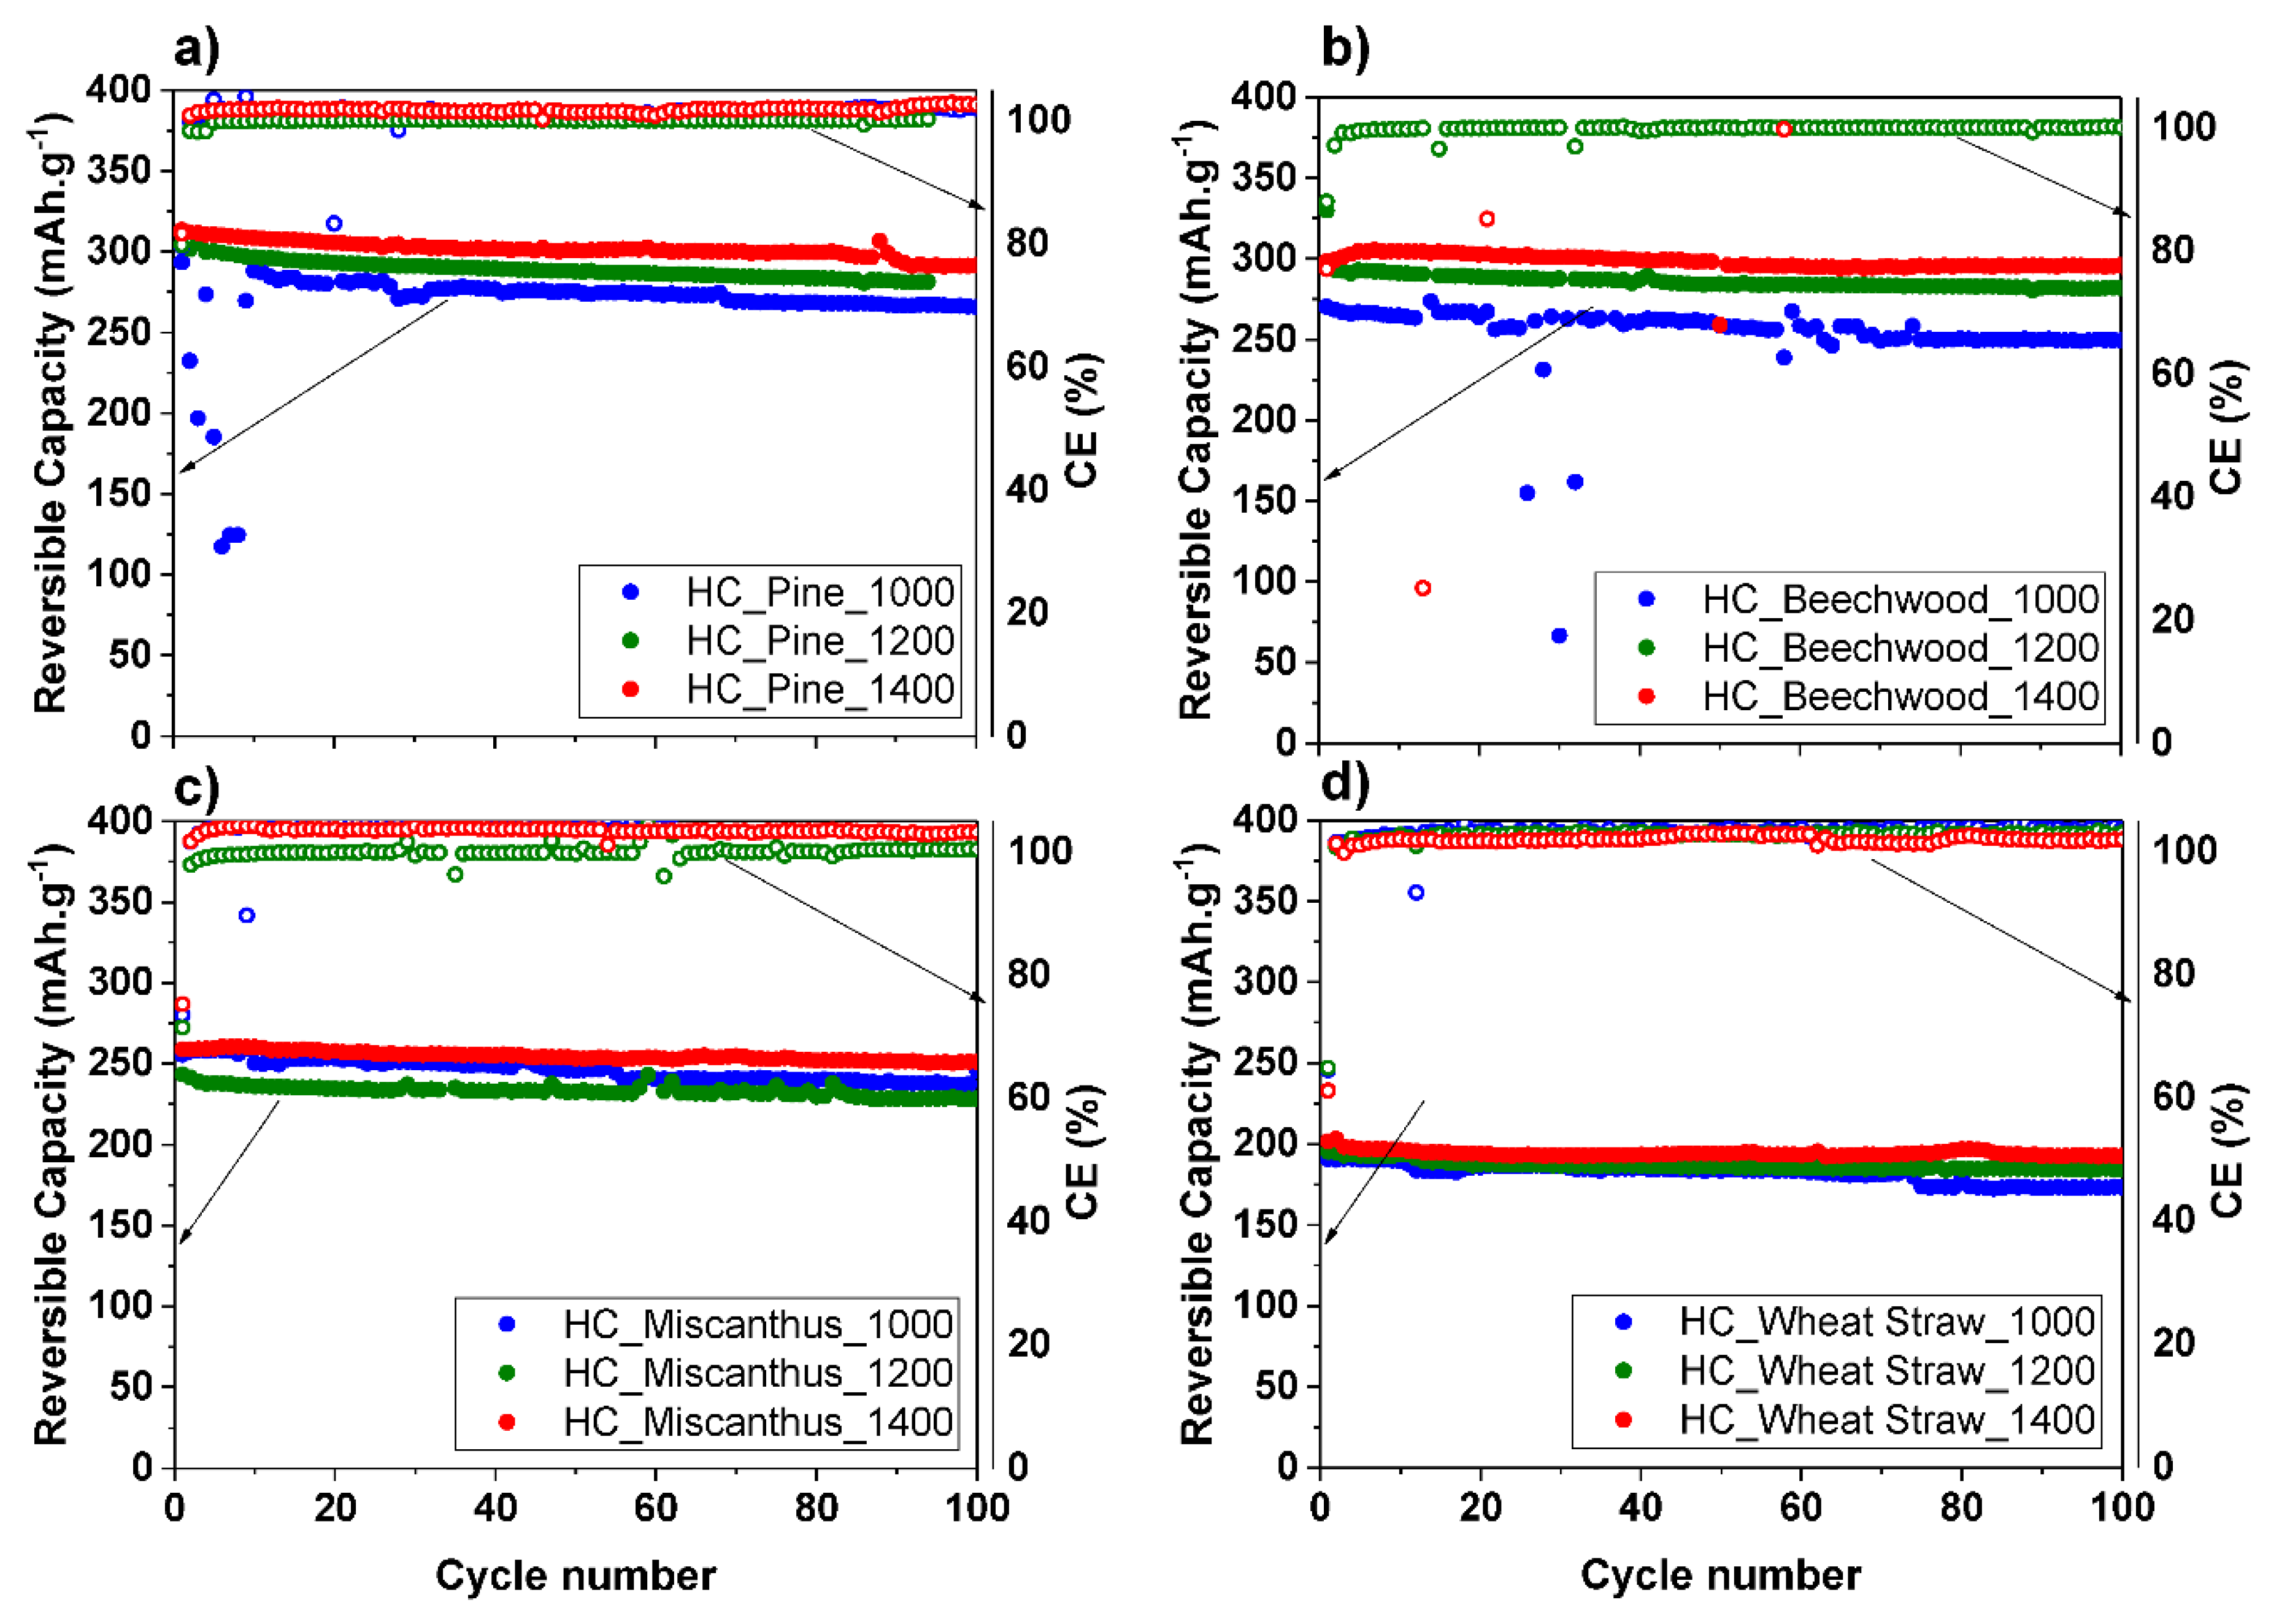
Concerning the cyclability, all the samples exhibited a stable behavior up to 100 cycles at C/10 rate, as can be seen from
Figure 10. Among all the materials, the hard carbon obtained at 1400 °C presents the best retention capacity over cycling. Interestingly, miscanthus and wheat straw derived hard carbons exhibited a very stable cyclability in spite of its low capacity of sodium storage. The coulombic efficiencies for all the samples also stabilized after the initial cycles, to reach values up to 100% during cycling.
The atypical points in the cyclability curves for HC_pine_1000 could be related to a limited electrolyte wettability at the beginning of cycling that improves with time, while in the case of HC_beechwood_1000 is more likely associated with other phenomenon, such as preferential dendrite formation at the edges of the sodium electrode, the presence of gas bubbles producing sudden disruptions or the misalignment of the half-cells constituents. However, more insights regarding these aspects are needed.
4. Conclusions
In this study, four biomass precursors were used to obtain hard carbons at three different temperatures. The results showed a clear impact of both biomass composition and thermal treatment on the morphology, surface and microstructure of the hard carbons, and therefore, on their electrochemical performance. Interestingly, the punctual effect of the hard carbon properties in the performance of the resulted hard carbons seemed to be more affected by the composition of the initial biomass precursor than by the thermal treatment at the range of temperature used. Woody derived hard carbons exhibited typical hard carbon characteristics, such as low impurities, low N2 SSA and turbostratic structure. Nonwoody derived hard carbons (from miscanthus and wheat straw precursors) exhibited atypical hard carbon characteristics such as high specific surface area (N2 SSA), high content of impurities, graphitic-like domains and a phase of apparently inert SiC.
These observations were reflected in the electrochemical performances of all the hard carbons. Woody derived hard carbon showed the highest reduction and reversible capacity at all temperatures, as well as the highest ICE. This could be related to their higher carbon content and turbostratic structure. In contrast, nonwoody derived hard carbons, especially the ones obtained from wheat straw, showed the poorest reduction and reversible capacity at all the temperatures. This was correlated with their lower carbon content, the presence of SiC whiskers, and graphitic domains, particularly at 1400 °C. Miscanthus hard carbons exhibited reduction and reversible capacities in-between the woody and the wheat straw hard carbons, owing to its lower impurities amount compared to wheat straw hard carbons. For all of the hard carbons, the plateau capacity increased with temperature and was correlated with the increase of the turbostratic domains in the structure, while the slope capacity decreased with temperature and was correlated with the decrease of the defects concentration. All of the obtained hard carbons exhibited a stable cyclability behavior up to 100 cycles and a better capacity retention at 1400 °C.
The presented findings confirm the importance of the precursor choice in the hard carbon preparation and evidence the critical role of inorganic matter in the biomass precursors. Results indicated that there seems to be a critical inorganic concentration and composition in biomass, which will significantly affect the electrode performance. Moreover, for biomass precursors with low inorganic content, such as pine and beechwood, it is rather the macromolecular composition that seemed to have an influence on the hard carbon development. The latter hard carbons presented outstanding performance, compared to those of pure organic precursors such as cellulose, without any pre or post treatment of the precursors or the hard carbons. Therefore, woody biomasses can be competitive and valuable precursors for hard carbon design for Na-ion batteries.


 and
and 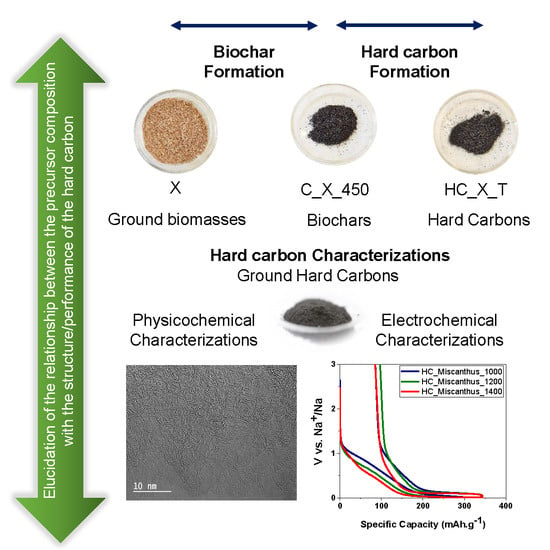


