Abstract
Nearly 30% of humanity lives in earthen dwellings. Earthbag is a sustainable, cheap, feasible and comfortable option for emergency housing. A comparative monitoring-simulation analysis of the hygrothermal behavior of an Earthbag dwelling in Mediterranean continental climate, designed under bioclimatic criteria, is presented. The dome shape Earthbag dwelling has a net floor area of 7.07 m2, a glass door facing south and two confronted windows in the east and west facades. A numerical model (EnergyPlus v8.8) was designed for comparison. Twenty-four hour cross ventilation, night cross ventilation, and no ventilation in free floating mode and a controlled indoor temperature were the tested scenarios. Comparisons between experimental data and simulation show a good match in temperature behavior for the scenarios studied. Reductions of 90% in summer and 88% in winter, in the interior thermal amplitude with respect to exterior temperatures are found. Position of the glazed openings was fundamental in the direct solar gains, contributing to the increase of temperature in 1.31 °C in winter and 1.37 °C in the equinox. Night ventilation in the summer period had a good performance as a passive system. Passive solar gains made a reduction of heating energy consumption of 2.3% in winter and 8.9% in equinox.
1. Introduction
Earthen architecture historically has been widely used for wall construction around the world. According to Minke [1] earth construction has been used for more than 10,000 years. Today, it is estimated that nearly 30% of the world’s population lives in earthen dwellings, not only in developing countries but also in industrialized countries, where using earth as a construction material has raised interest recently, as it is considered an environmentally friendly solution. Particularly, Earthbag (also called Superadobe) is presented as a sustainable, cheap, feasible and comfortable option to improve thermal comfort. Superadobe is a form of Earthbag construction patented and developed by the Iranian architect Nader Khalili, who proposed fundamental rules for the design and building recommendations [2]. Earthbag and Superadobe are building techniques that consist of the use of earth-filled sandbags in order to build structural walls, usually in a dome shape [3]. The dome shape offers more structural integrity and durability than adobe square buildings [4], but also limits its design to 5 m in diameter and one ground floor. The dome shape allows the foundation, load-bearing walls and roof to be built with the same materials and technique. In low-cost buildings, the roof used to be the part of the building with the highest cost. Thus, this building technique is four times cheaper than conventional techniques [5]. When comparing two low-cost earthen buildings, such as Earthbag dwelling and adobe traditional Burkinabe dwelling, the Earthbag one achieves better thermal performances in hot arid climates. In that case, a combination of night ventilation, roof solar protection, and high-inertia of the Earthbag enclosure lead to an almost total elimination of thermal discomfort during the year [6]. Among their possible uses, the Earthbag building is a good solution to temporary emergency housing, as shown in the construction of 14 Earthbag shelters in the refugee camp of Baninajar [7]. The architect Khalili built them for the displaced Iranians in Iraq after a flood. The project also served to assess the feasibility and cost of building with Earthbag and to evaluate the possibilities of Earthbag shelters in the case of a real emergency [8]. Earthbag building has also been used in cooperation projects, such as the construction of part of the Emsimision Training Medical Center in the Boulmiuogou District, in Ouagadougou, Burkina Faso [9]. After the earthquake of 2010 in Haiti, humanitarian aid of different organizations constructed several buildings with Earthbag and Superadobe techniques, such as numerous houses for those affected inhabitants [10], a medical clinic [11], a school for orphans [12], a community center [13], a shelter for children, and some experimental Earthbag buildings for scientific tests [14]. In Nepal, the Small-Earth partnership built an orphanage with Superadobe [15]. Because of the particular location of the orphanage, in a hilly area with difficult access, the Superadobe system was a good choice, since it allows the use of local resources, such as earth and stones, and it only needed to transport bag rolls to the place.
Previous research includes thermally simulated and monitored raw earthen buildings [16,17,18], but not Earthbag buildings yet. This research analyzes the hygrothermal performance and comfort of an Earthbag building located in Mediterranean continental climate by experimentation of a real construction and by energy simulation. Passive design strategies are tested, such as the use of high thermal inertia in the enclosure, the collection of direct solar radiation through the glazed openings and the use of natural ventilation. In this research, energy simulation results are also validated with experimental data.
2. Materials and Methods
2.1. Constructive Characteristics of the Monitored Earthbag Building
The experimental Earthbag building was designed under bioclimatic criteria. The building was constructed with a dome shape following the Superadobe technique. The dome shape allows for the reducing of the shape factor, which is a smaller surface of the building envelope per same volume compared to a cubical shape. It has a net floor area of 7.07 m2, a circular plant of 3 m of diameter, a height of 3.3 m, an envelope surface of 29.96 m2, an interior volume of 17.67 m3, and a shape factor of 1.7 (Figure 1). The Earthbag walls are 35 cm thick, but the buttress is formed by a double Earthbag (70 cm thick). The Earthbag dome roof has an average thickness of 28 cm. The continuous polypropylene bag contains an earthen mixture of on-site earth and construction sand in a 1:1 proportion. Slaked lime in water was used as stabilizer, in approximately 10% of the total earthen volume. The sieve analysis showed that the earth mixture contained in weight: 0.80% fine gravel, 92.21% sand, 3.42% slime and 3.57% clay. The earth mixture was manually rammed. The building was exteriorly coated with 4 cm thick lime mortar. The floor is made of lime concrete (9 cm thick) and it is directly in contact with the ground, over a waterproofing plastic layer. The main glass opening is the entrance door, which is facing exactly south (exterior window frame of 0.91 × 2 m, with a glazed surface of 1.09 m2) to take advantage of the direct solar gain. Two confronted windows in the east (exterior window frame of 0.8 × 0.67 m, 0.25 m2 of glazed surface) and west (exterior window frame 0.6 × 0.35 m, with a glazed surface of 0.06 m2) facades allow crossed ventilation. The position of the windows with respect to the walls is in the interior, which produces small solar protection due to the thickness of the walls. Over the square windows, there is a space that has been insulated with polystyrene (6 cm) and covered with a wooden exterior coating (2.2 cm) (Table 1).
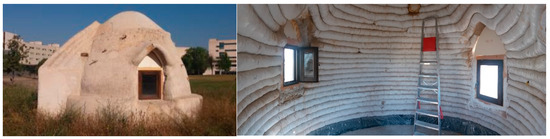
Figure 1.
Earthbag building, University of Lleida Campus, Spain.

Table 1.
Materials properties of the Earthbag building.
2.2. Location and Climate
The prototype is located in the Cappont Campus of the University of Lleida, Spain (41.60N, 0.62E; 167 m above sea level). Lleida has a Mediterranean continental climate, classified as BSk by the Köppen climate classification [21]. It is characterized by hot and dry summers and cold and wet winters due to the presence of fog. Rains are low and irregular, with an annual average of 423 mm. The annual average temperature is 15.2 °C although there are big differences between summer and winter temperatures and between maximum and minimum daily dry air temperatures.
2.3. Instrumentation and Experimental Campaign
For the thermal evaluation of the Earthbag building different experiments were performed.
- Free floating temperature: Internal temperature of the building fluctuates depending on the weather conditions and the thermal behavior of the construction. Temperature oscillations allow evaluating dynamic parameters such as the thermal lag and the decrement factor. No heating or cooling system is used. Two cases for ventilation are considered:
- ○
- No ventilation is provided to the building, just a base level of infiltrations.
- ○
- Natural ventilation is provided to the building. Two different scenarios were tested: all-day long and night ventilation.
- Controlled temperature: The internal temperature of the building is set to a constant value by means of an electric radiator. The energy consumption of the radiator is registered to determine the energy consumption required to maintain a certain level of comfort (set point at 22 °C).
The experimental setup is instrumented with 18 temperature sensors, 2 relative humidity sensors and the control and data acquisition systems, as it is shown in Figure 2. Monitoring consisted in data collection of interior and exterior air temperatures as well as interior surface temperatures in both south and north walls. The interior temperature and humidity sensor was located in the geometrical center of the dome at 1.50 m high (position 2 in Figure 2). Four additional temperature sensors were located in the center of the prototype at different heights, every 0.80 m (positions 3, 4, 5 and 6 in Figure 2). The north surface wall was monitored with 9 temperature sensors, located in a vertical axis every 0.40 m (positions from 8 to 16 in Figure 2). Moreover, 2 temperature sensors (positions 17 and 18 in Figure 2) were located in the north surface wall, next to the sensor in position 12, covering a triangle surface of 300 cm2. The idea is that sensor 12 follows the 0.4 m distance between all the surface sensors in the north wall. The other two sensors were added next to this 12 sensor drawing a triangle to measure the U-value. The south surface wall temperature sensor was located at 2.10 m (position 7 in Figure 2), above the door. Finally, there was a sensor measuring the external temperature and relative humidity (position 1 in Figure 2), and an energy consumption meter to register the energy consumed by the electric radiator.
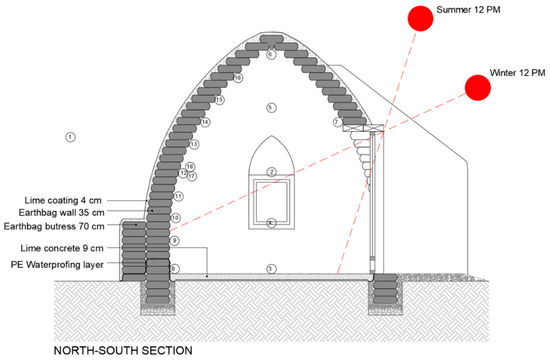
Figure 2.
Sensors location in the monitored Earthbag building.
Temperatures were registered every 5 min by means of a data acquisition system connected to a computer. Air temperature and humidity sensors used were Elektronik device model EE210 (±0.1 °C uncertainty for temperature and 0.5% for humidity). PT-100 class B (±0.3 °C uncertainty) sensors were used for surface temperatures. The acquisition data equipment consisted of a data logger (model DIN DL-01-CPU), connected to the adapter data logger-computer (model AC-250). The computer software to compile the data was TCS-01. When controlled temperature experiments were carried out in winter, a 1500 W electric radiator was used and its energy consumption was also measured with a Finder E7energy meter.
2.4. Experimental U-Value Calculation
In order to calculate the U-value of the Earthbag wall, a transmittance test according to [22,23] was performed. The test consists in monitoring indoor, outdoor air and indoor wall temperatures. It is important to locate the surface sensors on the north wall to avoid the solar radiation interfering with the measures, or having a protected sensor. Moreover, for the wall surface temperature reading, three temperature sensors where located in a triangular shape separated about 20 cm from each other, in order to calculate an average temperature to compute the U-value. It is also important that the indoor air temperature and the outdoor air temperature are as constant as possible, as the importance of the calculation is focused on the heat transfer to the wall. To assure this specification, the experimentation was performed during the indoor controlled temperature scenario and during a fog week. The inner temperature was kept constant with a radiator and the external one due to the presence of all-day-long pervasive fog in Lleida. In this situation, a quasi-steady state hypothesis is justified [24] and the expression to obtain the U-value is the following:
where: Indoor air temperature, °C. : Indoor surface temperature, °C. : Outdoor air temperature, °C. : Heat transfer coefficiewnt of external envelopes, 7.69 W/m2 °C [25].
The experimental U-value will allow calculating the thermal conductivity of the Earthbag wall λ1, from the equation:
where: : Interior surface thermal resistance for a vertical facade, 0.13 m2·°C/W [25]. : Exterior surface thermal resistance for a vertical facade, 0.04 m2·°C/W [25]. : Earthbag wall thickness, m. : Lime mortar coating thickness, m. : Thermal conductivity of the Earthbag wall, W/m2·°C. : Thermal conductivity of the lime mortar coating, W/m2·°C.
2.5. Thermal Lag and Decrement Factor
The thermal lag () represents the time that elapses between the indoor air temperature maximum value and the outdoor maximum value. The decrement factor () is the reduction of the temperature range of both measures (Figure 3).
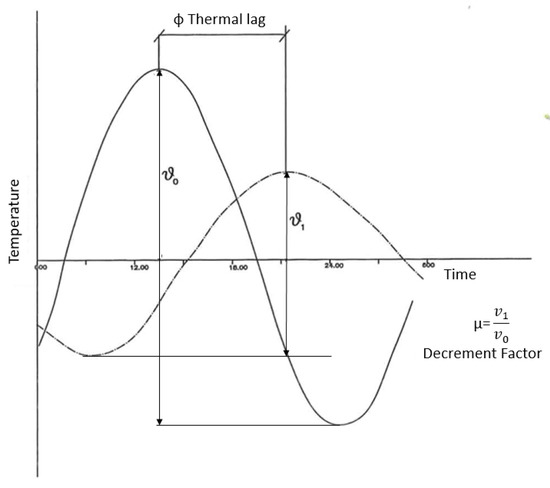
Figure 3.
Definition of the thermal lag and the decrement factor of a sinusoidal heat wave. Source: adapted from Yáñez, 2008 [26].
Assuming an external sinusoidal wave temperature, some formulas are presented for the calculation of the thermal lag and the decrement factor in homogeneous walls, knowing the diffusivity of the material (α), the thickness of the wall () and the period of the wave.
In this case the heat flow is supposed to be transmitted only in the normal direction to the wall, neglecting the effects of the edge. Likewise, it is assumed that the variation of the temperature inside the wall depends only on the external conditions, neglecting any variation that may be generated inside (semi-rigid solid).
As both parameters depend on the period of the wave, the following formulas correspond to a period of 24 h:
where: : Thickness (m). : Material diffusivity, [m2/s].
2.6. Simulation
A numerical model of the Earthbag prototype designed with EnergyPlus was defined and used for comparisons. Open Studio was used as the graphical user interface. Open Studio does not allow for the creation of dome shapes; this is why a polygonal dome has been drawn for the dome building. Shadow elements were drawn, such as the door buttress and the thickness of the walls producing shadow over the windows. The default heat balance algorithm based on the conduction transfer function (CTF) transformation and 6 time steps per hour for the simulation are applied. CTF is a widely used numerical method to calculate transient heat conduction in Building Energy Simulation tools. It is preferred to the finite difference method thanks to the smaller computational time required [27].
Considerations in the energy simulation:
- The climatic file from EnerygPlus for Lleida has been used as a base in which measured on site temperature and humidity have been incorporated. Solar radiation is also incorporated to this climate file and it is taken from the nearest station located in Raïmat (20 km away).
- In the experiments with no ventilation, a calibration analysis has been performed for different ACH (air changes per hour) values to determine the level of air infiltration. Values of 0, 0.1, 0.3, 0.5 and 0.6 ACH have been considered. The mean absolute error (MAE) of the monitored and simulated indoor air temperature was calculated for the five ACH cases. The best performance is achieved with infiltrations of 0.5 ACH with a MAE value of 1.147 °C.
- In the experiments with ventilation, a ventilation of 10 ACH has been considered to simulate the natural ventilation [28].
- Due to the impossibility of drawing a dome shape with OpenStudio, a polygonal dome has been used. When adapting the geometry, the internal volume of the simulated prototype is 2% larger. Moreover, the roof thickness of the simulated prototype is taken as a mean value of the real roof prototype thickness, which changes slightly with the height.
- The simulation in EnergyPlus gives as a result the total glass solar radiation. In this paper, the solar radiation per square meter entered in each glass opening and the total time of solar radiation per opening are determined based on the hourly sun’s path for the latitude and longitude of Lleida, which can be evaluated using the Sketchup’s Shadows feature.
- Since the monitored building is not occupied, no internal heat loads due to occupation or electrical devices have been considered in the simulation.
2.7. Initial Hypothesis and Testing Scenarios
The initial hypotheses are:
- The thermal comfort in an Earthbag building can be achieved in Mediterranean continental climate due to the high thermal inertia of the Earthbag walls and a combination of passive strategies for heating and cooling.
- The position and area of the glazed openings can improve the thermal comfort of an Earthbag building in winter conditions due to the direct solar gains, as a passive heating strategy.
- The natural cross ventilation can improve the thermal comfort of the Earthbag building in summer conditions, as a passive cooling strategy.
- The energy simulation can be validated by the experimental monitoring and, therefore, any future design of the Earthbag building could be tested during the design phase in order to improve the thermal comfort of the building.
Different scenarios during summer and winter periods were tested. Each test was design to give an answer to the objectives listed in Table 2. In test #2, the simulation of the Earthbag building has been compared in addition with an equal Earthbag building with no glazed openings.
Table 2.
Testing scenarios of monitoring and simulation of the Earthbag prototype.
3. Results
In this section, firstly steady-state and dynamic parameters are presented. Experimental data from the monitoring is taken to calculate the thermal transmittance and the conductivity of the Earthbag walls. Secondly, results of the experimental analysis and simulation analysis are presented. The experimental data are presented to analyze the effect of the air stratification. The monitoring and simulation free floating results of temperature and solar radiation data are presented to, in one hand, validate the simulation with the experimental data and, in the other hand, to analyze the thermal inertia and the solar heat gains in winter solstice, equinox and summer solstice. The monitoring and simulation results of power consumption are presented in winter conditions to analyze the energy consumption of the Earthbag building. The monitoring and simulation temperature results of natural ventilation in free floating conditions are presented to analyze its effect and validate the energy simulation.
3.1. Steady-State and Dynamic Thermal Parameters
Figure 4 shows indoor and outdoor air temperatures. For indoor temperatures, air temperature in the geometrical center of the dome (position 2 in Figure 2) is represented with the average value. The indoor north surface temperature monitored (average of sensors 12, 17 and 18 in Figure 2) in quasi-steady state conditions [24] with the average value is also plotted. Moreover, the U-value calculated with the average of the indoor temperature and the uncertainty of this calculation according to the sensors accuracy, are also included. The uncertainty for the U-value was determined to be ±4%, applying the standard method for uncertainty propagation [29].
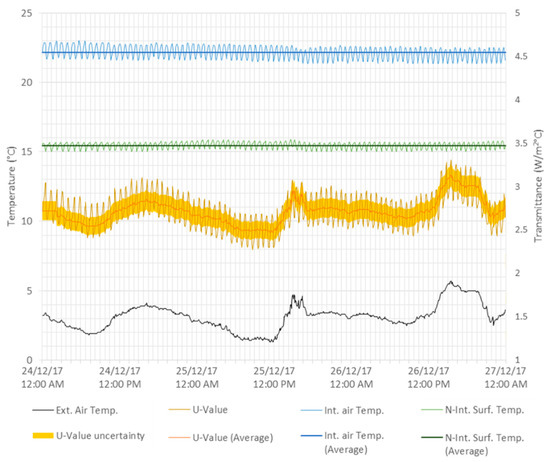
Figure 4.
Interior air and surface temperatures, exterior air temperature and U-value calculated of the Earthbag wall. Data taken from experimental monitoring.
As shown in Figure 4, indoor and outdoor temperatures are almost constant, with an indoor temperature average of 22 °C and an indoor north surface temperature average of 15.5 °C. Outdoor temperature is around 3 °C in days of persistent fog, oscillating only 2 °C throughout the day. The U-value calculated for the Earthbag wall of 35 cm with an exterior lime coating of 4 cm has an average value of 2.7 W/m2 K. According to this experimentally obtained U-value, and to the Equation (2) described in the methodology section, the thermal conductivity of the Earthbag material is 2.18 W/m·K.
The theoretical thermal lag and decrement factor are calculated considering a homogeneous Earthbag wall of 35 cm (with no exterior coating). According to Equations (1), (3) and (4) and the Earthbag properties (Table 1), the corresponding values are shown in Table 3.
Table 3.
Theoretical results of the steady-state and dynamic thermal parameters for the Earthbag wall.
3.2. Experimental and Simulation Results
#1. Air stratification inside the Earthbag dome.
The air stratification testing scenario shows an increase of 1.4 °C from the bottom to the top of the dome in summer and 2.8 °C in the equinox. The surface temperature keeps more stable, oscillating in less than 1 °C (Figure 5).
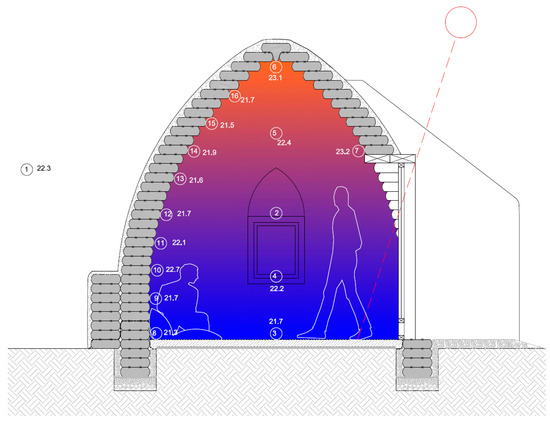
Figure 5.
Air stratification inside the Earthbag dome during at solar noon (2 p.m., on 10 June 2018). (Temperature values in °C).
# 2.1. Winter solstice free floating temperature.
• Comparison of simulation and monitoring:
In the winter solstice period simulation and monitoring data follow a very similar trend (Figure 6). The thermal amplitude range is 1.5 °C for simulation and 2.3 °C for monitoring, with some specific days that can increase up to 3.7 °C. While the outdoor maximum temperature is at 3 p.m., inside the Earthbag building the maximum peak of temperature is produced from 1 p.m. to 2 p.m., one hour after the moment of maximum solar radiation. This peak of temperature is produced by the direct solar gain through the south glazed door. In this period of the year, the incident solar radiation in the east and west windows is inexistent and therefore no effect due to these glazed openings is observed. In a cloudy day with significantly less solar radiation, such as 11 December, there is no substantial increase of temperature from 2 p.m. to 3 p.m. In this case, the temperature oscillates moderately as if there were no windows.
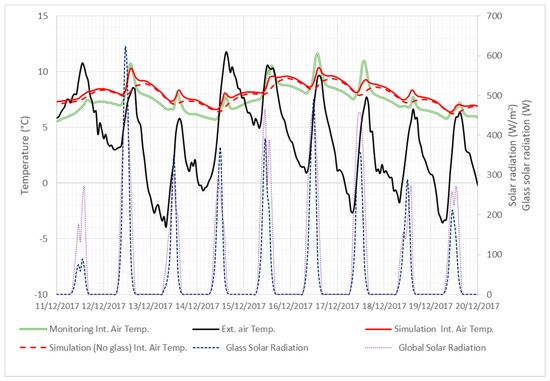
Figure 6.
Interior simulated and monitored temperature, exterior temperature, solar radiation and radiation through the glazed surface, during the winter solstice.
• Comparison between the two simulation cases:
When comparing the simulated data in Figure 6 with the simulated model with no windows, the effect of the direct solar gains through the south glazed opening increases the average temperature in 1.31 °C, during the exposed period. In both cases, the thermal lag between interior and exterior maximum temperature is about 8 h (from 3 p.m. to 11 p.m.), due to the effect of thermal inertia of the Earthbag walls. This effect is more visible in the simulated case of the building without glazed openings. If the glazed openings were covered, the thermal lag would be 7 h (from 3 p.m. to 10 p.m.) and the thermal amplitude 1.3 °C.
#2.2. Equinox free floating temperature.
• Comparison of simulation and monitoring:
During the equinox period simulation and monitoring data follow a similar trend (Figure 7). In both cases, the thermal amplitude ranges between 1.8–2.2 °C. While the outer maximum temperature is at 3 p.m., inside the Earthbag building the maximum is at 2 p.m., one hour after the maximum solar radiation. This peak of temperature is produced by the direct solar gain through the south glazed door. In this period of the year, the solar radiation incident in the east window is slightly noticed from 8–9 a.m. with a small increase of 0.5 °C in the indoor temperature, clearly visible in the simulation.
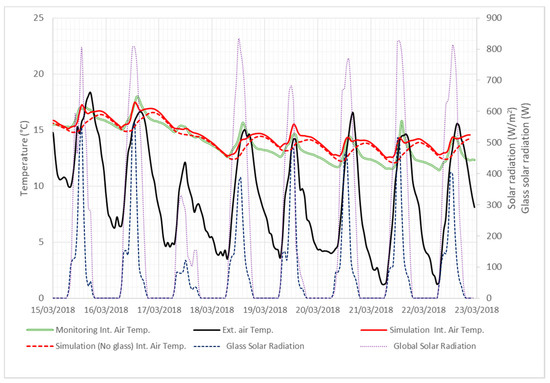
Figure 7.
Interior simulated and monitored temperature, exterior temperature, solar radiation and radiation through the glazed surface, during the equinox.
• Comparison between the two simulation cases:
Compared to the simulated model with no windows, the effect of the direct solar gains increases the temperature in 1.37 °C. This increment of temperature is mainly due to the south glazed opening. In this case, the thermal lag of the simulated analysis between interior and exterior maximum temperature is about 7 h (from 3 p.m. to 10 p.m.), due to the effect of thermal inertia of the Earthbag walls. In the case of the Earthbag building with no glazed openings, the thermal lag is 8 h (from 3 p.m. to 11 p.m.) and an average of the thermal amplitude about 1.8 °C.
#2.3. Summer solstice free floating temperature.
• Comparison of simulation and monitoring:
In the summer solstice, the interior temperatures in the monitored and the simulated Earthbag building have a similar tendency (Figure 8). The thermal amplitude for both, simulation and monitoring is a maximum of 2.3 °C. The solar radiation entering through the glazed openings is visible for the three glazed surfaces in the monitoring, and barely visible in the simulation. Due to the relative position of the sun respect to the south facade, the radiation entering in the south glazed opening is inferior than in the other periods, with 200 W around midday corresponding to the maximum solar radiation (12 p.m.–1 p.m.). The shadow produced by the design of the awnings over the windows and the thickness of the Earthbag walls caused enough solar protection to minimize the solar heat gains. In this case, the maximum exterior temperature is around 4 p.m.
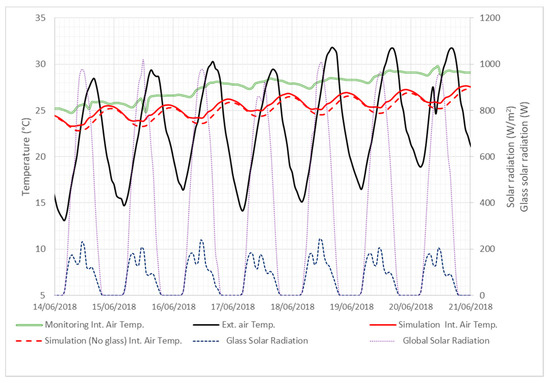
Figure 8.
Interior simulated and monitored temperature, exterior temperature, solar radiation and radiation through the glazed surface, during the summer solstice.
• Comparison between the two simulation cases:
Compared to the simulated model with no windows, the effect of the direct solar gains increases the temperature in 0.52 °C, the lowest increase for the three analyzed periods. The thermal lag for the glazed Earthbag building simulation is about 6 h while for the simulation with no glasses is 7 h. The internal temperature thermal amplitude is about 2 °C for the building simulated with glazed openings and about 2.1 °C for the simulated building without glazed openings, when the outer temperature’s amplitude is about 15 °C. When calculating the thermal amplitude for the monitored building, the value is about 1.2 °C.
#3.1. Summer 24 h cross ventilation.
The behavior of the Earthbag building under natural cross ventilation conditions (24 h per day) during summertime is presented in Figure 9. Both results of interior temperature for simulation and monitoring, present a similar trend, which validates the simulation. The thermal lag between exterior and interior temperatures is inferior to 1 h. Despite the ventilation, a decrement factor can still be observed. The mean exterior thermal amplitude is 10 °C, while the interior is 4 °C. During midday, interior temperature is almost reaching exterior temperatures (from 1 °C to 4 °C below the maximum peak temperatures). During the night, the effect of the thermal inertia of the Earthbag building is visible. Despite the ventilation, when the exterior temperature decreases drastically, the Earthbag building keeps the thermal energy and makes the interior temperature be higher than the exterior (from 3 °C to 5 °C over the minimum peak temperatures). The thermal inertia effect is also visible on 6 June (a cooler day than the previous) when the interior maximum temperatures are 2 °C over the exterior temperatures. The natural cross ventilation during all the day was not effective to cool down the Earthbag building because the exterior day temperatures were high enough to keep the daily average interior temperatures in a high range (20–24 °C). In this case, the solar radiation does not have much influence because the main temperature changes are due to the constant hot air circulation from the outside.
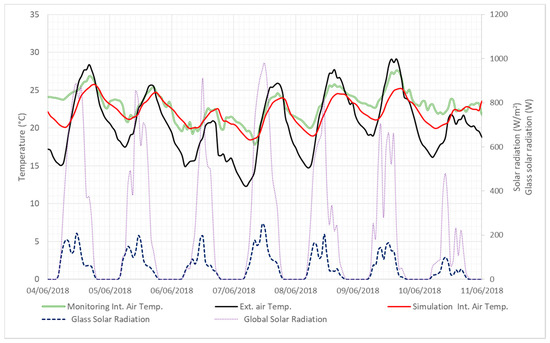
Figure 9.
Indoor simulated and monitored temperature, exterior temperature and solar radiation, during 24 h natural cross ventilation scenario.
# 3.2. Summer night cross ventilation.
Similar to the previous scenario, the prototype was studied under night natural cross ventilation conditions, where the windows were opened from 8 p.m. to 8 a.m. every day. Figure 10 shows the behaviour of the indoor simulated and monitored temperature, the outdoor temperature and the solar radiation as well as the hours when natural cross ventilation is active. Both monitored and simulated indoor temperatures follow the same trend. In both cases, the maximum interior temperature is reached after the exterior maximum temperature, with a thermal lag about 1 h. The decrement factor is 0.4, higher than previous results, caused by the night ventilation. During the day time, the effect of solar gains through the glazed openings is visible in the small temperature peaks in the morning, midday and afternoon. The nigh ventilation produces also a 5.5 °C decrease from the maximum to the minimum temperatures. The effect of opening the windows can be clearly observed on 26, 27 and 28 July, with a sudden matching of interior and exterior temperatures.
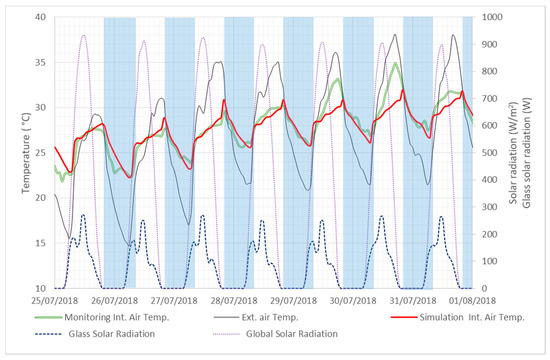
Figure 10.
Interior monitored and simulated air temperature, solar radiation and exterior temperature during night cross ventilation (ventilation time represented in blue area).
#4. Winter controlled temperature.
Figure 11 shows the outdoor temperature and the power consumption per square meter to maintain the indoor temperature at 22 °C. Monitored and simulated consumptions behave quite similar. The oscillation presented by the monitored power consumption of the heater is due to its control system. However, the trend line of the monitored consumption is similar to the simulation, which does not present these oscillations. The average power consumption for heating was 56.56 W/m2, for the analyzed period (Figure 6), having the maximum consumption around 90 W/m2 during the coldest days, for outdoor temperatures under 0 °C.
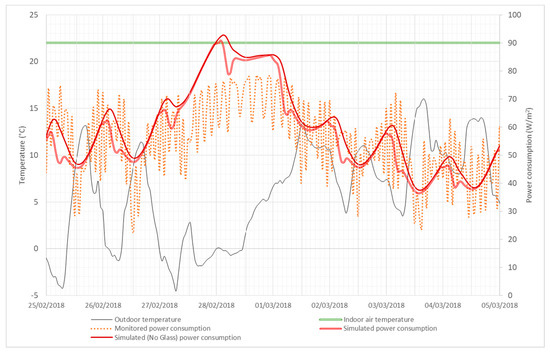
Figure 11.
Power consumption of the heater, both simulated and monitored, during the indoor controlled temperature scenario.
4. Discussion
4.1. Characterization of the Thermal Properties of the Earthbag Walls
- The thermal transmittance (U-value) of the Earthbag wall evaluated in this study is 2.7 W/m2·K. It is interesting to highlight that no references about Earthbag transmittance were found in the literature for comparison. When comparing the Earthbag transmittance with transmittance values found in literature for rammed earth, it is seen that the value provided in this study is higher than the one found for a rammed earth wall of 30 cm, with U-values ranging from 1.3 [30] to 1.9 [1]. It is important to highlight that in many Mediterranean countries with low income and traditional buildings, no limits for thermal transmittance are still established, and the Earthbag buildings can definitely contribute to better comfort and less energy consumption than their traditional ones.
- The thermal conductivity (λ) of the Earthbag (35 cm thick) evaluated in this study is 2.18 W/m·K. This value is in the high range found in the literature for rammed earth, from 1.1 W/m·K with a density about 1900 kg/m3 [25] to 1.2 W/m·K with a density of 2000 kg/m3 [31]. However, it is within the range of other materials with similar density, such as limestone with 2200 kg/m3 [25].
- When observing the thermal properties of an Earthbag building from a qualitative point of view, it is important to focus on air temperature stratification inside the Earthbag dome: A difference of 1.4 °C in the summer solstice and 2.8 °C in the equinox from the ground to the ceiling in the dome has been observed in the monitoring. The simulation does not take into account the air stratification in a zone, since it calculates a mean zone temperature. Differences in the use of the rooms or cultural differences play an important role and must be taken into consideration, when designing an Earthbag building. For example, in those cultures where the living room is used at ground level, the thermal comfort of the users would be reached at different temperatures than in a culture where the users are usually seated on a chair or in a table level.
- One of the characteristics of an Earthbag wall is its high thermal inertia. This is why thermal lag is a key factor when studying these buildings. In this study, the thermal lag in the three analyzed periods, in both monitoring and simulation, ranged from 6 to 9 h, similar to the theoretical calculated value (Table 4). The decrement factor ranged from 0.1 to 0.19, a range within the calculated theoretical value. The mean thermal amplitude ranged from 1.2 °C to 2.5 °C, depending on the period of the year. These values confirm the high thermal inertia of the Earthbag building, which contributes to an improvement of the thermal comfort in continental climates.
Table 4. Thermal lag and decrement factor of the Earthbag building in theoretical, simulated and monitoring cases for winter solstice, equinox and summer solstice.
4.2. Passive Design Strategies in the Earthbag Building
• Cooling: natural cross ventilation
One of the most used and effective bioclimatic strategy in summer conditions is the natural cross ventilation. This is the reason why the Earthbag building, object of this study, was designed locating the two windows in the exact opposite side, in order to increase the effects of the natural cross ventilation.
In the case of night ventilation, from 8 p.m. to 8 a.m., natural cross ventilation takes advantage of the cooler temperatures at night to decrease the average temperature of the Earthbag building. This is an appropriate passive strategy for cooling. Night ventilation emphasized the positive effect of thermal inertia of the Earthbag walls, as the energy stored in the walls during the day is discharged at night to the outside air and the interior temperature is reduced.
As expected, the 24 h ventilation in summer conditions is not a good strategy for cooling during midday and afternoon hours. This type of ventilation makes interior temperatures almost reach the exterior high temperatures during the day, what makes night ventilation inefficient. Therefore, 24 h ventilation cannot be used as a passive strategy for cooling.
• Heating: direct solar gain
Direct solar gain through a glazed opening in the south facade is a commonly used passive design strategy for heating in middle latitudes. Theoretically, due to the position of the sun in the winter solstice, the south facade is the surface of the building that receives the highest amount of solar radiation and, therefore, any glazed opening is expected to act as a heater of the building, having more heat gains than heat losses in a sunny day. In this latitude, the elevation angle of the sun during wintertime reaches a maximum of 25° during the midday, so the solar radiation heats naturally the Earthbag building without any extra source of energy, due to the greenhouse effect.
Solar gains through the glazed openings are presented in Table 5. For comparison purpose with glazed openings, solar radiation is presented per glass area. Each glazed opening received the solar radiation during different periods of time, depending on the moment of the year and, therefore, on the position of the sun and the amount of solar radiation. The south glazed opening received the highest solar radiation in winter and the lowest in summer. East and west glazed openings received the maximum hours and solar radiation in summer solstice. To avoid overheating in summer, these glazed openings should be protected from solar radiation.
Table 5.
Average solar radiation (W/m2) and period of time (h) that receives solar radiation each glazed opening.
The indoor temperature in the winter free floating test is below the thermal comfort limits. Therefore, a combination of an increase of the internal heat gains and an increase of the glazed surface in the south facade are possible strategies to achieve the thermal comfort. The option with active systems was heating. The effect of the passive strategy of direct solar gain meant a daily reduction of the energy consumption and an increment of the interior temperature, as shown in Table 6.
Table 6.
Average reduction of heating energy consumption (Wh) and average increase of the interior air temperature (°C) when it is used the passive strategy of direct solar gains through the glazed openings.
4.3. Thermal Comfort Analysis
The application of the ASHRAE Standard 55 Adaptive Comfort model [32] to all the hours of the monitored summer solstice week is clearly shown in Figure 12, plotting the internal operative temperature for the Earthbag building as a function of outdoor temperature. Simulated values are included as well for comparison. Note that most of the points are either within the comfort adaptive range or only a bit above the upper limit (0.5–3 °C) or slightly below the lower one (0.5 °C). These results of satisfactory thermal comfort conditions are in good agreement with the found for an Earthbag dwelling in Ougadougou (Burkina Faso) by energy simulations [6]. Note that in this paper the Earthbag dwelling improved a 99% the discomfort degree-days with respect to the traditional Burkinable dwelling. Thus, these experimental results confirm the good performance of the Earthbag building to achieve thermal comfort in hot climates.
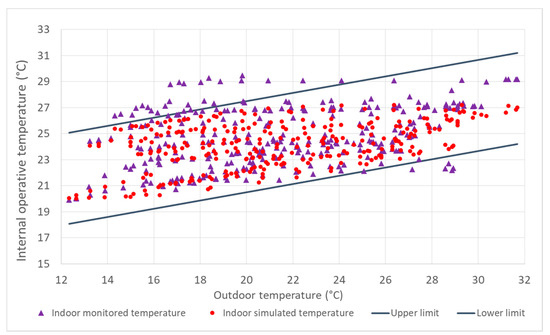
Figure 12.
Thermal comfort of the prototype during the summer period according to the ASHRAE 55 Adaptive method [32].
5. Conclusions
The thermal performance of an Earthbag dwelling in Mediterranean continental climate is studied both experimentally and numerically. The experimental campaign was carried out along the different seasons of the year and included both free floating and temperature controlled tests. The building energy model was developed with EnergyPlus. Simulation and experimental results have a similar trend in free floating experiments, with and without ventilation, and in controlled temperature tests. Monitoring and simulation comparisons showed a good match in temperature behavior for the different scenarios studied.
The effect of stratification of the air temperatures inside the dome is not considered in EnergyPlus. However, qualitative results presented in this study show that stratification is significant and must be taken into account in the design phase of the Earthbag spaces. Experimental results showed a difference up to 1.4 °C to 2.8 °C between the floor and the ceiling.
Singularities in the construction process or material availability outcomes in differences in the Earthbag wall. Variations in density or humidity level result in different thermal conductivity and specific heat. The Earthbag of 35 cm, with an earth mixture of 0.80% fine gravel, 92.21% sand, 3.42% slime and 3.57% clay, and a density of 2190 kg/m3, resulted in a conductivity of 2.18 W/m·K. The facade made of one Earthbag of 35 cm plus an exterior lime coating of 4 cm resulted in a thermal transmittance of 2.7 W/m2·K. Using these experimental values in the simulation, instead of the generic data present in literature or building codes, provides more accurate simulation results.
Passive design strategies are a key point when designing an Earthbag building, contributing to achieving thermal comfort during summer and winter, despite the high U-value of the Earthbag walls. Those strategies were, for the winter period, the use of high thermal mass to store thermal energy and the heat gains by direct solar radiation, and, in the summer period, the use of night natural cross ventilation together with the use of high thermal mass to reduce the midday peak temperatures.
Theoretical calculations and experimental results matched in the thermal lag and decrement factor and verified the high thermal inertia of the Earthbag enclosure. The thermal lag was determined in a range of 6–9 h and the decrement factor in 0.1–0.2. Moreover, the thermal mass produced reductions of 90% in summer and 88% in winter, in the interior thermal amplitude with respect to exterior temperatures. The effect of the building floor in contact with the ground would also cause this high thermal inertia and it should be analyzed in future research. The low shape factor could contribute to a lower energy flux that also should be analyzed in future research.
The position of the glazed openings was fundamental in the direct collection of solar radiation in winter period, whose effect is increasing the interior temperature in free floating mode (reducing the heating energy consumption in controlled temperature mode). As expected, the greatest effect of temperature increase due to solar collection in winter time and the equinox, was caused by the south facade glass, with an increment of 1.31 °C and 1.37 °C, respectively.
Night ventilation in summer period in combination with high thermal inertia has a good performance as a passive system for semi-hot climates because it reduces the indoor temperatures to a comfort range without any active system. However, all day ventilation cannot be recommended because the high exterior day temperatures increase the average temperatures inside the building.
Despite the passive design strategies, the Earthbag building requires a heating system in winter period to achieve thermal comfort levels. In the case of the analyzed building, to achieve a comfort temperature of 22 °C, energy consumption in the range 1–1.7 kWh/m2 per day was required.
Author Contributions
L.R., C.S., I.M. and M.M. conceived and designed the analysis. L.R., A.C. (Ariadna Carrobé), and I.M. collected the data. L.R., A.C. (Ariadna Carrobé), and M.M. contributed in the simulation process. L.R., A.C. (Ariadna Carrobé), M.M., and A.C.(Albert Castell) performed the analysis. L.R., A.C. (Ariadna Carrobé) and I.M. wrote the paper. A.C. (Albert Castell), M.M. and C.S. reviewed and edited the paper. All authors have read and agreed to the published version of the manuscript.
Funding
This research was funded by the Oficina de Desenvolupament i Cooperació (ODEC), the “Escola Politècnica Superior” of UdL, the “Consell Social” of UdL and the Catalan Government (AGAUR- Generalitat de Catalunya).
Acknowledgments
The authors would like to thank the “Oficina de Desenvolupament i Cooperació (ODEC)” of the University of Lleida (UdL), Spain, for the grant projects of 2014, 2015, 2016 and 2017, the “Escola Politècnica Superior” of UdL, the “Consell Social” of UdL for their donatives, and Domoterra association. The authors would also thank all the students that participated in the construction of the Earthbag building. Ariadna Carrobé would like to thank the Catalan Government (AGAUR- Generalitat de Catalunya) for her collaboration grant 2017–2018 in the Computer Sciences and Industrial Engineering Department at University of Lleida. The authors would like to thank the Catalan Government for the quality accreditation given to their research group (2017 SGR 659).
Conflicts of Interest
The authors declare no conflict of interest.
References
- Minke, G. Manual De Construcción En Tierra; Fin De Siglo: Cuba, Havana, 2012; ISBN 9974-49-347-1. [Google Scholar]
- Nader Khalili, P.V. Earth Architecture and Ceramics; Calearth: Hesperia, CA, USA, 1998. [Google Scholar]
- Canadell, S.; Blanco, A.; Cavalaro, S.H.P. Comprehensive design method for earthbag and superadobe structures. Mater. Des. 2016, 96, 270–282. [Google Scholar] [CrossRef][Green Version]
- Sargentis, G.F.; Kapsalis, V.C.; Symeonidis, N. Earth building. Models, technical aspects, tests and environmental evaluation. In Proceedings of the 11th International Conference on Environmental Science and Technology Chania, Crete, Greece, 3–5 September 2009. [Google Scholar]
- Adegun, O.B.; Adedeji, Y.M.D. Review of economic and environmental benefits of earthen materials for housing in Africa. Front. Arch. Res. 2017, 6, 519–528. [Google Scholar] [CrossRef]
- Rincón, L.; Carrobé, A.; Martorell, I.; Medrano, M. Improving thermal comfort of earthen dwellings in sub-Saharan Africa with passive design. J. Build. Eng. 2019, 24, 100732. [Google Scholar] [CrossRef]
- Merina, S.; Javier, F. EURAU18 Alicante: Retroactive Research: Congress Proceedings; Universidad de Alicante: Alicante, Spain, 2018; ISBN 978-84-13-02003-7. [Google Scholar]
- Cal-Earth, The California Institute of Earth Art and Architecture, 2014. Cal-Earth Inc./Geltaftan Foundation. Available online: http://calearth.org/ (accessed on 1 February 2019).
- Training Medical Center—Emsimision, (n.d.). Available online: http://www.emsimision.org/proyectos/training-medical-center/ (accessed on 6 April 2018).
- Builders without Borders, Earthbag Housing in Port au Prince, Haiti. Available online: www.haitistrawbale.wordpress.com (accessed on 1 March 2019).
- Rasin Fundation. Medical Center in Petite-Riviere, Haiti. 2010. Available online: www.rasinfoundation.org/programs/clinic (accessed on 1 March 2019).
- Heats of Haiti. School in Lounglan, Haiti. 2010. Available online: www.howsitgoinginhaiti.blogspot.com (accessed on 1 March 2019).
- Konbit Shelter. Community Center in Barriere Jeudy, Haiti. 2010. Available online: www.earthbagbuilding.com/projects/konbit2.htm (accessed on 1st March 2019).
- Barrels of Hope. Impact Test to Evaluate Hurricane Effects on Earthbag Wall. Haiti. 2010. Available online: www.barrelsofhope.org (accessed on 1st March 2019).
- Small-Earth. The Pegasus Children’s Projectin Kathmandu Valley, Nepal. EarthbagBuilding Web Page. 2006. Available online: http://www.earthbagbuilding.com/projects/pegasus.htm (accessed on March 2019).
- Palme, M.; Guerra, J.; Alfaro, S. Thermal Performance of Traditional and New Concept Houses in the Ancient Village of San Pedro De Atacama and Surroundings. Sustainability 2014, 6, 3321–3337. [Google Scholar] [CrossRef]
- Desogus, G.; Di Benedetto, S.; Grassi, W.; Testi, D. Environmental monitoring of a Sardinian earthen dwelling during the summer season. J. Phys. Conf. Ser. 2014, 547, 012009. [Google Scholar] [CrossRef]
- Martín, S.; Mazarrón, F.R.; Cañas, I. Study of thermal environment inside rural houses of Navapalos (Spain): The advantages of reuse buildings of high thermal inertia. Constr. Build. Mater. 2010, 24, 666–676. [Google Scholar] [CrossRef]
- Catálogo Informático De Elementos Constructivos. Available online: https://www.codigotecnico.org/index.php/menu-catalogo-informatico-elementos-constructivos (accessed on 6 April 2018).
- Martí, R. Anàlisi I Caracterització De La Terra Del Domo De La Universitat De Lleida (Analysis and Characterization of the Earth of the Dome of the University of Lleida). Bachelor’s Thesis, University of Lleida, Catalunha, Espanha, 2016. [Google Scholar]
- Rubel, F.; Kottek, M. Observed and projected climate shifts 1901–2100 depicted by world maps of the Köppen-Geiger climate classification. Meteorol. Z. 2010, 19, 135–141. [Google Scholar] [CrossRef]
- Bienvenido-Huertas, D.; Moyano, J.; Marín, D.; Fresco-Contreras, R. Review of in situ methods for assessing the thermal transmittance of walls. Renew. Sustain. Energy Rev. 2019, 102, 356–371. [Google Scholar] [CrossRef]
- Teni, M.; Krstić, H.; Kosiński, P. Review and comparison of current experimental approaches for in-situ measurements of building walls thermal transmittance. Energy Build. 2019, 203, 109417. [Google Scholar] [CrossRef]
- Cabeza, L.F.; Castell, A.; Medrano, M.; Martorell, I.; Pérez, G.; Fernández, I. Experimental study on the performance of insulation materials in Mediterranean construction. Energy Build. 2010, 42, 630–636. [Google Scholar] [CrossRef]
- ISO 6946:2017. Available online: http://www.iso.org/cms/render/live/en/sites/isoorg/contents/data/standard/06/57/65708.html (accessed on 14 December 2019).
- Yáñez Paradera, G. Arquitectura Solar E Iluminación Natural: Conceptos, Métodos Y Ejemplos; Munilla-Lería: Madrid, Spain, 2008; ISBN 978-84-89150-81-2. [Google Scholar]
- Mazzarella, L.; Pasini, M. CTF vs FD Based Numerical Methods: Accuracy, Stability and Computational Time’s Comparison. Energy Procedia 2015, 78, 2620–2625. [Google Scholar] [CrossRef][Green Version]
- Liddament, M.W. International Energy Agency Energy Conservation in Buildings and Community Systems Programme: IEA-ECB & CS. Annex 5 [...]: Air Infiltration and Ventilation Centre Air Infiltration Calculation Techniques: An Applications Guide; Document AIC-AG; Air Infiltration and Ventilation Centre: Bracknell, Berkshire, 1986; ISBN 978-0-946075-25-6. [Google Scholar]
- Taylor, B.N.; Kuyatt, C.E. Guidelines for Evaluating and Expressing the Uncertainty of NIST Measurement Results; Physics Laboratory National Institute of Standards and Technology: Gaithersburg, MD, USA, 1994. [Google Scholar]
- Birkhäuser, G.M. Building with Earth: Design and Technology of a Sustainable Architecture; Walter de Gruyter: Berlim, Alemanha, 2012; ISBN 978-3-0346-0872-5. [Google Scholar]
- Heathcote, K. El comportamiento térmico de los edificios de tierra. Inf. Constr. 2011, 63, 117–126. [Google Scholar] [CrossRef]
- ANSI/ASHRAE Standard 55-2013. Thermal Environmental Conditions for Human Occupancy; American Society of Heating, Refrigeration and Air-Conditioning Engineers, Inc.: Atlanta, GA, USA, 2013.


© 2019 by the authors. Licensee MDPI, Basel, Switzerland. This article is an open access article distributed under the terms and conditions of the Creative Commons Attribution (CC BY) license (http://creativecommons.org/licenses/by/4.0/).