Abstract
The Lishui Sag is located in the southeastern part of the Taibei Depression, in the East China Sea basin, where the sag is the major hydrocarbon accumulation zone. A three dimensional modelling approach was used to estimate the mass of petroleum generation and accumulated during the evolution of the basin. Calibration of the model, based on measured maturity (vitrinite reflectance) and borehole temperatures, took into consideration two main periods of erosion events: a late Cretaceous to early Paleocene event, and an Oligocene erosion event. The maturation histories of the main source rock formations were reconstructed and show that the peak maturities have been reached in the west central part of the basin. Our study included source rock analysis, measurement of fluid inclusion homogenization temperatures, and basin history modelling to define the source rock properties, the thermal evolution and hydrocarbon generation history, and possible hydrocarbon accumulation processes in the Lishui Sag. The study found that the main hydrocarbon source for the Lishui Sag are argillaceous source rocks in the Yueguifeng Formation. The hydrocarbon generation period lasted from 58 Ma to 32 Ma. The first period of hydrocarbon accumulation lasted from 51.8 Ma to 32 Ma, and the second period lasted from 23 Ma to the present. The accumulation zones mainly located in the structural high and lithologic-fault screened reservoir filling with the hydrocarbon migrated from the deep sag in the south west direction.
1. Introduction
The Lishui Sag is one of the main exploration hotspots in the Taipei Depression, in the East China Sea Shelf Basin. The exploration of the Lishui Sag started in the 1980s and six hydrocarbon-bearing structures were discovered thus far [1,2]. Among these are WZ13, L35-B, and S1, which are oil-bearing structures, whereas LF1, WZ26 are gas-bearing structures. The hydrocarbon bearing structures proved the superior reservoir conditions and source rock core samples showed rich hydrocarbon generation potential in the Lishui Sag. However, the LS36-A structure, discovered in 1997, is the only commercial field, with potential geological reserves of around 5 billion m3 of gas. Previous studies show that the LS36-A gas field is a complex trap controlled by the tectonic evolution and the low permeability Lower Mingyuefeng Formation [3].
The Lishui Sag has low petroleum discovery due to the lithologic complexity of its potential reservoirs. Numerous studies on the source rock and reservoir have been performed in the Lishui Sag, mainly focused on the tectonic evolution and hydrocarbon-forming processes [3,4,5,6,7,8,9]. The main hydrocarbon generation period occurred during the Late Paleocene [7,10]. Tectonic analysis and fluid inclusion homogeneous temperature tests are used to determine the petroleum filling periods. The accurate petroleum charge periods are not clear because different scholars have reached different conclusions. The burial temperature history of single wells constructed using BasinMod 1D indicates three petroleum charge events which occurred at the end of the Paleocene, end of the Eocene and during the Miocene [11]. Su et al. considered that three charge events occurred in the early Eocene (54–52 Ma), late Eocene to early Oligocene (45–34 Ma) and during the Pliocene to present (5–0 Ma) [7].
Basin modelling is used to analyze the petroleum generation and accumulation through geologic time with multiple input data [12,13]. The 1D and 2D basin modelling approached generally neglect the critical factors that influence temperature and hydrocarbon migration that can only be specifically addressed in three dimensions [14]. It is necessary to consider the petroleum evolution and accumulation as a whole by constructing a detailed 3D numerical petroleum system model [15,16,17,18]. The lateral and vertical heterogeneity of lithology is strong in the Lishui Sag and the sand-shale ratio is different for each formation. We tried to set reliable correlations for porosity vs. depth correlation and porosity vs. permeability of each formation. Also, the distribution of sand-shale patterns was defined to represent the horizontal petrophysical diversity. We stacked the sand-shale distributions of different system tracts to represent the formation facies model. In this study, we constructed a 3D facies model to simulate the hydrocarbon migration in cells with different physical properties.
2. Geological Settings
The Lishui Sag is located in the south-west corner of the East China Sea Shelf Basin, occupying an area of 13785 km2 [19]. The sag is a typical Cenozoic rift depression developed on the Mesozoic residual basin basement and formed by a half graben structure with faults in the east and overlapping the uplift belt in the west [1,19,20]. The Lishui Sag trends NE-SW and can be divided into four tectonic units: west sub-sag, east sub-sag, south sub-sag and the Lingfeng uplift zone. The west sub-sag and east sub-sag are separated by the Lingfeng Uplift zone, a buried basement hill and the maximum burial depth reaches nearly 8 km at the northern part of the west sub-sag (Figure 1).
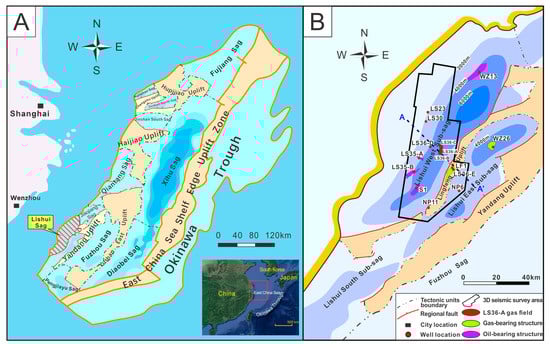
Figure 1.
Location and geographic setting of the study area (Modified after Liu [9]). (A) Structural and tectonic elements of the East China Sea Shelf Basin. (B) Structure division of the Lishui Sag and study area outlined in the red box.
The Cenozoic strata from bottom to top include the Paleocene Yueguifeng Formation (E1y), Lingfeng Formation (E1l) and Mingyuefeng Formation (E1m), Lower Eocene Oujiang Formation (E2o), Wenzhou Formation (E2w), Miocene, Pliocene and Quaternary [21] (Figure 2). The basement of the Lishui Sag is Upper Cretaceous Shimentan Formation (K2s) igneous rock. Evidence of oil and gas could be found mainly in the Paleocene series including the Yueguifeng Formation, Lingfeng Formation and Mingyuefeng Formation, which is the target interval of this study.
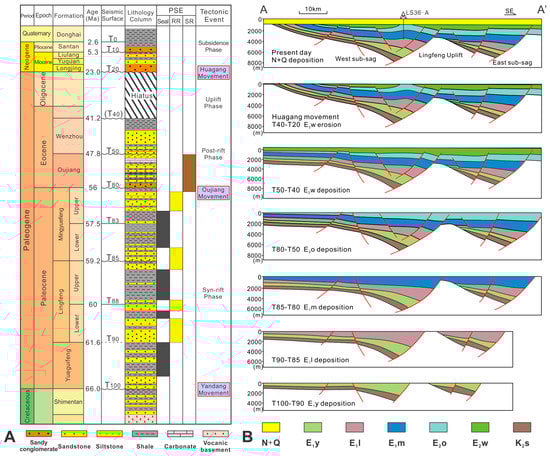
Figure 2.
(A) Lithostratigraphy of the Lishui Sag and (B) the tectonic evolution in the Lishui Sag. The petroleum system elements (PSE) including seal rocks (Seal), source rocks (SR) and reservoir rocks (RR), as well as the general overview of the geologic and tectonic events are also shown. The wavy line indicates the angular unconformity and the dash line indicates the parallel unconformity. The location of section AA’ is shown in Figure 1B.
The Lishui Sag has underwent four tectonic phases from the end of the Mesozoic to the Quaternary period [8,10,22,23,24,25] (Figure 2A): (1) The syn-rift phase (Late Cretaceous to Paleocene) formed the NE-SW trending graben and half-graben depocenters on the base of the residual Mesozoic basin [9,19]. The NE-trending extensional faults indicate slab-pull forces which were correlated with the subduction of the Western Pacific Plate beneath the Eurasian Plate. The Lishui Sag experienced a rapid sedimentation period with intense fault activities (T100-T85). The Oujiang movement at the end of the Paleocene terminated the fault-depression stage in the Lishui sag. (2) During the post-rift phase (Early Eocene to Late Eocene) the extensional movements and deposition rate slowed down significantly [24]. Extensional faults no longer controlled the subsidence centers. (3) During the uplift phase (Late Eocene to Late Miocene) a regional erosion event occurred. The Lingfeng Uplift was buried and the sub-basins began to be connected between Late Eocene and Early Miocene (Figure 2B). The Huagang movement contributed to the regional uplift and erosion. The upper Eocene and the entire Oligocene are not represented in the stratigraphic section [22]. (4) The regional subsidence phase (Late Miocene to Quaternary) occurred while the rift center moved towards the Okinawa Trough [26]. The Lishui Sag finally entered a uniform subsidence stage.
3. Construction of the Model
In order to have a deeper understanding of the hydrocarbon generation characteristics and reservoir forming process of the Lishui Sag, we carried out 3D petroleum system modelling of the sag using the PetroMod 2015 software (Schlumberger, Oslo, Norway). 3D basin modelling can reveal the sedimentation history, define the source rock maturation and hydrocarbon generation processes, and identify the paths of hydrocarbon migration and areas of accumulation [21]. The essential processes to constitute the model include deposition, compaction, denudation, source rock maturation, hydrocarbon generation, expulsion, migration and accumulation. The basic concepts and rules used in the model building have been discussed by Hantschel and Kauerauf [27].
The study area in this paper is a 3D seismic survey with an area of 2468 km2, which covered the central part of the west sub-sag and part of the east sub-sag (the black box in Figure 1). There are three sets of 3D seismic survey data, acquired in 2006, 2014 and 2015, respectively. The seismic data acquired in different periods used the different techniques and we created a unified data set for the basin. Eight main horizons were interpreted, including T20, T50, T80, T83, T85, T88, T90 and T100 [9,19,22]. The seismic data were combined with biostratigraphic and lithologic data from conventional cores (Figure 2). There are 13 exploration wells distributed in the study area and the LS36-A gas field is also included (Figure 1B).
In order to predict the petroleum migration path, use of a suitable migration algorithm in the model is especially important [28,29,30]. There are a variety of algorithms for hydrocarbon migration. We chose the hybrid model that combined both Darcy and flowpath methods as well as a simplified percolation calculation [27]. Darcy flow is used in low permeability cells and flowpath analysis works in high permeability cells. This method is faster than a pure Darcy flow model to estimate the petroleum migration and accumulation. It is obvious that a model with high resolution would be more specific and the tiny traps also could be described well. However, with the increase of the grid cells included in the model the simulation time will grow rapidly. To balance the model precision and the computing time, a grid cell size of 200 × 200 m was the best solution to fit our case.
3.1. Erosion Thickness
Four erosion events are considered in this study; the detailed information and thickness maps are shown in Figure 3 and Table 1.
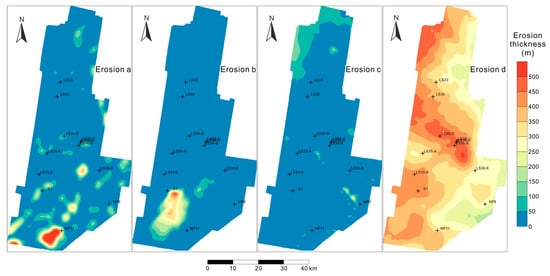
Figure 3.
The eroded thickness maps of the study area in the Lishui Sag. The erosion events are listed in Table 1.

Table 1.
Lithology settings and petrophysical definitions for basin modelling. Gp. = Group, Fm. = Formation, fms. = formations, z = depth, por = porosity. The Mingyuefeng Fm., Lingfeng Fm. and Yueguifeng Fm. each has two lithology types, the distribution of the different lithology types are shown in Section 3.2.
Firstly, we used the normal working procedures such as acoustic time difference method and vitrinite reflectance method [31,32]. However, we found out that the dataset did not fit the normal rules well. We tracked the trend of the original strata on the seismic sections and calculate the denudation thickness [33]. The main erosion event effecting the whole Lishui Sag occurred at the end of the Eocene (erosion d). The average denudation thickness is 340 m and shows difference between the sub-sags. Regional erosion events a, b and c correspond to the horizons T90, T80 and T50. The erosion event c shows erosion mainly in the slope area of the west sub-sag. The erosion in event b is confined to the SW part of the west sub-sag near the Well S1. The erosion event occurred primarily in the southern part of the study area with a mean value of 350 m.
3.2. Lithology and Petroleum System Elements
The geological time scale of the formations in the Lishui Sag followed the International Chronostratigraphic Chart [34]. We defined the lithology assignment of each stratum unit based on the drilling cuttings and cores from 13 wells in the study area (Table 1). The K2s unit mainly consists of tuff, red mudstone and mudstone with tide-flat lime mudstone developed at the top [1]. The E1y unit was deposited in a warm and humid lacustrine environment and developed thick shale deposition with good hydrocarbon potential with lake delta deposits. The E1l unit is dominated by a set of organic rich marine siltstone. The E1m unit is mainly composed of delta-shore swamp deposits with coal seam and thick sandstone [1]. The source rock in E1y, E1l and E1m units contribute to the hydrocarbon generation in the Lishui Sag [7]. The reservoir rock in the E1l and E1m units is sandstone. The widely distributed thick shale in the E2o unit performs as a highly effective regional seal for the Lishui Sag. The siltstone in E1m and E1l can also be local seal rock. The widespread seal rock plays an important role for the preservation of the gas storage.
The structure model, shown in Figure 4, was derived from depth maps interpreted from seismic. We calibrated the depth of each horizon by the stratigraphic classification in single wells. The gridded faults were created in PetrelTM (Schlumberger, Oslo, Norway) from seismic data (Figure 5). The properties of the faults were based on the interpreted tectonic history, which results in the properties of the main faults changing from open to closed after the Oujiang movement, as a result in the change in stress field at that time. This means that hydrocarbons could migrate through faults until around 56Ma, after which the faults would block hydrocarbon migration.
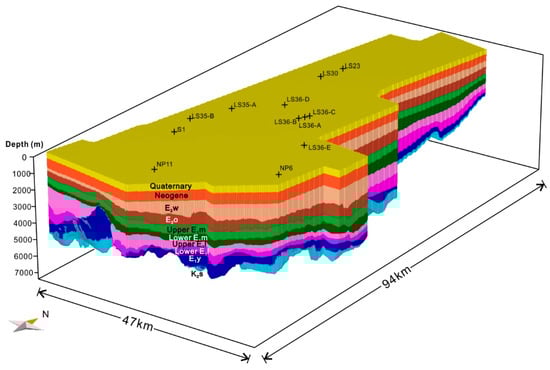
Figure 4.
The 3D model dimensions and major layers of the study area (the black box in the Figure 1B) in the Lishui Sag at present-day.
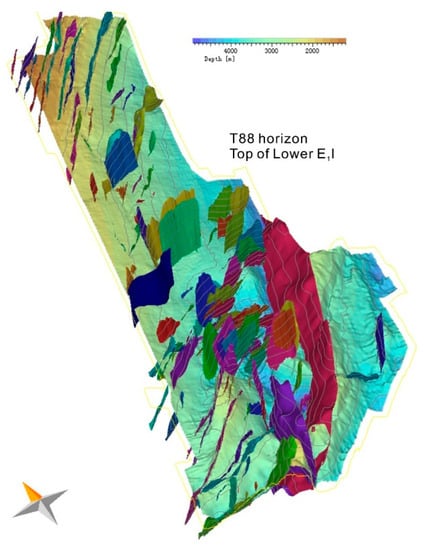
Figure 5.
Model faults in the study area intersect with the stratigraphic surface. The surfaces with unique colors are faults and the stratigraphic horizon refer to the top surface of Lower E1l.
Because of the lithologic variability of the mixed sandstone and mudstone reservoirs, uniform compositions are inadequate for the accuracy required by the basin model. As shown in Table 2, the physical properties of rock vary widely in the E1m and E1l, and there was also a significant difference between the upper and lower layers. We used Athy’s Law [35,36] and core measured porosity data to calibrate the porosity versus depth curve of Upper and Lower E1m and E1l and other formations. The algorithms and formula of the porosity are listed in Equation (1) and Table 2. The calibrated curves are shown in Figure 6 and the difference between sandstone and siltstone is clear. The correlations between permeability and porosity were also established using the measured data from the Lishui Sag (Table 1).
where P is the porosity, p is the mean porosity of surface sediments, b is a constant, and x is the burial depth.
Table 2.
The reservoir physical property of the sandstone core samples from the study area.
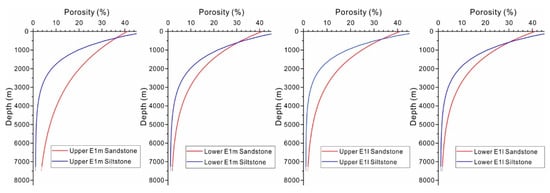
Figure 6.
The calibrated porosity versus depth curve using Athy’s Law for the sandstone and siltstone in E1m and E1l (the curves for upper and lower layers are separated).
The lateral and vertical facies heterogeneities of each formation are considered in this model. In order to distinguish the sandstone and siltstone in the reservoir layers, we calculated the RMS amplitude using the 3D seismic data. The RMS attribute is obtained by calculating the root-mean-square amplitude value of each sampling point in seismic trace analysis. It is very sensitive to amplitude variation and is very effective at distinguishing different rock types in seismic bodies [37,38,39]. The sand and shale distribution is similar within the same systems tract, so we used stratal slices of the RMS attribute to predict the sandstone distribution.
The division scheme of the systems tract of the study area followed the research of Zhang et al. [19] and Liu [9]. The Upper E1m strata is divided into two systems tracts: highstand systems tract (HST) and transgressive systems tract (TST). The Lower E1m is divided into four systems tracts: falling stage systems tract (FSST), highstand systems tract (HST), transgressive systems tract (TST) and lowstand systems tract (LST). The Upper and Lower E1l both consist of three systems tracts including HST, TST and LST. Figure 7 shows the RMS attribute of the each systems tract. The warm color indicates the area with higher sand content while the cool color represents the area with more mudstone. The distribution maps of the sandstone and siltstone of each systems tract were worked out by sedimentary facies maps. Then we adjusted the maps referring to the shale content in the drilling core samples (Figure 8). We combined the layers with different distribution patterns of facies to construct the lithologic and stratigraphic model (Figure 9). The migration path for hydrocarbons is dictated both by the spatial variation of porosity and permeability and by the temporal variations of the fault properties.
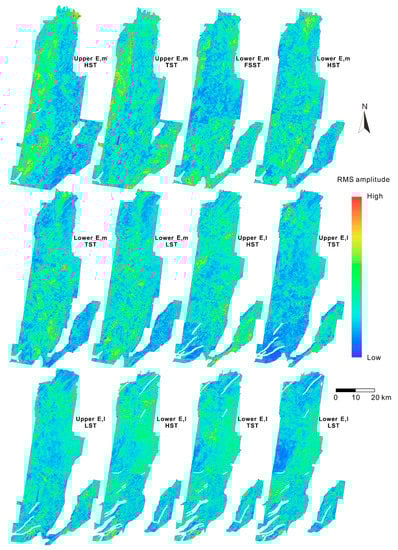
Figure 7.
Distribution maps of root-mean-square (RMS) amplitude of each system tract in the reservoir interval, with uniform value ranges for RMS amplitude. The undefined value areas are faults and Lingfeng Uplift areas where gaps exist in the seismic data.
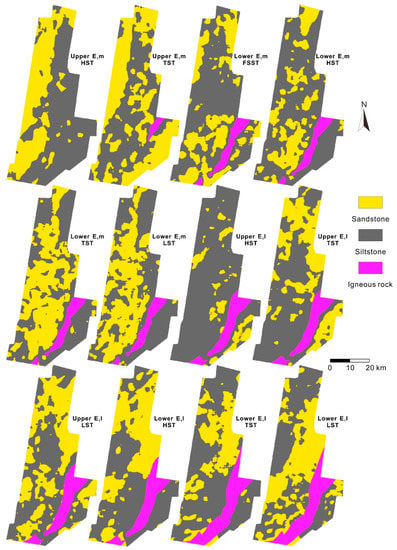
Figure 8.
Distribution maps of the sandstone and siltstone of each systems tract in the reservoir interval. The purple areas represent the impermeable Lingfeng Uplift.
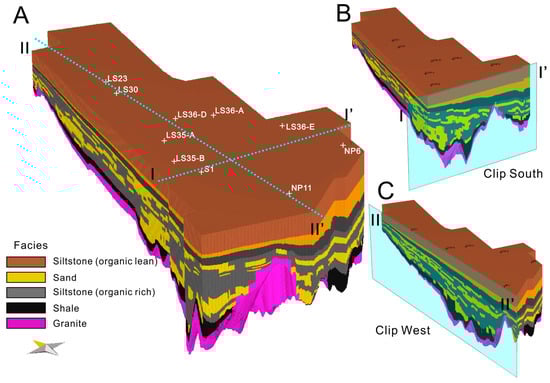
Figure 9.
(A) The facies and lithology assignment model of the study area in the Lishui Sag. (B) The cross section map of taking the profile in the south of the model. (C) The cross section map of taking the profile in the west of the model.
3.3. Source Rock Properties and Kinetics Model
As introduced in the former section, the main source rock layers in the Lishui sag are E1m, E1l and E1y. The vitrinite reflectance of Upper E1m is below 0.5% due to the shallow burial depth [1,7]. In Figure 10A, the atomic ratio of hydrogen to carbon is shown to be between 0.5 and 1.0, with the atomic ratio of oxygen to carbon varying from 0.05 to 0.3. The source rock samples have typical characteristics of type III kerogen. The samples from Lower E1m and Upper E1l have higher maturity. Few samples from Lower E1l and E1y have lower maturity than the upper layers because the over mature samples are not included in this figure. In Figure 10B, the sample samples cluster around a value of Ro = 0.5, with the majority below the curve for type III kerogen. The source rocks from E1l and E1y have low hydrogen indexes (less than 200 mg/g) and the pyrolysis peak temperature ranges from 420 to 460 °C. Part of the samples from E1m belong to the type II2 kerogen but the major source rock type is type III kerogen. In Figure 10C, the potential hydrocarbon generation amount (Pg) is the summation of S1 and S2 measured in the pyrolysis and the values are between 0.5 and 6 mg/g. The quality of the source rocks is fair to good, with a few of samples of very good source rock. In this study, the source rock properties used in the model are the average value of the source rock layers listed in Table 3. The thickness of source rock used in the model is calculated by the shale ratio in the layer. The average source rock thickness of Upper and Lower E1m is 350 and 300 m, the thickness of E1y is 250 m. The hydrocarbon generation was simulated using the Burnham kinetic model for type II and III kerogen [40]. The oil and gas generation regularities in the Burnham’s model are similar to the petroleum production data.
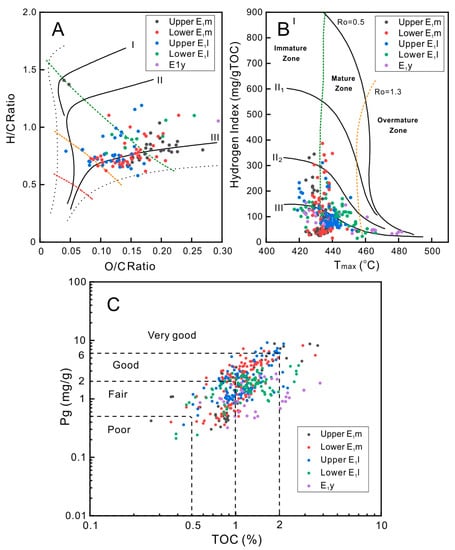
Figure 10.
Source rock evaluation plots of the main source rocks from the study area in the Lishui Sag. (A) Kerogen type and maturation definition using van Krevelen diagram [41]. (B) Distribution of hydrogen index (HI) with pyrolysis peak temperature (Tmax) [42]. (C) Variation of Rock–Eval Pg (S1 + S2) with total organic carbon (TOC) content. In figure A and B the green dash line represents Ro = 0.5, the yellow dash line represents Ro = 1.3, and the red dash line represents Ro = 2.0.
Table 3.
The average value of source rock pyrolysis test data used in the model. TOC = Total organic carbon, S1 = Free hydrocarbon components, S2 = Hydrocarbons generated by the pyrolysis, HI = Hydrogen index, Tmax = Pyrolysis peak temperature.
3.4. Boundary Conditions
The boundary conditions of the model consist of paleo water depth, sediment water interface temperature (SWIT) and heat flow. The paleo water depth trend was estimated based on the relative sea level change and sedimentary thickness [43,44]. The water depth increased during the Paleocene (66–56 Ma) and reach the maximum at end of the E1m. During the uplift and erosion period of Oligocene (41–23 Ma), the sea level fall and water depth tend to be zero with the formation uplifting (Figure 11). The sediment water interface temperature (SWIT) is the top boundary condition of heat transmit in a sedimentary basin [45]. In this study, the SWIT is automatically calculated by the PetroMod software module based on the method of Wygrala [46]. It shows the variations of mean surface paleo temperatures through geological times classified by the paleo latitudes of the sedimentary basin [45]. Then a standard temperature at sea level over geological time was extracted with the given geographic location and paleo latitude at present day. The SWI-Temperature curve used in the model was also corrected by the paleo water depth changing (Figure 11).
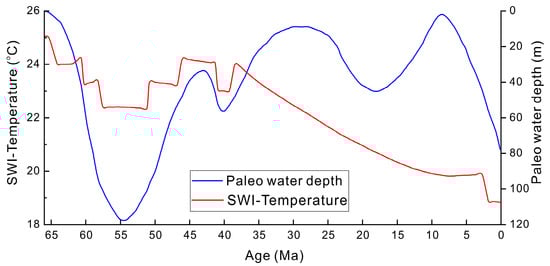
Figure 11.
The paleo water depth and sediment water interface temperature (SWI-Temperature) curves through geologic time.
The heat flow represents the lower boundary condition of the heat transfer input into a sedimentary basin [45]. The thermal evolution in the study area is important to the source rock maturation and hydrocarbon expulsion. The present-day temperature gradient measured by bore hole temperature test data is around 2.99 °C/100 m. The heat flow measurements show that the present-day heat flow in the East China Sea Shelf Basin (ECSSB) is around 58.6 mW/m2, varying from 56 to 88.6 mW/m2 [47]. The heat flow evolution after the Mesozoic was mainly influenced by the lithospheric stretching activities. The heat flow evolution research of the ECSSB suggests that the paleo heat flow was around 80 mW/m2 (67–93 mW/m2 for individual wells) at the end of the Paleocene (56 Ma), at which time the strata experienced the maximum formation temperature before cooling to the present [48]. As shown in Figure 12A, the heat flow trend is considered to vary by 13 mW/m2 around the nominal heat flow trend 2. We used different heat flow scenarios to construct the single well model to simulate the temperature and vitrinite reflectance [49,50,51]. For example, we used three heat flow scenarios for the Well LS36-A model, and the formation temperature and vitrinite reflectance fit the heat flow trend 1 better (Figure 12B,C).
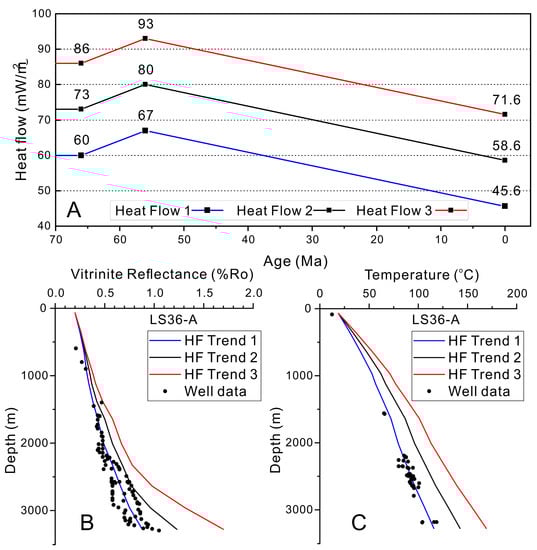
Figure 12.
(A) The heat flow trends used to recover the paleo heat flow in the Lishui Sag. Heat flow 1 refers to the minimum trend and heat flow 3 refers to the maximum trend. The heat flow uncertainty is estimated to be 13 mW/m2 above or below that of heat flow trend 2. (B) The vitrinite reflectance simulated using the three heat flow trends (curves with different colors) and measured data (dots). (C) The formation temperature calculated using different heat flow trends and measured data.
In this way, five wells with formation temperature and vitrinite reflectance measured data (Well LS36-A, LS36-B, LS35-A, LS35-B and LF1) and four wells with one kind of calibration measured data (Well NP6, NP11, LS23 and S1) are used to define the heat flow trend for each well in the study area (Figure 12B,C, Figure 13B–I). The individual heat flow evolutionary trends are calibrated to plot the heat flow distribution maps and the heat flow at 0 Ma is shown in Figure 13A. Also, the heat flow maps at different age are separately calibrated and drawn.
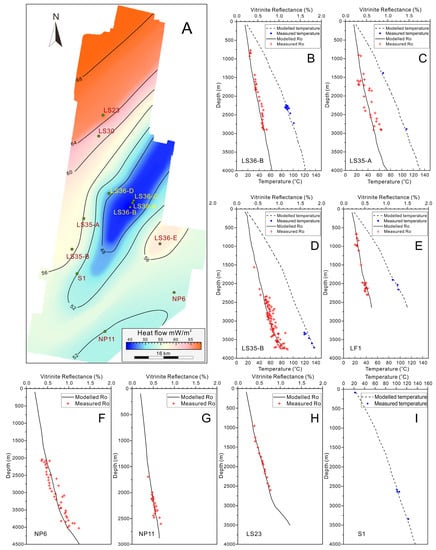
Figure 13.
(A) Present-day heat flow distribution map based on the single well heat flow reconstruction (left). (B–I) The formation temperatures and vitrinite reflectance data for the 8 wells in the study area. The modelled formation temperature and vitrinite reflectance versus depth curve fit well with the measured data. The heat flow used in the simulation are shown in the map Figure 13A. The paleo heat flow evolution followed the trend in Figure 12.
4. Study Results
The combination of source rock, reservoir rock, seal rock and boundary conditions form the model. After the model simulation, we can get abundant results including the overall prospectivity of the basin and the detailed hydrocarbon distributions in each reservoir during the whole geological time. The maturity of the source rock layers are shown in Figure 14. In Figure 14A, the central part of the E1y reached the gas generation stage with Ro over 1.0%. The west slope of the west sub-sag and southern part have lower maturity. The east sub-sag has lower maturity due to the less burial depth but still reach the oil-generating peak stage. The whole Lower E1l source rock entered the oil generation threshold (Figure 14B) and the deep regions acquired higher vitrinite reflectance over 1.3%. The high maturity areas are the sags at the west side of the Lingfeng Uplift. The maturity in Figure 14C was more evenly distributed at main oil stage.
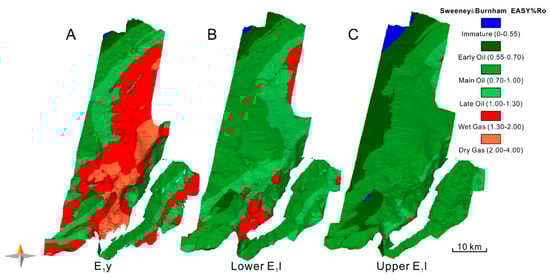
Figure 14.
(A) Modelled maturity maps at present day for the E1y; (B) Modelled maturity maps for the Lower E1l; (C) Modelled maturity maps for the Upper E1l. The higher maturities have been reached in the central part of the west sub-sag. The missing area between the sub-sags represents the Lingfeng Uplift.
Figure 15 shows the maturity and burial history of two typical wells in the west and east sub-sags. The maximum burial depth at Well LS36-A was around 6500 m while the depth at Well NP6 reached 4700 m. The source rocks enter the hydrocarbon generation threshold at burial depth of 2300 m. The E1y entered the hydrocarbon threshold at 58 Ma, Lower E1l at 56 Ma, Upper E1l at 53 Ma (Figure 15, Figure 16A). Hydrocarbon source rocks transformation ratio (TR) is generally defined as the present hydrocarbon potential divided by the initial hydrocarbon generation potential. When the TR reach 100%, it means that hydrocarbon part in the source rocks completely supply the oil and gas generation, and the hydrocarbon generation potential has been exhausted. The TR of the source rock in the Lishui Sag rose quickly after the source rock entered the oil window. The kerogen from E1y and Lower E1l continued transforming into hydrocarbon until 48 Ma, before the deposition of Wenzhou Formation. The TR rose slowly from 53 Ma to present day and reached a high stage. The TR of the source rocks from E1y, Lower E1l and Upper E1l slowly increased to 77%, 62% and 22%. The high transformed E1y and Lower E1l formations are the main petroleum generating source rocks.
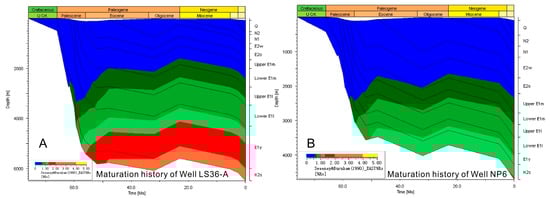
Figure 15.
(A) Maturation and burial history of the Well LS36-A in the west sub-sag of the Lishui Sag. (B) Maturation and burial history of the Well NP6 in the east sub-sag of the Lishui Sag.
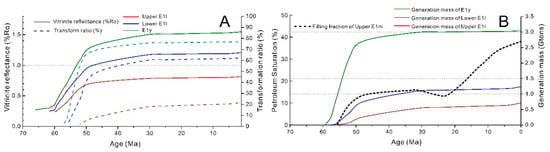
Figure 16.
(A) Maturity evolution for each source rock according to vitrinite reflectance (solid lines) and transformation ratio (dash lines). (B) The bulk generation mass evolution of three main source rock: E1y, Lower E1l and Upper E1l (solid lines), and the petroleum filling saturation history in the Upper E1m for Well LS36-A (dash line).
5. Discussion
5.1. Hydrocarbon Generation and Expulsion
The main hydrocarbon generation period can be figured out by the generation rate and mass of the source rocks. As we can see, the generation mass has a positive relation with the transformation rate and source rock maturation in Figure 16. In Figure 15 we can see the vitrinite reflectance didn’t increase after the regional erosion event began at 32 Ma. The generation mass of E1y source rock is significantly larger than the Upper and Lower E1l source rock. The generation of hydrocarbon from source rocks last from 58 Ma to 32 Ma. The first hydrocarbon filling history began from 56 Ma and lasted until the erosion event started at 32 Ma (Figure 3, Table 1 and Figure 16B). The second filling period started from 23 Ma after the erosion and continued to nowadays.
The fluid inclusion analysis technique is used widely in the orientation of hydrocarbon pool forming and the homogenization temperature indicates the temperature of reservoir forming and fluid injection [52]. The fluid inclusions analysis of six core samples from Well LS36-A and LS36-B Lower E1m sandstone show the major distribution zone of homogenization temperature is between 85 °C and 95 °C. There were also a group of results gather around 125 °C and 135 °C (Figure 17A). However, on the basis of geological temperature history simulation, the temperature of Lower E1m never reached this high degree (Figure 17B). The higher homogenization temperature of fluid inclusions related to local volcanic activities in the southern part of the west sub-sag, and the composition of gas inclusions is mainly CO2. According to the formal researches, the volcanic activities mainly in the Late Miocene which are unrelated to the petroleum generation [53,54].
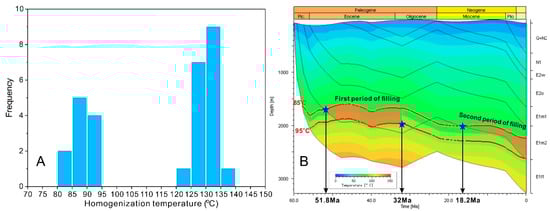
Figure 17.
Determine the petroleum filling period using the fluid inclusion homogenization temperature analysis method. (A) Homogenization temperature distribution diagram from sandstone samples from Well LS36-A and Well LS36-B. (B) 1D structure and temperature history model of Well LS36-A indicating the two periods of hydrocarbon filling.
When combined with the burial and temperature history map of Well LS36-A, the reservoir forming period can be limited between 51.8 Ma and 32 Ma. The second filling process started from 18.2 Ma to now. The model simulation gave the filling process (petroleum saturation) through geologic history, which is calculated by the 3D basin hydrocarbon generation, migration and accumulation. The homogenization temperature and filling time recovery focused on the 1D single well burial and temperature history. They are two different perspectives to solve the problem. The reservoir forming time figured out by model simulation (Figure 16B) and inclusion homogenization temperature method (Figure 17) draw the similar conclusion which confirmed the accuracy of the result. The long term hydrocarbon filling history has positive effect to the gas reservoir forming.
This study find out that the first phase of filling is from the early Eocene to the early Oligocene, the second phase is from the early Miocene to the present. In the former literature, scholars support the idea of three petroleum charge periods [7,10,11]. The diverse charging time intervals worked out by different scholars put the high homogenization temperature (>120 °C) into consideration. In fact, after the heat flow calibration we discover that the maximum formation temperature the E1m reached is 100 °C.
5.2. Hydrocarbon Migration and Accumulation
The hydrocarbon migration path from source to reservoir in three dimension was simulated in the 3D basin model, which is unavailable using 1D and 2D modelling. The hydrocarbon can be both accumulated in the sandstone and siltstone reservoir due to the horizontal cap of the E2o Formation.
From the plot of the simulated hydrocarbon expulsion direction (Figure 18A) it can be seen that the E1y source rock generated oil (green arrow). As the burial depth increased rapidly, formation temperature also rose sharply, and the original oil cracked into gas, so that subsequent hydrocarbon generation formed wet and dry gas (red arrow). The main hydrocarbon generating zones located at the east of the Lingfeng Uplift. The upward migration of oil and gas moved into Upper and Lower E1m Formation reservoir. As shown in Figure 18B, the migration path follows the fluid potential and affected by faults and physical properties. The main migration direction is from the site of source rock kitchen to the slope zone. The gas zones occur in the anticline and faulted anticline structures. The oil zones occur in the lower structures and lithologic traps. The LS36-A structure is a good anticline structure for petroleum accumulation and preservation.
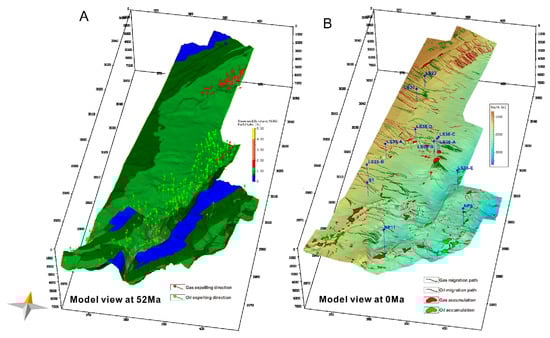
Figure 18.
(A) 3D model view of E1y at 52 Ma (during the deposition of E2o), showing the hydrocarbon displacement vectors at the first petroleum charge period. (B) The oil and gas migration path and accumulation areas of Upper E1m in the study area (at present).
6. Conclusions
We constructed a detailed 3D model of the basin with several wells and seismic data to get the inner evolutionary process of the basin, which is the key for petroleum exploration. The simulation could be made more accurate with additional analytical data and refined boundary conditions for the model. In this research, reservoir physical properties and multiple lithology distribution modelling were used to improve the accuracy of lithological hydrocarbon reservoir modelling. The heat flow calibration and detailed boundary condition settings contributed to the refined petroleum system modelling and verified the accuracy of the results.
3D petroleum system modelling of the Lishui Sag indicates that the major hydrocarbon source rocks is argillaceous shale in the Yueguifeng Formation. The peak hydrocarbon generation period is from 58 Ma to 50 Ma, the petroleum generation period lasted until 32 Ma when the regional erosion event occurred. The main hydrocarbon generating zones located at the east of the Lingfeng Uplift. The main migration direction is from the site of source rock kitchen to the slope zone with the effect of faults and lithology. The primary reservoir forming and petroleum charging event took place between early Eocene and the end of Eocene (51.8 Ma–32 Ma). The second period of hydrocarbon accumulation is from early Neogene to present (23 Ma–0 Ma). Because of the source rock properties along with the high temperature and high pressure deposition environment, the hydrocarbon types of Lishui Sag are mainly gas and gas condensate. Regional uplift and erosion, the location of the source rock kitchens and fault-lithologic distribution play the important role in the petroleum pool forming in the Lishui Sag. In the further research, the model of the whole basin can be established to get a more macroscopic vision.
Author Contributions
Conceptualization by J.Z., J.G. and J.L., model construction by J.G., source rock analysis by W.S., erosion thickness calculation by N.L. and RMS amplitude research by G.X.; J.G. and J.Z. contributes to the writing of the manuscript.
Funding
This study was supported by the Major National R&D Projects of China (No.2016ZX05027-001-006). We are grateful to CNOOC for supplying the research data and permitting the publication of this research.
Conflicts of Interest
The authors declare no conflict of interest.
References
- Chen, J.P.; Ge, H.P.; Chen, X.D.; Deng, C.P.; Liang, D.G. Classification and origin of natural gases from Lishui Sag, the East China Sea Basin. Sci. China Ser. D-Earth Sci. 2008, 51, 122–130. [Google Scholar] [CrossRef]
- Cheng, Z.Y.; Wu, P.K.; Wu, Z.X. Petroleum geology and exploration potential of Lishui Sag. China Offshore Oil Gas (Geol.) 2000, 14, 384–391. [Google Scholar]
- Li, D.Y.; Jiang, X.D.; Xu, F.; Liu, J.S.; Hou, G.W. Geochemistry of the Paleocene in Lishui Sag, East China Sea Shelf Basin: Implications for Tectonic Background and Provenance. Acta Geol. Sin.-Engl. Ed. 2016, 90, 166–181. [Google Scholar]
- Xu, F.; Li, X.; Zhang, J.L.; Zhang, G.X. Three-dimensinal Structure Modeling of Lishui Depression, East China Sea Basin. Adv. Mater. Res. 2014, 853, 663. [Google Scholar] [CrossRef]
- Liu, J.S.; Zhang, M.; Zhang, J.L.; Wang, C.Y.; Zhang, P.H. Tectonic evolution and sequence filling of Paleocene in Lishui Sag, East China Sea Shelf Basin. Adv. Mater. Res. 2013, 807–809, 2244. [Google Scholar] [CrossRef]
- Liu, J.S.; Li, X.; Zhang, J.L.; Li, C.L. 3D Visualization for Detailed Sedimentary-Facies Modeling of Lishui Depression, East China Sea Basin. Appl. Mech. Mater. 2014, 442, 489. [Google Scholar] [CrossRef]
- Su, A.; Chen, H.H.; Cao, L.S.; Lei, M.Z.; Wang, C.W.; Liu, Y.H.; Li, P.J. Genesis, source and charging of oil and gas in Lishui sag, East China Sea Basin. Pet. Explor. Dev. 2014, 41, 574–584. [Google Scholar] [CrossRef]
- Jiang, Z.L.; Li, Y.J.; Du, H.L.; Zhang, Y.F. The Cenozoic structural evolution and its influences on gas accumulation in the Lishui Sag, East China Sea Shelf Basin. J. Nat. Gas Sci. Eng. 2015, 22, 107–118. [Google Scholar] [CrossRef]
- Liu, J.S. Fine description of structure research of Lishui sag, East China Sea Basin. Arab. J. Geosci. 2015, 8, 4433–4441. [Google Scholar] [CrossRef]
- Ge, H.P.; Chen, Z.Y.; Fang, L.F.; Shen, W.F. A discussion on hydrocarbon accumulation periods in Lishui Sag, East China Sea Basin. China offshore Oil Gas (Geol.) 2003, 17, 44–49. [Google Scholar]
- Tian, Y. Study on hydrocarbon accumulation rule in the Lishui Sag, East China Sea Continental Shelf Basin. Master dissertation, China University of Geosciences, Wuhan, China, 2013. [Google Scholar]
- Welte, D.H.; Yukler, M.A. Petroleum Origin and Accumulation in Basin Evolution—A Quantitative Model. AAPG Bull. 1981, 65, 1387–1396. [Google Scholar]
- Welte, D.H.; Yalcin, M.N. Basin Modeling—A New Comprehensive Method in Petroleum Geology. Org. Geochem. 1988, 13, 141–151. [Google Scholar] [CrossRef]
- Bruns, B.; Primio, R.D.; Berner, U.; Littke, R.J.G. Petroleum system evolution in the inverted Lower Saxony Basin, northwest Germany: A 3D basin modeling study. Geofluids 2013, 13, 246–271. [Google Scholar] [CrossRef]
- Bruns, B.; Littke, R.; Gasparik, M.; van Wees, J.D.; Nelskamp, S. Thermal evolution and shale gas potential estimation of the Wealden and Posidonia Shale in NW-Germany and the Netherlands: A 3D basin modelling study. Basin Res. 2016, 28, 2–33. [Google Scholar] [CrossRef]
- Brandes, C.; Astorga, A.; Littke, R.; Winsemann, J. Basin modelling of the Limon Back-arc Basin (Costa Rica): Burial history and temperature evolution of an island arc-related basin-system. Basin Res. 2008, 20, 119–142. [Google Scholar] [CrossRef]
- Sachse, V.F.; Anka, Z.; Littke, R.; Rodriguez, J.F.; Horsfield, B.; di Primio, R. Burial Temperature and Maturation History of the Austral and Western Malvinas Basins, Southern Argentina, Based on 3d Basin Modelling. J. Pet. Geol. 2016, 39, 169–191. [Google Scholar] [CrossRef]
- Schneider, F.; Wolf, S.; Faille, I.; Pot, D. A 3D basin model for hydrocarbon potential evaluation: Application to Congo offshore. Oil Gas Sci. Technol.-Rev. D Ifp Energies Nouv. 2000, 55, 3–13. [Google Scholar] [CrossRef]
- Zhang, M.; Zhang, J.L.; Xu, F.; Li, J.Z.; Liu, J.S.; Hou, G.W.; Zhang, P.H. Paleocene sequence stratigraphy and depositional systems in the Lishui Sag, East China Sea Shelf Basin. Mar. Pet. Geol. 2015, 59, 390–405. [Google Scholar] [CrossRef]
- Su, A.; Chen, H.H.; Wang, C.W.; Li, P.J.; Zhang, H.; Xiong, W.L.; Lei, M.Z. Genesis and maturity identification of oil and gas in the Xihu Sag, East China Sea Basin. Pet. Explor. Dev. 2013, 40, 558–565. [Google Scholar] [CrossRef]
- Verweij, H. Basin Modeling Perspectives Preface. Mar. Pet. Geol. 2009, 26, 427–429. [Google Scholar] [CrossRef]
- Zhang, G.H.; Li, S.Z.; Suo, Y.H.; Zhang, J.P. Cenozoic positive inversion tectonics and its migration in the East China Sea Shelf Basin. Geol. J. 2016, 51, 176–187. [Google Scholar] [CrossRef]
- Zhang, J.P.; Zhang, T.; Tang, X.J. Basin type and dynamic environment in the East China Sea Shelf Basin. ACTA Geol. Sin. 2014, 88, 2033–2043. [Google Scholar]
- Xia, B.; Zhang, M.Q.; Wan, Z.F.; Sun, X.Y.; Lv, B.F. Structural styles and hydrocarbon prospects in the Lishui-Jiaojiang Sag, the East China Sea. S. China J. Selsmology 2007, 27, 1–8. [Google Scholar]
- Zhang, S.L.; Xia, B. Characters of tectonic evolution of the Lishui-Jiaojiang Sag and oil accumulation. Nat. Gas Geosci. 2005, 16, 324–328. [Google Scholar]
- Cukur, D.; Horozal, S.; Kim, D.C.; Han, H.C. Seismic stratigraphy and structural analysis of the northern East China Sea Shelf Basin interpreted from multi-channel seismic reflection data and cross-section restoration. Mar. Pet. Geol. 2011, 28, 1003–1022. [Google Scholar] [CrossRef]
- Hantschel, T.; Kauerauf, A.I. Fundamentals of Basin and Petroleum Systems Modeling; Springer: Berlin/Heidelberg, Germany, 2009. [Google Scholar]
- Baniasad, A.; Rabbani, A.; Sachse, V.F.; Littke, R.; Moallemi, S.A.; Soleimany, B. 2D basin modeling study of the Binak Trough, northwestern Persian Gulf, Iran. Mar. Pet. Geol. 2016, 77, 882–897. [Google Scholar] [CrossRef]
- Mohsenian, E.; Fathi-Mobarakabad, A.; Sachsenhofer, R.F.; Asadi-Eskandar, A. 3D Basin Modelling in the Central Persian Gulf, Offshore Iran. J. Pet. Geol. 2014, 37, 55–70. [Google Scholar] [CrossRef]
- Rodrigues Duran, E.; di Primio, R.; Anka, Z.; Stoddart, D.; Horsfield, B. 3D-basin modelling of the Hammerfest Basin (southwestern Barents Sea): A quantitative assessment of petroleum generation, migration and leakage. Mar. Pet. Geol. 2013, 45, 281–303. [Google Scholar] [CrossRef]
- Dow, W.G. Kerogen Studies and Geological Interpretations. J Geochem. Explor. 1977, 7, 79–99. [Google Scholar] [CrossRef]
- Magara, K. Thickness of Removed Sedimentary-Rocks, Paleopore Pressure, and Paleotemperature, Southwestern Part of Western Canada Basin. AAPG Bull. 1976, 60, 554–565. [Google Scholar]
- Li, D.Y.; Guo, T.Y.; Jiang, X.D.; Zhao, H.Q.; Wang, H.P. Erosion thickness recovery and tectonic evolution characterization of southern East China Sea Shelf Basin. Oil Gas Geol. 2015, 36, 913–923. [Google Scholar]
- Cohen, K.M.; Finney, S.C.; Gibbard, P.L.; Fan, J.X. The ICS International Chronostratigraphic Chart. Available online: https://dspace.library.uu.nl/handle/1874/289106 (accessed on 15 February 2019).
- Athy, L.F. Density, porosity, and compaction of sedimentary rocks. Bull. Am. Assoc. Pet. Geol. 1930, 14, 1–24. [Google Scholar]
- Fowler, A.C.; Yang, X.-S. Fast and Slow Compaction in Sedimentary Basins. SIAM J. App. Math. 1998, 59, 365–385. [Google Scholar] [CrossRef]
- Liu, H.; Xia, Q.L.; Zhou, X.H. Geologic-seismic models, prediction of shallow-water lacustrine delta sandbody and hydrocarbon potential in the Late Miocene, Huanghekou Sag, Bohai Bay Basin, northern China. J. Palaeogeogr. 2018, 7, 66–87. [Google Scholar] [CrossRef]
- Tayyab, M.N.; Asim, S. Application of spectral decomposition for the detection of fluvial sand reservoirs, Indus Basin, SW Pakistan. Geosci. J. 2017, 21, 595–605. [Google Scholar] [CrossRef]
- Penguang, A.S.A.; Lubis, L.A.; Hermana, M.; Ghosh, D.P. Study of Rock Physics and Seismic Attributes of Hydrocarbon Reservoirs in Sabah Basin. Available online: http://iopscience.iop.org/article/10.1088/1755-1315/88/1/012009/meta (accessed on 15 February 2019).
- Burnham, A.K. A Simple Kinetic Model of Petroleum Formation and Cracking; Lawrence Livermore National Laboratory: Livermore, CA, USA, 1989.
- Tissot, B.P.; Welte, D.H. Petroleum Formation and Occurrence; Springer: Berlin, Germany, 1984. [Google Scholar]
- Espitalie, J. Use of Tmax as a maturation index for different types of organic matter: Comparison with vitrinite reflectance. Thermal Model. Sediment. Basins 1986, 44, 475–496. [Google Scholar]
- Zhang, Y.G.; Ge, H.P.; Yang, Y.Q.; Liang, J. Division and controlling factors of Paleocene sequence strata in Lishui Sag, East China Sea Shelf Basin. Mar. Orig. Pet. Geol. 2012, 17, 33–39. [Google Scholar]
- Wu, F.D.; Li, S.T.; Lu, Y.C.; Li, P.L.; Zhou, P.; Zhao, J.H. The tertiary sea-level changes in the East China Sea Shelf Basin. Sci. Geol. Sin. 1998, 33, 214–221. [Google Scholar]
- Yalçin, M.N.; Littke, R.; Sachsenhofer, R.F. Thermal History of Sedimentary Basins. In Petroleum and Basin Evolution; Welte, D.H., Horsfield, B., Baker, D.R., Eds.; Springer: Berlin, Germany, 1997. [Google Scholar]
- Wygrala, B.P. Integrated Study of an Oil Field in the Southern Po Basin, Northern Italy. Ph.D. dissertation, University of Cologne, Cologne, Germany, 1989. [Google Scholar]
- Li, G.B.; Liu, B.H.; Li, N.S. A probe heat flow value of the East China Sea shelf. Chin. J. Oceanol. Limnol. 2006, 24, 243–249. [Google Scholar]
- Yang, S.C.; Hu, S.B.; Cai, D.S.; Feng, X.J.; Chen, L.L.; Le, G. Present-day heat flow, thermal history and tectonic subsidence of the East China Sea Basin. Mar. Pet. Geol. 2004, 21, 1095–1105. [Google Scholar] [CrossRef]
- Larter, S. Chemical-Models of Vitrinite Reflectance Evolution. Geol. Rundsch. 1989, 78, 349–359. [Google Scholar] [CrossRef]
- Lerche, I.; Yarzab, R.F.; Kendall, C.G.S.C. Determination of Paleoheat Flux from Vitrinite Reflectance Data. AAPG Bull. 1984, 68, 1704–1717. [Google Scholar]
- Sweeney, J.J.; Burnham, A.K. Evaluation of a Simple-Model of Vitrinite Reflectance Based on Chemical-Kinetics. AAPG Bull. 1990, 74, 1559–1570. [Google Scholar]
- Zhang, J.L.; Chang, X.C.; Liu, B.J.; Mao, F.M. Fluid history analysis and formation mechanism of the Yancheng petroleum reservoir. ACTA Geol. Sin. 2002, 76, 252–260. [Google Scholar]
- Huang, Y.H.; Tarantola, A.; Wang, W.J.; Caumon, M.C.; Pironon, J.; Lu, W.J.; Yan, D.T.; Zhuang, X.G. Charge history of CO2 in Lishui sag, East China Sea basin: Evidence from quantitative Raman analysis of CO2-bearing fluid inclusions. Mar. Pet. Geol. 2018, 98, 50–65. [Google Scholar] [CrossRef]
- Zhao, S.; Liu, L.; Liu, N. Petrographic and stable isotopic evidences of CO2-induced alterations in sandstones in the Lishui sag, East China Sea Basin, China. Appl. Geochem. 2018, 90, 115–128. [Google Scholar] [CrossRef]
© 2019 by the authors. Licensee MDPI, Basel, Switzerland. This article is an open access article distributed under the terms and conditions of the Creative Commons Attribution (CC BY) license (http://creativecommons.org/licenses/by/4.0/).