Abstract
The oil and gas industry is looking for ways to accurately identify and prioritize the failure modes (FMs) of the equipment. Failure mode and effect analysis (FMEA) is the most important tool used in the maintenance approach for the prevention of malfunctioning of the equipment. Current developments in the FMEA technique are mainly focused on addressing the drawbacks of the conventional risk priority number calculations, but the group effects and interrelationships of FMs on other measurements are neglected. In the present study, a hybrid distribution risk assessment framework was proposed to fill these gaps based on the combination of modified linguistic FMEA (LFMEA), Analytic Network Process (ANP), and Decision Making Trial and Evaluation Laboratory (DEMATEL) techniques. The hybrid framework of FMEA was conducted in a hazardous environment at a power generation unit in an oil and gas plant located in Yemen. The results show that mechanical and gas leakage FM in electrical generators posed a greater risk, which critically affects other FMs within the plant. It was observed that the suggested framework produced a precise ranking of FMs, with a clear relationship among FMs. Also, the comparisons of the proposed framework with previous studies demonstrated the multidisciplinary applications of the present framework.
1. Introduction
In the field of reliability and safety engineering, a number of powerful risk investigation tools have been established and applied. Failure mode and effect analysis (FMEA) is a structured technique to identify possible FMs and their consequences for the system during the process or design stage within a life period [1]. Furthermore, FMEA is extended for a criticality analysis to Failure Mode, Effects Critical Analysis (FMECA). In the 1960s, National Aeronautics and Space Administration (NASA) introduced the design FMEA approach for reliability and safety purpose in the aerospace industry [2]. The FMEA is categorized as a functional design and process [3,4].
Industries dealing with the production and maintenance of machines have to be reliable in order to meet the market demand and maintain integrity. To achieve reliability of the functional working machines, FMEA suggests a structured procedure for preventing failures or to reduce the effect of their consequences [5]. According to Doostparast, et al. [6], FMEA is used in preventative activities for the most important maintenance planning. However, the high-risk components must be inspected and maintained frequently rather than components with a lower risk [7,8].
Studies have shown that FMEA has a wide area of application that ranges from wind turbine reliability, healthcare, automotive, nuclear, and manufacturing [9,10,11,12,13]. Moreover, in the electrical distribution field, FMEA has been used in the determination of critical equipment and is mostly combined with a reliability centered maintenance (RCM) to improve the maintenance reliability [14].
The work of Matteson [15] shows the identification process for FMs and their consequences with the classification of the severity and occurrence. In another development, Scipioni [16] reveals that FMs are ranked through their risk priority number (RPN), which is a multiplication of three factors: occurrence, detection, and severity (O,D,S). In spite of all the advantages of FMEA, several studies have reported its shortfalls, as follows [11,12,17,18,19,20,21,22,23,24]:
- The same RPN value may be generated from different values of O, S, and D; however, their hidden risk rank could be wholly dissimilar.
- RPN calculation considers that the three risk elements have the same important weight, which is difficult to be installed in practice.
- Three factors are difficult to accurately evaluate by experts with a different background.
- Interdependencies are not considered between several failure approaches and effects.
Several methods have been proposed to overcome the drawback of FMEA, for instance, fuzzy theory with the Analytical Hierarchy Process (AHP) [25], Technique for Order of Preference by Similarity to Ideal Solution (TOPSIS) [26], VIKOR (an acronym in Serbian of multi-criteria optimization and compromise solution) [27], ANP-DEMATEL [28], and House of Reliability (HOR) with VIKOR [17].
The DEMATEL, AHP, and ANP are the essential multi-criteria decision-making (MCDM) approaches. The DEMATEL method was established by the Battelle Memorial Institute to solve complex and interrelated issues [29], whereas ANP, which is an extension method of AHP, was introduced by Saaty [30]. A critical comparison of ANP and AHP revealed that ANP has more advantages than AHP due to the ability of AHP to deal with the variation of the internal relationship, interdependencies, and reaction feedback among alternatives and criteria across the hierarchies [31]. Similarly, clear advantages of ANP over AHP have been demonstrated by Saaty [30] and Liang [32]. These are:
- (1)
- The ability to clarify the independence on alternatives or criteria.
- (2)
- The ability to offer the interdependence between the criteria in the same cluster and offer feedback of alternatives or sub-criteria to the main criteria.
However, using the “supermatrix” as a new calculation procedure in ANP presents another successful method in maintenance tasks. It is very often observed that the Fuzzy ANP method has a capability to deal with uncertain decision makers [33]. For instance, ANP was used in risk assessment and decision-making effectiveness [34]. Moreover, ANP was also combined with Quality Function Deployment (QFD) to improve the decision analysis and assessment in many applications, such as in the development process for requirements of Product Service System (PSS) [35], and hazard assessment for working tasks in construction industry [36]. Furthermore, ANP and DEMATEL were combined to be used as the best risk tool due to the ability to visualize the difficulty of interrelationships, dependencies, and feedbacks, among factors [37]. According to Dedasht [38], DEMATEL-ANP is the best risk technique that assists the decision maker in estimating problems and making decisions. The DEMATEL-ANP methodology has been applied to different research disciplines, such as the crude oil supply chain [37], oil and gas construction projects [38], product development [39], and green project management [40]. Moreover, some of the risk priority frameworks were developed to improve the traditional FMEA technique, such as waste priority number and fuzzy RPN with alpha levels [41]. Furthermore, an extended RPN calculation has been proposed for multiple risk factors, with a weight value to add the failure importance value to the system [24]. The work of Li and Wu [42] has clearly demonstrated the application of text mining to extract hidden reliability and risk information from traditional FMEA reports. However, the study did not cover the effect of the interrelationships between the failure mode and the failure cause.
In the previous studies, it was observed that FMEA frameworks were modified to simplify the failure modes analysis and prioritization [43,44,45,46]. Similarly, the work of Nazeri and Naderikia [28] has clearly demonstrated an improved traditional FMEA by integrating expert weights, fuzzy methods, and other techniques into the analysis. However, unlike the study of Nazeri and Naderikia [28], most of the improved versions lack a focus on the back impact of failure modes on the main domain.
To our knowledge, no previous research focuses on establishing the relationship among different FMs and domains with the impact of external risk within a hazardous environment, especially the oil and gas area. Therefore, a new approach is needed to fill this gap. Hence, a new risk ranking framework was proposed via linguistic FMEA (LFMEA), DEMATEL, and ANP techniques to overcome the drawbacks of traditional FMEA.
The aim of this paper is to introduce a hybrid FMEA framework with the objective to overcome the problems associated with traditional FMEA, with a clear graphic representation of clusters and the FMs interrelationship.
The rest of this paper is organized as follows. Section 2 describes the new hybrid risk priority framework using the linguistic FMEA, ANP, and DEMATEL approach. Section 3 and Section 4 demonstrate the discussion and results of the framework implementation using a case study in a Yemen oil and gas plant of the electrical generators. Finally, Section 5 concludes the paper with future work.
2. Proposed Method of Hybrid LFMEA Framework
A hybrid risk priority framework was developed based on linguistic FMEA, ANP, and DEMATEL approaches. The expert weights are calculated to obtain a more precise weight of risk factors. Figure 1 shows the methodology of the proposed framework for the FMs ranking in the oil and gas industry with a hazardous environment.
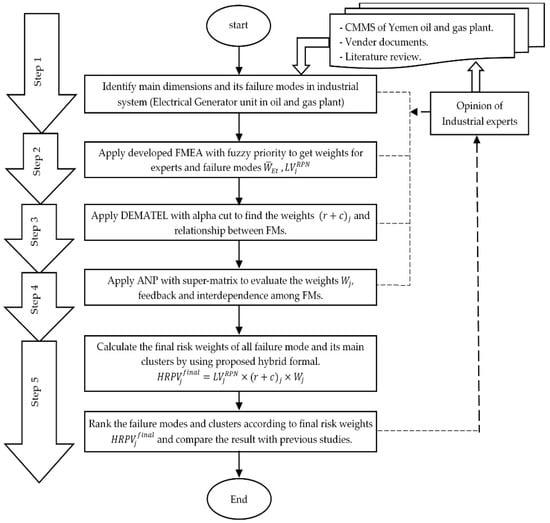
Figure 1.
The proposed methodology of the framework.
The methodology of the proposed framework consists of five steps and is described as follows:
Step 1: Classify main dimensions and failure modes of the system in the industrial plant to be analyzed through the methodology. Data is extracted from the Computerized Maintenance Management System (CMMS) database, vendor documents, a literature review, and the opinion of experts. A team of experts will structure and organize the data into main risk factor dimensions and failure modes , where is the number of failure modes.
2.1. Extended Linguistic FMEA
Linguistic FMEA uses linguistic variables that were introduced by Zadeh [47] to handle the conditions to be expressed, which are complex or vague. The linguistic scale , where is a variable and represents the possible linguistic value. Ordinarily, the suitable language scale is identified by expert members for use in the RPN qualitative evaluation, where the number of scale elements is , and these linguistic values have the following properties [48,49]:
Every expert has a different background, knowledge, and personal experience. As a result, they may have the risk of a bias in their evaluation during FMEA assessment. Consequently, extended LFMEA uses the fuzzy priority and linguistic operator techniques to determine the expert weights according to their prejudices. Thus, the influence of a bias on the FMEA assessment is reduced [49].
Step 2: Apply the improved linguistic FMEA risk evaluation method to obtain weights for experts and failure modes with the main clusters based on fuzzy priority and the linguistic operator.
In this step, the weights of risk factors and experts are determined to obtain the linguistic priority risk number for every FM. The steps of the proposed LFMEA method are introduced as follows:
- (i)
- Calculate the risk factor weights by the experts as through an Analytic Network Process (ANP) where .
- (ii)
- Calculate linguistic evaluation matrix values for main risk factor clusters of failure mode, which will consist of rows of expert and columns of main FM clusters., whereare risk language evaluation weights given by expert for failure mode, where is the expert weight.
- (iii)
- Calculate the risk priority number for every main risk factor and expert member with power of weights of the risk factor , where is the risk constant calculated by experts.
- (iv)
- Calculate a weight for every expert by using the fuzzy priority matrix F for the prioritization purpose, as in Equations (2)–(5).Rank of failure modes for every expert { is (Note: C > D, means C leads D).Construct the matrix F of the fuzzy priority matrix for the prioritization purpose with failure mode fuzzy preference for failure mode. Describe the partial order of the fuzzy priority number [49]:For example, if the rank of failure modes for an expert is equal to the ordering consistency index will be .Then, calculate the summation of every row in the fuzzy priority matrix F and rank them to get . Assume the rank of the summation column is , and will be calculated in the same equation used with a consistency index [49]:Then, calculate the expert constant :
- (v)
- Determine the linguistic priority risk number for every failure mode using expert weights.
2.2. DEMATEL Approach
Step 3: Identify the relationship weights between the main risk factor dimensions and failure modes using the DEMATEL approach through a pairwise comparison matrix and using the following steps [50,51]:
- Determine the direct relation matrix D by pairwise comparisons. Experts are questioned to give the influence values as the pair-wise comparison between each pair of the main risk factor or within each cluster of failure mode elements. These calculations will give a matrix D with the dimensions of m × m:
- Calculate the normalized direct relation N as the following equation:The normalization factor is
- Calculate the total-influence matrix T by the following equation formula:
- The cause and effect relationships are determined by the total relation matrix T, where are the summation of row and column , respectively, as follows:
- Finally, draw the cause and effect graph after removing some negligible effects in matrix T through calculating a threshold value α [52].The cause and effect graph can be drawn by plotting the data set of as the x-axis to ( as the y-axis.
2.3. ANP Approach
ANP is used to identify the special dependence effects between the risk factors with the help of experts to evaluate every possible failure mode and risk by pairwise comparison to form super-matrix weights. The ANP methodology is described in the following step.
Step 4: Apply the ANP process to evaluate the weights of all failure mode risks. The details of the ANP method are described in the following [30,53,54]:
- Arrange failure modes and clusters of the network structure based on the nature of the relationship between clusters and failure modes. The influence of clusters and FMs can be exemplified in the following supermatrix, which will provide the feedback and the interdependence of FMs in the higher level in ANP.
- The weights of the supermatrix are calculated through the expressionwhere A is the pairwise comparison matrix, is the largest eigenvalue of , and is an eigenvector.The inconsistency ratio (CR) for the pairwise comparison matrix must be smaller than 0.1 [55]:where RI is a random inconsistency value.
- Calculate the weighted supermatrix by dividing each column by its summation.
- Calculate the limit supermatrix by powering the weighted supermatrix to (2k + 1) to get the equalized weights, as follows:
2.4. Hybrid Risk Priority Weight
The final ranking of failure modes is conducted by the final weight formal of the proposed framework that is described in the following step.
Step 5: Calculate the final risk weights of all failure modes and main clusters by using the proposed hybrid formal which contains all weights of the LFMEA, DEMATEL, and ANP supermatrix, as follows:
is the final hybrid risk priority value of failure mode .
3. Case Study
A practical case study was conducted in a Yemen oil and gas plant for electrical generator risk assessment to prove the effectiveness of the suggested FMEA framework in a hazardous area. Electrical generators are the main parts of a power generation unit and provide power to plant facilities like pumps, compressors, and any movement machines. However, the reliability of an electrical generator is important for plant availability and operation demand. The Yemen oil and gas plant has a power generation unit consisting of four electrical gas turbines and three emergency diesel generators. All data for maintenance, such as trips, failure, shutdowns, and condition monitoring system of generators, are stored in the Computerized Maintenance Management System (CMMS). Moreover, data was collected from the CMMS database, vendor documents, a literature review, and the opinion of plant experts.
Implementation of the Proposed Framework
Failure modes and breakdown causes were collected from the CMMS database in a Yemen oil and gas plant. Five experts were selected from five departments of the plant, which are safety, electrical, instrumentation and control, mechanical, and operation. Experts identified and organized the electrical generator risk into five main clusters of failure modes (main risk factor dimensions of FMs) and 20 FMs were analyzed , as shown in Table 1.

Table 1.
Main risk clusters and failure modes.
4. Result and Discussion
4.1. Linguistic FMEA Weights
In this step, an improved linguistic FMEA risk evaluation method with fuzzy priority was conducted to produce the FMs risk assessment by the FMEA evaluation experts. Five experts used ANP to determine the weights for the O, S, and D risk factors. These weight ties are in agreement with previous studies [49,56], wherein the severity weight (0.441) has a larger weight among the risk factors with a lower weight (0.237) for detection. For selecting the language scale, it is assumed that z = 5, and the language scale number is then 2z − 1 = 9. These linguistic term sets are illustrated as a linguistic scale set with nine values from to , as shown in Table 2.
Table 2.
Linguistic assessment values for the cluster of failure modes.
Every expert provided evaluation weights for every cluster of failure mode as shown in Table 2.
According to Equation (1), the linguistic risk priority value was calculated from evaluation weights for every cluster of FM and expert member .
Table 3 shows the linguistic risk priority number for every cluster and expert, with its ranking based on the principle that a higher linguistic priority number indicates a higher risk factor.
Table 3.
The cluster linguistic risk priority number and ranking.
Table 3 illustrates that the ranking of the five main clusters of FMs given by five experts were not identical; except for a stable rank for ME failure mode, the remaining FMs displayed a relative variance in priorities.
However, expert weights were calculated to give a final decision in this step, and Equations (2) and (3) were used to calculate a matrix F:
From the above F matrix, group failure priority was determined from row summation of the F matrix as {2.2, 0.4, 2.6, 4, 0.8}, . Equations (4) and (5) were used to determine the consistency index = {0.933, 0.978, 0.978, 0.978, 0.978}, and expert weights = (0.192, 0.202, 0.202, 0.202, 0.202).
Individual priority indicated that expert has a lower weight (0.192) among the expert group due to the fact that the expert’s evaluation departs from the majority of experts. As a result, the risk of bias in the FMEA assessment is reduced.
The linguistic priority risk number is determined for the main cluster of FMs using Equations (6) and (7) {0.558,0.448,0.674,1.114,0.446} with prioritization {ME>EL>OP>IN>OT}. Moreover, this result was compared with other FMEA approaches, the comparison will be shown in Table 14 at the final step.
Similarly, the same steps of calculation were conducted for failure modes within the cluster. Finally, Table 4 presents the linguistic risk value for all failure modes and their ranking within the cluster.
Table 4.
Risk priority number for FMs.
Table 4 shows that the most critical FMs are OT4, ME3, OT2, and ME3, which are related to the gas hazard and failure of mechanical parts. The ranking of electrical and operation FMs is not clear due to hidden interrelationship effects among FMs, which will be determined in the next steps.
4.2. Interrelationships among Clusters and FMs
In this step, the DEMATEL technique is used to evaluate interdependent and feedback relation between five main FM clusters and between failure modes within their cluster. Experts are questioned to obtain the influence values as the pairwise comparison between each pair of clusters and failure modes. The average matrix D was calculated based on pairwise comparisons according to five-levelled scales (0 = no effect, 1 = low effect, 2 = media effect, 3 = high effect, 4 = very high effect). Then, the total influence matrix T was derived from Equations (8)–(10). In sum, the total relation matrix for the main clusters is shown in Table 5. The network relationship map (NRM) was created by Equation (11) and drew the cause and effect graph after calculating a threshold value (α = 0.339) to remove the minor effects by Equation (12), as shown in Figure 2.
Table 5.
The total relation matrix for the main clusters.
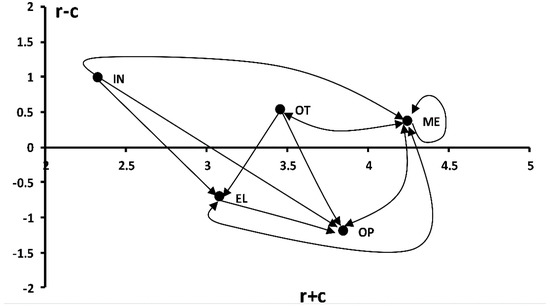
Figure 2.
The cause and effect relationship map for the main clusters.
Similarly, the same steps of calculation were followed for failure modes within every cluster, as shown in Table 6, Table 7, Table 8, Table 9 and Table 10 and Figure 3, Figure 4, Figure 5, Figure 6 and Figure 7.
Table 6.
The total relation matrix for operation FMs.
Table 7.
The total relation matrix for Instrumentation and Control system FMs.
Table 8.
The total relation matrix for electrical FMs.
Table 9.
The total relation matrix for mechanical FMs.
Table 10.
The total relation matrix for other external FMs.
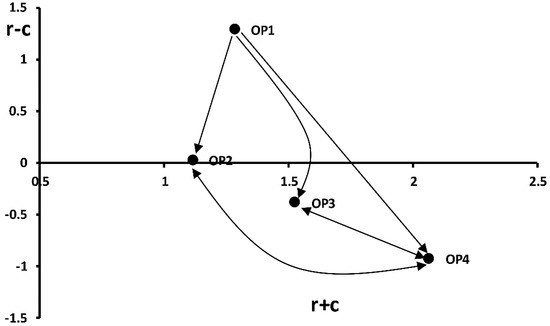
Figure 3.
The cause and effect relationship map for operation FMs.
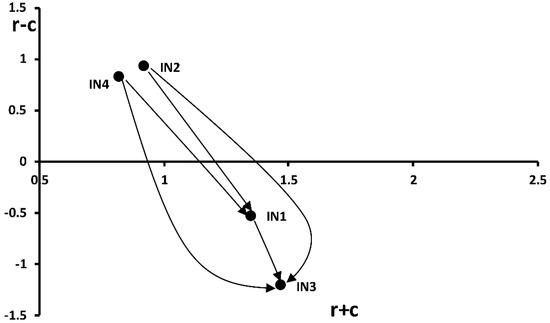
Figure 4.
The cause and effect relationship map for instrumentation FMs.
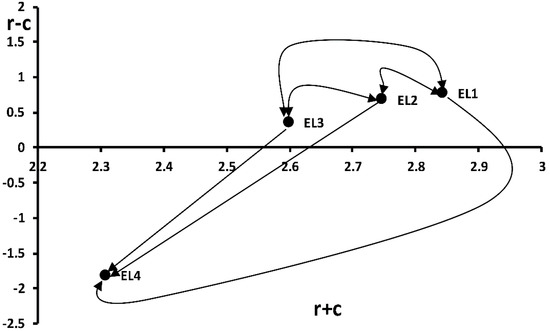
Figure 5.
The cause and effect relationship map for electrical FMs.
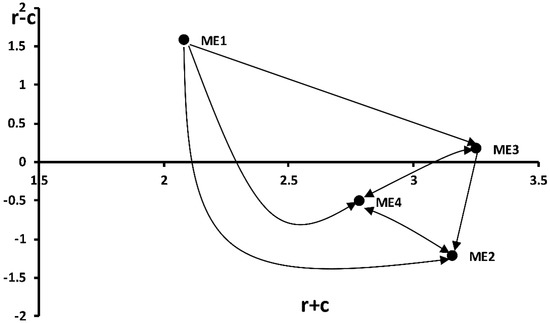
Figure 6.
The cause and effect relationship map for mechanical FMs.
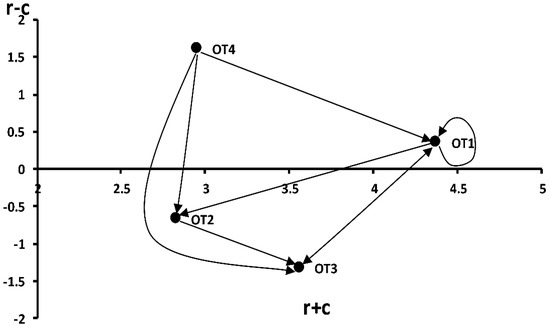
Figure 7.
The cause and effect relationship map for other external FMs.
As shown in Table 5, instrumentation and control system (IN), mechanical (ME), and other external risks (OT) had a positive value , and were thus the main clusters affecting other clusters. In Figure 2, operation (OP) and electrical (EL) are located in the bottom, meaning they have a little effect and are simply affected by other risk factors. Mechanical failure mode (ME) and operation failure mode (OP) have the top two significant weights within the main clusters, where OP is an effect and ME is a cause group with the inner dependency value of 0.360. Moreover, cluster (IN) is not affected by others, as shown in Figure 2.
The results surpassed those of previous studies, which only gave weights for failure modes [43,49,56]. These results provide a clear image of the interdependent and feedback relation between five main clusters and between failure modes within every cluster, presenting necessary information for risk prevention and maintenance plan optimization compared with the results of previous studies.
Based on Table 6, wrong shutdown (OP4) has the largest weight value (2.069) among operation FMs and OP4 is effected by other OP failure modes, whereas overload/unbalanced voltage (OP2) has the smallest important weight value (1.115). The prioritization of the important operation failure modes (OP) is OP4 > OP3 > OP4 > OP2.
Wrong operator action (OP1) is a cause group and not affected by others, while wrong shutdown (OP4) is an effect FM, as shown in Figure 3. These results demonstrate that experts have to focus more attention on wrong shutdown (OP4), wrong operator action (OP1), and cause and effect FM status.
For the instrumentation FMs, failure of the control system (IN3) and instrumentation failure (IN1) were the two most important FMs within the IN cluster based on higher weight values of 1.472 and 1.350, respectively, but both were in the effect group based on negative values (r − c) of −1.214 and −0.530, respectively. According to Table 7, the IN prioritization of the FMs was IN3 > IN1 > IN2 > IN4. It can be observed that IN2 and IN4 are not affected by others and both were in the cause group, as shown in Figure 4.
According to Table 8, rotor faults (EL1), stator faults (EL2), and winding and insulation failure (EL3) have the largest weight values (2.843, 2.746, and 2.599, respectively), but both were in the cause group, whereas output power failure (EL4) is the effect group with the smallest important weight value (2.30), and the prioritization of the important electrical failure modes (EL) is EL1 > EL2 > EL3 > EL4. These results demonstrate that operation experts have to place more attention on output power failure (EL4) to reduce power outage, as shown Figure 5, and output power failure (EL4) was affected by other electrical FMs.
Based on Table 9, shaft failure (ME3) and bearing failure (ME2) have the highest weight values (3.256 and 3.159, respectively) within the mechanical cluster (ME), but (ME3) is a cause group while (ME2) is an effect group, based on the latter’s negative value (−1.221). According to Table 9 and Figure 6, the ME prioritization of the FMs was ME3 > ME2 > ME4 > ME1. Cooling system failure (ME1) is the most critical FM because it has a direct impact on the other three mechanical FMs.
According to Table 10, the material degradation (OT1) had the highest weight value of 4.374, followed by lubricant contamination (OT3) with a value of 3.559, but (OT1) was in the cause group and (OT3) was in the effect group.
The other FMs were prioritized as OT1 > OT3 > OT4 > OT2, respectively. From Figure 7, OT1 has a self-effect value of 0.485. The failure in the purging system (OT2) had the smallest FM weight (2.826), but it is one of the most critical FMs due to its influence on the operation and electrical FMs, as shown in Figure 7.
In addition, it can be found that the DEMATEL gives more information about FM weights and their relationship. Therefore, the DEMATEL method results in a higher discrimination of clusters and failure modes than the traditional FMEA method. Figure 8 portrays the DEMATEL weights of clusters and FMs.
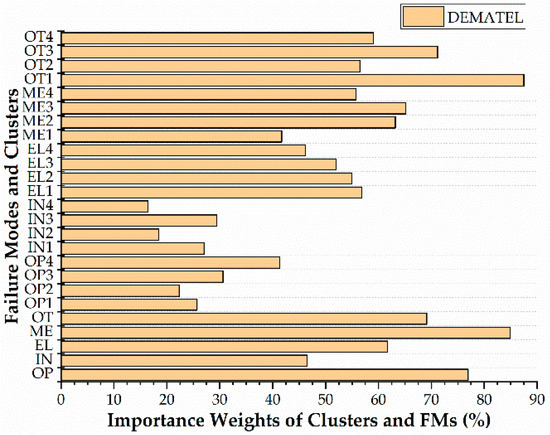
Figure 8.
DEMATEL weights for clusters and FMs.
4.3. The Interdependency and Impact Feedback
The ANP was applied in this step to evaluate the interdependency among clusters and impact feedback of FMs on clusters, where the pairwise comparisons were done according to a nine-leveled scale [55] and 26 pairwise comparison matrices were organized to complete this evaluation. Besides, the relative weights of FMs can be determined based on the eigenvalue method.
For the FM feedback effects, 20 tables were structured to form the matrix columns , five tables were organized for every FM cluster to form the matrix columns , and one table was used for the main clusters with respect to the goal to form the matrix column . These weights of the pairwise comparison matrix A were put in supermatrix columns by Equations (13) and (15), as will be shown in Table 11, with an inconsistency ratio (CR) of less than 0.1 by using Equation (14). Then, the limited supermatrix was calculated by using Equation (16) to obtain the stabilized weights, where the 13th power was used to weight the supermatrix. Matlab 2017b software was efficiently used for these calculations. Furthermore, visual c++ 2017 software can be used to calculate the numerical results.
Table 11.
Supermatrix of Clusters and FMs.
Final ANP weights of each cluster and FMs will be shown in Table 12. The results show that electrical and operation affect other clusters with regard to the interdependency among clusters and the effects of electrical and operation. As shown in Figure 9, the largest dependency among FMs appeared for rotor failure EL1 and operator error OP1, meaning that failure prevention of the rotor and operator can enhance electrical and operation in the context of setting up an electrical generator. Finally, the data from the ANP were analyzed and also presented in Table 13.
Table 12.
Limited Supermatrix of Clusters and FMs.
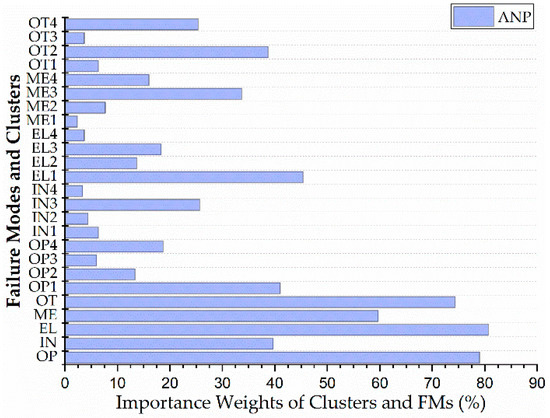
Figure 9.
ANP weights for clusters and FMs.
Table 13.
The final hybrid risk priority value of clusters and FMs.
These findings of the ANP step support the view that the failure modes influenced the main cluster weights. However, when comparing ANP results to those of previous studies [20,28], the feedback effect of FMs on the main cluster must be pointed out and considered.
4.4. Final Prioritization with Comparison
The final hybrid risk priority value was calculated using Equation (17) of each cluster and failure mode . In addition, the proposed FMEA framework weights for linguistic RPN, DEMATEL, and ANP are presented with a final rank in Table 13.
Table 13 shows that ME (mechanical) has the highest risk priority among clusters and FMs, followed by OT4 (gas leakage) due to gas effects in the hazardous area, which validate the proposed approach. IN 4 (failure of data communication) has the lowest risk priority due to the ability of the electrical generator to be locally controlled with no effect on other FMs.
The ranking of the main FM clusters is ME ≻ OP ≻ EL ≻ OT ≻ IN, while the ranking of the first five sub-FMs is OT4 ≻ ME3 ≻ OT2 ≻ EL1 ≻ ME4. Hence, the ranks of other FMs change distinctly in all steps. This changing reveals that ME shows the highest risk among clusters and FMs, even though risk FMs are given different importance weights. Furthermore, the OT4 and OT2 are related to gas leakage, while ME3 and EL1 are related to the rotary mechanical part of the shaft and rotor that should be considered with a high priority of correction for the current maintenance plan. The critical risks for clusters are OP1 (wrong operator action), IN3 (failure of the control system), EL1 (rotor failure), ME3 (shaft failure), and OT4 (gas Leakage). Moreover, given that the ranking of FMs fluctuates with the varying of risk weights, the final weights of FMs given by framework are reasonable.
A comparative study is conducted with other FMEA framework approaches based on the electrical generator case study. The new hybrid framework based on linguistic FMEA, DEMATEL, and ANP approaches is applied to alleviate the drawbacks of the traditional FMEA method. Hence, the traditional FMEA, the linguistic FMEA framework [49], and the Fuzzy FMEA framework [28] are selected for comparison to investigate the benefits of the proposed risk framework. Table 14 reveals the ranking results of the five FMs produced from the above four FMEA framework approaches.
Table 14.
Final risk priority number with FMEA method ranking comparison.
Figure 10 shows that some important findings can be clearly deduced. First, the ranking orders of the proposed framework (ME, EL, OP, IN, and OT) are in agreement with the ranking order of the Fuzzy FMEA framework approach [28]. This demonstrates the validity of our proposed risk priority framework. Additionally, a ranking of the traditional FMEA and the linguistic framework [49] is almost the same, except rank order has been exchanged between OP, EL, and OT, IN. The reason for the differences is due to the advantages of using DEMATEL and ANP approaches, which had a better impact on the final risk. This interrelationship and impact feedback result in OT being before IN in the order and OP being before EL. Therefore, the proposed ranking framework is more precise than the traditional FMEA and the linguistic FMEA framework [49]. By comparison, the proposed FMEA framework can reveal weights of the expert team and FMs interrelationship more precisely.
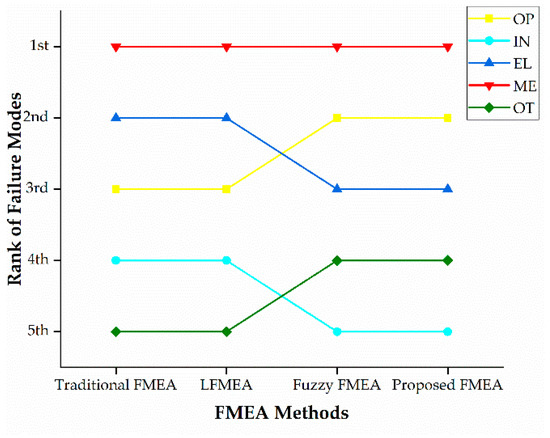
Figure 10.
Comparison of FMEA methods for the considered rank of FMs.
This study shows that the proposed framework is the most suitable for ranking FMs in the hazardous area due to a systematic computational process. This will efficiently help industrial experts in decision making and in overcoming the complexity and time-consuming nature of extended FMEA methods, such as HOR with the VIKOR FMEA framework [17], and the TODIM FMEA framework [56]. Moreover, the results of the proposed framework are useful for the maintenance policy maker to select a suitable maintenance policy for equipment or machines to prevent potential failures and reduce their consequences. Industrial decision makers could be improved structure analysts for risk assessment and task planning for the effective management system. However, the study gave a precise priority with a clear relationship in a simple and straightforward manner, which makes risk analysis more realistic for the decision or policy maker. The decision maker can have particular benefits for developing analysis and judgments in complex or vague conditions, like hazardous environments. The proposed methodology can be applied to other hazardous management applications, such as aerospace healthcare, a nuclear plant, or any chemical industries where there is a risk of flammable gases or liquids.
As a result, for the case study of the electrical generator, the finding of FMs ranking and interrelationship has been offered to a maintenance team of the oil and gas plant to adjust the maintenance plan in order to prevent system failures.
5. Conclusions
A new hybrid risk priority framework for FMEA in a hazardous environment which integrates linguistic FMEA, ANP, and DEMATEL is presented. The linguistic FMEA method was used to define the weight of risk factors and expert members, and therefore decreased the influence of the injustice of experts on assessment results. Moreover, the linguistic calculation was applied to overcome the drawbacks of the fuzzy method, like data losses as a result of the de-fuzzy process. The framework applies the DEMATEL to understand the interrelationships among the clusters and the FMs and then uses the hybrid formal to calculate the importance weights of the FMs. The new formula is implemented to give the final weight of FMs. A Yemen oil and gas plant was chosen as a case study to validate the framework and its implementation in real practice. Integrating the three methodologies reveals that the major shortcoming of the traditional FMEA could be overcome. The application of this framework could provide a better understanding of decisions in an oil and gas plant. Furthermore, the comparison of this model with other models clearly demonstrates the former’s better efficiency and applicability in electric generators of oil and gas in hazardous environments. This is because the framework incorporates strategies to offer the linking information about failure interaction effects and priority weights. The work also studied the combined effects of failure modes rather than the approach of traditional FMEA, which only analyzes failure modes individually and ignores the important effects of combined system failures.
Based on the case study, it can be deduced that among the five clusters, the most important ones are the mechanical ME and operation OP. Also, among the twenty FMs, the gas leakage OT4 is the most important FM, followed by the shaft failure ME 3 and purging system failure OT2. Both OT4 and OT1 are related to the external hazard of gas leakage. In consequence, the operation and electrical FMs are critical FMs and affected by other clusters. In addition, industries dealing with electrical power generation are prone to many hazards. This could tap into this framework to evaluate and classify risk in order to prevent system failure and help practitioners in relevant decision-making, especially hazardous areas like a nuclear power plant.
This study is limited to risk identification and ranking. Further research should incorporate relative optimization tools, such as GA, PSO, and deep learning, which could be included in framework optimization so that experts can better understand and distinguish failure effects at the design or running stage.
Author Contributions
The research topic was proposed by M.A.; M.A. and T.S.H. structured and wrote the first draft of the paper; M.A. conducted the research and drafted the methodology; A.A., E.E.S., and C.K.A. took part in the validation and analysis of results; M.A. made the conclusions and wrote most parts of the paper with T.S.H.; C.K.A. validated the idea and reviewed the final paper with M.A.; all other co-authors contributed to the writing of the manuscript and the supervision of this work.
Funding
This research received no external funding.
Acknowledgments
The open access preparations of this article were funded by the Research Centre of University Putra Malaysia. We thank the maintenance and production team of the oil and gas plant Yemen, for the great support and joint work team.
Conflicts of Interest
The authors declare no conflict of interest.
References
- Bowles, J.B.; Peláez, C.E. Fuzzy logic prioritization of failures in a system failure mode, effects and criticality analysis. Reliab. Eng. Syst. Saf. 1995, 50, 203–213. [Google Scholar] [CrossRef]
- Certa, A.; Hopps, F.; Inghilleri, R.; La Fata, C.M. A Dempster-Shafer Theory-based approach to the Failure Mode, Effects and Criticality Analysis (FMECA) under epistemic uncertainty: Application to the propulsion system of a fishing vessel. Reliab. Eng. Syst. Saf. 2017, 159, 69–79. [Google Scholar] [CrossRef]
- Rausand, M. Reliability of Safety-Critical Systems: Theory and Applications; John Wiley & Sons: Hoboken, NJ, USA, 2014. [Google Scholar]
- Tay, K.M.; Lim, C.P. Enhancing the failure mode and effect analysis methodology with fuzzy inference techniques. J. Intell. Fuzzy Syst. 2010, 21, 135–146. [Google Scholar]
- McDermott, R.; Mikulak, R.J.; Beauregard, M. The Basics of FMEA; Steiner Books Productivity Press: New York, NY, USA, 1996. [Google Scholar]
- Doostparast, M.; Kolahan, F.; Doostparast, M. A reliability-based approach to optimize preventive maintenance scheduling for coherent systems. Reliab. Eng. Syst. Saf. 2014, 126, 98–106. [Google Scholar] [CrossRef]
- Arunraj, N.S.; Maiti, J. Risk-based maintenance—Techniques and applications. J. Hazard. Mater. 2007, 142, 653–661. [Google Scholar] [CrossRef]
- Moore, W.J.; Starr, A.G. An intelligent maintenance system for continuous cost-based prioritisation of maintenance activities. Comput. Ind. 2006, 57, 595–606. [Google Scholar] [CrossRef]
- Shafiee, M.; Dinmohammadi, F.; Shafiee, M.; Dinmohammadi, F. An FMEA-Based Risk Assessment Approach for Wind Turbine Systems: A Comparative Study of Onshore and Offshore. Energies 2014, 7, 619–642. [Google Scholar] [CrossRef]
- Tazi, N.; Châtelet, E.; Bouzidi, Y. Using a Hybrid Cost-FMEA Analysis for Wind Turbine Reliability Analysis. Energies 2017, 10, 276. [Google Scholar] [CrossRef]
- Chin, K.-S.; Wang, Y.-M.; Ka Kwai Poon, G.; Yang, J.-B. Failure mode and effects analysis using a group-based evidential reasoning approach. Comput. Oper. Res. 2009, 36, 1768–1779. [Google Scholar] [CrossRef]
- Liu, H.-C.; Liu, L.; Bian, Q.-H.; Lin, Q.-L.; Dong, N.; Xu, P.-C. Failure mode and effects analysis using fuzzy evidential reasoning approach and grey theory. Expert Syst. Appl. 2011, 38, 4403–4415. [Google Scholar] [CrossRef]
- Faiella, G.; Parand, A.; Franklin, B.D.; Chana, P.; Cesarelli, M.; Stanton, N.A.; Sevdalis, N. Expanding healthcare failure mode and effect analysis: A composite proactive risk analysis approach. Reliab. Eng. Syst. Saf. 2018, 169, 117–126. [Google Scholar] [CrossRef]
- Yssaad, B.; Abene, A. Rational Reliability Centered Maintenance Optimization for power distribution systems. Int. J. Electr. Power Energy Syst. 2015, 73, 350–360. [Google Scholar] [CrossRef]
- Matteson, S. Methods for multi-criteria sustainability and reliability assessments of power systems. Energy 2014, 71, 130–136. [Google Scholar] [CrossRef]
- Scipioni, A.; Saccarola, G.; Centazzo, A.; Arena, F. FMEA methodology design, implementation and integration with HACCP system in a food company. Food Control 2002, 13, 495–501. [Google Scholar] [CrossRef]
- Wang, Z.; Gao, J.-M.; Wang, R.-X.; Chen, K.; Gao, Z.-Y.; Zheng, W. Failure Mode and Effects Analysis by Using the House of Reliability-Based Rough VIKOR Approach. IEEE Trans. Reliab. 2018, 67, 230–248. [Google Scholar] [CrossRef]
- Barends, D.M.; Oldenhof, M.T.; Vredenbregt, M.J.; Nauta, M.J. Risk analysis of analytical validations by probabilistic modification of FMEA. J. Pharm. Biomed. Anal. 2012, 64–65, 82–86. [Google Scholar] [CrossRef] [PubMed]
- Carmignani, G. An integrated structural framework to cost-based FMECA: The priority-cost FMECA. Reliab. Eng. Syst. Saf. 2009, 94, 861–871. [Google Scholar] [CrossRef]
- Kutlu, A.C.; Ekmekçioğlu, M. Fuzzy failure modes and effects analysis by using fuzzy TOPSIS-based fuzzy AHP. Expert Syst. Appl. 2012, 39, 61–67. [Google Scholar] [CrossRef]
- Liu, H.-C.; Liu, L.; Liu, N. Risk evaluation approaches in failure mode and effects analysis: A literature review. Expert Syst. Appl. 2013, 40, 828–838. [Google Scholar] [CrossRef]
- Liu, H.-C.; Liu, L.; Liu, N.; Mao, L.-X. Risk evaluation in failure mode and effects analysis with extended VIKOR method under fuzzy environment. Expert Syst. Appl. 2012, 39, 12926–12934. [Google Scholar] [CrossRef]
- Nepal, B.P.; Yadav, O.P.; Monplaisir, L.; Murat, A. A framework for capturing and analyzing the failures due to system/component interactions. Q. Reliab. Eng. Int. 2008, 24, 265–289. [Google Scholar] [CrossRef]
- Xiao, N.; Huang, H.-Z.; Li, Y.; He, L.; Jin, T. Multiple failure modes analysis and weighted risk priority number evaluation in FMEA. Eng. Failure Anal. 2011, 18, 1162–1170. [Google Scholar] [CrossRef]
- Fattahi, R.; Khalilzadeh, M. Risk evaluation using a novel hybrid method based on FMEA, extended MULTIMOORA, and AHP methods under fuzzy environment. Saf. Sci. 2018, 102, 290–300. [Google Scholar] [CrossRef]
- Vahdani, B.; Salimi, M.; Charkhchian, M. A new FMEA method by integrating fuzzy belief structure and TOPSIS to improve risk evaluation process. Int. J. Adv. Manuf. Technol. 2015, 77, 357–368. [Google Scholar] [CrossRef]
- Mohsen, O.; Fereshteh, N. An extended VIKOR method based on entropy measure for the failure modes risk assessment—A case study of the geothermal power plant (GPP). Saf. Sci. 2017, 92, 160–172. [Google Scholar] [CrossRef]
- Nazeri, A.; Naderikia, R. A new fuzzy approach to identify the critical risk factors in maintenance management. Int. J. Adv. Manuf. Technol. 2017, 92, 3749–3783. [Google Scholar] [CrossRef]
- Shieh, J.-I.; Wu, H.-H.; Huang, K.-K. A DEMATEL method in identifying key success factors of hospital service quality. Knowl. Based Syst. 2010, 23, 277–282. [Google Scholar] [CrossRef]
- Saaty, T.L. Decision Making with Dependence and Feedback: The Analytic Network Process; RWS Publications: Pittsburgh, PA, USA, 1996; Volume 4922. [Google Scholar]
- Boran, S.; Goztepe, K. Development of a fuzzy decision support system for commodity acquisition using fuzzy analytic network process. Expert Syst. Appl. 2010, 37, 1939–1945. [Google Scholar] [CrossRef]
- Liang, C.; Li, Q. Enterprise information system project selection with regard to BOCR. Int. J. Proj. Manag. 2008, 26, 810–820. [Google Scholar] [CrossRef]
- Kumar, G.; Maiti, J. Modeling risk based maintenance using fuzzy analytic network process. Expert Syst. Appl. 2012, 39, 9946–9954. [Google Scholar] [CrossRef]
- Ergu, D.; Kou, G.; Shi, Y.; Shi, Y. Analytic network process in risk assessment and decision analysis. Comput. Oper. Res. 2014, 42, 58–74. [Google Scholar] [CrossRef]
- Fargnoli, M.; Haber, N. A practical ANP-QFD methodology for dealing with requirements’ inner dependency in PSS development. Comput. Ind. Eng. 2018. [Google Scholar] [CrossRef]
- Fargnoli, M.; Lombardi, M.; Haber, N.; Guadagno, F. Hazard function deployment: A QFD-based tool for the assessment of working tasks—A practical study in the construction industry. Int. J. Occup. Saf. Ergon. 2018, 1–22. [Google Scholar] [CrossRef] [PubMed]
- Fazli, S.; Kiani Mavi, R.; Vosooghidizaji, M. Crude oil supply chain risk management with DEMATEL–ANP. Oper. Res. 2015, 15, 453–480. [Google Scholar] [CrossRef]
- Dedasht, G.; Mohamad Zin, R.; Ferwati, M.S.; Mohammed Abdullahi, M.A.; Keyvanfar, A.; McCaffer, R. DEMATEL-ANP risk assessment in oil and gas construction projects. Sustainability 2017, 9, 1420. [Google Scholar] [CrossRef]
- Chen, W.-C.; Chang, H.-P.; Lin, K.-M.; Kan, N.-H.; Chen, W.-C.; Chang, H.-P.; Lin, K.-M.; Kan, N.-H. An Efficient Model for NPD Performance Evaluation Using DEMATEL and Fuzzy ANP—Applied to the TFT-LCD Touch Panel Industry in Taiwan. Energies 2015, 8, 11973–12003. [Google Scholar] [CrossRef]
- Chou, Y.-C.; Yang, C.-H.; Lu, C.-H.; Dang, V.; Yang, P.-A. Building Criteria for Evaluating Green Project Management: An Integrated Approach of DEMATEL and ANP. Sustainability 2017, 9, 740. [Google Scholar] [CrossRef]
- Wang, Y.-M.; Chin, K.-S.; Poon, G.K.K.; Yang, J.-B. Risk evaluation in failure mode and effects analysis using fuzzy weighted geometric mean. Expert Syst. Appl. 2009, 36, 1195–1207. [Google Scholar] [CrossRef]
- Li, Z.S.; Wu, G. AText Mining based Reliability Analysis Method in Design Failure Mode and Effect Analysis. In Proceedings of the 2018 IEEE International Conference on Prognostics and Health Management (ICPHM), Seattle, WA, USA, 11–13 June 2018; pp. 1–8. [Google Scholar]
- Safari, H.; Faraji, Z.; Majidian, S. Identifying and evaluating enterprise architecture risks using FMEA and fuzzy VIKOR. J. Intell. Manuf. 2016, 27, 475–486. [Google Scholar] [CrossRef]
- Tian, Z.-P.; Wang, J.-Q.; Zhang, H.-Y. An integrated approach for failure mode and effects analysis based on fuzzy best-worst, relative entropy, and VIKOR methods. Appl. Soft Comput. 2018, 72, 636–646. [Google Scholar] [CrossRef]
- Jiang, W.; Xie, C.; Zhuang, M.; Tang, Y. Failure mode and effects analysis based on a novel fuzzy evidential method. Appl. Soft Comput. 2017, 57, 672–683. [Google Scholar] [CrossRef]
- Kim, K.O.; Zuo, M.J. General model for the risk priority number in failure mode and effects analysis. Reliab. Eng. Syst. Saf. 2018, 169, 321–329. [Google Scholar] [CrossRef]
- Zadeh, L.A. The concept of a linguistic variable and its application to approximate reasoning—I. Inf. Sci. 1975, 8, 199–249. [Google Scholar] [CrossRef]
- Xu, Z. A method for multiple attribute decision making with incomplete weight information in linguistic setting. Knowl. Based Syst. 2007, 20, 719–725. [Google Scholar] [CrossRef]
- Zhou, Y.; Xia, J.; Zhong, Y.; Pang, J. An improved FMEA method based on the linguistic weighted geometric operator and fuzzy priority. Q. Eng. 2016, 28, 491–498. [Google Scholar] [CrossRef]
- Huang, C.-Y.; Shyu, J.Z.; Tzeng, G.-H. Reconfiguring the innovation policy portfolios for Taiwan’s SIP Mall industry. Technovation 2007, 27, 744–765. [Google Scholar] [CrossRef]
- Li, C.-W.; Tzeng, G.-H. Identification of interrelationship of key customers’ needs based on structural model for services/capabilities provided by a Semiconductor-Intellectual-Property Mall. Appl. Math. Comput. 2009, 215, 2001–2010. [Google Scholar] [CrossRef]
- Liou, J.J.H.; Tzeng, G.-H.; Chang, H.-C. Airline safety measurement using a hybrid model. J. Air Transport Manag. 2007, 13, 243–249. [Google Scholar] [CrossRef]
- Saaty, T.L. Fundamentals of the analytic network process—Dependence and feedback in decision-making with a single network. J. Syst. Sci. Syst. Eng. 2004, 13, 129–157. [Google Scholar] [CrossRef]
- Saaty, T.L. Decision making with the analytic hierarchy process. Int. J. Serv. Sci. 2008, 1, 83–97. [Google Scholar] [CrossRef]
- Saaty, T.L. How to make a decision: The analytic hierarchy process. Eur. J. Oper. Res. 1990, 48, 9–26. [Google Scholar] [CrossRef]
- Huang, J.; Li, Z.; Liu, H.-C. New approach for failure mode and effect analysis using linguistic distribution assessments and TODIM method. Reliab. Eng. Syst. Saf. 2017, 167, 302–309. [Google Scholar] [CrossRef]
© 2019 by the authors. Licensee MDPI, Basel, Switzerland. This article is an open access article distributed under the terms and conditions of the Creative Commons Attribution (CC BY) license (http://creativecommons.org/licenses/by/4.0/).