Abstract
Refrigerant charge faults have a great adverse effect on the performance of heat pumps and must therefore be detected and diagnosed early in real time. In this study, the effect of refrigerant charge faults on a water-to-water heat pump is experimentally investigated in cooling mode and heating mode at various outdoor entering water temperature conditions. The study showed that refrigerant undercharge affects the performance of water-to-water heat pump more in heating mode than in cooling mode. Results from the study are used to develop a refrigerant charge fault detection and diagnosis (FDD) algorithm that works using correlations and rule-based refrigerant fault characteristic charts. The FDD algorithm is able to detect refrigerant charge faults in the water-to-water heat pump within an error threshold of ±4.5% and ±1.1% in cooling mode and heating mode respectively.
1. Introduction
Energy conservation and environmental sustainability have become important subjects of discussion as fossil fuels deplete and become increasingly expensive, while greenhouse gas emissions are becoming rampant. Most recent research and technologies have therefore focused on systems that are highly efficient and environmentally friendly, with very little or no greenhouse gas emissions. Heat pumps have been used in most parts of the world to provide cooling and heating due to their energy saving potential, easy installation and low cost [1]. For a heat pump to operate with maximum efficiency, its operating parameters must be optimized. An important optimization parameter in the heat pump is the refrigerant charge, which greatly affects the COP and the energy efficiency of the heat pump. An energy efficient heat pump operates at the optimum refrigerant charge throughout its life cycle.
Refrigerant undercharge or overcharge conditions greatly affect the performance of heat pumps [2]. In real systems, refrigerant undercharge is caused by leakages which cause severe CO2 emissions, while refrigerant overcharge exists due to human errors when charging the heat pump. A refrigerant charge fault exists when a heat pump operates at undercharge or overcharge conditions. Kim and Braun [3] evaluated the impacts of refrigerant charge on the performance of an air conditioner and heat pump using R22. The study observed a reduction of 20% in capacity and 15% in COP at 25% undercharge conditions for both air conditioner and heat pump units. Choi et al. [4] investigated the effect of refrigerant charge on the performance of ground source heat pump and found that at 80% and 120% of the optimum charge, the COP reduced by 19% and 7.5% respectively. Yoo et al. [5] found that the degree of effect of refrigerant leakage on the energy consumption of air conditioners greatly depends on the indoor and outdoor secondary fluid temperature conditions. Refrigerant undercharge or overcharge is therefore a serious issue in the heat pump industry.
In addition to refrigerant charge faults, most heat pumps operate with other faults such as compressor faults, heat exchanger faults and secondary fluid flow rate faults, that result in lower system performance, higher energy consumption and higher operating and maintenance cost [6,7,8]. This has generated the interest in adopting automated fault detection and diagnosis (FDD) mechanisms in heat pumps to help detect these faults in their early stages.
Many researchers have developed FDD algorithms for various air conditioner and heat pump faults. Kim et al. [6] adopted eight fault detection methods to detect compressor fault, secondary fluid flow rate fault, refrigerant fault and liquid line fault in a residential heat pump. Zhao et al. [7] developed a statistical FDD method for chillers using exponentially-weighted moving average control charts and support vector regression. Yoo et al. [5] developed a methodology to detect refrigerant leakage of an air conditioner using the difference in temperature between the inlet air and the midpoint temperature of the evaporator or condenser. Kim and Kim [8] developed rule-based FDD model to detect compressor fault, evaporator fault, refrigerant leak and condenser fault in constant speed and variable speed vapor compression systems. Choi et al. [4] developed an algorithm to determine the refrigerant charge amount of a ground source heat pump using the degree of subcooling. Gasche et al. [9] developed a non-isothermal two-phase algorithm to detect refrigerant leakage in a compressor. Zhao et al. [7] used a Bayesian Belief Network that works using probability and the graph theory to detect compressor faults, refrigerant fault, secondary fluid flow rate faults, and heat exchanger faults in a chiller. Chen and Lan [10] developed an FDD algorithm using the principal component approach which compares the results of predicted parameters with reference values to detect faults. The FDD algorithm was used to predict heat exchanger faults in an air-source heat pump water chiller. Sellami et al. [11] used the bond graph approach to develop FDD method for various faults in the compartment of a refrigerator. Payne et al. [12] applied different fault free FDD correlations developed using laboratory data to packaged air-conditioners and found that it is better to use different order correlations when collecting data for heat pump FDD analysis.
Most of the refrigerant charge FDD models have been developed for heat pumps operating in either cooling mode or heating mode. However, heat pumps operate in both cooling mode and heating mode. Refrigerant FDD models must therefore be developed for both heating and cooling modes since the operating conditions and parameters of the heat pump differ in each mode. Also, most refrigerant charge FDD models have been developed using the degree of subcooling or the secondary fluid temperature difference across the condenser or evaporator. However, the degree of subcooling cannot be measured in real systems and the secondary fluid temperature difference across the condenser and evaporator is affected by other parameters such as the temperature of the heat source or heat sink, which must be taken into consideration in the development of refrigerant charge FDD algorithms. This study develops a refrigerant charge FDD algorithm for a water-to-water heat pump operating in cooling mode and heating mode at varying outdoor entering water temperature conditions. The FDD algorithm is developed using rule-based fault characteristic charts and correlations that predict the refrigerant charge amount of the heat pump unit using a parameter that can be easily measured in real systems.
2. Experimental Setup and Test Procedure
Figure 1 shows a schematic diagram of the water-to-water heat pump unit used in this study. The heat pump unit consisted of a compressor, an indoor heat exchanger (ID HX), electronic expansion valve (EEV) and an outdoor heat exchanger (OD HX). The ID HX acted as an evaporator in cooling mode and as condenser in heating mode while the OD HX acted as a condenser in cooling mode and as evaporator in heating mode. The heat pump was equipped with a four-way valve which switches between the cooling mode and heating mode operations.
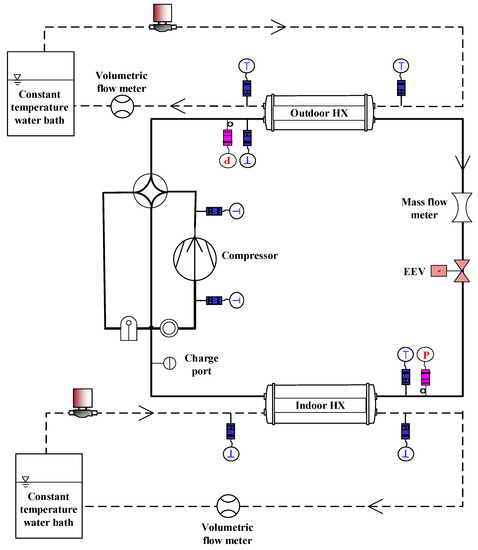
Figure 1.
Schematic of heat pump unit.
R410A was used as a refrigerant in the heat pump unit with closed loop water flow paths used as secondary fluid flow loops for the OD HX and ID HX. Constant temperature water baths with 45% ethylene glycol concentration were used to simulate the secondary fluid flow loops. The ethylene glycol solution was selected as the secondary fluid due to the simplicity in its capacity measurement. The flow rates of the ethylene glycol in the ID HX and OD HX were controlled using an inverter driven pump.
In cooling mode operation, R410A is compressed into high pressure and high temperature vapor refrigerant which flows into the OD HX to be condensed into a subcooled state, before it is expanded by the EEV. The expanded low temperature, low pressure liquid refrigerant from the EEV enters the ID HX where it removes heat from the secondary fluid to become a superheated vapor, before proceeding into the compressor to be compressed for the cycle to continue. In heating mode, the flow direction of the compressed refrigerant is changed into the ID HX by the four-way valve. The compressed refrigerant leaves the ID HX in a subcooled state, gets expanded by the EEV, and then flows into the OD HX where it leaves into the compressor in a superheated state to be compressed for the cycle to continue.
The first test performed in this study was to determine the optimum refrigerant charge of the heat pump unit. The optimum refrigerant charge was determined in cooling mode at standard test condition of 25 °C OD HX entering water temperature () and 12 °C ID HX entering water temperature (), selected according to ISO 13256-2 [13]. To determine the optimum refrigerant charge amount, the heat pump was charged with refrigerant in 100 g increments until the highest COP was achieved. The optimum refrigerant charge was found to be 4700 g, corresponding to the maximum COP of the heat pump unit. The heat pump was evacuated after determining the optimum charge. Effect of the refrigerant charge faults on the performance of the heat pump was then investigated by varying the refrigerant charge amount at 70%, 80%, 90%, 100%, 110% and 120% refrigerant charge ratio (RCR) in cooling mode and heating mode as shown in Table 1. RCR is defined as the percentage ratio of applied refrigerant charge to the optimum refrigerant charge amount.

Table 1.
Test Conditions.
The was varied at each RCR to determine its effect on the performance of the heat pump when it is overcharged and when undercharged. RCR below the optimum charge is referred to as undercharge condition while that above the optimum charge is referred to as overcharge condition. In cooling mode, the was varied at 20 °C, 25 °C, 30 °C and 35 °C, while the was varied at −5 °C, 0 °C, 5 °C and 10 °C in heating mode. Heating mode standard test condition was selected according to ISO 13256-2 [13]. The EEV opening was adjusted during each experiment to maintain a constant superheat of 7 °C.
Various sensors were installed in the experimental setup to measure the performance of the heat pump unit. K type thermocouples with accuracy of ±0.2 °C were installed to measure refrigerant temperature. Pressure transducers with accuracies of ±0.06%, mass flow meter and power meter each with accuracies of ±0.1% of the measured value were installed to measure refrigerant pressure, refrigerant mass flow rate and compressor power consumption respectively. Volumetric flow meters with accuracies of ±0.5% of measured value and RTD sensors with accuracies of ±0.15 °C were installed in the secondary fluid flow paths to measure the volumetric flow rate and temperature of the secondary fluid.
Experimental data were collected using Yokogawa MX100 data logger and saved on a computer using a data acquisition system at 40 min saving time and 3 s scanning time. Properties of the ethylene glycol solution with the mass flow rate and temperature difference of the secondary fluid across the ID HX were used to calculate the cooling capacity of the heat pump unit due to the ease in measurement and the calculation process as shown in Equation (1). COP of the heat pump unit was calculated using the cooling capacity and compressor power consumption as shown in Equation (2). Uncertainty analysis of the heat pump parameters was done according to ASHRAE Guideline 2 [14] using the Pythagorean summation of discrete uncertainties as shown in Equation (3). Uncertainties of the COP and capacities were 3.0% and 2.8% respectively.
3. Test Results and Discussion
3.1. Cooling Mode
Figure 2 shows the effect of refrigerant charge and outdoor heat exchanger entering water temperature () on the cooling capacity of the water-to-water heat pump. The optimum refrigerant charge is represented as 100% refrigerant charge ratio (RCR). RCR of 90%, 80% and 70% (below the optimum charge) are referred to as refrigerant undercharge while that of 110% and 120% are termed as refrigerant overcharge. The cooling capacity greatly decreased at refrigerant undercharge due to a decrease in the heat transfer rate between the refrigerant and secondary fluid in the indoor heat exchanger (ID HX) at all . This resulted in increased evaporating temperature at undercharge conditions as shown in Figure 3. At the standard condition, the cooling capacity decreased by 7.4%, 19.0% and 25.2% at 90%, 80% and 70% RCR respectively. However, the cooling capacity decreased slightly at overcharge conditions due to a slight increase in the evaporating temperature resulting from a very minimal heat transfer rate between the refrigerant and secondary fluid in the ID HX at all . This trend is similar to those realized in the works of Kim and Braun [3] and Choi and Choi [4]. At the standard EWT conditions and RCR of 110% and 120%, the cooling capacity decreased by 0.5% and 0.9% respectively. Generally, the cooling capacity of heat pumps depends on the temperature difference between the refrigerant and secondary fluid in the ID HX and the refrigerant mass flow rate. However, the refrigerant mass flow rate was almost constant at all refrigerant charge ratios, due to the adjustment of the EEV opening to maintain a constant superheat as shown in Figure 4.
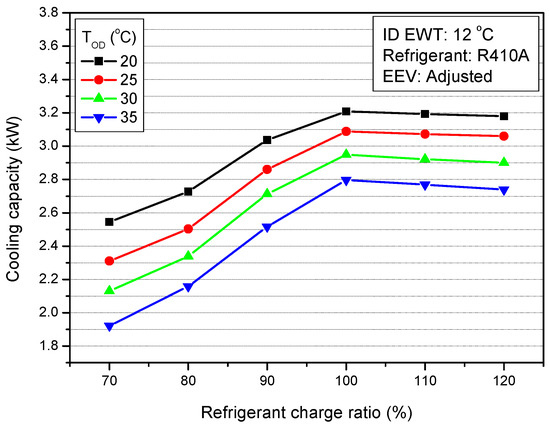
Figure 2.
Cooling capacity with variation of refrigerant charge amount and
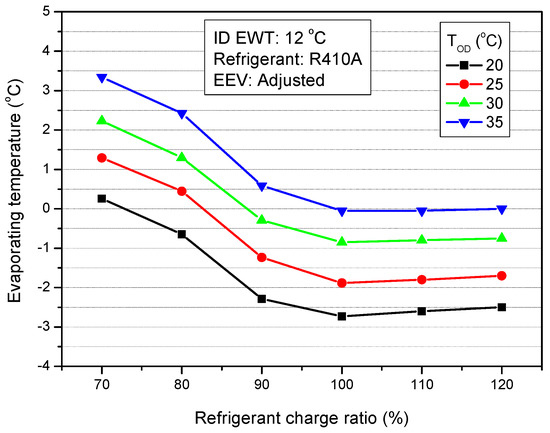
Figure 3.
Evaporating temperature with variation of refrigerant charge amount and
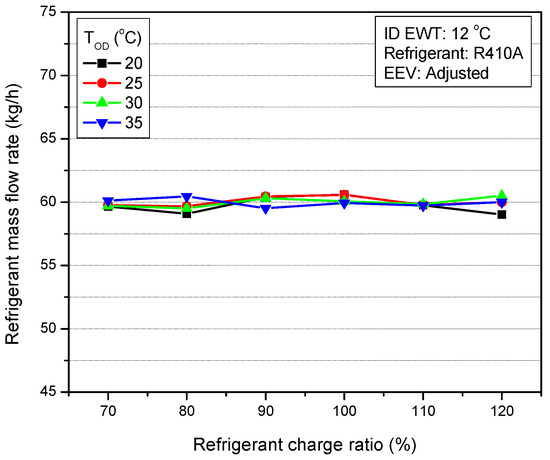
Figure 4.
Refrigerant charge flow rate with variation of refrigerant charge amount and
Figure 5 represents the COP of the heat pump with variation of refrigerant charge ratio and . The optimum refrigerant charge amount (100% RCR) of this study was determined to have the maximum COP. The COP decreased at both undercharge and overcharge conditions with steeper slope at undercharge conditions than at overcharge conditions. This is similar to the COP trend realized in the works of Choi and Choi [4]. COP is defined as the ratio of the cooling capacity to the power consumption of the heat pump. As shown in Figure 6, the power consumption decreased at undercharge conditions, however the slope of decrease was smaller than that of the cooling capacity at undercharge conditions. Nonetheless, the power consumption increased at overcharge conditions to result in a decrease in the COP at overcharge conditions. Power consumption of the heat pump greatly depends on the compressor pressure ratio and refrigerant mass flow rate. The power consumption was mainly affected by the compressor pressure ratio since the refrigerant mass flow rate remained almost constant with the variation in RCR. Figure 7 shows the pressure ratio with variation in RCR and . The pressure ratio decreased at undercharge conditions and increased at overcharge conditions due to a decrease in the condensing pressure at undercharge conditions and an increase in same at overcharge conditions. The evaporating pressure remained almost constant at both undercharge and overcharge conditions due to the adjustment of the EEV to maintain a constant superheat at all test conditions. The rate of decrease in COP at undercharge conditions was higher than that at overcharge conditions at all conditions. At standard of 25 °C, the COP decreased by 4.9%, 14.3% and 18.0% at RCR of 90%, 80% and 70% respectively; while the COP decreased by 2.2% and 5.0% at RCR of 110% and 120% respectively at overcharge conditions.
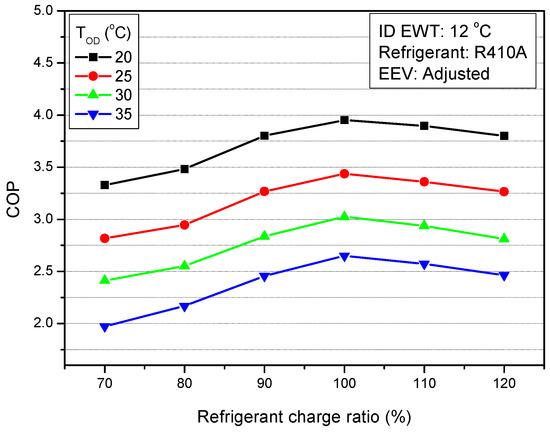
Figure 5.
Variation of COP with and refrigerant charge amount.
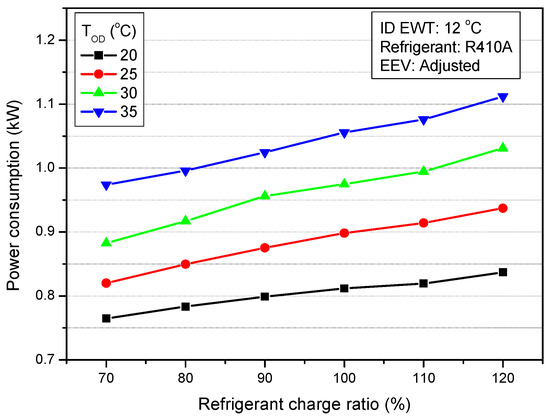
Figure 6.
Power consumption with variation of refrigerant charge amount and
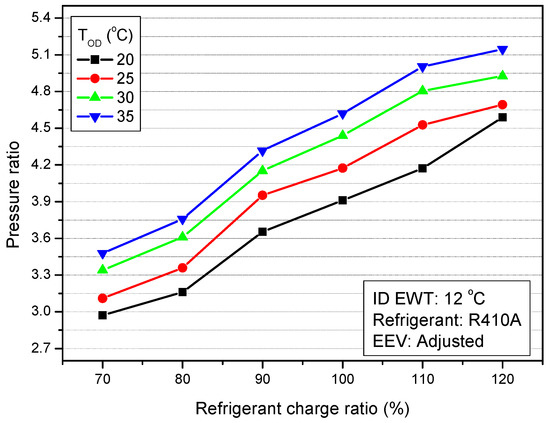
Figure 7.
Pressure ratio with variation of refrigerant charge amount and
The greatly affects the performance of heat pumps but cannot be controlled because it is related to the temperature of the heat source. As shown in Figure 8, the cooling capacity decreased as the increased at all RCR. This is due to decrease in the heat transfer rate between the refrigerant and secondary fluid in the ID HX caused by an increase in the temperature lift of the heat pump. The increase in temperature lift resulted from a significant increase in the condensing temperature and a slight increase in the evaporating temperature at all RCR as shown in Figure 9 and Figure 10 respectively. At the optimum refrigerant charge, the cooling capacity decreased by 3.8%, 8.1% and 12.8% as the increased from 20 °C to 25 °C, 30 °C and 35 °C respectively.
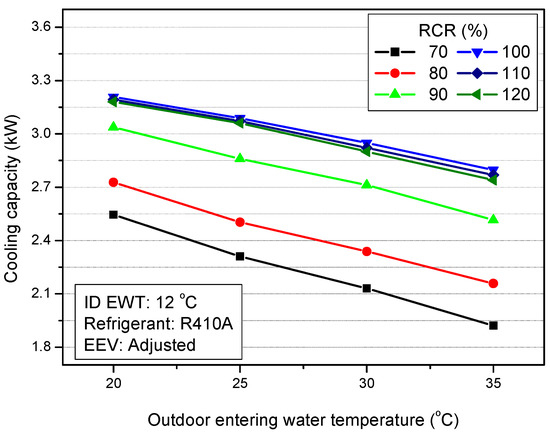
Figure 8.
Variation of cooling capacity with in cooling mode.
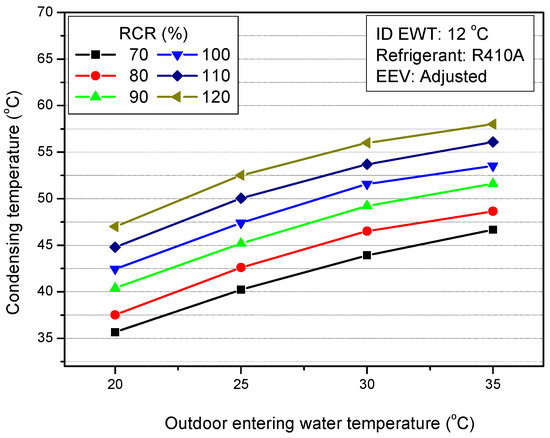
Figure 9.
Variation of condensing temperature with in cooling mode.
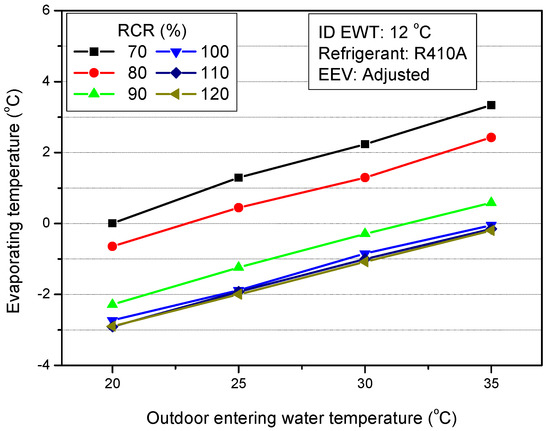
Figure 10.
Variation of evaporating temperature with in cooling mode.
Figure 11 shows the effect of on the COP of the heat pump unit. The COP decreased with an increase in the at all RCR. This is due to a decrease in the cooling capacity and an increase in the power consumption of the heat pump as the increased. Figure 12 shows power consumption of the heat pump with variation in the at all RCR. The increase in resulted in a significant increase in the condensing pressure and a slight increase in the evaporating pressure. This caused an increase in the pressure ratio of the heat pump. However, the refrigerant mass flow rate was almost constant as the increased due to the control of the EEV opening. Therefore, the increase in power consumption of the heat pump was mainly due to increase in the pressure ratio of the heat pump at all RCR. At the optimum refrigerant charge, the COP decreased by 13.0%, 23.5% and 32.9% as the increased from 20 °C to 25 °C, 30 °C and 35 °C respectively.
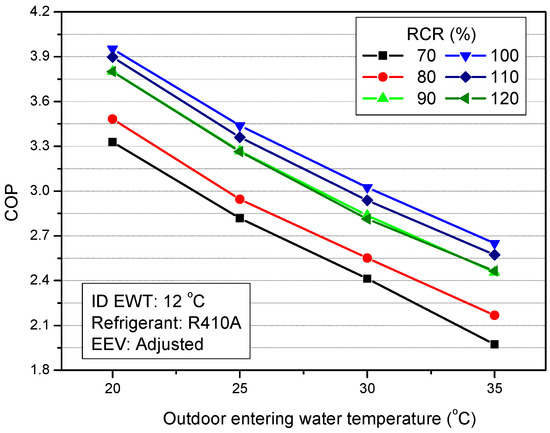
Figure 11.
Variation of COP with in cooling mode.
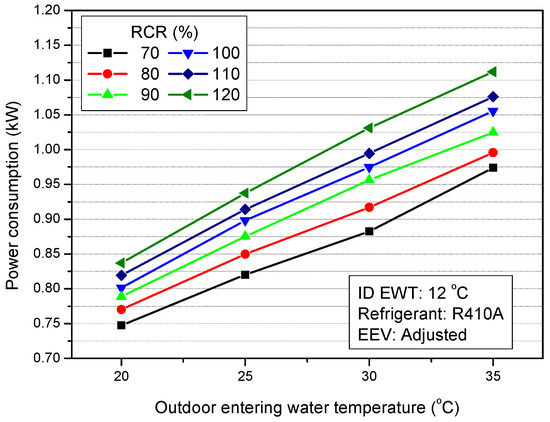
Figure 12.
Variation of power consumption with in cooling mode.
3.2. Heating Mode
Figure 13 shows the effect of refrigerant charge ratio (RCR) on the heating capacity of the heat pump at various outdoor entering water () conditions. The heating capacity sharply decreased at undercharge conditions and decreased slightly at overcharge conditions at all . This is similar to the trends realized in the works of Zhang et al. [2] and Chae and Choi [15]. At undercharge conditions, the temperature difference between the refrigerant and secondary fluid in the OD HX decreased due to decrease in the heat transfer rate between the refrigerant and secondary fluid. This caused an increase in the evaporating temperature at undercharge conditions as shown in Figure 14. Also, refrigerant mass flow rate increased at undercharge conditions due to an increase in the EEV opening to maintain a constant superheat as shown in Figure 15. The EEV opening has a significant effect on the refrigerant mass flow rate of the heat pump [2]. However, the effect of the decrease in heat transfer rate in the OD HX was greater than the increasing effect of the refrigerant mass flow rate. This caused the heating capacity to decrease at undercharge conditions. At overcharge conditions, the refrigerant mass flow rate decreased while the heat transfer rate in OD HX increased. The combined effect caused the heating capacity to decrease. The heating capacity decreased by 11.5%, 31.9% and 61.6% at 90%, 80% and 70% RCR respectively at the standard condition. At overcharge conditions, the heating capacity decreased by 0.4% and 0.8% at RCR of 110% and 120% respectively at the standard condition.
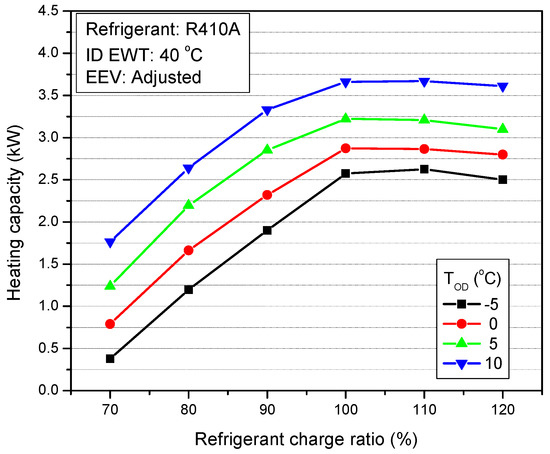
Figure 13.
Variation of heating capacity with refrigerant charge ratio and
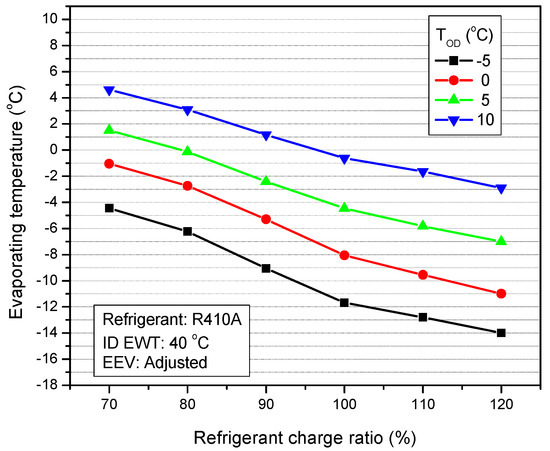
Figure 14.
Variation of evaporating temperature with refrigerant charge ratio and
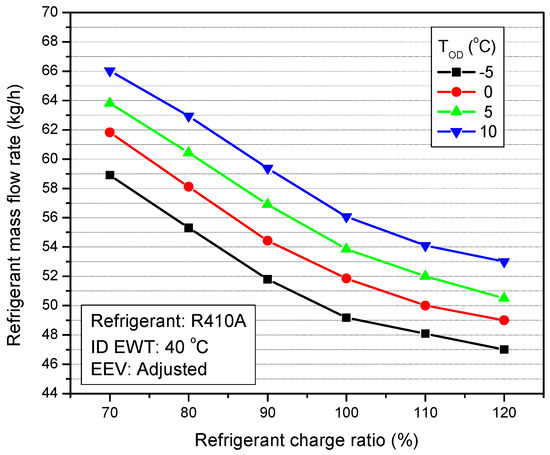
Figure 15.
Variation of refrigerant mass flow rate with refrigerant charge ratio and
Figure 16 shows the COP of the heat pump as a function of the refrigerant charge ratio and . The COP decreased significantly at undercharge conditions and slightly at overcharge conditions at all conditions. The power consumption of the heat pump decreased at undercharge conditions, as shown in Figure 17. This is due to decrease in the pressure ratio of the heat pump unit at undercharge conditions. However, the slope of decrease in the power consumption was smaller than that of the heating capacity, resulting in the decrease in COP. At overcharge conditions, power consumption increased because of an increase in the pressure ratio that caused a decrease in the COP at all . At the standard , the COP decreased by 6.5%, 23.0% and 52.9% at 90%, 80% and 70% RCR respectively. At overcharge conditions, the COP decreased by 2.4% and 5.5% at RCR of 110% and 120% respectively at the standard condition.
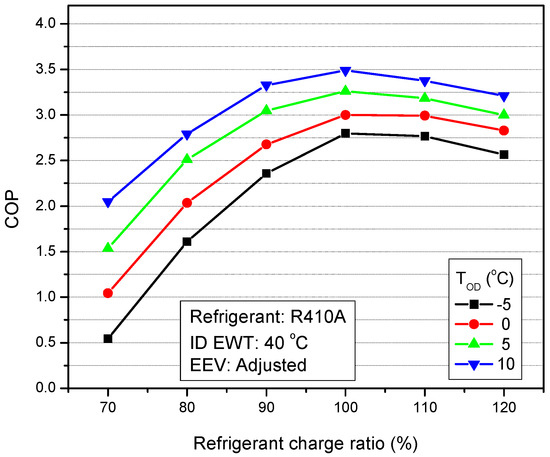
Figure 16.
Variation of COP with refrigerant charge ratio and
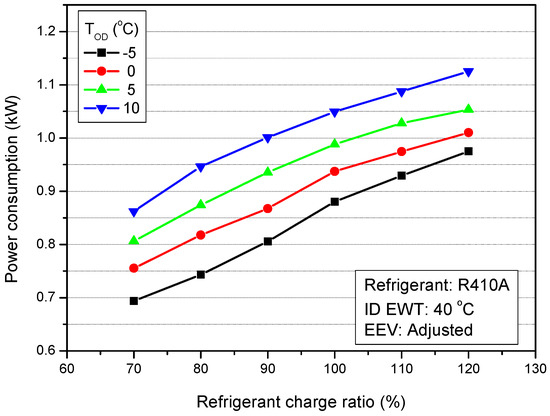
Figure 17.
Variation of power consumption with refrigerant charge ratio and
Figure 18 shows the effect of on the heating capacity of the heat pump. The heating capacity increased with an increase in the at all refrigerant charge ratios (RCR). This is mainly due to the significant increase in the refrigerant mass flow rate which caused an increase in the heat transfer rate between the refrigerant and secondary fluid in the OD HX and ID HX. The heating capacity increased by 11.5%, 25.1% and 42.2% as the increased from −5 °C to 0 °C, 5 °C and 10 °C respectively at the optimum refrigerant charge. Furthermore, the COP increased as the increased at all RCR as shown in Figure 19. This agrees with the trend of Zhao et al. [16]. The heating capacity and power consumption increased with the increase in . However, the increasing slope of the heating capacity was higher than that of the power consumption, causing the COP to increase as the increased. The COP increased by 7.2%, 16.5% and 24.7% as the increased from −5 °C to 0 °C, 5 °C and 10 °C respectively.
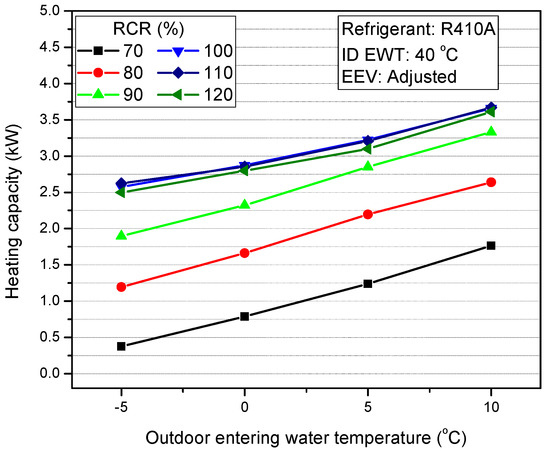
Figure 18.
Heating capacity with variation of in heating mode.
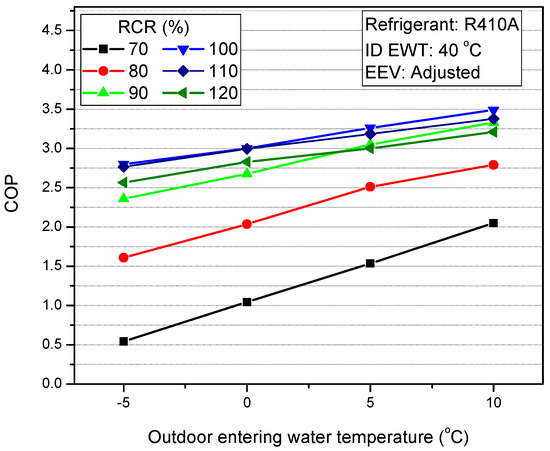
Figure 19.
COP with variation of in heating mode.
The refrigerant charge had a greater effect on the capacity and COP of the heat pump in heating mode than in cooling mode at undercharge conditions. The heating capacity decreased by 35.7%, 40.4% and 59.1% more than the decrease in the cooling capacity at RCR of 90%, 80% and 70% respectively at the standard condition. COP also decreased by 24.6%, 37.8% and 66% more than that of the COP in cooling mode at the standard condition at RCR of 90%, 80% and 70% respectively. The difference in percentage decrease in the capacity and COP of the heat pump in cooling and heating modes were almost similar at overcharge conditions.
4. Refrigerant Fault Detection and Diagnosis
Refrigerant charge faults exist when there is refrigerant undercharge or overcharge. Refrigerant undercharge is mostly caused by refrigerant leakage in the heat pump. However, refrigerant overcharge mostly occurs due to human error, as technicians charge heat pumps above the optimum charge amount.
As discussed in Section 3, refrigerant faults and the outdoor heat exchanger entering water temperature () have great effects on the performance of heat pumps. In either cooling mode or heating mode operation, refrigerant faults, especially refrigerant undercharge, results in a decrease in the capacity and COP of the heat pump. Especially at undercharge conditions, the decrease in performance gets worse with time as the amount of leakage increases. There is therefore the need to develop refrigerant fault detection and diagnosis (FDD) mechanisms to detect refrigerant faults at their early stages in real systems. Furthermore, increase in in cooling mode and decrease in in heating mode results in a decrease in the heat pump capacity and COP. However, the cannot be controlled in real systems, hence it must be taken into account in the development of FDD systems so that its effect on the performance of the heat pump is not mistaken as a refrigerant charge fault.
4.1. FDD Algorithm
The refrigerant charge FDD algorithm is developed using the test results of the water-to-water heat pump discussed in this study. Table 2 summarizes the trend of the operating parameters of the water-to-water heat pump unit when there is refrigerant reduction, and increase in cooling mode. At refrigerant reduction, the degree of subcooling, condensing temperature, compressor discharge temperature and pressure, secondary fluid temperature difference across the ID HX and OD HX all decrease, while the evaporating temperature increases. When the increases, the condensing temperature, evaporating temperature and compressor discharge temperature and pressure increase while secondary fluid temperature difference across the ID HX and OD HX decrease. However, the degree of subcooling of the water-to-water heat pump is insensitive to changes in the as shown in Figure 20. Choi et al. [4] therefore used the degree of subcooling to develop an algorithm to detect the refrigerant charge of a ground source heat pump unit.
Table 2.
Parameter trend and characteristics of the water-to-water heat pump in cooling mode.
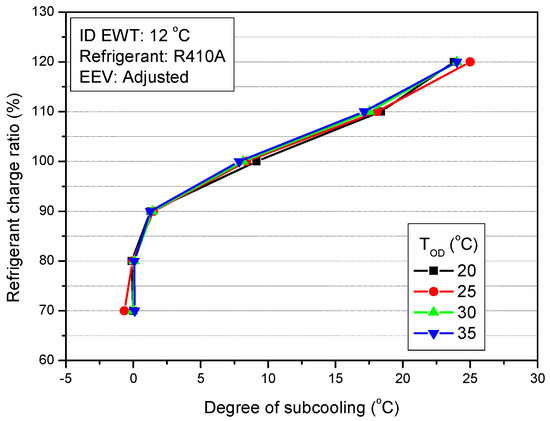
Figure 20.
Degree of subcooling with variation of refrigerant charge ratio and
Table 3 shows the parameter trend and characteristics of the water-to-water heat pump with variation of the refrigerant charge ratio and in heating mode. The parameter trends of the heat pump with refrigerant reduction is similar to that in cooling mode. However, a decrease in also causes a decrease in the condensing temperature, evaporating temperature and compressor discharge temperature and pressure. Secondary fluid temperature difference across the ID HX and OD HX also increase when decreases, while the degree of subcooling is not affected by as is in the case in cooling mode.
Table 3.
Parameter trend and characteristics of the water-to-water heat pump in heating mode.
Data of the parameter trends of the heat pump in cooling mode and heating mode are used to develop correlations to predict the refrigerant charge of the heat pump at the refrigerant charge ratios and conditions considered in this study. The refrigerant charge FDD algorithm is developed using the correlations and heat pump parameter trends and characteristics in Table 2 and Table 3.
Developing Refrigerant Charge Correlations
The correlations are developed to predict the refrigerant charge ratio of the heat pump at various conditions. The degree of subcooling, condensing temperature, evaporating temperature and compressor discharge temperature are selected for the development of the refrigerant charge correlations. The degree of subcooling is selected because it is insensitive to the in both cooling and heating modes. The condensing temperature is selected due to its direct relation with the heating capacity and in heating mode. The evaporating temperature is selected because of its direct effect on the cooling capacity and its relationship with the in cooling mode operation. The compressor discharge temperature is selected because it can easily be measured with a temperature sensor in both cooling mode and heating mode operations.
The relationship between the refrigerant charge ratio (RCR) and the condensing temperature, compressor discharge temperature and degree of subcooling in cooling mode were modelled according to the nature of their curves as 2nd order polynomials while that with the evaporating temperature was modelled as a 3rd order polynomial.
Figure 21, Figure 22, Figure 23 and Figure 24 show the relationship between the refrigerant charge ratio and the condensing temperature, compressor discharge temperature, degree of subcooling and evaporating temperature in cooling mode respectively. Though the condensing temperature and compressor discharge temperature have approximately linear relationship with the RCR, they have approximately polynomial relationships with the as shown in Figure 25 and Figure 26 respectively.
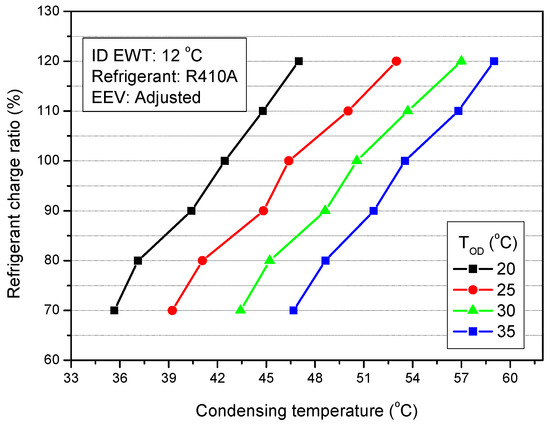
Figure 21.
Relationship between refrigerant charge ratio and condensing temperature in cooling mode.
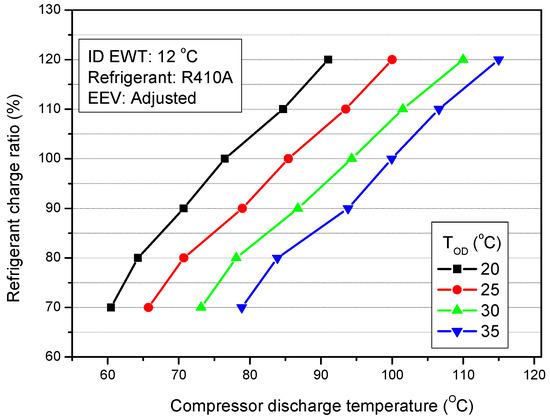
Figure 22.
Relationship between the refrigerant charge ratio and compressor discharge temperature in cooling mode.
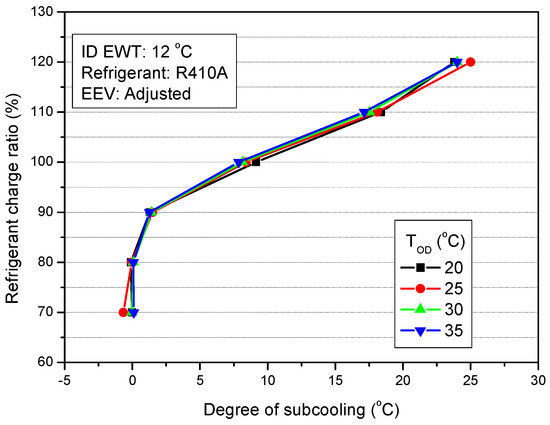
Figure 23.
Relationship between the refrigerant charge ratio and degree of subcooling in cooling mode.
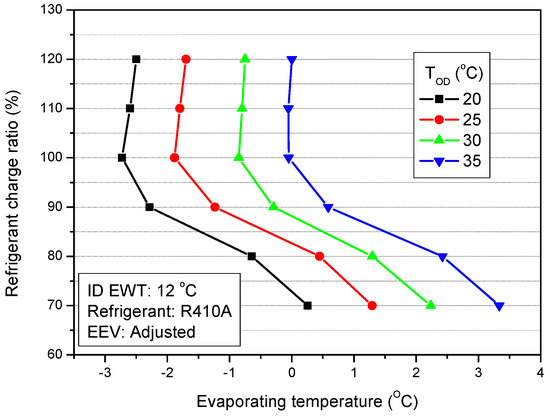
Figure 24.
Relationship between the refrigerant charge ratio and evaporating temperature in cooling mode.
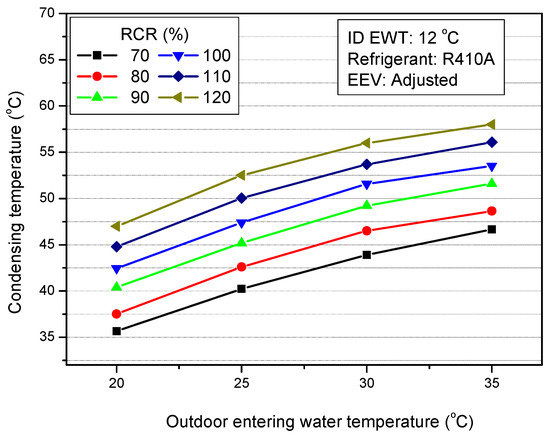
Figure 25.
Condensing temperature with variation of in cooling mode.
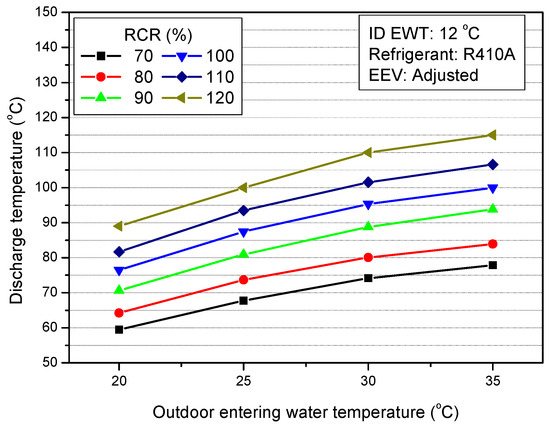
Figure 26.
Compressor discharge temperature with variation of in cooling mode.
In heating mode, the relationship between the refrigerant charge ratio and condensing temperature, degree of subcooling and evaporating temperature were modelled as 2nd order polynomials according Figure 27, Figure 28 and Figure 29 respectively. The relationship between RCR and the compressor discharge temperature was modelled as a 3rd order polynomial according to Figure 30.
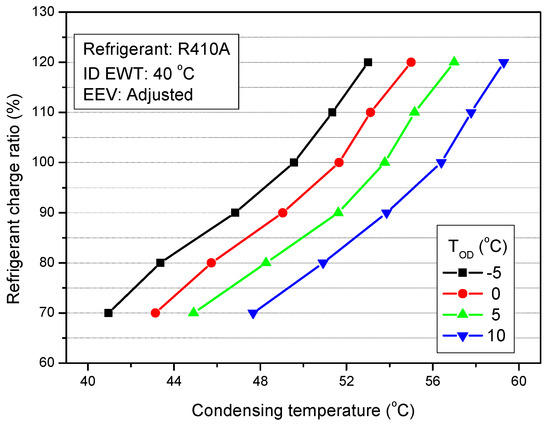
Figure 27.
Relationship between refrigerant charge ratio and condensing temperature in heating mode.
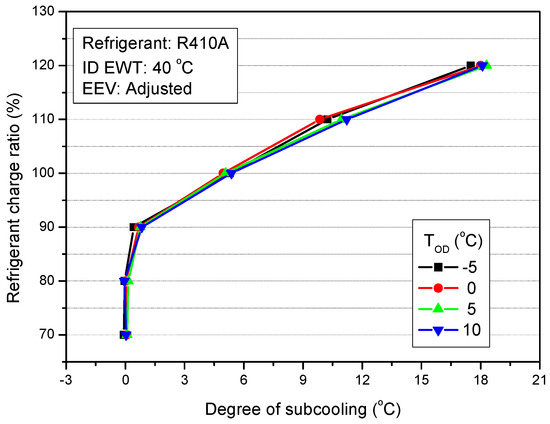
Figure 28.
Relationship between refrigerant charge ratio and degree of subcooling in heating mode.
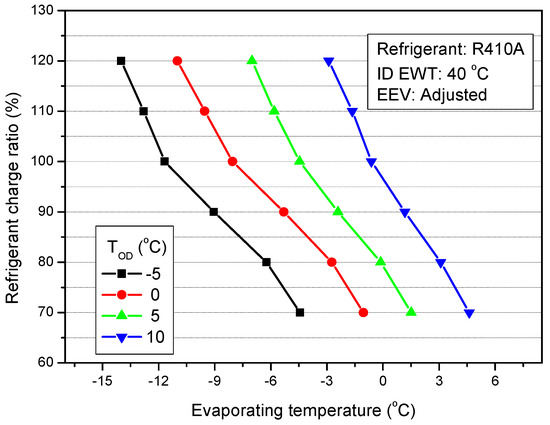
Figure 29.
Relationship between refrigerant charge ratio and evaporating temperature in heating mode.
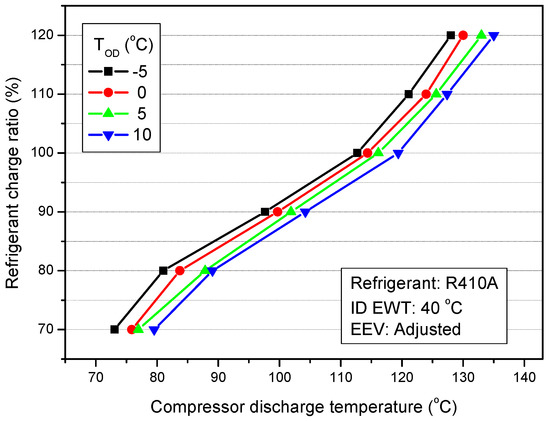
Figure 30.
Compressor discharge temperature with variation of refrigerant charge ratio in heating mode.
Equation (4) shows the form of the modelled 2nd order RCR correlations in heating and cooling mode while Equation (5) shows the form of the modelled 3rd order RCR correlations in heating and cooling mode, where is the outdoor entering water temperature, is the heat pump parameter used as independent variable in the correlation, and a, b, c, d, e, f, g, h, i, j and k are coefficients of the terms in the correlation. The coefficients of the terms of the various correlations in cooling and heating mode were obtained using multiple linear regression with Engineering Equation Solver [17], and are presented in Table 4 and Table 5 respectively. The developed correlations were used to predict the refrigerant charge ratio of the heat pump using data from this study. Predicted RCR values in cooling mode and heating mode were compared with the experimental RCR as shown in Figure 31 and Figure 32 respectively.
Table 4.
Coefficients of refrigerant charge correlations in cooling mode.
Table 5.
Coefficients of refrigerant charge correlations in heating mode.
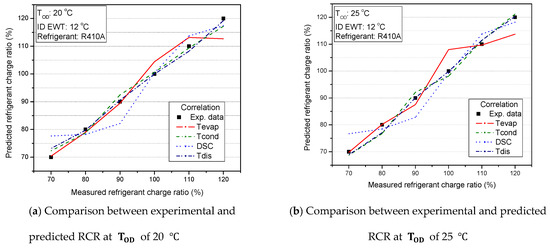
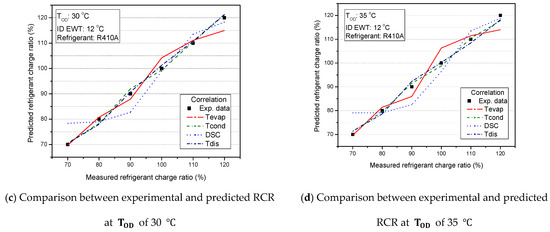
Figure 31.
Comparison between experimental and predicted RCR in cooling mode at of (a) 20 °C, (b) 25 °C, (c) 30 °C and (d) 35 °C.
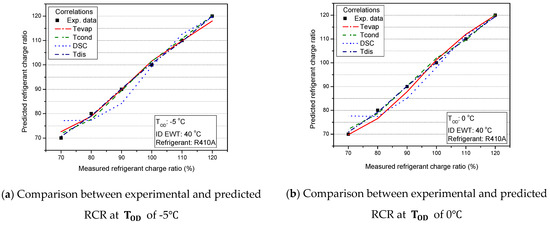
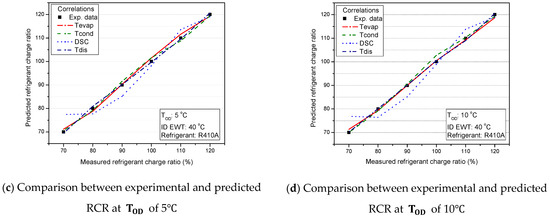
Figure 32.
Comparison between experimental and predicted RCR in heating mode at of (a) −5 °C, (b) 0 °C, (c) 5 °C and (d) 10 °C.
In cooling mode, the degree of subcooling model had the highest error threshold of ±11.9%, followed by the evaporating temperature model, with an error threshold of ±7.9%. The condensing temperature and compressor discharge temperature models had the lowest error thresholds in predicting the RCR of the heat pump. In heating mode, the degree of subcooling model had the highest error threshold followed by the condensing temperature model. The compressor discharge temperature and evaporating temperature models had the lowest error thresholds as shown in Table 6.
Table 6.
Error thresholds.
According to the error thresholds of the various RCR models, the condensing temperature model is the best to predict the RCR of the water-to-water heat pump in cooling mode while the compressor discharge temperature model gives the best prediction of the RCR in heating mode. The threshold error is selected according to the highest percentage difference between the experimental RCR values and the RCR values predicted using the FDD correlations. This is to prevent false alarms during the implementation of the FDD model. However, the condensing temperature is not easily measured in real systems. The compressor discharge temperature model, which has the lowest prediction error percentage in heating mode and the next lowest error threshold of ±4.5 in cooling mode is therefore selected as the refrigerant charge FDD correlation in this study. The advantage of using the compressor discharge temperature model is that it can be measured easily and directly in real systems using temperature sensors.
4.2. Refrigerant Charge FDD Algorithm
The refrigerant charge FDD algorithm is developed to detect and diagnose refrigerant faults of the water-to-water heat pump in cooling mode and heating mode. The FDD algorithm uses the compressor discharge temperature RCR correlation and rule-based performance characteristics of the heat pump to detect and diagnose refrigerant charge faults as shown in Figure 33. When in operation and at steady state, the refrigerant charge of the heat pump is predicted using the compressor discharge temperature RCR correlation by measuring the compressor discharge temperature and . The cooling mode RCR correlation is used to predict the RCR when the heat pump is working in cooling mode while that of heating mode is used to predict the RCR when the heat pump is operating in heating mode. The predicted RCR is then compared with the optimum refrigerant charge amount. Refrigerant fault is detected when the absolute difference between the predicted RCR and the optimum charge is above the threshold error (e). After detecting a refrigerant fault, the heat pump parameter trend and characteristic table are used to diagnose and evaluate the fault for a decision to be taken. Nonetheless, when the absolute difference between the predicted RCR and the optimum charge is below or equal to the threshold error, no refrigerant fault is detected; the system then continues to be monitored. The developed refrigerant charge FDD algorithm can detect and diagnose refrigerant faults within an error threshold of ±4.5 when the heat pump is operating in cooling mode. This is of higher accuracy than that reported by Choi and Choi [15], which could predict the RCR within an error threshold of 8.0%. Furthermore, the developed FDD algorithm can detect and diagnose refrigerant faults within an error threshold of ±1.1 when the heat pump is operating in heating mode. The refrigerant charge FDD can be implemented by modelling the algorithm as part of the control mechanism of the heat pump unit.
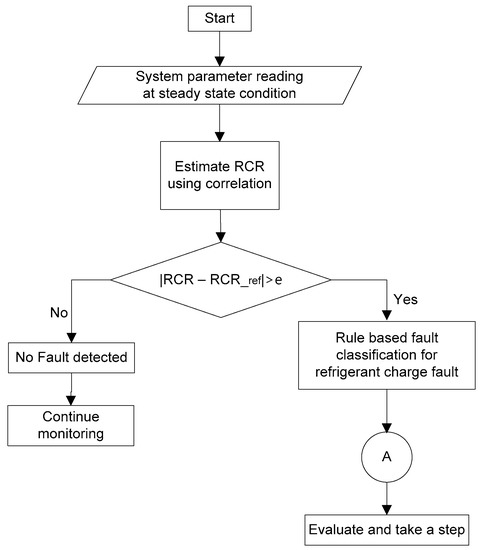
Figure 33.
Refrigerant FDD algorithm for water-to-water heat pump unit.
5. Conclusions
This study investigated the effect of refrigerant charge and outdoor heat exchanger entering water temperature () on the performance of water-to-water heat pump unit in cooling and heating modes. The study showed that at undercharge conditions, refrigerant charge faults affect the performance of the water-to-water heat pump more in heating mode than in cooling mode. However, the effect of refrigerant fault on the performance of the heat pump in heating mode is similar to that in cooling mode at overcharge conditions.
The compressor discharge temperature, evaporating temperature, condensing temperature and degree of subcooling were used to develop correlations to predict the refrigerant charge of the heat pump in cooling mode and heating mode. The condensing temperature correlation and the compressor discharge temperature correlation had the best accuracies in predicting the RCR in cooling mode and heating mode respectively. The condensing temperature correlation predicted the RCR within an error threshold of ±4.1% in cooling mode while the compressor discharge temperature correlation predicted the RCR within an error margin of ±1.1% in heating mode.
However, the compressor discharge temperature RCR correlation was used together with rule-based performance trend of the heat pump to develop refrigerant charge FDD algorithm in heating mode and cooling mode because the compressor discharge temperature can easily be measured in real systems using temperature sensors. The developed refrigerant charge FDD algorithm is able to predict refrigerant charge faults within an error threshold of ±4.5 and ±1.1 in cooling mode and heating mode respectively.
Author Contributions
S.B. and J.M.C. conducted the experimental data analysis and wrote this paper. K.H.L. checked the results and reviewed the paper.
Funding
This research was funded by the Korea Government Ministry of Trade, Industry & Energy [No. 20163010111840].
Acknowledgments
This work was supported by the Korea Institute of Energy Technology Evaluation and Planning (KETEP) grant funded by the Korea government (MOTIE) (No. 20163010111840, Development of a high density and capacity geothermal heating and cooling system adopting SCWs for residential cluster homes).
Conflicts of Interest
The authors declare no conflict of interest.
Nomenclature
| COP | Coefficient of performance |
| Specific heat capacity of water [kJ/kgK] | |
| e | Error |
| EEV | Electronic expansion valve |
| EWT | Entering water temperature [°C] |
| FDD | Fault detection and diagnosis |
| Indoor heat exchanger entering water temperature [°C] | |
| ID HX | Indoor heat exchanger |
| LWT | Leaving water temperature [°C] |
| Mass flow rate [kg/s] | |
| OD HX | Outdoor heat exchanger |
| Heat pump parameter | |
| Q | Cooling capacity [kW] |
| RCR | Refrigerant charge ratio |
| RTD | Resistance temperature detector |
| Outdoor heat exchanger entering water temperature [°C] | |
| U | Uncertainty |
| W | Power consumption [kW] |
| Nominal value of variable |
References
- Kim, D.H.; Park, H.S.; Kim, M.S. The effect of the refrigerant charge amount on single and cascade cycle heat pump systems. Int. J. Refrig. 2014, 40, 254–268. [Google Scholar] [CrossRef]
- Zhang, Z.; Dong, X.; Ren, Z.; Lai, T.; Hou, Y. Influence of refrigerant charge amount and EEV opening on the performance of a transcritical CO2 heat pump water heater. Energies 2017, 10, 1521. [Google Scholar] [CrossRef]
- Kim, W.; Braun, J.E. Evaluation of the impacts of refrigerant charge on air conditioner and heat pump performance. Int. J. Refrig. 2012, 35, 1805–1814. [Google Scholar] [CrossRef]
- Choi, H.; Cho, H.; Choi, J.M. Refrigerant amount detection algorithm for a ground source heat pimp unit. Renew. Energy 2012, 42, 111–117. [Google Scholar] [CrossRef]
- Yoo, J.W.; Hong, S.B.; Kim, M.S. Refrigerant leakage detection in an EEV installed residential air conditioner with limited sensor installations. Int. J. Refrig. 2017, 78, 157–165. [Google Scholar] [CrossRef]
- Kim, M.S.; Payne, W.V.; Domanski, P.A.; Yoon, S.H.; Hermes, C.J.L. Performance of a residential heat pump operating in the cooling mode with single faults imposed. Appl. Therm. Eng. 2009, 29, 770–778. [Google Scholar] [CrossRef]
- Zhao, Y.; Xiao, F.; Wang, S. An intelligent chiller fault detection and diagnosis methodology using Bayesian belief network. Energy Build. 2013, 57, 278–288. [Google Scholar] [CrossRef]
- Kim, M.; Kim, M.S. Performance investigation of a variable speed compression system for fault detection and diagnosis. Int. J. Refrig. 2005, 28, 481–488. [Google Scholar] [CrossRef]
- Gasche, J.L.; Andreotti, T.; Maia, C.R.M. A model to predict R134a refrigerant leakage through the radial clearance of rolling piston compressors. Int. J. Refrig. 2012, 35, 2223–2232. [Google Scholar] [CrossRef]
- Chen, Y.; Lan, L. A fault detection technique for air-source heat pump water chiller/heaters. Energy Build. 2009, 41, 881–887. [Google Scholar] [CrossRef]
- Sellami, A.; Aridhi, E.; Mzoughi, D.; Mami, A. Performance of the Bond Graph Approach for the detection and localization of faults of a refrigerator compartment containing an ice quantity. Int. J. Air-Cond. Refrig. 2018, 26, 1850028. [Google Scholar] [CrossRef]
- Payne, W.V.; Heo, J.; Domanski, P.A. A data-clustering technique for fault detection and diagnostics in field-assembled air conditioners. Int. J. Air-Cond. Refrig. 2018, 26, 1850015. [Google Scholar] [CrossRef]
- International Organization for Standardization. Water-Source Heat Pumps-Testing and Rating for Performance Part 2: Water-to-Water and Brine-to-Water Heat Pumps; International Organization for Standardization: Geneva, Switzerland, 1998. [Google Scholar]
- ASHRAE. Ashrae Guideline 2. Engineering Analysis of Experimental Data; ASHRAE: Atlanta, GA, USA, 1986. [Google Scholar]
- Chae, J.H.; Choi, J.M. Evaluation of the impacts of high stage refrigerant charge on cascade heat pump performance. Renew. Energy 2015, 79, 66–71. [Google Scholar] [CrossRef]
- Zhao, X.; Long, E.; Zhang, Y.; Liu, Q.; Jin, Z.; Liang, F. Experimental study on heating performance of air-source heat pump with water tank for thermal energy storage. Proc. Eng. 2017, 205, 2055–2062. [Google Scholar] [CrossRef]
- Klein, S.A. EES-Engineering Equation Solver; Version 10.468; F-Chart Software: Middleton, WI, USA, 2018. [Google Scholar]
© 2019 by the authors. Licensee MDPI, Basel, Switzerland. This article is an open access article distributed under the terms and conditions of the Creative Commons Attribution (CC BY) license (http://creativecommons.org/licenses/by/4.0/).