Abstract
The island of Sark, located in the English Channel, has endured an electricity distribution crisis for the past few years, resulting in high electricity costs almost six times higher than UK mainland energy prices. This article is focused on a methodology for finding the best renewable energy system with the lowest levelized cost of energy (LCOE) in comparison to the current energy rate of 66 p/kWh. Three different main cases of study have been compared in performance for different levels of renewable energy integration and energy storage, evaluating the estimated size of the system, installation cost and CO2 emissions. The results, which depend on the assumptions outlined, show that Case 2 renewable energy generation system is the most suitable in terms of reduction of CO2 emissions and expected earnings from a lower LCOE. Uncertainty in the results could be minimized if actual data from the island is made available by following the same methodology to find the best solution to the island’s current energy generation problem. Due to non-available data for the load profiles and wind velocity a set of assumption were required to be implemented. As such, two different load profiles were selected—one with a peak of energy consumption in winter and the other with a summer peak.
1. Introduction
There is a global challenge to reduce the greenhouse gas (GHG) emission to the environment by 2050. For this reason, the UK has committed to decrease GHG emissions by 80% compared to 1990 levels [1] and to achieve net zero carbon emissions by 2050. Two main trends to reduce emissions are to either reduce the carbon intensity of electricity generation by introducing more renewable or low-carbon generation systems, and the other is to reduce average and peak consumption, usually achieved by enhancing the efficiency of the overall distribution system and by influencing consumption patterns.
Due to this challenge, there has been an accelerated increase of renewable energy installation in the past 10 years, boosted by a variety of factors like governmental incentives, a drastic drop in manufacturing prices, and technological maturity that helps drive the price of projects lower. With all these advantages, the cost of renewable energies can help reduce overall generating cost.
The growth of renewable energy generation needs to be monitored because a high penetration of renewable energy sources into the grid can create instability resulting in issues with the frequency control and response issues. Furthermore, the intermittent nature of renewables like solar and wind directly affects the grid stability. This effect is even more severe on small islanded systems without interconnection to other generation or loads that can absorb the energy generation surplus.
Energy storage helps to balance the grid by reshaping supply and demand patterns by storing the energy and enabling its use at a later time. There are many different types of energy storage methods, such as mechanical (hydroelectric, pumped-storage, compressed air, etc.), thermal (sensible heat, latent heat, etc.), and electrochemical.
The scope of this study is to validate the feasibility of introducing renewable energy penetration to cover the island’s current and near future energy needs, comparing a variety of parameters concerning the installation and sizing. The outcomes of the followed methodology are validated by evaluating key control parameters for each individual scenario considered. Those control values are the installation cost, CO2 emissions, levelized cost of energy, and the return of investment [2].
This article is focused on finding the best renewable energy system with the lowest LCOE in comparison to the current energy cost of 66 p/kWh [3]. Based on educated assumptions in addition to data analysis and manipulation, we estimate an optimal integration of wind and solar as primary renewable energies with an energy storage system (if required) to stabilize the grid.
Furthermore, besides a high level of performance, the study compares the financial viability of the generation system to obtain a LCOE lower than the actual cost the energy of 66 p/kWh. This article also relates to the goal of the Sark Island energy commissioner on the price control order aiming to achieve an energy cost reduction to 56 p/kWh for the island.
The scope for this article is limited to
- Estimate the island energy profile and different generation systems based on available data and system comparison;
- Use a combination of wind, solar, and battery storage with the current energy system and calculate the technical and financial feasibility assuming a 20-year lifespan;
- Showcase the advantages and disadvantages for three different case studies with different installation costs and operational implications; and
- Use a simplified levelized cost of energy (LCOE) estimation to compare the feasibility of the system.
The main advances of this research, related to different studies conducted in this area, were
- (1)
- This study used all of the available data and implemented educated assumptions to estimate data that were not available (load, wind velocity). Data analysis and manipulation were carried out to estimate an optimal integration of wind and solar as primary renewable energies with an energy storage system to stabilize the grid, if required.
- (2)
- The worst-case scenario was used for the load, running two highly different load profiles with peaks in winter and summer. Only the latter is presented here.
- (3)
- This method takes an hourly data analysis of the variation on the state of charge of the battery for the complete year with the help of three energy generation systems to keep the battery charged.
- (4)
- The validation was based on the use of a theoretical wind velocity estimation using the Rayleigh distribution function from the 2013–2019 data sets.
- (5)
- Monthly solar irradiation values available from NASA daily data were used for Sark Island. Those data were decomposed in hourly values by the present team.
- (6)
- Using MATLAB coding, the available data is analyzed in hourly and 15 min intervals to calculate the optimal battery size and auxiliary energy generation require (gas or diesel) to keep the batteries in a good state. Dalton et al. [4] based their research on the calculation of a medium-sized energy generation system by applying all the calculations using Homer software (Hybrid Optimization Models for Energy Resources) power optimization software by NREL (National Renewable Energy Laboratory). In contrast, the method applied in this research are more open to variabilities and adjustment due to the use of our own coding and calculation algorithms to find the most cost-effective system for an entire island.
- (7)
- The sensitivity analysis in this article evaluates more than 40 different scenarios to compare and validate the best energy mix for the island. Moreover, the way that it is implemented enables the coding to be used to calculate the same output for any other new set of data.
2. Background
The island of Sark, located in the English Channel in the Bay of St Malo, is enduring an electricity distribution crisis. The issue relates to high electricity costs of almost six times higher than UK mainland energy costs. Sark electricity, the island’s privately owned energy generation entity, has warned that a reduction in the electricity price could result in a permanent shutdown of energy generation.
The island’s independent energy commissioner has objected to the high electricity cost of 66 p/kWh [5] and ordered the reduction of the energy price to 52 p/kWh in a Price Control Order [4]. However, this is still much higher than the UK average of 14 p/kWh.
As a response, Sark Electricity claimed that, if the price reduction is applied, they would lose £20,000 a month. The increase of energy prices has been attributed to a lower demand, forcing an increase in cost to be able to cover the capital cost of its operation. The island government is trying to reach an agreement to buy off the company from the Gordon-Brown Brothers.
The price control law also aims to reduce the cost to 52 p/kWh from August 2018 to 2019 and then reduce it to a minimum of 49 p/kWh from 2019 to 2020. With the current untaxed diesel cost of 42 p/l [3], this goal is difficult to obtain. For that reason, an alternate renewable energy generation system is evaluated to partially or completely generate the energy that the island requires.
3. Methodology
Figure 1 shows the step-by-step workflow diagram with the input data that initially is stored and organized differently with different times between measurements. A brief introduction to the structure of the data, the process to clean it and calculate the values will be presented here.
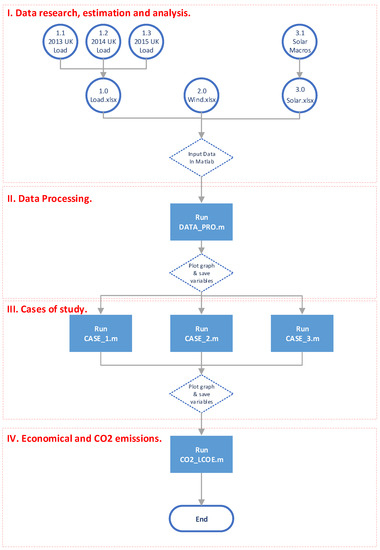
Figure 1.
Workflow diagram. Data treatment and MATLAB code processing and results.
The methodology was divided in the following four sections:
3.1. Data Research, Calculations and Estimations Analysis
The first part has been to acquire the different sets of data for the island, including load (consumption), wind speed, and solar irradiance, in order to calculate the output and the integrations of the different scenarios. The only calculation in this section is for the solar power output for a single solar panel using standardized data in kWh per 10 min measurement intervals.
3.2. Data Processing
The data processing consists of data cleaning from any the missing or out of range/corrupt data values. Then, the solar and load files have been calculated at 10 min interval values to have more accurate results for the sizing of the battery banks.
3.3. Case Studies
To find the best solution for the island’s actual energy requirements, a set of three different main case studies are compared in terms of the performance and integration of the renewable energy, the estimated size of the system, installation cost, and the CO2 emission.
- Case 1: 100% Renewable energy generation system with energy storage. A purely wind energy generation (500 kW) and an oversized battery bank.
- Case 2: Gen-set and renewable energy generation system with energy storage; 500 kW wind turbine with the addition of using the small generator of 375 KVA to charge the battery when renewable energy is insufficient.
- Case 3: 40% Renewable energy penetration. Mix of solar and wind to have a more stable energy output during the day when the peak on the load occurs with a 150 kW wind turbine and 150 kWp solar-PV system.
3.4. Economical and CO2 Emissions
One of the main benefits of renewable generation installation is reducing the carbon intensity of the grid. For the UK climate, photovoltaic installations have a carbon intensity of 41 gCO2e/kWh, which is below the UK 2030 target [6]. From a life cycle study on onshore wind turbines, the carbon intensity is around 60 gCO2e/kWh [7] (Table 1).

Table 1.
Renewable energy CO2 emissions.
Using MATLAB data analysis for each case, the required installed system capacity has been obtained for the annual energy output and used to compare the CO2 emissions and the economic viability of the designed system (Figure 1).
4. Data Research and Processing (Section I and II of the Methodology)
4.1. Load Consumption Estimation
From an official report from the electricity commissioner, the annual total consumption of the island is 1600 mWh/year [3]. Moreover, the hourly consumption profile was chosen to be similar to the United Kingdom as an approximation due to the comparable annual temperature profiles (Figure 2), where the ambient temperature can relate the peak of consumption being in winter [8].
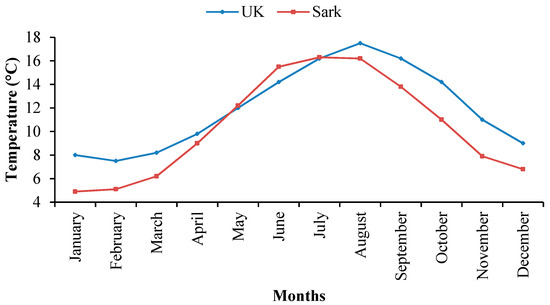
Figure 2.
Annual temperature comparison between the UK and Sark Island [9].
Selecting the UK as the characteristic consumption profile for the Sark Island, the first step was to upload the data in MATLAB and clean all the missing point of measures in one-hour intervals. The data was cleaned, and the mean for each hour was calculated between the three years of data available (2013, 2014, and 2015). The data was downloaded from the Entsoe (European Network of Transmission System Operators) [10].
The next step was to adjust the annual UK load (292.70 GWh/Year) to the annual load of the island of 1.6 GWh/year. A correction factor (IS-CF1) has been used to reduce total energy consumed and applied to all the data set (Equation (1)).
Figure 3 shows the new adjusted consumption after the correction factor was applied. As a final step in the load analysis, the two most representative days where plotted. The worst day of winter required a load of 286 kW. This step also confirms that the data estimates comply with the actual generator working on Sark Island, with a capacity of 600 kW [11]. On the other hand, this also shows the lowest consumption of 108.6 kW for the summer day with the least generation required. Using these two values, the highest generation requirement for the system of battery storage and the minimum energy that needs to be supply at all times can be determined (Figure 4).
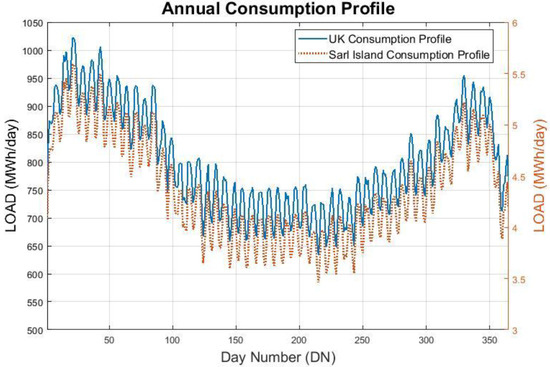
Figure 3.
Annual energy consumption for the UK [10].
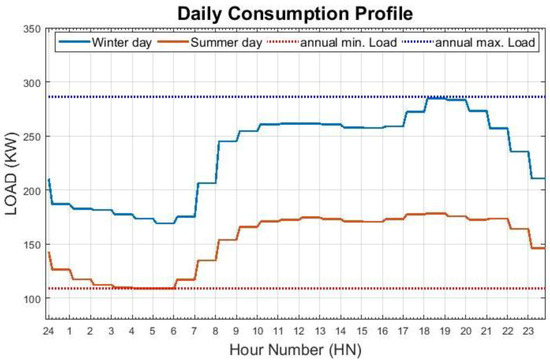
Figure 4.
Daily energy consumption profile from Sark Island.
4.2. Wind Generation Estimation
One of the biggest challenges in this research was access to accurate data. To be able to get wind data in 10 minutes interval measurement, the monthly data available has been compared using data from NASA [9] for the location of Sark Island latitude and longitude (49.432–2.36) and a set of available data from North Mains of Cononsyth farm located in Arbroath, Aberdeenshire (56.30–2.44) in the required measurement intervals. Figure 5 shows the close monthly mean between the two locations with an average 10% deviation of the wind speed.
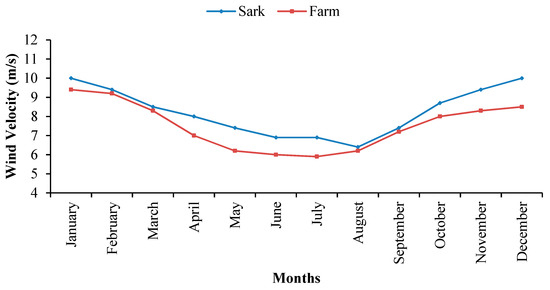
Figure 5.
Mean wind velocity at 10 m.
4.2.1. Cononsyth Farm Wind Data Analysis
From available data of 10 minutes interval reading from a weather station installed on the Cononsyth Farm premise, we produced the following study for the wind behaviors and the direct output of the installed 330 Enercon wind turbine. To validate the use of a theorical wind velocity estimation, a Rayleigh distribution function ((Equation (2)) was applied to the data set from 2013 to 2019 (Figure 6) and then compared to the theorical one (Figure 7).
where
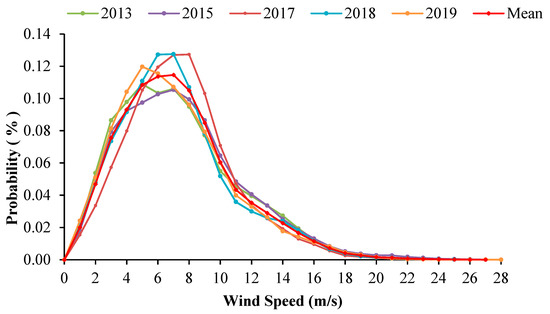
Figure 6.
Rayleigh distribution function (2013–2019).
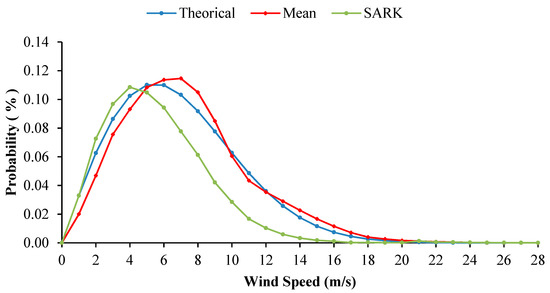
Figure 7.
Comparison between Rayleigh distribution function and theorical function.
- U = wind speed;
- = annual mean wind speed.
It is shown that there is a close relation between the theorical curve and the actual wind speed behavior on the island. Compared with the Sark Island distribution analysis, a variance of the peak wind speed can be appreciated. For Sark, the mean is 4.2 m/s, versus a mean of 6.4 m/s for Cononsyth Farm.
4.2.2. Wind Turbine Power Output Calculation
As a demonstrative year, Figure 8 shows the power output of the 330 kW wind turbine for the current 2019. Figure 9 shows the data sets for 2013, 2015 and 2018 output were also analyzed and included in the mean.
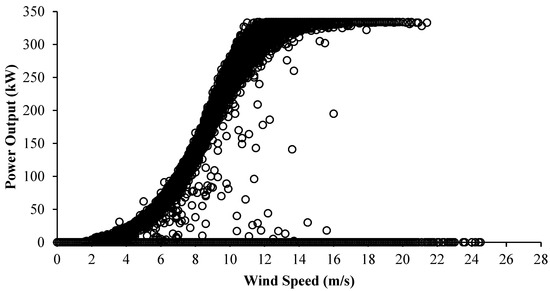
Figure 8.
Power output for Enercon 330 kW (2019).
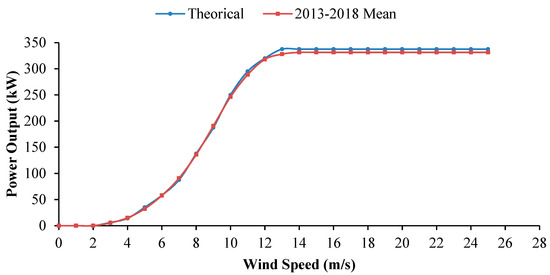
Figure 9.
Data set for 2013, 2015, and 2018.
Comparing the manufacturer expected power output for the wind turbine and the actual generation capacity demonstrates a close relation between the theorical and real turbine capacity. To be able to have a flexibility in the combination of power to be installed four wind turbines have been selected with different generation capacities, hub height, and cut in and cut off wind velocities. Table 2 shows the basic data of the turbines.
Table 2.
Technical data for Wind turbines [12].
Figure 10 depicts the fitted curve equation from the set of point from the manufacture power curve in the datasheet. The wind speed was measured at 10 m height and adjusted to the velocity as required by the hub of the wind turbine, from the set of turbines selected the wind speeds where adjusted to a hub height of 35 m and 50 m. This was calculated by applying the Hellman coefficient correction for the wind speed at hub height (Equation (3)) [6].
where
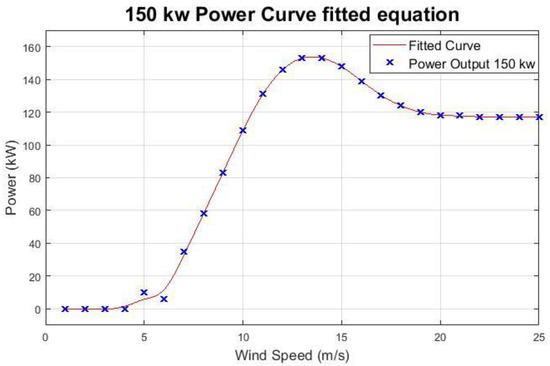
Figure 10.
The 150 kW power curve fitted equation.
- = velocity of the wind (m/s), at height h2;
- V10 = velocity of the wind (m/s), at height h10 = 10 m;
- α = Hellmann coefficient, in this case 0.11.
Finally, to calculate the power output of the wind turbine, Equation (3) was used and the new velocity at the hub height using the MATLAB function “Spline” to obtain all the individual values in 10 min intervals of recorded wind speed (Equation (4)).
where
- Vturb = known wind velocity from turbine power curve (m/s);
- Y150 = known power output for the standard wind velocity (Vturb) (kW);
- = Sark calculated wind velocity at the hub height required.
Figure 11 shows the output for the 150 kW wind turbine with the result of Equation (4). As expected, in the summer days of the year, there is a lower wind speed close to the cut-in speed as can be observed within the red square (1) in Figure 11. As a final representation of the power output of the turbine, a representative two-day time span is plotted with the 10 min intervals data in the next graph for a typical day of summer and winter.
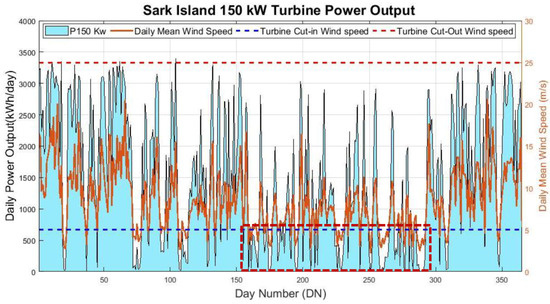
Figure 11.
Sark Island 150 kW turbine power output.
For the selected 150 kWp wind turbine system size, the annual generation is 483.5 mWh/year.
From this value, the capacity factor (CF) for the installation in Sark Island was calculated, resulting in a 36.79% capacity factor. The UK standard CF is 31% [13]. The higher value for this island is expected due to the location of the turbine where a CF closer to an offshore wind turbine is characteristic.
4.3. Solar PV Generation
The data parameter needed to calculate the PV energy generation for a specific location have been acquired from the NASA [9] website utilizing the Sark Island latitude and longitude (49.432–2.36) [14]. Table 3 shows the data for a standard day in each month for the maximum and minimum temperature, the daily diffused (D) and global horizontal (G) irradiation.
Table 3.
NASA annual temperature and irradiance values of Sark Island.
Figure 12 shows Sark Island irradiance data from values of daily diffused (D) and horizontal (G) irradiation from Table 3 using the EXCEL program to split the data into hourly IG and ID.
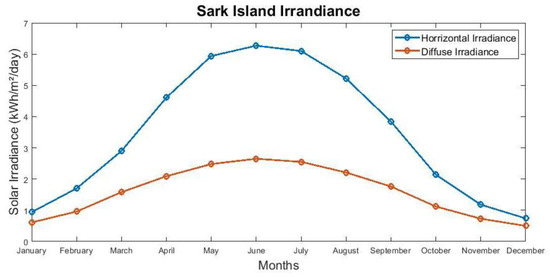
Figure 12.
Sark Island irradiance [9].
To obtain the best possible approximation of the solar panel energy production accurate hourly data are required. In this case the hourly temperature equation (Equation (6)) was utilized in terms of a Z-parameter from an ASHRAE estimated hourly computer model [15,16].
where
- Th = temperature in any hour;
- Tmax = daily maximum temperature;
- Tmin = daily maximum temperature;
- Z = ratio of hourly temperature variation.
The next step is to calculate the Slope Global Irradiance for each month on Sark Island using the values of diffused (D) and global (G) irradiation [9] shown in Table 3. In addition, a Tilt inclination of 25° was selected with a south orientation of 180° to optimize the solar energy absorption. In order to include the weather variation, the daily mean of three years’ worth of data has been obtained and used to calculate a correction factor for each day. The corrected slope irradiance is shown in Figure 13.
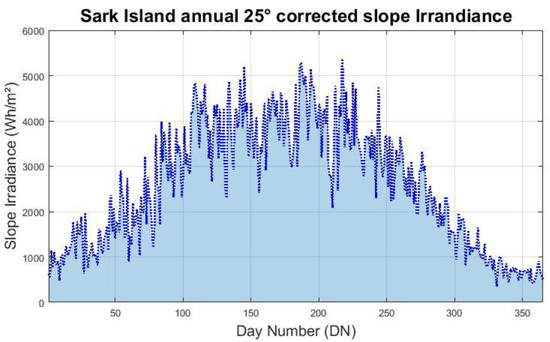
Figure 13.
Sark Island corrected annual 25° slope irradiance.
Applying all the variables previously calculate for each hour of the day and taking into consideration the variation on efficiency due to temperature and sizing of the system. The monthly power output for a single PV panel had to be calculated (Equation (7)). The daily sum of the generation can be observed in Figure 14.
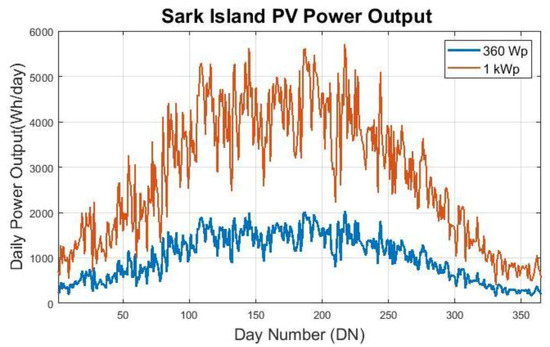
Figure 14.
Sark Island PV power output.
The adjusted cell efficiency, as defined by the Equation (8), which varies depending on the cell temperature using the temperature coefficient (αp).
where
- ηcell = solar cell temperature efficiency;
- ηstc = efficiency under Standard Test Conditions and is 18.5%;
- αp = temperature coefficient;
- TC = cell temperature;
- Tc,stc = cell temperature under standard test conditions.
The results for every hour in a month reveal a variation from the datasheet efficiency of 18.5%. The cell efficiency varies from 19.20% to 21.63%. The solar data has been divided from one-hour intervals to 10 min to standardize all the data sets. Figure 15 presents two days of summer (summer solstice—20 June to 21 June).
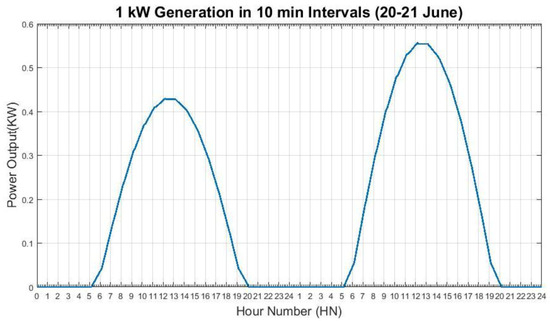
Figure 15.
1 kW Generation in 10 min intervals (20–21 June).
For the selected 1 kWp PV system size the annual generation is 1025.0 kWh/year.
From this value, the capacity factor (CF) for the installation in Sark Island was calculated, resulting in an 11.70% capacity factor. The UK standard CF is 10.7% [17]. The higher value for the island is expected due to lower altitude, translating into more irradiance per meter square.
5. Cases of Study (Section III of the Methodology)
To find the best solution for the Sark Island actual energy requirements, a set of three different main cases are going to be compared for performance and integration of the renewables energy, the estimated size of the system, installation cost, and the CO2 emissions.
5.1. Case 1: 100% Renewable Penetration
Figure 16 shows a simplified connection diagram of Sark Island, where the blue dotted square shows the existing diesel generators. The criteria to size this system was to be able to supply 100% of the energy required by the island just with a mix of renewable energy. This article only contemplated wind and solar as energy sources. The first step was to change the penetration of wind by using the 4 turbines output and add the required energy missing with the output of the 1 kWp PV system to size the solar system as well to supply 100% of the annual energy of the load (1600 MWh/year) (Table 4).
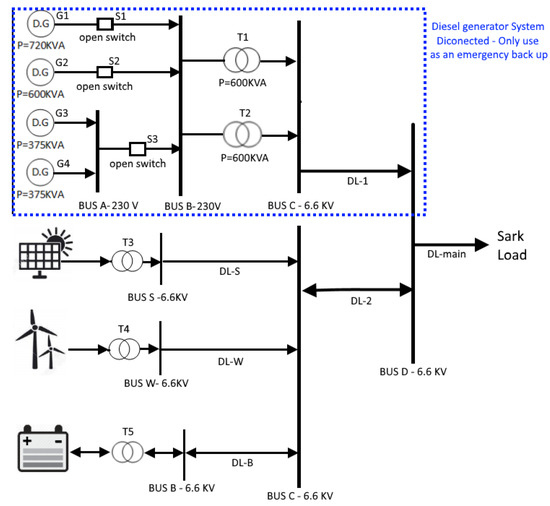
Figure 16.
Case 1. Simplified proposed connection diagram of Sark Island.
Table 4.
Case 1: System size and production results.
With the size of the 10 different scenarios, the available energy at any given hour has been calculated at hourly intervals by deducting the instantaneous load from the available renewable energy, as shown in the next equation:
where
- Ewind: Wind energy generation (kW);
- Epv: Solar PV energy generation (kW);
- Eload: Sark Island consumption (kW).
After, the energy balances with one-hour intervals have been added to calculate the available energy to be stored in the battery (Equation (11)).
where
- Ebal1: Initial Energy balance (kW);
- Ebal2: next Energy balance (kW).
Then, the net energy for the battery has been calculated to have an annual net energy charge and discharge rate for the system. Figure 17 and Figure 18 show the results for each of the renewable energy mixes.
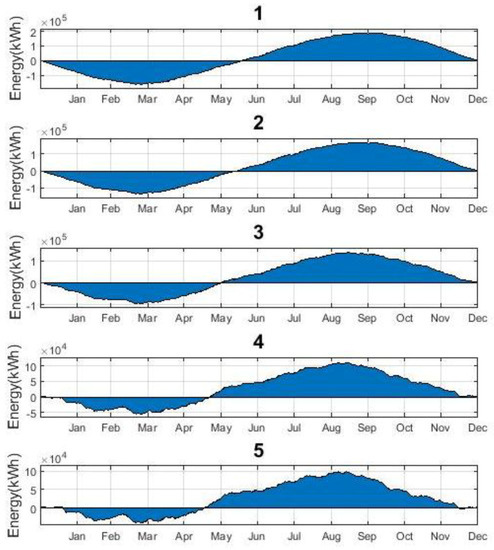
Figure 17.
Part 1: Energy balance per scenarios 1–5.
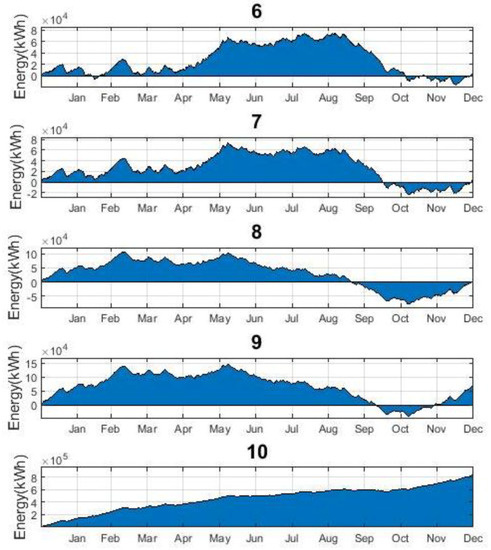
Figure 18.
Part 2: Energy balance per scenarios 6–10.
The results of these graphs showcase the charge and discharge rate expected for the characteristic load of the island considering the specific renewable energy mix. The first five graphs have predominant solar generation, which create a characteristic behavior of discharge rate on the winter days sections 1 and 3 and charge rate on the months with higher irradiance Section 2 (Figure 19).
Figure 19.
Scenario 2: Energy balance.
On the other hand, a higher percentage of wind generation is shown to achieve a less demanding energy system by reducing the time of constant discharge of the overall system. In scenario 6, a combination of 69.4% of wind and 30.4% of solar generation results in smaller estimated battery storage to deliver the energy during discharge periods. This assumption is based on the overall net energy use in sections 1–3–5 and the much smaller discharge rate state in Section 4, as shown in Figure 20.
Figure 20.
Scenario 6: Energy balance.
In scenarios 7–9, the largest wind integration changes the time of discharge rate in summer days, as shown in Section 3 of the Figure 21. The charge periods in sections 1 and 4 occur at higher constant wind speeds.
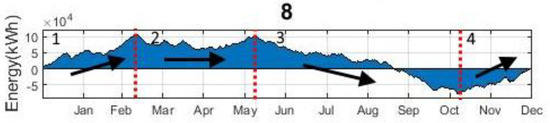
Figure 21.
Scenario 8: Energy balance.
Finally, in scenario 10, a constant charge rate occurs due to the oversizing of the system with a 150% generation integration compared to the load. This scenario will have the smallest possible battery storage needed at the cost of having over generation and energy loss (Figure 22).
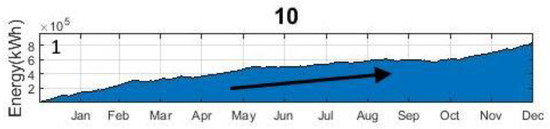
Figure 22.
Scenario 10: Energy balance.
After evaluating the system performance, the battery storage was designed on the worst-case scenario (Figure 23). Each scenario has been compared to select the most ideal system for the island utilizing the system configuration of Case 1.
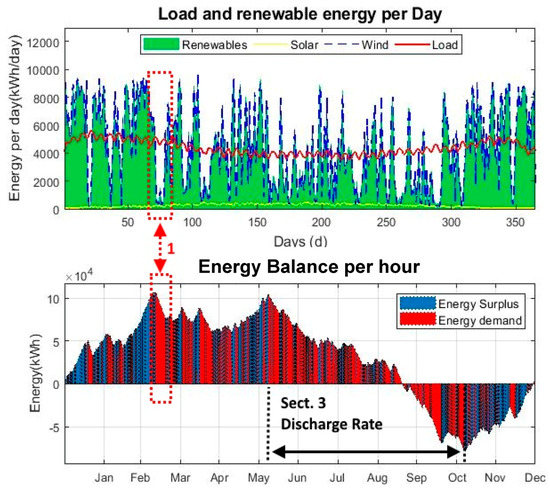
Figure 23.
Scenario 8: Annual load and renewable generation.
5.2. Case II: Renewable Energy Generation and Battery—GenSet System
The second case study considers a mix or renewable energy generation and a battery storage system (BSS) along with the existing diesel generation, which is necessary to reduce the size of the battery bank in order to decrease the installation cost. The use of the small generator currently available on the island could supply energy when the renewable sources are insufficient to supply the load and recharge the batteries (Figure 24).
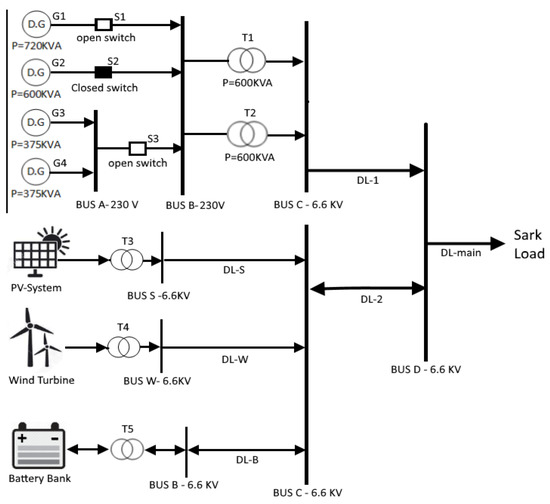
Figure 24.
Case 2. Simplified connection diagram of Sark Island.
A minimum autonomy of one day (24 hours) has been assumed for the battery as an initial design point along with a minimum SOC of 40% and a daily mean consumption for a day (Ereq2) of 4.38 MWh/day whilst, the same overall battery system efficiency was assumed as
The results for Equation (12) are a new battery bank of 7.22 MWh, with a reduction in size of 92% compared to the average size of the case 1 results. From the methodology section, a peak load consumption of 295 kW was obtained and used to size the inverter considering an overrating of 1.3 times thus sizing the inverter at 383.5 kW. With the selected inverter and the battery size of the system, the energy storage system of Autarsys has been selected. A system efficiency for charging and discharging the battery storage of 85% [18] has been assumed.
As shown in Figure 25 the peak hours of consumption are between 8:00 and 23:00. The code has been based on the same structure of the energy balance calculation for case 1 while adding the condition of charging the battery at the minimum state of charge. The latter has been limited by the hours the generator starting when the SOC is less than 50% and staying on until the battery is fully recharge.
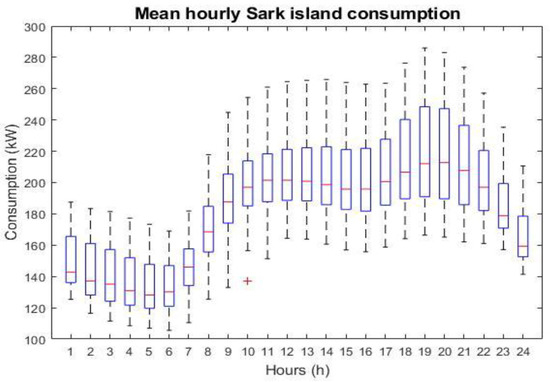
Figure 25.
Mean hourly Sark Island consumption.
The best scenarios from the previous case (scenarios 6 and 10) have been re-evaluated in case 2 with the same battery storage capacity, while three more additional battery sizing scenarios have been evaluated to compare the difference in cost and incidence of diesel generation.
The new scenarios are divided as follow (Table 5):
Table 5.
Case 2. Scenario analysis.
Only one scenario is hereby presented (Case 2, Scenario 6: 500 kW Wind + 1.80 MWh battery storage) in order to avoid repetition and plotting similar figures with small variance.
Figure 26 shows the overall renewable energy surplus (waste) in comparison with the total amount of energy required to recharge the battery by the generator. A distinctive behavior can be observed. Due to reliance on wind generation an energy surplus is predicted in the coldest months, while between May to October, the presence of the diesel generator is higher due to lower wind speeds.
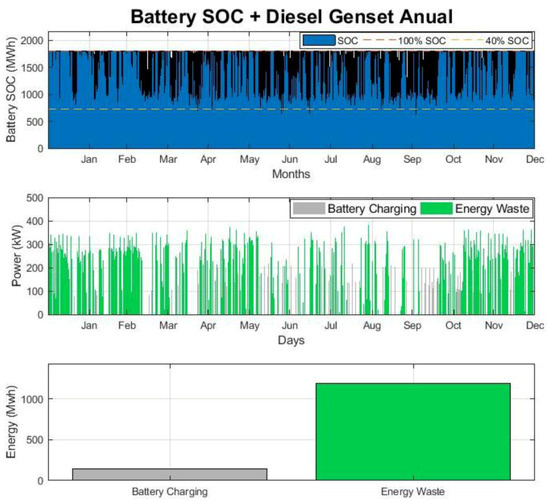
Figure 26.
Scenario 6: 500 kW wind turbine and 1.80 MWh battery storage annual results.
The more representative month of October, chosen as a transitional month, has been plotted in Figure 27 to provide further insight. In this month, the use of the generator to recharge the battery is required at least twice per day for the worst day of renewable energy generation. This is important as the cycling of the battery will affect the expected battery life of the system. Furthermore, the necessity of the diesel generator is highlighted for recharging during those intervals due to insufficient renewable energy. Finally, the annual energy balance for each scenario is compared in Table 4 and presented as a comparative plot in Figure 28.
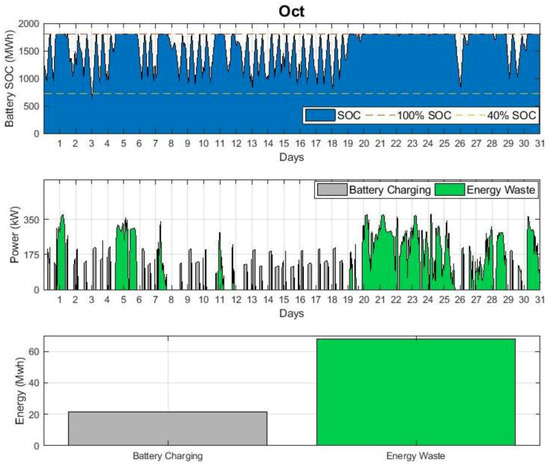
Figure 27.
Scenario 6: 500 kW wind turbine and 1.80 MWh battery storage (October).
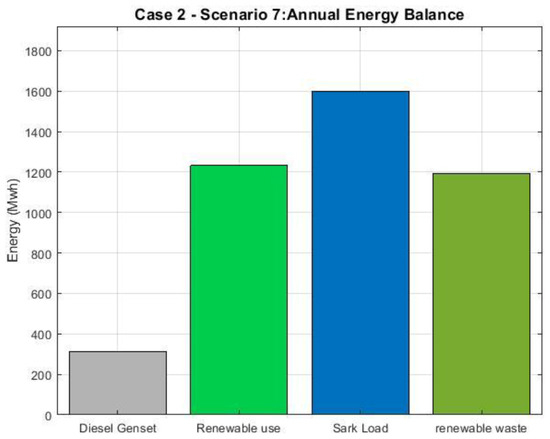
Figure 28.
Case 2, Scenario 7: Annual energy balance.
The total renewable energy generation for each case can be observed along with the total energy waste (surplus) and the required diesel energy generation, thus summarizing the results. Comparing the two renewable generation systems, an average of 18% of the energy use in the system comes from the generator. The notable difference in this analysis is the average energy waste between the two energy systems. Case 1, scenario 6 has a 27% of energy waste in the year, versus the 73% was from the case 2. The amount of cycles is dictated by the size of the battery bank and not by the renewable energy generation profile. From this, the smaller size 0.9 MWh of storage will cycle four times a day, resulting in a short expected battery life of approximately seven years. This translates into the need of three battery bank replacements and re-investment in the 20 years analysis. For the next battery size of 1.80, the expected battery life would be approximately 14 years, so it will need two installations. Finally, the last two battery sizes have 1 and 0.5 cycles per day, which results in an expected battery life of more than 20 years (Table 6).
Table 6.
Case 2: Renewable generation, diesel output, and battery performance per storage size.
5.3. Case III: 40% Renewable Penetration
For this case, the connection of the system considers one of the smaller generators of 375 KVA working in parallel with the renewable generation system without requiring the use of a battery bank (Figure 29).
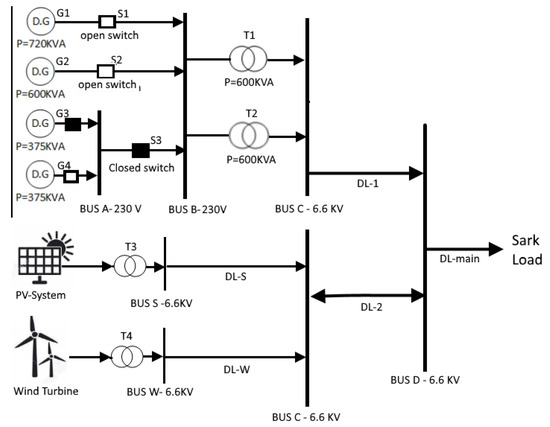
Figure 29.
Case 3. Simplified connection diagram of Sark Island.
In the final case study, the renewable energy system was sized to supply an average 40% of the load with a wind-only renewable generation supply. This assumption is based on the requirement of a minimum constant output of the diesel generator (in this case, 20% of the nominal load) to work under a high efficiency of 92%. Additionally, it can provide ancillary services as a grid stabilization as well as supplying the load when a shortage of renewable energy is present. Furthermore, from the results of case 1 and the load analysis for case 2, a combination of wind and solar generation systems is more suitable for the weather conditions of the island, the estimated consumption, and the energy profile. This is because of the higher demand during cold months, where the wind generation is more stable and solar could aid in the reduction of daytime energy demand peaks. It is important to note that this selection has been purely based on the estimated load profile assumed for the island. Considering the island conditions and the relative price of renewable generation, a trend is revealed toward lower prices for higher energy integration in the system. Thus, a 75% wind integration and 25% solar integration is presented for this case study.
The wind turbine has been sized at 150 kW, generating on average 555.15 MWh/year, and the solar PV at 150 kWp of installed capacity generating 153.84 MWh/year, of which 6% is expected to be lost as over generation (surplus), resulting in a net renewable energy use of 620 MWh/year, this being approximately 39 % of the total energy supply (Figure 30).
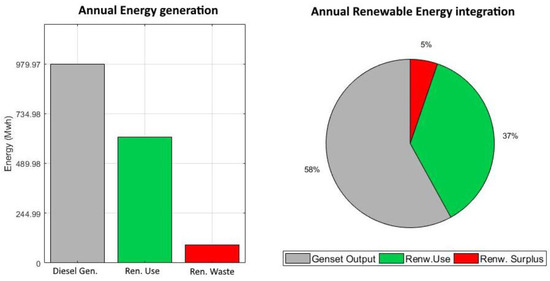
Figure 30.
Annual energy generation and integration.
To assess the generation behavior for the best-case and the worst-case scenarios, a monthly energy balance percentage has been plotted representing the renewable integration for each system and the energy waste (Figure 31 and Figure 32).
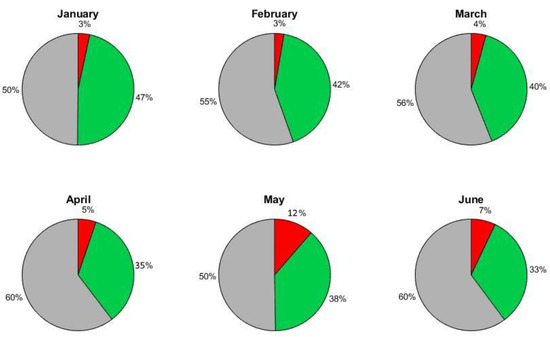
Figure 31.
Case 3: First half of the year energy balance.
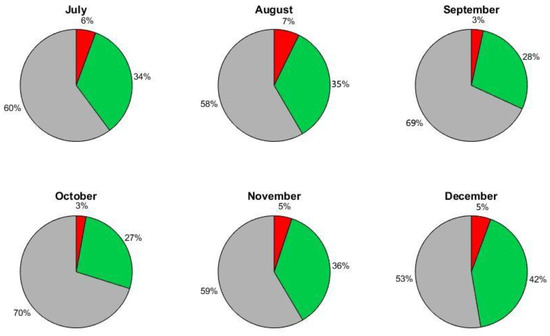
Figure 32.
Case 3: Second half of the year energy balance.
The results show that the worst month for renewable energy generation would be October (with the lowest energy losses). The month with highest generation and energy integration is the month of January. It is important to notice that, even though this month requires more diesel generation, the energy surplus is lower than the month of December due to the increase of the load in the month of January.
For the month of January, the wind speed is fairly stable, with just a couple of day with speeds lower than the cut-in speed of the turbine, thus having a renewable energy output of effectively 0 kW. This has been taken into account, with the diesel generator previously working only at 20 % of its nominal capacity. During the remaining days, the wind generation is enough to supply the load and have an average 3% energy surplus. Another important aspect for this month is the supply of the load by renewable energy generation with an integration of 47% of the consumption. The energy currently wasted in this design could be reduced if the load increases in the following years. Also, the biggest energy surplus occurs in the night hours; this is related to the energy profile estimated for this island, where the biggest consumption peak occurs in the day (Figure 33).
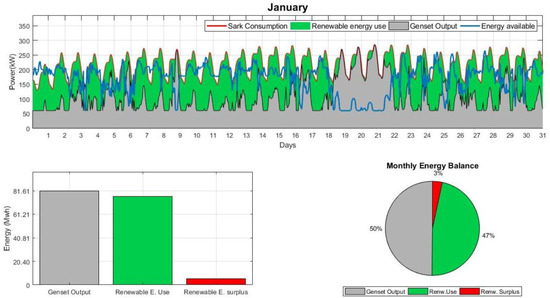
Figure 33.
Case 3: January energy balance.
The month of October has a bigger diesel generation ratio with 78% cover of the load and an almost constant low generation with more than five consecutive days without any generation. A potential solution for this month would be the integration of solar generation, but as explained in previous cases, the sizing of the PV system would have to be oversized to have a significant improvement (Figure 34).
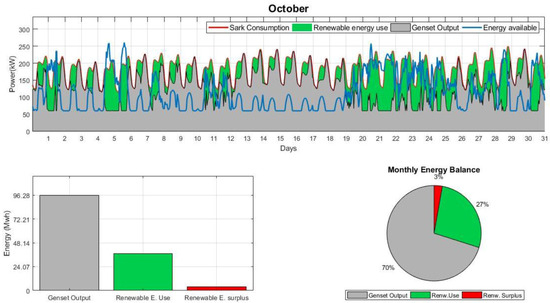
Figure 34.
Case 3: September energy balance.
6. Economical and CO2 Emissions (Section IV of the Methodology)
6.1. Case I: 100% Renewable Penetration
The installation cost for each scenario can be calculated and compared as well as the CO2 emissions (Figure 35).
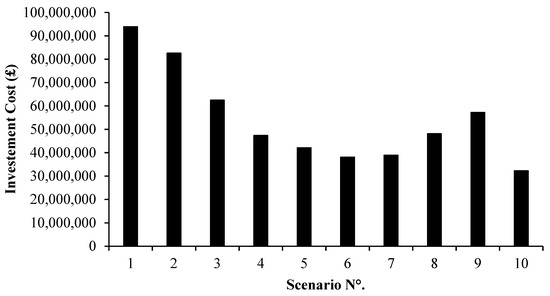
Figure 35.
Case 1: Installation cost and O & M (Operations and Maintenance).
In case 1, the most economical system able to supply 100% renewable energy generation and distribution is scenario 10—installing a 500 kW wind turbine with no solar integration. It is important to note that, in case 6, the second lowest installation cost is the energy balance of approximately 70% wind and 30% solar generation.
For this case study, the results, shown in Figure 36 reveal that the CO2 emissions are almost similar between all the scenarios, with an average of 58 gCO2/ kWh and a maximum deviation of 12% for the output obtained in scenario 9. This is because of the massive size of storage required to supply the load in the summer months.
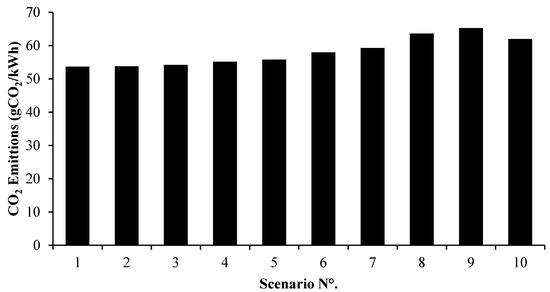
Figure 36.
Case 1: CO2 renewable energy mix emissions.
If we only take into account the cost of installation, the solution would be to install the oversized system in scenario 10, with a 500 kW wind turbine resulting in an annual over generation of 151%. This reduce the battery bank size to the minimum value for this condition due to the positive energy balance throughout the year, as shown in Figure 22.
The battery size to be able to deliver a 100% renewable system with only a combination of PV, wind and battery storage results in the requirement of a battery bank that is both oversized and features extreme rates of discharge during prolonged periods resulting in the battery installation cost being approximately 98% of the total investment. For this reason, in the second case study, the generation system in scenario 6 has been combined with the existing diesel generator on Sark Island to reduce in size the required battery storage. Scenario 6 has been chosen as an initial design point due to the lowest installation cost and the most stable energy balance with the lowest discharge rate period, as shown in Figure 20.
The scenario also allows for comparison of the benefits of a more distributed energy generation between summer and winter, reducing the necessity of over generation.
6.2. Case II: New Battery Sizing
The results in this case reveal that the difference among the installation cost from the smaller system is less than 17% but having the additional difficulty due to the need to change the battery bank every seven years, resulting in an unsuitable system (Figure 37). The installation difficulty due to the additional cost of transportation required has not been contemplated in this comparison. The ideal system solution from the results is a battery size of 3.61 MWh because of the expected storage battery life of 20 years.
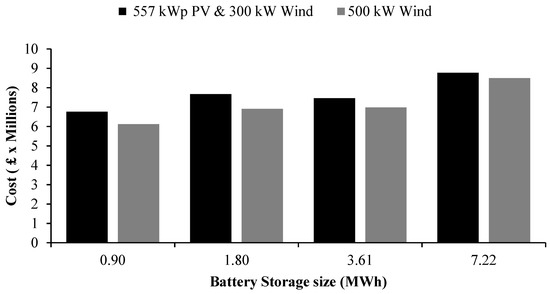
Figure 37.
Case 2: Installation cost for the overall system.
For this case study, the results, shown in Figure 38, reveal that the CO2 emissions are similar between all the scenarios, with an average of 140.1 gCO2/ kWh and a maximum deviation of 22% for the output obtained in scenario 2. This is because of the additional use of the diesel generator compared to the other scenarios.
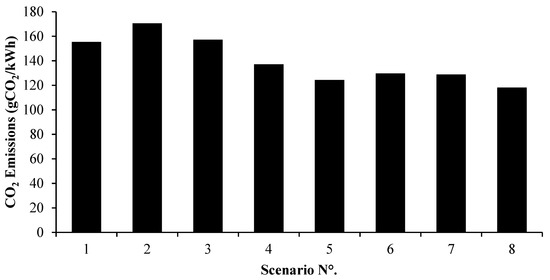
Figure 38.
Case 2: CO2 renewable energy mix emissions.
6.3. Case III: 40% Renewable Penetration
As a final case evaluation, the scenarios with the best performance for each individual case have been assessed in order to compare the different advantages and disadvantages for each solution.
When only evaluating the installation cost, case 1 makes the investment cost extremely high due to the size of the battery bank. Compared with the second case this is more than 10 times the cost. Additionally, the difference in cost for case 2 and case 3 is insignificant when compared to case 1. In order to be able to properly compare the scenarios’ economic feasibility, the cost of O & M in a 20-year analysis was required. From this, it can be shown that the diesel operational cost is going to be around 14 million pounds for 20 years. With a simple analysis, case 1 can be discarded due to high installation cost, while it is assumed that all the diesel running cost will return just 50% of the initial investment. Finally, if the same simplified return on investment is applied to cases 2 and 3, a 100% return of investment is obtained at 5.8 years for case 2 and 2.58 years for case 3.
CO2 emissions for the current energy generation is estimated from the average GHG emission of a diesel generator to around 458 gCO2/kWh. For case 1 a reduction of to 86% can be expected compared to case 2, where the reduction will be of 71%. For the case 3, with the lowest investment cost, a high emission rating is expected due to the continuous use of diesel as the main energy source, reducing just 20% of the actual emissions (Figure 39).
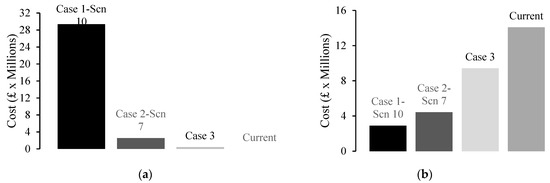
Figure 39.
Case 3: Installation cost comparison (a); Case 3: 20-year O & M (b).
7. Discussion
7.1. Case 1: 100% Renewable Penetration
If only taking into account the cost of installation, the solution would be to install the oversized system in scenario 10, with a 500 kW wind turbine resulting in an annual over generation of 151%. This reduces the battery bank size to the minimum value due to the positive energy balance throughout the year, as shown in Figure 22.
The battery size to be able to deliver a 100% renewable system with only a combination of PV, wind, and battery storage resulting in the requirement of a battery bank that is oversized and with extreme rates of discharge during long periods of time, resulting in the battery installation cost being approximately 98% of the total investment. For this reason, in the second case, it will be combine with the generation system in scenarios 6 and 10 with the help of the diesel generator on Sark Island to reduce in size the required battery storage.
The scenario 6 has also been chosen for the second case study to compare the benefits of a more distributed energy generation between summer and winter and reduce the occurrence of over generation alike in scenario 10. One reason to choose scenario 6 is that is the second with the lowest installation cost and the most stable energy balance with the lowest discharge rate period as shown in Figure 20.
7.2. Case 2: Renewable Energy Generation and Battery—GenSet System
From the results in Table 6, the most optimal renewable energy system generation can be achieved in scenarios with a 500 kW wind turbine due to the similar use of the diesel generator, but having an advantage of more than 73% of energy surplus that can be utilized in the future if the load increases. In addition, scenario 7 has an ideal ratio between cost of installation and expected battery life. To conclude, with CO2 emissions being nearly double those of case 1 results, the emissions are still 70% lower than the actual CO2 emissions level. Scenario 7 has 120 gCO2/kWh, which is 7% lower than the average for this system.
7.3. Case 3: 40% Renewable Penetration
CO2 emissions for the current energy generation is estimated from the average GHG emission of a diesel generator to around 458 gCO2/kWh. For case 1, a reduction of to 86% can be expected. For the Case 2, the reduction will be of 71%. Case 3 has the lowest investment cost and still has a high emission rated due to the continues use of diesel as the main energy source, reducing just 20% of the actual emissions (Figure 40).
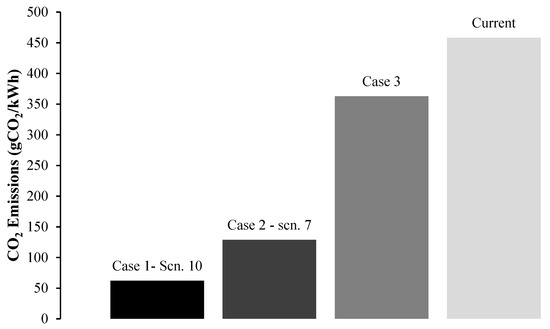
Figure 40.
CO2 emissions.
The current LCOE from the island is 0.66 £/kWh comparing to this which scenarios have the best expected economic performance based on the installation cost, O & M, and the total energy generation (Figure 41). The degradation on energy production for solar PV and wind was taken into account. This gave the following results: case 3 was 30% higher than the actual energy cost, meaning that the electricity will need to be sold at a higher price than the current price in order to generate earnings.
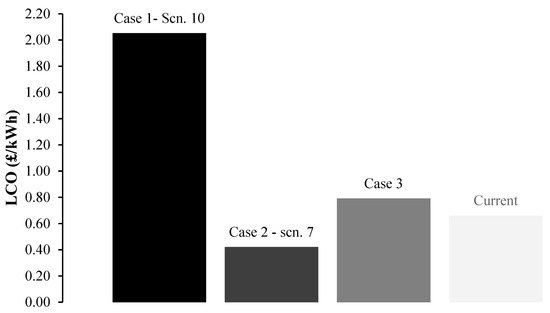
Figure 41.
Lowest levelized cost of energy (LCOE).
Furthermore, the same will occur with the electricity price for the case 1. On the other hand, case 2 shows a reduction of energy production cost of 33% to a minimum value of 0.42 p/kWh. This will enable a reduction of the selling price of the electricity.
8. Conclusions
The main objective for this project was to design an energy system after analyzing different alternatives of renewable energy integration to reduce the current electricity cost to 52 p/kWh from August 2018 to 2019 and then reduce it to a minimum of 49 p/kWh from 2019 to 2020. One of the main requirements at the start of this project was to be able to obtain an annual load profile from the island itself, but after conducting research, we determined that this was not possible due to lack of available data. The annual load has been estimated as an hourly consumption profile for Sark Island, which directly influenced the results of this study by adding currently unknown uncertainty to the calculations. Because of this, the results can vary if real data is obtained and the assumed consumption profile is different. As an example, the load profile selected resembles the behavior of the UK mainland, with peak consumption in winter due to the similar average temperatures in the year, but it was also valid to assume a higher demand in the summer months due to an increase in tourists, just as the NAREC did in their report [19]. This report presents the case for electricity generation for the island, where a mix of solar and wind is used for the worst-case scenario, focusing on the estimated monthly energy consumed. The system sizing was undertaken by oversizing to reduce the risk of not enough energy being available. The method implemented in this research takes this into account and combines the current diesel generators to be able to reduce the uncertainty. By reducing the uncertainty, it has been possible to reduce the size of the solar system by 80% and both the wind turbine capacity and battery size by 50%.
After the data analysis, assumptions and the different sets of results for the installation cost, carbon emissions, and levelized cost of energy, the findings of this study can be summarized as follows.
- Case 1: A purely wind energy generation (500 kW) and an oversized battery bank can obtain the minimum greenhouse gases emissions out of all the cases, with a reduction of 90%, but this requires a high investment cost due to the still elevated price of the battery storage. In this scenario, a battery size of approximately 54 MWH is required. Also, in the 20-year LCOE study, this case results in a 2.1 £/kWh energy cost. This is not suitable as a solution for this island, as the cost of energy would be three times higher than the current price.
- Case 2: In this case, the same wind turbine has been used rated at 500 kW, but with the addition of using the small generator of 375 KVA to charge the battery when renewables are not enough. This enables a drastic reduction of the battery bank to a 3.61 MWh of storage or 12 hours of autonomy of constant discharge. Also, the GHG emissions are 70% lower than the actual CO2 emissions level, with a value of 120 gCO2/kWh. Finally, this case shows the most economical feasible LCOE, with a reduction on the energy production cost of 33% to a minimum value of 0.42 p/kWh.
- Case 3: The final case used a mix of solar and wind to have a more stable energy output during the day, when the peak on the load occurs with a 150 kW wind turbine and 150 kWp solar-PV system, producing 39% of the total annual load—75% comes from wind and 25% from the solar arrangement. This set up ends with an energy surplus of 6%. For this case in particular, the battery storage was eliminated in order to reduce the initial installation cost, and instead, the grid stabilization relies on the diesel generator of 600 KVA working constantly at a minimum base generation of 20% is nominal capacity and supplying the load when the renewable are not enough. This system has a minimum installation cost but elevated O&M and GHG emissions, with a reduction of only 20% on the emissions. Finally, this set up will have a higher cost of energy than the actual by 33%.
After summarizing all the results of this research and as previously explained, the results of this report depend vastly on the assumptions realized at the research and calculation stage. However, the case 2 renewable energy generation system is the most suitable in terms of the reduction of CO2 emissions and expected earnings from a lower LCOE. This study can be re-evaluated if actual data from the island is available, following the same methodology, in order to find the best solution for the island’s current energy generation problem.
As Supplementary Material, a new load profile has been created where the load reaches a peak during the summer, in contrast to the previous assumption where the peak took place in the winter. This is based on the assumption that the large influx of visitors on the island will have an equivalent impact on the electricity consumption. The analysis was re-run to evaluate the results obtained for the new “worst case” scenario profile. This profile is based on the island of Cyprus that in similitude with Sark has a high tourism arrival during summer months thus a higher energy consumption.
9. Further Studies and Suggestions
- Implement data research for the load consumption of the island. With an actual island energy profile, the project could change drastically due to the fact that the energy profiles and times of peak demands dictate which renewable energy is more suitable.
- Install a weather station to monitor the wind speed, solar irradiance and tidal current around the island. An analysis of tidal generation was outside the scope of this study, but with better access to data, this could be integrated into this feasibility study.
- The simplified economical assessment in the study was meant to showcase the difference possible outcome between mixes of different technologies. To have a more accurate economical assessment, an actual cost of the island energy generation will be required.
- Evaluate economic incentives for energy distribution to ensure a stable diesel generation output even when most of the energy is produced by renewables.
- Evaluate the interconnection of the island to produce a more distributed energy system that can stabilize the use of the renewables on the island.
- Include incentives for the installation of renewable energy via government programs.
Supplementary Materials
The following are available online at https://www.mdpi.com/1996-1073/12/24/4722/s1, Figure S1: UK-CY Load comparison, Figure S2: UK-CY Temperature comparison, Figure S3: Annual energy balance under different levels of renewable energy production, Figure S4: Case 1: Scenario 5 instantaneous generation and load variation (top) and energy balance (bottom), Figure S5: Case 1: Scenario 6 instantaneous generation and load variation (top) and energy balance (bottom), Table S1: Case 1: Summary of all energy mix scenarios with estimated battery size comparison with the two different load profiles, Figure S6: Case 1 installation and O & M, Table S2: UK-CY: Case 6 performance evaluation and comparison under different load profiles.
Author Contributions
Conceptualization, S.P. and T.M.; methodology, S.P., S.R. and T.M.; software, S.P., S.R. and T.M.; validation, S.P., S.R. and T.M.; formal analysis, S.P., S.R. and T.M.; investigation, S.P., S.R. and T.M.; resources, S.P., S.R. and T.M.; data curation, S.P., S.R. and T.M; writing—original draft preparation, E.J.G.; writing—review and editing, E.J.G.; visualization, E.J.G.; supervision, E.J.G.
Funding
This research received no external funding.
Conflicts of Interest
The authors declare no conflict of interest.
References
- GOV.UK. 2019. Available online: https://www.gov.uk/guidance/2050-pathways-analysis (accessed on 22 July 2019).
- Frey, B. The SAGE Encyclopedia of Educational Research, Measurement, and Evaluation; SAGE Publications, Inc.: Thousand Oaks, CA, USA, 2018; Volume 1–4. [Google Scholar] [CrossRef]
- White, A. Office of the Sark Electricity Price Control Commissioner Electricity Prices- Price Control Order; Sark: London, UK, 2018. [Google Scholar]
- Dalton, G.J.; Lockington, D.A.; Baldock, T.E. Case study feasibility analysis of renewable energy supply options for small to medium-sized tourist accommodations. Renew. Energy 2009, 34, 1134–1144. [Google Scholar] [CrossRef]
- BBC NEWS. Sark Electricity: Deal Struck for Government Buy out. 2018. Available online: https://www.bbc.com/news/world-europe-guernsey-46397767 (accessed on 13 April 2019).
- Nelson, J.; Gambhir, A.; Ekins-Daukes, N. Solar Power for CO2 Mitigation; Briefing Paper 11; Imperial College London: London, UK; Grantham Institute for Climate Change: London, UK, 2014; Available online: https://www.imperial.ac.uk/media/imperial-college/grantham-institute/public/publications/briefing-papers/Solar-power-for-CO2-mitigation---Grantham-BP-11.pdf (accessed on 13 March 2019).
- Ghenai, C. Life Cycle Analysis of Wind Turbine. In Sustainable Development. Energy, Engineering and Technologies—Manufacturing and Environment; Chaouki, G., Ed.; IntechOpen: London, UK, 2016; ISBN 978-953-51-0165-9. Available online: http://www.intechopen.com/books/sustainable-development-energy-engineering-andtechnologies-manufacturing-and-environment/life-cycle-analysis-of-wind-turbine (accessed on 4 February 2019).
- Jovanovic, S.; Savic, S.; Bojic, M.; Djordjevic, Z.; Nikoli, D. The impact of the mean daily air temperature change on electricity consumption. Energy 2015, 88, 604–609. [Google Scholar] [CrossRef]
- NASA. 2018. Available online: https://power.larc.nasa.gov/data-access-viewer/ (accessed on 13 November 2018).
- Entsoe. Reliable Sustainable Connected. 2019. Available online: https://www.entsoe.eu/data/ (accessed on 13 April 2019).
- Sark Electricity Limited. 2019. Available online: http://www.sarkelectricity.com/ (accessed on 14 April 2019).
- Wind turbine models. 2019. Available online: https://en.wind-turbine-models.com/turbines/1533-atb-riva-calzoni-atb-500.54 (accessed on 19 January 2019).
- McEvoy, A.; Markvart, T. Solar Cells: Materials, Manufacture and Operation, 2nd ed.; McEvoy, A., Castaner, L., Markvart, T., Eds.; Elsevier: Amsterdam, The Netherlands, 2012; p. 600. [Google Scholar]
- Google. 2018. Available online: https://www.google.com/maps/place/55%C2%B057’00.0%22N+3%C2%B012’00.0%22W/@55.9494725,-3.2036368,14.5z/data=!4m5!3m4!1s0x0:0x0!8m2!3d55.95!4d-3.2 (accessed on 25 November 2018).
- Muneer, T. Solar Radiation and Daylight Models, 2nd ed.; Elsevier: Amsterdam, The Netherlands, 2004. [Google Scholar]
- ASHRAE. Refrigerating and Air-Conditioning Engineers. In Handbook of Fundamentals; American Society of Heating: New York, NY, USA, 1997. [Google Scholar]
- GOV.UK. Chapter 6 Renewable Sources of Energy; GOV.UK: London, UK, 2018.
- Autarsys Latge ESS. 2017. Available online: https://www.autarsys.com/products/product/large-ess/ (accessed on 19 January 2019).
- Narec Distributed Energy. Sark Electricity Review–Island Grid with Wind, Solar and Batteries; Office of the Sark Electricity Price Control Commissioner: London, UK, 2018; Available online: http://www.epc.sark.gg/assets/narec_island_system.pdf (accessed on 18 February 2019).
© 2019 by the authors. Licensee MDPI, Basel, Switzerland. This article is an open access article distributed under the terms and conditions of the Creative Commons Attribution (CC BY) license (http://creativecommons.org/licenses/by/4.0/).