Abstract
Although several research studies have adopted specific energy consumption (SEC) as an indicator of the progress of improved energy efficiency, publications are scarce on critical assessments when using SEC. Given the increasing importance of monitoring improved industrial energy efficiency and the rising popularity of SEC as an energy key performance indicator (e-KPI), an in-depth analysis and problematization on the pros and cons of using SEC would appear to be needed. The aim of this article is to analyse SEC critically in relation to industrial energy efficiency. By using SEC in the pulp and paper industry as an example, the results of this exploratory study show that although SEC is often used as an e-KPI in industry, the comparison is not always straightforward. Challenges emanate from a lack of information about how SEC is calculated. It is likely that SEC is an optimal e-KPI within the same study, when all deployed SECs are calculated in the same way, and with the same underlying assumptions. However, before comparing SEC with other studies, it is recommended that the assumptions on which calculations are based should be scrutinized in order to ensure the validity of the comparisons. The paper remains an important contribution in addition to the available handbooks.
Highlights
- SEC is based on assumptions.
- Assumptions for SEC calculations are rarely given.
- SEC is used optimally for comparison when SEC calculations are uniform.
- SEC is most reliable when calculated within the same study using continuous process data.
- SEC emanating from a variety of individual case studies should be used with caution.
1. Introduction
In order to reach the goal of reducing greenhouse gas (GHG) emissions by 80–95% by 2050 compared to 1990 levels, industry has to improve its energy efficiency [1]. Improving energy efficiency is considered to be the most promising measure to mitigate climate change [2]. The global industrial sector accounted for ~42.8 EWh (~154 EJ) in 2014, of which Organization for Economic Co-operation and Development (OECD) countries accounted for 69% (~29.5 EWh) of the global industrial energy end-use [3]. In this context, energy management is of great importance as it aims to reduce companies’ energy use and associated energy costs continuously [4].
As energy management is an important means by which to improve energy efficiency, the use of specific energy consumption (SEC) to identify potential improvements in energy efficiency is seen as an important instrument of energy management. Frequently, in both literature and international standards, SEC is used as an energy performance indicator to evaluate or measure the performance of energy efficiency. For example, Peng et al. [5] used SEC to evaluate changes in energy efficiency in the Chinese pulp and paper industry (PPI) over the period between 1985 and 2010, and Lawrence et al. [6] used SEC to investigate the possible effects of firm characteristics on energy efficiency in the PPI in Sweden. Furthermore, Fleiter et al. [7] used SEC to study energy efficiency in the German PPI and to assess the potential for energy savings, while Farla et al. [8] used SEC to portray changes in energy efficiency in the PPI. SEC is also used for benchmarking, although some concerns about SEC usage in benchmarking have been raised. Although the European standard on energy efficiency benchmarking (16231:2012) [9] provides the methodology needed for collecting and analysing energy data for energy efficiency benchmarking, the standard barely problematizes the challenges involved in using SEC for this purpose. For instance, Farla et al. [8] pointed out that “using the SECs from one country in a cross-country analysis may lead to distortions if the SECs for some of the products are relatively high (due to inefficient processes)” ([8], p. 748). Another example is found in Laurijssen et al. [10], where the authors used SEC to benchmark energy use at process unit level in the paper industry. Additionally, SEC can be used indirectly as in e.g., a study by Phylipsen et al. [11], where SEC was used to calculate an energy efficiency index (EEI), i.e., the ratio between the actual SEC and the reference SEC to explore the impact when the best available technologies (BATs) are used.
Despite the widespread use of SEC as an indicator for energy efficiency, critical scientific papers on SEC seem—in the authors’ opinion—to be almost lacking. Three exceptions are an in-depth review on energy efficiency including SEC written by Patterson [12] and methodologies for international comparisons of energy efficiency by Phylipsen et al. [13], both published more than two decades ago, and a recent study addressing industrial energy benchmarking in the PPI by Rogers et al. [14]. In summary, although several research studies have adopted SEC as an indicator for the progress of improved energy efficiency, publications on critical assessments when using SEC are scarce. But at the same time, the international standard on energy management systems (ISO 50006:2017) [15] provides general principles and guidance on how a company can establish energy performance indicators and energy baselines for measuring its energy performance. Given the increasing importance of monitoring improved industrial energy efficiency and the rising popularity of SEC as an energy key performance indicator (e-KPI), an in-depth analysis and problematization of the pros and cons of using SEC would appear to be needed. The aim of this article is to critically analyse SEC in relation to industrial energy efficiency.
2. Background
The variable characterizing energy use per produced product and expressed as a ratio of thermodynamic units per physical unit is often referred to in literature as specific energy consumption (e.g., [8,12,16]). The meaning of SEC is to portray how much energy is used for producing a unit of product. SEC is perhaps used due its convenience, i.e., the amount of energy can be directly reported per amount of product. Generally, SEC is calculated by dividing the amount of energy used with the amount of products. However, both, products and energy carriers are often chosen arbitrarily depending on the intended purpose of using SEC. For example, SEC can be calculated for the total amount of products or for individual products from the product mix. Similarly, SEC can be calculated for the total primary energy used or for specific energy carriers, e.g., how much electricity and heat separately has been used for producing a unit of product. SEC in international standards, such as e.g., ISO 50006:2017 [17], is recommended for being used as an energy performance indicator, since SEC allows measurement of the energy performance and thus the performance of benchmarking. Benchmarking of energy use in industry is the process of comparing and evaluating energy performance, where SEC can be used for benchmarking at various levels: process, site, national and international benchmarking as in e.g., study by Andersson et al. [18]. Data for rough calculations of SEC is sometimes publicly available in larger companies’ annual sustainability reports. Despite the convenience of using SEC, several challenges have been pointed out in the literature (Table 1). Some solutions have also been presented. For example, Phylipsen et al. [11] use ratios between the actual SEC and the sector-specific reference SEC—the energy efficiency index.

Table 1.
Examples of difficulties that have been cited in some of the references using specific energy consumption (SEC). DC—Developing countries.
Additionally, there are general aspects affecting the SEC. The age of equipment and the plant itself are some of the aspects that can affect SEC. For example, although newer equipment tends to be more energy-efficient compared to older equipment, it can take a few years to optimize the new equipment after installing it [20]. The location of the plant can also have an effect on SEC, i.e., environmental conditions affect heat demand [20]. Additionally, the size of the plant, for example the width of the paper machine [20] and the production rate ([20,21]), are also variables that affect SEC.
Some of the challenges regarding SEC are also faced by other energy use related fields, e.g., when calculating energy returned on energy invested (EROI) (e.g., [22,23,24,25,26,27]).
Regarding benchmarking, different levels of analysis require different amounts of data. Generally, the more detailed benchmarking is, the more data is required [28]. SEC is one of the methods used for energy benchmarking at multi-national level, national/regional level, site level and process level, where SEC has been used most frequently in benchmarking studies at process level according to the results presented by Andersson et al. [18]. Further, the current average SEC is the preferred indicator for information about energy efficiency at regional or country level, provided that adequate data is available (according to [19]).
3. Data and Methods
This article was inspired by the authors’ own experiences of using SEC to research industrial energy efficiency and can, therefore, be said to be explorative in nature. Specifically, this article was inspired by experiences while studying SEC to research industrial energy efficiency and factors tending to affect the energy efficiency as well as by research addressing energy management and energy efficiency, where SEC is commonly used as an e-KPI. Examples of how many and what type of companies that have been studied in the PPI are 48 pulp and paper mills in Sweden 2006–2015 [6] and 40 pulp and paper mills in Sweden [29]. Examples of other industrial companies that have been studied are 27 foundries in Sweden [30], 65 foundries in Europe ([31,32]), 23 iron and steel mills in Sweden [33], 21 industrial companies in Sweden [34], 11 sawmills [18], and 8 manufacturing firms in Sweden [35]. A database containing data about the use of individual energy carriers and individual pulp and paper products by individual PPI mills in Sweden since 2002 is used, among others studying SEC, for [6]. The rest of the named studies were conducted by collecting data by questionnaires and/or interviews as well as complementing by data from databases in some studies.
The results are based on a literature search using Linköping University Library’s literature search system—UniSearch—that was described in detail in Lawrence et al. [36]. UniSearch contains publications that also available through the Web of Science, Scopus, ScienceDirect, etc. In brief, SEC was searched for within those studies that primarily addressed energy management in the pulp and paper industry. Additionally, the snowball method was applied, whereby e.g., publications that referred to other studies using SEC were also included. The literature search was limited to English-language, peer-reviewed, full-text literature accessible via UniSearch in November 2018. In addition to the scientific review, several standards were reviewed in relation to the meaning and usage of SEC as an energy performance indicator: SS-ISO 50001:2011 (energy management systems [15]), SS-ISO 50006:2017 (energy management systems—measuring energy performance using energy baselines (EnB) and energy performance indicators (EnPI) [17]), SS 16212:2012 (energy efficiency and savings calculations, top-down and bottom-up methods [37]) and SS 16231:2012 (energy efficiency benchmarking methodology [9]).
SEC in the PPI has been used as an example to illustrate the differences in SEC. The PPI was chosen as an example because it is one of the five most energy-intensive industries globally [3]. In fact, the PPI may account for as much as 5.6% of the global industrial energy end-use [3]. With today’s attempts to achieve a sustainable circular economy, and given the renewable nature of the resources for production, pulp and paper production is likely to increase. Additionally, the PPI is facing challenges in terms of remaining competitive, where the energy efficiency improvement is seen as one of the most effective strategies for remaining competitive in some countries (e.g., [38]).
In this study, when needed, primary energy factors (PEFs) and SEC were calculated by dividing the sum of gross electricity produced plus imported/exported electricity, by net electricity used in the country (e.g., [6]). If the SEC in the references was given in units other than the GWh/kt, then the units were converted. Additionally, when the use of energy carriers was given in the references, e.g., use of electricity and heat, then the usage of the primary energy was calculated by using 2.5 as the PEF. PEF of 2.5 means that the generating efficiency for final energy carrier is 40% and implies that 2.5 units of primary energy carriers generate 1 unit of final energy carrier, e.g., electricity. In this study we presented PEF, therefore, if final energy generating efficiency was presented in a reference, such as that the efficiency for generating electricity was 40% in ref. [8], it was recalculated to PEF. In cases where the total energy used was already presented in the references without specifying the PEF used to calculate it, not specified (n.s.) is noted.
4. Results and Discussion
4.1. The Meaning of Specific Energy Consumption (SEC)
SEC is a widespread term used by international energy agencies, e.g., [3], and in research studies, e.g., [38]. Nevertheless, energy can only be converted from one form to another or transferred among systems, and cannot be destroyed or created ([39,40]). According to the first law of thermodynamics: “Although energy assumes many forms, the total quantity of energy is constant, and when energy disappears in one form it appears simultaneously in other forms” ([39], p. 22). Thus, energy cannot be “consumed” as such. It is the exergy, i.e., the measure of the quality and quantity of energy, that is available for use [40]. However, exergy is rarely, if at all, mentioned in the literature addressing energy management and using SEC. Instead, the same variable expressed in thermodynamic units per physical units is most often referred to as specific energy consumption. The wording of the term can be misinterpreted, because it is the exergy that is used during the process—the part of the energy that is available to be used for work. Some studies refer to the same term as “typical energy demand”, e.g., power demand and heat demand per paper grade [38] or SEC—specific energy demand [41]. In conclusion, it would be better to use the thermodynamically correct names, i.e., specific exergy consumption or specific energy use. Nevertheless, although specific exergy consumption and specific energy use are thermodynamically correct, it could be possible in theory that the change of names could cause some unforeseen/unintended challenges.
4.2. Calculations of SEC
Generally (e.g., [8]), SEC is calculated as a ratio of energy used for producing a product:
Units are seemingly chosen arbitrarily depending on the intended usage of SEC, e.g., GJ/t for heat (e.g., [10]), and GWh/kt for electricity (e.g., [6]). When calculating the total energy, including electricity and heat, units are also chosen arbitrarily depending on the purpose of the study. For example, GJ/tonne as in e.g., [8,10], while Lawrence et al. [6] used GWh/kt because some of the large companies also used GWh/kt for their SEC in their annual reports (e.g., [42,43]).
Calculation of SEC as presented in the Equation (1) is generic, meaning that generally SEC is calculated as a ratio between the energy used and a unit of product. However, Equation (1) can be modified if needed for specifying the type of energy carriers and/or product. For example, Farla et al. [8] calculated SEC for one single individual product for one single individual process as:
In Equation (2), Ex—the energy use of the single individual manufacturing process x and Px—physical unit of a single individual product x. Meanwhile aggregated SEC (SECagg) for a group of products, e.g., for a sector, can be calculated as a ratio of the sum of all the energy used with the sum of all the products produced, providing the production output has the same composition during the time that is to be compared [8]:
In Equation (3), ∑E—sum of all the energy used and ∑P—sum of physical units of all products. Following the principles of Equations (1)–(3), in order to evaluate the usage of individual energy carriers for individual products or a sum of products the individual energy carriers can be used instead. For instance De Beer et al. [16] calculated SEC for electricity and SEC for heat. Furthermore, Laurijssen et al. [10], calculated specific primary energy use by a process unit:
In Equation (4), Epr—the total annual primary energy used by a process unit and P—the annual amount of products processed by the specific process unit.
Generally, energy use is related to weight units of an air-dried product, which is assumed to consist of 90% oven-dry pulp and 10% water content, even if the actual conditions vary in different environments [44]. The majority of the studies that have used SEC neither mentioned anything about the moisture content nor correction for the moisture content. The exception was a study at process level presented by Laurijssen et al. [10] that the SEC values for sections pre- and after drying were showed in units of absolute dry end product not in units of absolute dry product that was processed for comparing the two dryers.
Calculations of both of the variables “energy” and “product” are based on assumptions. Roughly speaking, the variable “product” relies on several assumptions. One of the assumptions regards the definition of “product”—is it product sold, i.e., all the produced products minus the products of inadequate quality that could not be sold, or is it all the products produced including the products of inadequate quality to be sold? For example, during the production of paper, e.g., when changing from the production of one paper grade to another or when a paper web breaks, some paper that was produced can be classified as internal waste due to inadequate quality [10]. The internal waste can be re-pulped, which could eliminate or minimize material waste. Nevertheless, the energy that was used for the production of paper of inadequate quality has been wasted [10]. Another example is assumptions originating from the challenges involved in dealing with partitioning of the products, i.e., joint production could cause difficulties in allocating how much energy was required for one specific product [12]. It is possible that this problem can be overcome by individual factories having access to e.g., continuous data, however such data is rarely—if ever—all available to external parties [12].
Furthermore, uncertainties in energy use because of variations in the analysed system boundaries can also be a challenge. For example, when benchmarking at process level, uncertainty can originate from a lack of clarity about whether only the energy used by the main equipment is included in the analyses. According to Laurijssen et al. [10], it is often the case that only the energy used by the main equipment is included and that used by auxiliary equipment is excluded, even though the auxiliary equipment (e.g., pumps, peripheral systems for water) also uses energy and is needed in production. For example, >50% of the electricity used for drying pulp can be used for pumping [20]. Furthermore, according to Thollander et al. [45], the primary energy use is a function of the sum of the production processes and the product-dependent support processes’ energy use per product multiplied by the number of products, plus the support processes’ energy use. This ax + b function also tells us that the primary energy use is a function of the number of products, but also consists of a base load. This function differs tremendously between different types of companies, where for example a non-energy intensive mechanical engineering company may have support process-related base load energy use of 70–80% on an annual basis, while the same figure for an energy-intensive pulp mill might be few percent in comparison to the energy used, depending on production. Consequently, differences in how to set system boundaries can make the benchmarking of similar processes between different studies challenging. The studied system boundaries for calculating SEC varied substantially in the studies presented in Tables. Generally, the precision of the boundary description tended to increase the more detailed the intended benchmarking by using SEC such as in benchmarking at process level. Namely, detailed descriptions were common while studying SEC at process level, as in e.g., refs. [10] or [7], whereas for national and international comparison general description such as e.g., PPI in the country when studying SEC at national level without mentioning whether energy was used for not directly production-related processes such as support processes e.g., [6,46].
Regarding the total amount of energy, uncertainty comes from using energy from non-primary energy carriers, such as electricity. Since electricity is not a primary energy source, in order to calculate the total energy used, the amount of electricity needs to be multiplied by the primary energy factor (PEF). For example, the fixed PEF in Europe is 2.5 and emanates from the European Energy Efficiency Directive [47]. Using fixed PEF is convenient, but actual PEFs are directly related to country- and year-specific conditions which can deviate from the fixed PEF. This is due to the fact that PEFs tend to vary over time depending on the mix of energy carriers that were used to produce electricity specifically for individual countries. Using the fixed PEF has been criticized by e.g., [47]. PEF converts the usage of non-primary energy carriers such as electricity to the usage of primary energy carriers. PEF is the ratio of primary energy use with the final energy use [48], and can be shown as in [45]. In Sweden, for example, the annual gross electricity, which is a non-primary energy carrier, production was calculated as the sum of annual electricity production from e.g., hydropower, nuclear power and imported electricity, minus exported electricity, and then divided by the net electricity used by all sectors in the country [6]. Calculations for the Swedish example were conducted using the Swedish Energy Agency’s data [49]. PEF results for Sweden are presented in Table 2, and show that the PEF for Sweden was lower than the fixed PEF in Europe (2.5) over the period from 2002 to 2015, i.e., 1.61–1.95 (Table 2).
Table 2.
Primary energy factor (PEF) for Sweden over the period from 2002 to 2015.
Hence, PEFs also differ among individual countries, e.g., according to Wilby et al. [47], the PEF is 3.4 for France, 1.4 for Norway and 2.9 for Poland. Differences in SEC between countries contribute to further uncertainties in regard to calculating SEC. If the exact assumptions and calculations are not presented when comparing studies from different countries, SECs need to be recalculated uniformly.
Even though it is possible that in some cases energy carriers with PEF of 1 can be used, the knowledge of how PEF affects SEC is important when comparing the SEC with that from studies with PEF of energy carriers not equal to 1. For instance, when evaluating changes in SEC over time that includes time with PEF for not all energy carriers being equal to 1.
For example, the average PEF for Sweden over the period 2002–2015 is 1.78, which makes the fixed PEF of 2.5 about 1.4 times higher. When the same data is used to calculate SEC for the total energy, the results show that the fixed PEF of 2.5 gives ~11% higher SEC for total energy for pulp mills and ~15% higher SEC for total energy for paper mills (Table 3).
Table 3.
Specific individual energy carriers’ use and specific total energy use, calculated using PEF 1.78 and 2.5. Specific individual energy carriers’ use has been calculated from Farahani et al. [50].
In summary, PEF differs, whereby a difference of 1.4 for one non-primary energy carrier can alone lead to ~11–15% difference in SEC. Therefore, it is recommended to describe what PEF have been used and how the PEF were calculated as well as to scrutinize what PEF in other studies were used for assuring the validity of the comparisons among SEC from different studies and for correctly evaluating sources for variation of SEC.
4.3. SEC in International Standards
ISO 50001:2011 (standard on energy management systems—requirements with guidance for use [15]) specifies that an organization should identify the relevant energy performance indicators for monitoring and measuring its own energy performance, and that those indicators should be reviewed and compared to the appropriate energy baseline. Organizations shall establish, implement and maintain energy objectives and targets, as well as appropriate timeframes for their achievement, considering all the legal requirements, significant energy uses and opportunities for improving energy performance as identified in the energy review [15].
ISO 50006:2017 [17] provides instructions on how energy performance indicators (EnPIs) and energy baselines (EnBs) are established, used and maintained in the process of measuring energy performance within an organization, and how to determine whether the energy performance meets the targets set by the organization. Energy performance is understood as the “measurable results related to energy efficiency, energy use” [17]. When establishing EnPIs, different characteristics of the energy use, such as base load (e.g., fixed energy use) and variable loads, affected by production, occupancy, weather and other factors, should be taken into consideration. The energy performance can be influenced by different variables (weather conditions, production parameters, operating hours and operating parameters) and by static factors connected to changing business conditions such as market demand, sales and profitability. The relevant variables that can influence the energy performance should be defined, quantified and isolated in terms of significance (ranging from no influence or little influence to significant). The organization sets quantitative references, meaning EnBs for each EnPIs in order to compare EnPIs values over time and to quantify the changes in energy performance. The results of energy performance can be expressed in SEC (e.g., kWh/unit), and when multiple forms of energy are used, conversion to a common unit of measure should be performed in such a way that the conversion process includes the total energy used and the losses. When comparing energy performance results, it is recommended that the EnPI and its corresponding EnBs are normalized by modifying the energy data so that the changes in relevant variables which affect energy performance are considered and the comparison is carried out under equivalent conditions [17].
According to SS-EN 16231:2012 (standard [9] on energy efficiency benchmarking methodology), when aiming to evaluate and compare performance between or within different entities, the performance data of comparable activities should be collected and analysed. This is basically the process of benchmarking, and different types exist, from internal benchmarking, which involves a comparison of energy performance at different locations within the same organization, to external benchmarking, which can be used to establish a series of EnPIs for either an installation or a product, within the same sector. Benchmarking boundaries should be clearly defined and limited to the process installation, facility, product, building or organization in such a way that the correction factors (e.g., weather conditions, product or service and associated technology, production level and quality of feed stock used) will be applied as little as possible. In energy efficiency benchmarking, the energy use of processes with the same output is assessed, and comparability of processes can be achieved in exceptional cases by the use of correction factors, i.e., well-defined adjustments of the SEC. In energy efficiency benchmarking, SEC is used as an indicator of energy use per (physical) unit of output, and the output can be a product, an activity or a service, e.g., GWh per kt of paper, GJ per tonne of steel, annual kWh per m2, or kWh per full-time employee [9].
SS-EN 16212:2012 (standard [37] on energy efficiency and savings calculations, top-down and bottom-up methods) also defines SEC as the energy use per physical unit of output, and describes it at subsector level and relates the annual energy use to annual physical production. It connects the total energy use to the number of systems, in this case the equivalent of mean yearly energy use per system, e.g., GWh per kt of paper, GJ per tonne of steel, kWh per m2 of dwelling, kWh per refrigerator or L/100 km for vehicles. The change in SEC value over time is used as an energy efficiency indicator for top-down energy savings calculations, as it relates the energy use to a physical output or to the number of systems using energy.
When carrying out a top-down savings calculation, energy indicators will be selected and used. The choice of energy savings indicators starts with the definition of energy savings, which is dependent on the types of drivers (economic, technical or behavioural factors) behind the changes in energy use. When technical efficiency is assessed, SEC per physical unit is calculated. The steps for performing a general calculation of top-down energy savings are: definition of indicator types, calculation of indicator values and calculation of energy savings per indicator. Examples of SEC usage as indicators for these calculations are: (i) SEC at sub-sector level, which relates energy use to physical production (e.g., GWh/kt paper, MJ/tonne of steel, etc.) for a given period, usually a year; and (ii) SEC for energy using systems, which relates total energy use for specific systems to the number or size of systems. The annual energy use may be normalized, meaning that it can be corrected for yearly deviations from average climate that influence energy use and include heating and space cooling.
The value for SEC indicators is calculated using the formula below, where the normalized energy use (NEC) is divided by the driver quantity (DV) for the year t [37]:
where IND is indicator value, NEC is normalized energy use, DV is quantity for driver and t is year of evaluation.
The change in SEC indicator value is calculated as follows [37]:
where CIND is change in indicator value, IND is indicator value, t0 is base year and t is year of evaluation.
The energy savings per indicator are calculated as the change in indicator value multiplied by the driver quantity in the year of evaluation, as in the formula below [37]:
where ESPI is energy savings per indicator, IND is indicator value, DV is quantity for driver, t0 is base year and t is year of evaluation.
When calculating energy savings for the industrial sector, SEC for energy-intensive industries is calculated as follows [37]:
As can be seen, SEC is presented and recommended as an energy performance indicator for energy efficiency and the formula presented is basically the same in all the reviewed standards. Practical guidance on the usage of SEC is presented, but more analysis on the challenges and usage of SEC is required. The calculations of SEC in the reviewed articles comply with the calculations recommended by the international standards. Additionally, the studies using SEC confirm that the usage of SEC also complies with the requirement to measure energy efficiency.
4.4. SEC Usage for Benchmarking
In summary, according to the literature (e.g., [28,51]), the relationship between the amount of data and the precision of the identification for improvements can be as illustrated in Figure 1. In other words, the more disaggregated the level of benchmarking is, the more data is required [28]. For example, international benchmarking can be used to identify the potential for improved energy efficiency, but cannot specify where exactly the energy efficiency improvement measures can be found [51]. However, benchmarking at process level could identify such energy saving opportunities [51]. Notably, international benchmarking is generally challenging due to differences between the sectors, economic structure of the countries, etc. ([11,28]). In agreement, the reviewed studies confirmed that the more disaggregated the level such as e.g., process level, the more precision was required and given (e.g., [7,10,16]), whereas the more aggregated the level of benchmarking, the lower the precision (e.g., [6]). Some studies addressed one levels of benchmarking within their study (e.g., with the same study, e.g., [7,10,16]), whereas some of the other studies using SEC performed benchmarking at several levels within the same study (e.g., [52]).
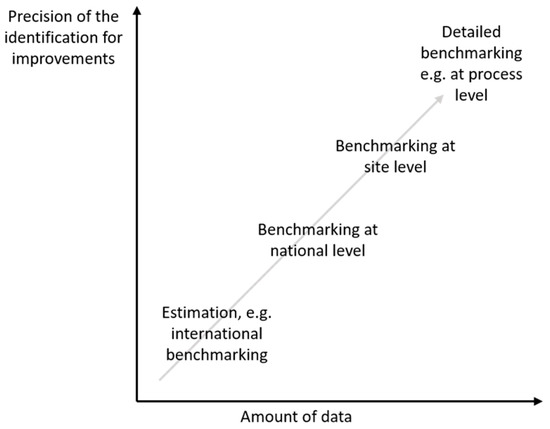
Figure 1.
Trend in the relationship between the amount of data and the precision of identification for improvements according to literature (e.g., [28,51]).
Additionally, due to the uncertainties that can originate from the usage of different PEFs, more uncertainties when benchmarking at international level come from data on a highly aggregated level, such as when applying the total annual energy used without further explanations and specifications (see e.g., Table 1). For example, SEC can be higher or lower for an entire PPI depending on the dominant type of the mill, i.e., pulp mills, paper mills, integrated pulp and paper mills, etc. The types of products that the various mills produce can also affect SEC. The decision on whether to use only direct process data or to include other data, e.g., energy used for waste water treatment, support processes, etc., also influences SEC. Examples of SEC are presented in Table 4.
Table 4.
Examples of SEC for the pulp and paper industry (PPI). “n.s.” means that the PEF was not specified in the references and was therefore recalculated as presented in Section 3.
When comparing the results from other studies, it is not always clear what a certain SEC covers de facto depending on the choice of wording. For example, “pulping” is used to describe the process used “to free fibres in wood from lignin that binds these fibres together, and then to suspend the fibres in water into a slurry suitable for paper making” ([56], p. 14). For example, the SEC of “pulping chemical” is 1.48 GWh/kt in [54] and probably refers only to the pulping process according to the definition above by Kramer et al. [56]. However, in some references “pulping” is more likely to be used to describe pulp making including all processes that were used to produce pulp, judging by the SEC values. Namely, the SECs for BAT for “chemical pulping” amount to 4.85 GWh/kt and 4.84 GWh/kt in [57], and are in line with SEC values for “chemical pulp total”, 4.47–5.10 GWh/kt, in [7] and “chemical wood pulp”, 4.53 GWh/kt, in [8] (Table A1 and Table A2 in Appendix A).
Examples of SEC for various paper grades are presented in Table A3 in Appendix A, and SEC for various processes during paper production is presented in Table A4 in Appendix A. SEC for paper grades under the same or similar names, e.g., newsprint, seems to vary more than could be accounted for by using different PEFs. For example, SEC for newsprint varies from 1.44 to 2.55 GWh/kt, making the comparison between SEC from different studies challenging.
5. Analysis and Proposed Improvements When Using SEC
Despite the frequent use of SEC when benchmarking and working towards improving energy efficiency, clear and detailed descriptions of the assumptions that the SEC calculations are based on seem to be lacking in both scientific literature and international standards. Therefore, based on the review of scientific publications and standards addressing and using SEC, the following important improvements are proposed to improve the reliability and comparability of SEC:
- Define system boundaries. For example, describe whether energy use by auxiliary systems, wastewater treatment facilities, support systems, in situ transport, etc. were included.
- Describe all the assumptions and calculations for calculating the amount of energy used. For example, how the PEFs were calculated and what data was used.
- Define the products and assumptions for calculating the amounts of products. For example, are the products everything that was produced or only the products that were sold? Present assumptions and calculations for calculating amounts of products when partitioning of products was present.
- When comparing with SECs from other studies, beware of the possible effects due to the differences in assumptions, calculations and other relevant issues, e.g., environmental effects.
6. Conclusions
The importance of being able to monitor the progress of industrial energy efficiency cannot be understated. With the aim of critically analysing SEC in relation to industrial energy efficiency, some conclusions could be drawn from this study:
- SEC is affected by several factors (Figure 2).
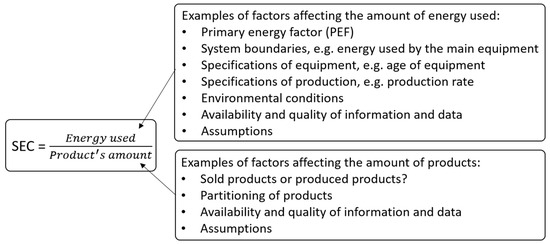 Figure 2. Examples of factors affecting the numbers for energy used and products, and therefore SEC.
 - SEC is of greater use if longitudinal benchmarking, i.e., the same company, sector or country, over time, is undertaken.
- If using SEC for benchmarking between companies, sectors, or countries, extreme caution is required in order to benchmark correctly.
- The reviewed standards in this paper provide useful general guidance on the use of SEC as an indicator for energy efficiency, but do not provide a reader with sufficient details of the full range of challenges when using SEC. Hence, more support is needed in this respect, to support both researchers and industry practitioners. Since there is a gap in both research and international standards in the usage and challenges of SEC, a plan for further use of SEC together with monitoring activities is needed.
- The difference in the primary energy factor (PEF) can influence SEC calculations significantly.
- SEC is a more optimal e-KPI within the same study, when all deployed SECs are calculated in the same way, and with the same underlying assumptions.
- We suggest that specific exergy consumption with the abbreviation SEC would be a more correct term than specific energy consumption. Alternatively, specific energy use could be used.
- Prior to the use of SECs from other studies, it is recommended that the factors affecting the production of the products, calculations and assumptions on which these calculations were based should be scrutinized critically to ensure the reliability of the comparisons.
- SEC is a convenient and easy-to-use energy efficiency indicator with the potential for use in various benchmarking applications, provided that it is calculated with adequate assumptions and calculations to ensure its reliability.
- Further quantitative analyses are recommended on SEC from various studies for studying the underlying tendencies and relationships among the factors affecting SEC, e.g., the time trends, extent of studies, levels of benchmarking, etc.
- We recommend to be clear about the assumptions and calculations when calculating SEC and applying SEC from other studies for enabling evaluation whether the possible difference in SEC is not just caused by the differences in the underlying assumptions when calculating SEC alone. Specifically, it is recommended to consider:
- ○
- Origin, availability and quality of information and data that was used for calculating SEC.
- ○
- That system boundaries are as precise as possible, e.g., energy used by the main equipment and/or auxiliary equipment used in production and/or parts of it.
- ○
- The conversion of non-primary energy carriers to primary energy carriers, e.g., the PEF used.
- ○
- The calculation of energy use and the number of products for individual products in cases when partitioning of products is present.
- ○
- Whether sold products or produced products used for the calculations.
- ○
- Other factors that may influence SEC such as specifications of equipment, e.g., age of equipment, specifications of production, e.g., production rate, and environmental conditions.
Author Contributions
All the parts of the manuscript were discussed among all the authors. A.L. was the main author and wrote all the parts except the one about SEC in international energy management systems, which was mainly written by M.A.
Funding
This research was funded by the Swedish Energy Agency, research project number 40537-1, the Swedish Environmental Protection Agency, Carbonstruct research project, project number 802-0082-17, and the Division of Energy Systems at the Department of Management and Engineering, Linköping University.
Acknowledgments
Authors thank the anonymous reviewers for the comments.
Conflicts of Interest
The authors declare no conflict of interest.
Appendix A
Table A1.
Examples of SEC for various pulps listed alphabetically. BAT—Best available technology. BAU—Business as usual. OECD—Countries that are members of the Organisation for Economic Co-operation and Development.
Table A1.
Examples of SEC for various pulps listed alphabetically. BAT—Best available technology. BAU—Business as usual. OECD—Countries that are members of the Organisation for Economic Co-operation and Development.
| Energy Used by | Total Energy (GWh/kt) | PEF | Region | Reference | Year | Source for SEC |
|---|---|---|---|---|---|---|
| Chemical pulp mill | ||||||
| Chemical pulp, total | 5.10 | 2.50 | Germany | [7] | 2011 | Calculated using data in literature |
| Chemical pulp, total | 5.10 | 2.50 | Germany | [7] | 2007 | Calculated using data in literature |
| Chemical pulp, total | 5.10 | 2.50 | Germany | [7] | 2020 | Modelling BAU diffusion |
| Chemical pulp, total | 4.89 | 2.50 | Germany | [7] | 2035 | Modelling BAU diffusion |
| Chemical pulp, total | 5.10 | 2.50 | Germany | [7] | 2020 | Modelling cost-effective diffusion |
| Chemical pulp, total | 4.89 | 2.50 | Germany | [7] | 2035 | Modelling cost-effective diffusion |
| Chemical pulp, total | 5.03 | 2.50 | Germany | [7] | 2020 | Modelling technical diffusion |
| Chemical pulp, total | 4.47 | 2.50 | Germany | [7] | 2035 | Modelling technical diffusion |
| Chemical pulping | 4.85 | 2.50 | BAT | [57] | 2001–2004 | From literature |
| Chemical Pulping | 4.84 | 2.50 | BAT | [57] | 2001–2004 | From literature |
| Chemical wood pulp | 4.53 | 2.50 | OECD: Australia, Sweden, the Netherlands, France, the UK, the USA, Germany, Japan | [8] | 1990 | BAT from literature |
| Kraft mill pulp | ||||||
| Kraft mill (actual) | 4.72 | 2.50 | Canada | [55] | 2003 | From literature |
| Kraft mills (actual) | 8.01 | 2.50 | Canada | [55] | 2001 | From literature |
| Kraft mills (modern mill—BAT) | 4.28 | 2.50 | Canada | [55] | 2001 | From literature |
| Pulp by kraft process | 4.03 | n.s. | Canada | [58] | 2000 | Calculated |
| Mechanical pulp | ||||||
| Mechanical pulp, total | 4.94 | 2.50 | Germany | [7] | 2011 | From literature |
| Mechanical pulp, total | 4.93 | 2.50 | Germany | [7] | 2007 | Base year, calculated using data in literature |
| Mechanical pulp, total | 4.76 | 2.50 | Germany | [7] | 2020 | Modelling BAU diffusion |
| Mechanical pulp, total | 4.53 | 2.50 | Germany | [7] | 2035 | Modelling BAU diffusion |
| Mechanical pulp, total | 4.64 | 2.50 | Germany | [7] | 2020 | Modelling cost-effective diffusion |
| Mechanical pulp, total | 4.36 | 2.50 | Germany | [7] | 2035 | Modelling cost-effective diffusion |
| Mechanical pulp, total | 4.08 | 2.50 | Germany | [7] | 2020 | Modelling technical diffusion |
| Mechanical pulp, total | 3.18 | 2.50 | Germany | [7] | 2035 | Modelling technical diffusion |
| Mechanical pulping | 5.21 | 2.50 | BAT | [57] | 2001–2004 | From literature |
| Mechanical wood pulp | 3.11 | 2.50 | OECD: Australia, Sweden, the Netherlands, France, the UK, the USA, Germany, Japan | [8] | 1990 | BAT from literature |
| Mechanical pulping | 5.21 | 2.50 | BAT | [57] | 2001–2004 | From literature |
| Sum, mechanical pulp (GWP) | 4.67 | 2.50 | Germany | [7] | 2011 | Calculated using data in literature |
| Thermomechanical pulping (TMP) | 3.25 | n.s. | n.s. | [59] | 1999–2006 | From literature |
| Other pulp | ||||||
| Other fibre pulp | 3.33 | 2.50 | OECD: Australia, Sweden, the Netherlands, France, the UK, the USA, Germany, Japan | [8] | 1990 | BAT from literature |
| Other wood pulp | 3.33 | 2.50 | OECD: Australia, Sweden, the Netherlands, France, the UK, the USA, Germany, Japan | [8] | 1990 | BAT from literature |
| Pulp by alcohol extraction | 5.53 | n.s. | Canada | [58] | 2000 | Calculated |
| Pulping | 7.60 | n.s. | Taiwan | [52] | 2007 | Calculated using self-collected data |
| Pulping | 8.06 | n.s. | Taiwan | [52] | 2008 | Calculated using self-collected data |
| Pulping | 8.46 | n.s. | Taiwan | [52] | 2009 | Calculated using self-collected data |
| Pulping | 8.45 | n.s. | Taiwan | [52] | 2010 | Calculated using self-collected data |
| Pulping | 7.82 | n.s. | Taiwan | [52] | 2011 | Calculated using self-collected data |
| Pulping | 8.06 | n.s. | India | [52] | 2004 | From literature |
| Pulping | 7.22 | n.s. | India | [52] | 2007 | From literature |
| Pulp | 1.67 | n.s. | China | [5] | 1985–2010 | Calculated |
| Pulp from recycled materials | ||||||
| RCF pulp (recycled cellulose fibre), total | 0.79 | 2.50 | Germany | [7] | 2011 | Calculated using data in literature |
| RCF pulp (recycled cellulose fibre), total | 0.76 | 2.50 | Germany | [7] | 2007 | Base year, calculated using data in literature |
| RCF pulp (recycled cellulose fibre), total | 0.76 | 2.50 | Germany | [7] | 2020 | Modelling BAU diffusion |
| RCF pulp (recycled cellulose fibre), total | 0.76 | 2.50 | Germany | [7] | 2035 | Modelling BAU diffusion |
| RCF pulp (recycled cellulose fibre), total | 0.76 | 2.50 | Germany | [7] | 2020 | Modelling cost-effective diffusion |
| RCF pulp (recycled cellulose fibre), total | 0.69 | 2.50 | Germany | [7] | 2035 | Modelling cost-effective diffusion |
| RCF pulp (recycled cellulose fibre), total | 0.76 | 2.50 | Germany | [7] | 2020 | Modelling technical diffusion |
| RCF pulp (recycled cellulose fibre), total | 0.69 | 2.50 | Germany | [7] | 2035 | Modelling technical diffusion |
| Sum, RCF pulp | 0.80 | 2.50 | Germany | [7] | 2011 | Calculated using data in literature |
| Recycled fibre input | 1.08 | 2.50 | OECD: Australia, Sweden, the Netherlands, France, the UK, the USA, Germany, Japan | [8] | 1990 | BAT from literature |
| Waste paper pulp | 0.39 | 2.50 | BAT | [57] | 2001–2004 | From literature |
| De-inked waste paper pulp | 1.68 | 2.50 | BAT | [57] | 2001–2004 | From literature |
| De-inked waste paper pulp | 1.68 | 2.50 | OECD | [55] | 2001–2004 | From literature |
Table A2.
Examples of SEC for various processes during pulp production, listed alphabetically.
Table A2.
Examples of SEC for various processes during pulp production, listed alphabetically.
| Energy Used by | Total Energy (GWh/kt) | PEF | Region | Reference | Year | Source for SEC |
|---|---|---|---|---|---|---|
| Pulp mills’ processes | ||||||
| Bleaching | 0.60 | 2.50 | USA | [54] | 1994 | From literature |
| Bleaching, mechanical pulp (GWP) | 0.25 | 2.50 | Germany | [7] | 2011 | From literature |
| Bleaching, RCF pulp | 0.08 | 2.50 | Germany | [7] | 2011 | From literature |
| Chemical recovery | 1.44 | 2.50 | USA | [54] | 1994 | From literature |
| Concentration and dispersion, RCF pulp | 0.25 | 2.50 | Germany | [7] | 2011 | From literature |
| De-inking (floatation), RCF pulp | 0.20 | 2.50 | Germany | [7] | 2011 | From literature |
| Grinding, mechanical pulp (GWP) | 4.50 | 2.50 | Germany | [7] | 2011 | From literature |
| Heat recovery, mechanical pulp (GWP) | −0.38 | 2.50 | Germany | [7] | 2011 | From literature |
| Others, RCF pulp | 0.05 | 2.50 | Germany | [7] | 2011 | From literature |
| Pulp drying | 0.15 | 2.50 | USA | [54] | 1994 | From literature |
| Pulping chemical | 1.48 | 2.50 | USA | [54] | 1994 | From literature |
| Pulping mechanical | 0.58 | 2.50 | USA | [54] | 1994 | From literature |
| Pulping other | 0.08 | 2.50 | USA | [54] | 1994 | From literature |
| Pulping wastepaper | 0.00 | 2.50 | USA | [54] | 1994 | From literature |
| Pulping, RCF pulp | 0.10 | 2.50 | Germany | [7] | 2011 | Calculated using data in literature |
| Screening, RCF pulp | 0.13 | 2.50 | Germany | [7] | 2011 | Calculated using data in literature |
| Washing, mechanical pulp (GWP) | 0.13 | 2.50 | Germany | [7] | 2011 | Calculated using data in literature |
| Wood handling, mechanical pulp (GWP) | 0.17 | 2.50 | Germany | [7] | 2011 | Calculated using data in literature |
| Wood preparation | 0.28 | 2.50 | USA | [54] | 1994 | From literature |
Table A3.
Examples of SEC for various paper grades, listed alphabetically. BAT—Best available technology. OECD—Countries that are members of the Organisation for Economic Co-operation and Development. LWC—Light-weight coated. SC—Supercalendered.
Table A3.
Examples of SEC for various paper grades, listed alphabetically. BAT—Best available technology. OECD—Countries that are members of the Organisation for Economic Co-operation and Development. LWC—Light-weight coated. SC—Supercalendered.
| Energy Used by | Total Energy (GWh/kt) | PEF | Region | Reference | Year | Source for SEC |
|---|---|---|---|---|---|---|
| Paper mills: individual paper grades | ||||||
| Boxboard | 1.38 | 2.50 | OECD | [55] | 2001 | From literature |
| Brown kraftliner | 2.92 | 2.50 | Finland | [60] | 1993 | From literature |
| Coated fine paper | 4.47 | 2.50 | Finland | [60] | 1993 | From literature |
| Coated mechanical | 1.56 | 2.50 | OECD | [55] | 2001 | From literature |
| Coated papers | 3.08 | 2.50 | BAT | [57] | 2001–2004 | From literature |
| Coated papers | 3.08 | 2.50 | BAT | [57] | 2001–2004 | From literature |
| Coated papers | 3.08 | 2.50 | OECD | [55] | 2001–2004 | From literature |
| Coated wood-free | 1.94 | 2.50 | OECD | [55] | 2001 | From literature |
| Containerboard | 1.70 | 2.50 | OECD | [55] | 2001 | From literature |
| Folding board | 3.43 | 2.50 | OECD | [55] | 2001–2004 | From literature |
| Folding boxboard | 3.43 | 2.50 | BAT | [57] | 2001–2004 | From literature |
| Folding boxboard | 3.94 | 2.50 | Finland | [60] | 1993 | From literature |
| Folding boxboard | 3.43 | 2.50 | BAT | [57] | 2001–2004 | From literature |
| Household and sanitary paper | 3.93 | 2.50 | BAT | [57] | 2001–2004 | From literature |
| Household and sanitary paper | 3.93 | 2.50 | OECD | [55] | 2001–2004 | From literature |
| Household and sanitary paper | 3.93 | 2.50 | BAT | [57] | 2001–2004 | From literature |
| Kraft papers | 2.13 | 2.50 | OECD | [55] | 2001 | From literature |
| LWC magazine paper | 3.53 | 2.50 | Finland | [60] | 1993 | From literature |
| Newsprint | 2.55 | 2.50 | BAT | [57] | 2001–2004 | From literature |
| Newsprint | 1.67 | 2.50 | OECD: Australia, Sweden, the Netherlands, France, the UK, the USA, Germany, Japan | [8] | 1990 | BAT from literature |
| Newsprint | 2.42 | n.s. | The Netherlands | [16] | 1997 | From literature |
| Newsprint | 1.44 | 2.50 | OECD | [55] | 2001 | From literature |
| Newsprint mill (modern—BAT) | 6.30 | 2.50 | Canada | [55] | 2001 | BAT from literature |
| Newsprint mills (actual) | 7.47 | 2.50 | Canada | [55] | 2001 | From literature |
| Newsprint, SC magazine paper | 3.03 | 2.50 | Finland | [60] | 1993 | From literature |
| Office paper | 3.69 | 2.50 | Finland | [60] | 1993 | From literature |
| Other paper | 2.92 | 2.50 | OECD: Australia, Sweden, the Netherlands, France, the UK, the USA, Germany, Japan | [8] | 1990 | BAT from literature |
| Other paper | 2.64 | n.s. | The Netherlands | [16] | 1997 | From literature |
| Packaging | 3.36 | n.s. | The Netherlands | [16] | 1997 | From literature |
| Packaging paper | 2.44 | 2.50 | OECD: Australia, Sweden, the Netherlands, France, the UK, the USA, Germany, Japan | [8] | 1990 | BAT from literature |
| Paper | 3.68 | n.s. | Taiwan | [52] | 2007 | Calculated using self-collected data |
| Paper | 3.89 | n.s. | Taiwan | [52] | 2008 | Calculated using self-collected data |
| Paper | 4.03 | n.s. | Taiwan | [52] | 2009 | Calculated using self-collected data |
| Paper | 4.01 | n.s. | Taiwan | [52] | 2010 | Calculated using self-collected data |
| Paper | 4.11 | n.s. | Taiwan | [52] | 2011 | Calculated using self-collected data |
| Paper and paperboard | 10.17 | n.s. | China | [5] | 1985 | Calculated |
| Paper and paperboard | 3.17 | n.s. | China | [5] | 2010 | Calculated |
| Paper and paperboard not specified elsewhere | 3.36 | 2.50 | BAT | [57] | 2001–2004 | From literature |
| Paper and paperboard not specified elsewhere | 3.36 | 2.50 | BAT | [57] | 2001–2004 | From literature |
| Paper and paperboard not specified elsewhere | 3.36 | 2.50 | OECD | [55] | 2001–2004 | From literature |
| Paper, total | 2.85 | 2.50 | Germany | [7] | 2011 | Calculated using data in literature |
| Paper, total | 2.85 | 2.50 | Germany | [7] | 2007 | Calculated using data in literature |
| Paper, total | 2.79 | 2.50 | Germany | [7] | 2020 | Modelling BAU diffusion |
| Paper, total | 2.64 | 2.50 | Germany | [7] | 2035 | Modelling BAU diffusion |
| Paper, total | 2.58 | 2.50 | Germany | [7] | 2020 | Modelling cost-effective diffusion |
| Paper, total | 2.46 | 2.50 | Germany | [7] | 2035 | Modelling cost-effective diffusion |
| Paper, total | 2.58 | 2.50 | Germany | [7] | 2020 | Modelling technical diffusion |
| Paper, total | 2.35 | 2.50 | Germany | [7] | 2035 | Modelling technical diffusion |
| Paperboard | 2.46 | n.s. | Taiwan | [52] | 2007 | Calculated using self-collected data |
| Paperboard | 2.35 | n.s. | Taiwan | [52] | 2008 | Calculated using self-collected data |
| Paperboard | 2.39 | n.s. | Taiwan | [52] | 2009 | Calculated using self-collected data |
| Paperboard | 2.38 | n.s. | Taiwan | [52] | 2010 | Calculated using self-collected data |
| Paperboard | 2.10 | n.s. | Taiwan | [52] | 2011 | Calculated using self-collected data |
| Printing and writing paper | 2.71 | 2.50 | OECD | [55] | 2001–2004 | From literature |
| Printing/writing | 4.28 | n.s. | The Netherlands | [16] | 1997 | From literature |
| Printing/writing paper | 3.33 | 2.50 | OECD: Australia, Sweden, the Netherlands, France, the UK, the USA, Germany, Japan | [8] | 1990 | BAT from literature |
| Printing and writing paper | 2.71 | 2.50 | BAT | [57] | 2001–2004 | From literature |
| Printing and writing paper | 2.71 | 2.50 | BAT | [57] | 2001–2004 | From literature |
| Sanitary | 4.69 | n.s. | The Netherlands | [16] | 1997 | From literature |
| Sanitary paper | 3.06 | 2.50 | OECD: Australia, Sweden, the Netherlands, France, the UK, the USA, Germany, Japan | [8] | 1990 | BAT from literature |
| Tissue paper | 4.44 | 2.50 | Finland | [60] | 1993 | From literature |
| Tissue and speciality | 4.38 | 2.50 | OECD | [55] | 2001 | From literature |
| Uncoated mechanical | 1.69 | 2.50 | OECD | [55] | 2001 | From literature |
| Uncoated wood-free | 1.44 | 2.50 | OECD | [55] | 2001 | From literature |
| Wrapping and packaging paper and board | 2.45 | 2.50 | BAT | [57] | 2001–2004 | From literature |
| Wrapping and packaging paper and board | 2.45 | 2.50 | OECD | [55] | 2001–2004 | From literature |
| Wrapping and packaging paper and board | 2.45 | 2.50 | BAT | [57] | 2001–2004 | From literature |
Table A4.
Examples of SEC for various processes during pulp production, listed alphabetically. BAT—Best available technology. OECD—Countries that are members of the Organisation for Economic Co-operation and Development.
Table A4.
Examples of SEC for various processes during pulp production, listed alphabetically. BAT—Best available technology. OECD—Countries that are members of the Organisation for Economic Co-operation and Development.
| Energy Used by | Total Energy (GWh/kt) | PEF | Region | Reference | Year | Source for SEC |
|---|---|---|---|---|---|---|
| Paper mills: processes | ||||||
| Board, after drying | 0.08 | 2.4 for electricity and 1.1 for heat | Netherlands | [10] | 2011 | Measured, calculated and from official databases |
| Board, drying sections | 1.33 | 2.4 for electricity and 1.1 for heat | Netherlands | [10] | 2011 | Measured, calculated and from official databases |
| Board, forming and press section | 0.36 | 2.4 for electricity and 1.1 for heat | Netherlands | [10] | 2011 | Measured, calculated and from official databases |
| Board, other processes—paper machine | 0.08 | 2.4 for electricity and 1.1 for heat | Netherlands | [10] | 2011 | Measured, calculated and from official databases |
| Board, other stock preparation | 0.28 | 2.4 for electricity and 1.1 for heat | Netherlands | [10] | 2011 | Measured, calculated and from official databases |
| Board, pre-drying | 1.25 | 2.4 for electricity and 1.1 for heat | Netherlands | [10] | 2011 | Measured, calculated and from official databases |
| Board, stock preparation | 0.19 | 2.4 for electricity and 1.1 for heat | Netherlands | [10] | 2011 | Measured, calculated and from official databases |
| Board, total processes—paper machine | 2.08 | 2.4 for electricity and 1.1 for heat | Netherlands | [10] | 2011 | Measured, calculated and from official databases |
| Board, wire and press | 0.42 | 2.4 for electricity and 1.1 for heat | Netherlands | [10] | 2011 | Measured, calculated and from official databases |
| Coating | 0.01 | 2.50 | Typical, country not specified | [57] | 2001 | From literature |
| Coating | 0.01 | 2.50 | OECD | [55] | 2001 | From literature |
| Dry-end, coating and finishing | 0.25 | 2.50 | Germany | [7] | 2011 | Assumptions and calculations based on literature |
| Dry-end, dryer section | 1.29 | 2.50 | Germany | [7] | 2011 | Assumptions and calculations based on literature |
| Dry-end, press section | 0.25 | 2.50 | Germany | [7] | 2011 | Assumptions and calculations based on literature |
| Graphic, after drying | 0.72 | 2.4 for electricity and 1.1 for heat | Netherlands | [10] | 2011 | Measured, calculated and from official databases |
| Graphic, coating/sizing/laminating | 0.06 | 2.4 for electricity and 1.1 for heat | Netherlands | [10] | 2011 | Measured, calculated and from official databases |
| Graphic, drying sections | 2.11 | 2.4 for electricity and 1.1 for heat | Netherlands | [10] | 2011 | Measured, calculated and from official databases |
| Graphic, forming and press section | 0.42 | 2.4 for electricity and 1.1 for heat | Netherlands | [10] | 2011 | Measured, calculated and from official databases |
| Graphic, other processes paper machine | 0.19 | 2.4 for electricity and 1.1 for heat | Netherlands | [10] | 2011 | Measured, calculated and from official databases |
| Graphic, other stock preparation | 0.78 | 2.4 for electricity and 1.1 for heat | Netherlands | [10] | 2011 | Measured, calculated and from official databases |
| Graphic, pre-drying | 1.31 | 2.4 for electricity and 1.1 for heat | Netherlands | [10] | 2011 | Measured, calculated and from official databases |
| Graphic, stock preparation | 0.64 | 2.4 for electricity and 1.1 for heat | Netherlands | [10] | 2011 | Measured, calculated and from official databases |
| Graphic, total processes—paper machine | 3.47 | 2.4 for electricity and 1.1 for heat | Netherlands | [10] | 2011 | Measured, calculated and from official databases |
| Graphic, wire and press | 0.42 | 2.4 for electricity and 1.1 for heat | Netherlands | [10] | 2011 | Measured, calculated and from official databases |
| Other | 0.42 | 2.50 | USA | [54] | 1994 | From literature |
| Other, after drying | 0.14 | 2.4 for electricity and 1.1 for heat | Netherlands | [10] | 2011 | Measured, calculated and from official databases |
| Other, coating/sizing/laminating | 0.03 | 2.4 for electricity and 1.1 for heat | Netherlands | [10] | 2011 | Measured, calculated and from official databases |
| Other, de-inking | 0.47 | 2.4 for electricity and 1.1 for heat | Netherlands | [10] | 2011 | Measured, calculated and from official databases |
| Other, de-inking | 0.17 | 2.4 for electricity and 1.1 for heat | Netherlands | [10] | 2011 | Measured, calculated and from official databases |
| Other, dispersion | 0.33 | 2.4 for electricity and 1.1 for heat | Netherlands | [10] | 2011 | Measured, calculated and from official databases |
| Other, dispersion | 0.11 | 2.4 for electricity and 1.1 for heat | Netherlands | [10] | 2011 | Measured, calculated and from official databases |
| Other, drying sections | 1.47 | 2.4 for electricity and 1.1 for heat | Netherlands | [10] | 2011 | Measured, calculated and from official databases |
| Other, forming and press section | 0.36 | 2.4 for electricity and 1.1 for heat | Netherlands | [10] | 2011 | Measured, calculated and from official databases |
| Other, other processes paper machine | 0.11 | 2.4 for electricity and 1.1 for heat | Netherlands | [10] | 2011 | Measured, calculated and from official databases |
| Other, other stock preparation | 0.31 | 2.4 for electricity and 1.1 for heat | Netherlands | [10] | 2011 | Measured, calculated and from official databases |
| Other, pre-drying | 1.36 | 2.4 for electricity and 1.1 for heat | Netherlands | [10] | 2011 | Measured, calculated and from official databases |
| Other, stock preparation | 0.22 | 2.4 for electricity and 1.1 for heat | Netherlands | [10] | 2011 | Measured, calculated and from official databases |
| Other, total processes—paper machine | 2.61 | 2.4 for electricity and 1.1 for heat | Netherlands | [10] | 2011 | Measured, calculated and from official databases |
| Other, wire and press | 0.42 | 2.4 for electricity and 1.1 for heat | Netherlands | [10] | 2011 | Measured, calculated and from official databases |
| Others, other processes (effluents, compressed air) | 0.31 | 2.50 | Germany | [7] | 2011 | Assumptions and calculations based on literature |
| Paper machine | 3.10 | 2.50 | Typical, country not specified | [57] | 2001 | From literature |
| Paper machine | 3.10 | 2.50 | OECD | [55] | 2001 | From literature |
| Paper machines in newsprint mills (GJ/ad tonne) | 3.36 | 3.50 | Canada | [55] | 2003 | From literature |
| Paper production | 3.13 | 2.50 | Netherlands | [16] | 1997 | Assumptions and calculations based on literature |
| Papermaking | 4.30 | 2.50 | USA | [54] | 1994 | Assumptions and calculations based on literature |
| Stock preparation | 0.51 | 2.50 | Typical, country not specified | [57] | 2001 | From literature |
| Stock preparation | 0.51 | 2.50 | OECD | [55] | 2001 | From literature |
| Stock preparation, pulper | 0.03 | 2.50 | Germany | [7] | 2011 | Calculated using data in literature |
| Stock preparation, refiner | 0.33 | 2.50 | Germany | [7] | 2011 | Calculated using data in literature |
| Stock preparation, screening | 0.08 | 2.50 | Germany | [7] | 2011 | Calculated using data in literature |
| Sum, processes for paper production | 2.85 | 2.50 | Germany | [7] | 2011 | Calculated using data in literature |
| Tissue, de-inking | 0.28 | 2.4 for electricity and 1.1 for heat | Netherlands | [10] | 2011 | Measured, calculated and from official databases |
| Tissue, de-inking | 0.22 | 2.4 for electricity and 1.1 for heat | Netherlands | [10] | 2011 | Measured, calculated and from official databases |
| Tissue, dispersion | 0.44 | 2.4 for electricity and 1.1 for heat | Netherlands | [10] | 2011 | Measured, calculated and from official databases |
| Tissue, dispersion | 0.42 | 2.4 for electricity and 1.1 for heat | Netherlands | [10] | 2011 | Measured, calculated and from official databases |
| Tissue, dispersion and de-inking | 0.72 | 2.4 for electricity and 1.1 for heat | Netherlands | [10] | 2011 | Measured, calculated and from official databases |
| Tissue, drying sections | 1.94 | 2.4 for electricity and 1.1 for heat | Netherlands | [10] | 2011 | Measured, calculated and from official databases |
| Tissue, forming and press section | 0.44 | 2.4 for electricity and 1.1 for heat | Netherlands | [10] | 2011 | Measured, calculated and from official databases |
| Tissue, other processes—paper machine | 0.08 | 2.4 for electricity and 1.1 for heat | Netherlands | [10] | 2011 | Measured, calculated and from official databases |
| Tissue, other stock preparation | 0.92 | 2.4 for electricity and 1.1 for heat | Netherlands | [10] | 2011 | Measured, calculated and from official databases |
| Tissue, pre-drying | 1.92 | 2.4 for electricity and 1.1 for heat | Netherlands | [10] | 2011 | Measured, calculated and from official databases |
| Tissue, stock preparation | 0.64 | 2.4 for electricity and 1.1 for heat | Netherlands | [10] | 2011 | Measured, calculated and from official databases |
| Tissue, total processes—paper machine | 4.08 | 2.4 for electricity and 1.1 for heat | Netherlands | [10] | 2011 | Measured, calculated and from official databases |
| Tissue, wire and press | 0.53 | 2.4 for electricity and 1.1 for heat | Netherlands | [10] | 2011 | Measured, calculated and from official databases |
| Total paper mill | 3.90 | 2.50 | Typical, country not specified | [57] | 2001 | From literature |
| Wet-end, forming section | 0.08 | 2.50 | Germany | [7] | 2011 | Calculated using data in literature |
| Wet-end, headbox | 0.25 | 2.50 | Germany | [7] | 2011 | Calculated using data in literature |
| Paper mill (coated paperboard production) | 7.93 | n.s. | China | [61] | 2015 | Calculated from collected data |
| Paper mill (coated paperboard production) | 7.78 | n.s. | BAT EU | [61] | 2015 | Calculated from collected data |
| Paper mill (coated paperboard production) | 5.57 | n.s. | BAT USA | [61] | 2015 | Calculated from collected data |
References
- EC (European Commision). Communication from the Energy Roadmap 2050; Commission to the European Parliament, the Council, the European Economic and Social Committee and the Committee of the Regions, COM/2011/0885 Final; European Commision: Brussels, Belgium, 2011. [Google Scholar]
- IEA (International Energy Agency). Energy and Climate Change; World Energy Outlook Special Report; IEA: Paris, France, 2015. [Google Scholar]
- IEA (International Energy Agency). Tracking Clean Energy Progress; IEA: Paris, France, 2017. [Google Scholar]
- Schulze, M.; Nehler, H.; Ottosson, M.; Thollander, P. Energy management in industry—A systematic review of previous findings and an integrative conceptual framework. J. Clean. Prod. 2016, 112, 3692–3708. [Google Scholar] [CrossRef]
- Peng, L.; Zeng, X.; Wang, Y.; Hong, G.-B. Analysis of energy efficiency and carbon dioxide reduction in the Chinese pulp and paper industry. Energy Policy 2015, 80, 65–75. [Google Scholar] [CrossRef]
- Lawrence, A.; Karlsson, M.; Thollander, P. Effects of firm characteristics and energy management for improving energy efficiency in the pulp and paper industry. Energy 2018, 153, 825–835. [Google Scholar] [CrossRef]
- Fleiter, T.; Fehrenbach, D.; Worrell, E.; Eichhammer, W. Energy efficiency in the German pulp and paper industry—A model-based assessment of saving potentials. Energy 2012, 40, 84–99. [Google Scholar] [CrossRef]
- Farla, J.; Blok, K.; Schipper, L. Energy efficiency developments in the pulp and paper industry. Energy Policy 1997, 25, 745–758. [Google Scholar] [CrossRef]
- Swedish Standard Institute. Energy Efficiency Benchmarking Methodology SS-EN 16231:2012; Swedish Standard Institute: Stockholm, Sweden, 2012. [Google Scholar]
- Laurijssen, J.; Faaij, A.; Worrell, E. Benchmarking energy use in the paper industry: A benchmarking study on process unit level. Energy Effic. 2013, 6, 49–63. [Google Scholar] [CrossRef]
- Phylipsen, D.; Blok, K.; Worrell, E.; Beer, J. De Benchmarking the energy efficiency of Dutch industry: An assessment of the expected effect on energy consumption and CO2 emissions. Energy Policy 2002, 30, 663–679. [Google Scholar] [CrossRef]
- Patterson, M.G. What is energy efficiency? Concepts, indicators and methodological issues. Energy Policy 1996, 24, 377–390. [Google Scholar] [CrossRef]
- Phylipsen, G.J.M.; Blok, K.; Worrell, E. International comparisons of energy efficiency-Methodologies for the manufacturing industry. Energy Policy 1997, 25, 715–725. [Google Scholar] [CrossRef]
- Rogers, J.G.; Cooper, S.J.; Norman, J.B. Use of industrial energy benchmarking with reference to the pup and paper industries. Renew. Sustain. Energy Rev. 2018, 95, 23–37. [Google Scholar] [CrossRef]
- International Standard Organization. Energy Management Systems—Requirements with Guidance for Use ISO 50001:2011; International Standard Organization: Geneva, Switzerland, 2011. [Google Scholar]
- De Beer, J.; Worrell, E.; Blok, K. Long-term energy-efficiency improvements in the paper and board industry. Energy 1998, 23, 21–42. [Google Scholar] [CrossRef]
- International Standard Organization. Energy Management Systems—Measuring Energy Performance Using Energy Baseline (EnB) and Energy Performance Indicators (EnPI)—General Principles and Guidance ISO 50006:2017; International Standard Organization: Geneva, Switzerland, 2017. [Google Scholar]
- Andersson, E.; Arfwidsson, O.; Thollander, P. Benchmarking energy performance of industrial small and medium-sized enterprises using an energy efficiency index: Results based on an energy audit policy program. J. Clean. Prod. 2018, 182, 883–895. [Google Scholar] [CrossRef]
- Saygin, D.; Worrell, E.; Patel, M.K.; Gielen, D.J. Benchmarking the energy use of energy-intensive industries in industrialized and in developing countries. Energy 2011, 36, 6661–6673. [Google Scholar] [CrossRef]
- Suhr, M.; Klein, G.; Kourti, I.; Gonzalo, M.R.; Santonja, G.G.; Roudier, S.; Sancho, L.D. Best Available Techniques (BAT) Reference Document for the Production of Pulp, Paper and Board—Final Draft July 2013; European Commision: Luxembourg, 2015. [Google Scholar]
- Sivill, L.; Ahtila, P. Energy efficiency index as an energy efficiency indicator for integrated pulp and paper mills—A case study. In Proceedings of the First International Conference on Applied Energy (ICAE 2009), Hong Kong, China, 5–7 January 2009; pp. 582–593. [Google Scholar]
- Gagnon, N.; Hall, C.A.S.; Brinker, L. A preliminary investigation of energy return on energy investment for global oil and gas production. Energies 2009, 2, 490–503. [Google Scholar] [CrossRef]
- Murphy, D.J.; Hall, C. EROI or energy return on (energy) invested. Ann. N. Y. Acad. 2010, 1185, 102–118. [Google Scholar] [CrossRef]
- King, C.W.; Hall, C.A.S. Relating financial and energy return on investment. Sustainability 2011, 3, 1810–1832. [Google Scholar] [CrossRef]
- Hall, C.A.S. Introduction to special issue on new studies in EROI (Energy Return on Investment). Sustainability 2011, 3, 1773–1777. [Google Scholar] [CrossRef]
- Hall, C.A.S. New Studies in EROI (Energy Return on Investment). Sustainability 2011, 2496–2499. [Google Scholar] [CrossRef]
- Poisson, A.; Hall, C.A.S. Time series EROI for Canadian oil and gas. Energies 2013, 6, 5940–5959. [Google Scholar] [CrossRef]
- Worrell, E.; Cuelenaere, R.F.A.; Blok, K.; Turkenburg, W.C. Energy consumption by industrial process in the European Union. Energy 1994, 19, 1113–1129. [Google Scholar] [CrossRef]
- Thollander, P.; Ottosson, M. An energy efficient Swedish pulp and paper industry—Exploring barriers to and driving forces for cost-effective energy efficiency investments. Energy Effic. 2008, 1, 21–34. [Google Scholar] [CrossRef]
- Rohdin, P.; Thollander, P.; Solding, P. Barriers to and drivers for energy efficiency in the Swedish foundry industry. Energy Policy 2007, 35, 672–677. [Google Scholar] [CrossRef]
- Thollander, P.; Backlund, S.; Trianni, A.; Cagno, E. Beyond barriers—A case study on driving forces for improved energy efficiency in the foundry industries in Finland, France, Germany, Italy, Poland, Spain, and Sweden. Appl. Energy 2013, 111, 636–643. [Google Scholar] [CrossRef]
- Trianni, A.; Cagno, E.; Thollander, P.; Backlund, S. Barriers to industrial energy efficiency in foundries: A European comparison. J. Clean. Prod. 2013, 40, 161–176. [Google Scholar] [CrossRef]
- Brunke, J.C.; Johansson, M.; Thollander, P. Empirical investigation of barriers and drivers to the adoption of energy conservation measures, energy management practices and energy services in the Swedish iron and steel industry. J. Clean. Prod. 2014, 84, 509–525. [Google Scholar] [CrossRef]
- Thollander, P.; Danestig, M.; Rohdin, P. Energy policies for increased industrial energy efficiency: Evaluation of a local energy programme for manufacturing SMEs. Energy Policy 2007, 35, 5774–5783. [Google Scholar] [CrossRef]
- Rohdin, P.; Thollander, P. Barriers to and driving forces for energy efficiency in the non-energy intensive manufacturing industry in Sweden. Energy 2006, 31, 1500–1508. [Google Scholar] [CrossRef]
- Lawrence, A.; Thollander, P.; Karlsson, M. Drivers, barriers, and success factors for improving energy management in the pulp and paper industry. Sustainability 2018, 10, 1851. [Google Scholar] [CrossRef]
- Swedish Standard Institute. Energy Efficiency and Savings Calculations, Top-down and Bottom-up Methods SS-EN 16212:2012; Swedish Standard Institute: Stockholm, Sweden, 2012. [Google Scholar]
- Laurijssen, J.; Faaij, A.; Worrell, E. Energy conversion strategies in the European paper industry—A case study in three countries. Appl. Energy 2012, 98, 102–113. [Google Scholar] [CrossRef]
- Smith, J.M.; Van Ness, H.C. Introduction to Chemical Engineering Thermodynamics, 4th ed.; Rao, S., Morriss, J., Eds.; McGraw-Hill Book Company: New York, NY, USA, 1987; ISBN 0-07-058703-5. [Google Scholar]
- Dincer, I.; Rosen, M.A. Exergy: Energy, Environment and Sustainable Development, 2nd ed.; Elsevier Science & Technology: Amsterdam, The Netherlands, 2012. [Google Scholar]
- Neelis, M.; Ramirez-Ramirez, A.; Patel, M.; Farla, J.; Boonekamp, P.; Blok, K. Energy efficiency developments in the Dutch energy-intensive manufacturing industry, 1980–2003. Energy Policy 2007, 35, 6112–6131. [Google Scholar] [CrossRef]
- BillerudKorsnäs. Annual and Sustainability Report [Års- och hållbarhetsredovisning 2016, in Swedish]; BillerudKorsnäs: Solna, Sweden, 2016. [Google Scholar]
- Holmen. Annual Report 2016 [Årsredovisning, in Swedish]; Holmen AB: Stockholm, Sweden, 2016. [Google Scholar]
- Briggs, D.G. Forest Products Measurements and Conversion Factors: With Special Emphasis on the U.S. Pacific Northwest; The College of Forest Resources, University of Washington: Seattle, WA, USA, 1994. [Google Scholar]
- Thollander, P.; Rohdin, P.; Moshfegh, B.; Karlsson, M.; Söderström, M.; Trygg, L. Energy in Swedish industry 2020—Current status, policy instruments, and policy implications. J. Clean. Prod. 2013, 51, 109–117. [Google Scholar] [CrossRef]
- Kaya, A.; Keyes, A. Energy management technology in pulp, paper, and allied industries. Automation 1983, 19, 111–130. [Google Scholar] [CrossRef]
- Wilby, M.R.; Rodríguez González, A.B.; Vinagre Díaz, J.J. Empirical and dynamic primary energy factors. Energy 2014, 73, 771–779. [Google Scholar] [CrossRef]
- Swing Gustafsson, M.; Gustafsson, M.; Myhren, J.A.; Dotzauer, E. Primary energy use in buildings in a Swedish perspective. Energy Build. 2016, 130, 202–209. [Google Scholar] [CrossRef]
- SEA Energy Use in Numbers 2017, [Energiläget i siffror 2017, in Swedish]. Available online: http://www.energimyndigheten.se/nyhetsarkiv/2017/nu-finns-energilaget-i-siffror-2017/ (accessed on 2 June 2017).
- Farahani, S.; Worrell, E.; Bryntse, G. CO2-free paper? Resour. Conserv. Recycl. 2004, 42, 317–336. [Google Scholar] [CrossRef]
- Francis, D.W.; Browne, T.C. Method for benchmarking energy use in pulp and paper operations. In Proceedings of the 2004 TAPPI Technical Conference, Indianapolis, IN, USA, 29 August–2 September 2004; p. 10. [Google Scholar]
- Chan, D.Y.L.; Huang, C.F.; Lin, W.C.; Hong, G.B. Energy efficiency benchmarking of energy-intensive industries in Taiwan. Energy Convers. Manag. 2014, 77, 216–220. [Google Scholar] [CrossRef]
- Bajpai, P. Pulp and Paper Industry: Energy Conservation; Elsevier: Amsterdam, The Netherlands, 2016. [Google Scholar]
- Worrell, E.; Martin, N.; Anglani, N.; Einstein, D.; Khrushch, M.; Price, L. Opportunities to Improve Energy Efficiency in the U.S. Pulp and Paper Industry; Lawrence Berkeley National Lab: Berkeley, CA, USA, 2001; p. 13.
- IEA (International Energy Agency). Tracking Industrial Energy Efficiency and CO2 Emissions; IEA: Paris, France, 2007. [Google Scholar] [CrossRef]
- Kramer, K.J.; Masanet, E.; Xu, T.; Worrell, E. Energy Efficiency Improvement and Cost Saving Opportunities for the Corn Wet Milling Industry; An ENERGY STAR® Guide for Energy and Plant Managers; Lawrence Berkeley National Lab: Berkeley, CA, USA, 2009.
- IEA. Energy Technology Transitions for Industry. Strategies for the Next Industrial; IEA: Paris, France, 2009; ISBN 9789264068582. [Google Scholar]
- Morris, D.R.; Steward, F.R.; Gilmore, C.A. Comparative analysis of the consumption of energy of two wood pulping processes. Energy Convers. Manag. 2000, 41, 1557–1568. [Google Scholar] [CrossRef]
- Walter, K.; Paulsson, M.; Wackerberg, E. Energy efficient refining of black spruce TMP by using acid hydrogen peroxide: Part 2. Washing, chelating and bleaching studies. Nord. Pulp Pap. Res. J. 2009, 24, 266–272. [Google Scholar] [CrossRef]
- Komppa, A. Paper and energy: A Finnish view. In Energy Efficiency in Process Technology; Elsevier Applied Science: London, UK, 1993; pp. 101–110. [Google Scholar]
- Zhang, Y.; Hong, M.; Li, J.; Chen, X.; Zeng, Z. Benchmarking Analysis of Energy Efficiency Indicators in Paper Mill. Bioresources 2016, 11, 9723–9740. [Google Scholar] [CrossRef]


© 2019 by the authors. Licensee MDPI, Basel, Switzerland. This article is an open access article distributed under the terms and conditions of the Creative Commons Attribution (CC BY) license (http://creativecommons.org/licenses/by/4.0/).