Abstract
The geotechnical properties of methane-hydrate-bearing sediments (MHBS) are commonly investigated in the laboratory by using artificial hydrate formations in sandy specimens. Analyses of MHBS saturated with gas or water (in addition to methane-hydrate) showed significant mechanical differences between the two pore-filling states. This paper discusses the unique dilatancy behavior of gas-saturated MHBS, with comparison to water-saturated test results of previously-published works. It is shown that the significant compaction of gas-saturated samples is related to internal tensile forces, which are absent in water-saturated samples. The conceptual link between the internal tensile forces and the compaction characteristics is demonstrated through mechanical differences between pure sand and cemented sand. The paper establishes the link between internal adhesion in gas-saturated MHBS and the unique dilation response by using a stress–dilatancy analysis.
1. Introduction
1.1. Hydrate-Bearing Sediments
Methane-hydrates have attracted increased interest in recent years as a potential energy source due to the existence of extensive methane-hydrate-bearing sediments (MHBS) around the world [1,2,3,4,5,6]. Taken together, these reserves are estimated to contain double the productive energy potential of all known fossil fuel resources [7,8,9]. Hydrate reservoirs are also studied in the context of the environmental benefit in the CH-CO replacement process [10,11] and their mechanical stability in production from offshore petroleum reserves [12]. Methane-hydrate is an ice-like substance comprising solid structures of water molecules that encapsulate methane gas molecules in a stoichiometric ratio of about 5.75 (number of water to methane molecules) [13]. The hydrate is thermodynamically stable under a combination of low temperature and high pressure, and it naturally crystallizes in the porous medium of soil [14,15,16], conditions that exist widely in offshore marine sediments and under permafrost. Industrial efforts to produce energy from hydrate-bearing sediments concentrate mainly on offshore sandy sediments because of their widespread availability (offshore) and their granular morphology (i.e., sand, which is highly permeable and can be highly saturated with hydrate). The solid hydrate trapped in the pores of the sandy substrate may function as part of the whole-sediment load-bearing system, where it can modify sediment mechanical properties [16]. Consequently, hydrate dissociation, which occurs during gas production, can degrade the mechanical properties of the MHBS to such an extent that the sediment (and in turn, the production well) collapses under the load generated by upper deposits. Sediment collapse during gas production can also be caused by sand migration that can occur at high gas and water flow gradients [17]. Investigations of the mechanical behavior of MHBS, which is most commonly studied using laboratory tools, are therefore needed.
1.2. Laboratory Testing
The extraction of undisturbed MHBS samples for laboratory testing is significantly expensive due to complex pressure and temperature coring procedures and the need for unique drilling and sediment transfer systems, in addition to other engineering offshore challenges. However, the challenges aside, the use of undisturbed samples precludes undertaking a repeatable and well-characterized study. For these reasons, experimental investigations are typically performed with artificial MHBS.
A variety of methods for the laboratory formation of hydrate entrapped in a soil medium exist, differing from each other by the morphology of the hydrate end-product in the pores. Three morphologies are commonly discussed, in which hydrate is grown (1) within the pore space (2) as part of the load bearing system of the sediment or (3) between grain contacts. A typical artificial MHBS formation procedure involves standard soil sampling in a wet environment (which can be moisture, crushed ice, methane-dissolved water, and more) [18]. Methane gas is then percolated through the wet environment, and the entire system is pressurized and cooled down in a process that typically takes a few days until a complete hydrate formation is achieved. After hydrate formation and before testing, the residual free gas in the pore space can be replaced with water to simulate the underwater environment or to improve strain measurement using the water flow during the test. In general, experimental results show that the mechanical responses vary with hydrate morphology, stress level, and testing conditions (gas or water saturation).
The most common testing laboratory for mechanical characterization is an environmental triaxial testing system. Such a system applies axial deformations upon a cylindrical sample, which is confined by hydrostatic pressure using a pressurized liquid in an outer cell. The sample is separated from the cell liquid by a membrane (usually a latex membrane), which allows applying independent pore pressure (gas or liquid). To reach the hydrate stability conditions, the cell liquid temperature is cooled down (typically around 5 °C), and the pore pressure is increased (typically 8 MPa or more). The effective stress in the test is calculated by reducing the pore pressure value from the outer applied stresses (Terzaghi’s law). During the test, axial and radial deformations can be directly measured, as opposed to volumetric changes, which may not be precisely measured (as in standard soil, for which the inlet/outlet water can be directly measured) due to dissolution and dissociation difficulties of methane in the pore liquid. To overcome this difficulty, Hyodo et al. [19] used a double-wall cell, in which volumetric changes can be directly and precisely measured, based on measurement of liquid flow from the inner cell throughout the test (see the schematic laboratory diagram in Figure 1 of [19]). This work follows the test results of Hyodo et al. [19], using an analysis based on the measured volumetric measurements.
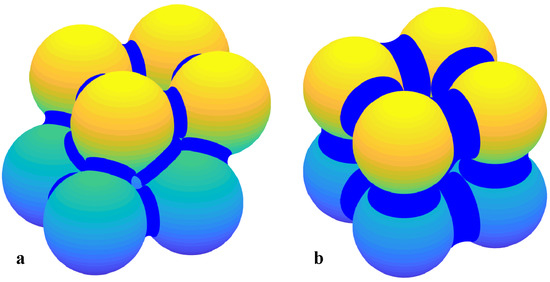
Figure 1.
3D illustration of of hydrate in a meniscus shape between grain contacts of (a) pyramidal and (b) simple-cubic sphere packings.
1.3. Geotechnical Properties
The mechanical properties of MHBS can be examined by assessing its fundamental geotechnical features, such as strength, stiffness, and dilation. Experimental results show amplification in these properties with the increase in sediment hydrate saturation, ; , where and are hydrate volume and void volume, respectively [20,21,22,23,24,25,26]. A significant increase in the MHBS’s stiffness was noticed even at low values (5%), by using ultrasonic pressure and shear wave measurement, in the case where hydrate was nucleated between grain contacts [27]. However, the increase in stress response in failure was found significant at high levels (>25%) [16]. This can be explained by strong hydrate-hydrate net connections that may be percolated through the whole sediment pore-space at such a high level. The threshold of is demonstrated in Figure 1 for pyramidal and simple-cubic sphere packings, in which hydrate is located between grain contacts in a meniscus shape (for a wetting angle of ). A consistent increase in dilation (with shearing) with the increase in has been noticed in all mechanical test results of MHBS. This phenomenon has been addressed to the presence of solid hydrate as a kinematic obstacle within the soil pore-space, which forces volumetric expansion throughout MHBS’s deformation.
The increase in the stress response of MHBS has been attributed in the past to cementation interactions between soil grains and hydrate, which are simulated in some models by using a cohesion property [24,28,29,30,31]. In general, cohesion (in geotechnical terms) is used as a model parameter, for models such as Mohr–Coulomb or Cam–Clay, while it may not necessarily be referred to true physical characteristics (though enabling a reasonable estimation of mechanical behavior under certain conditions). A distinction between the “apparent” and “true” cohesion property was introduced by Hvorslev [32] and since then has been used for differentiation between the cementation phenomenon and other indirect effects on the mechanical behavior of soils.
Pinkert [33] suggested to investigate MHBS’s “true” cohesion in geotechnical terms by using a combined analysis of experimental stress–dilatancy responses as suggested by Rowe [34] for standard soils. Using comparisons of experimentally-obtained stress–dilatancy relationships between MHBS and cemented sand, Pinkert [35] showed that, unlike cemented sand, MHBS can be mechanically characterized without using a cohesion property, i.e., stress–dilatancy relationships for cemented sand vary depending on cement content, while those of MHBS are the same regardless of hydrate content. This difference is evident in the results of drained triaxial tests of cemented sand in Figure 2 with comparison to MHBS test results in Figure 3, when drawn on the and axes, where and are major and minor principle effective stresses, respectively, and and are volumetric and axial strain rates, respectively (, the major principle stress, in triaxial compression testing). In this work, positive strains signify contraction, and negative strains signify expansion.
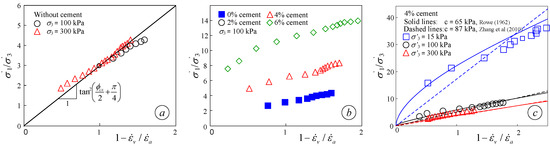
Figure 2.
Stress-dilatancy representation of cemented sand [36]: (a) without cement, (b) with different cement content, and (c) with 4% cement content at different confining stresses.
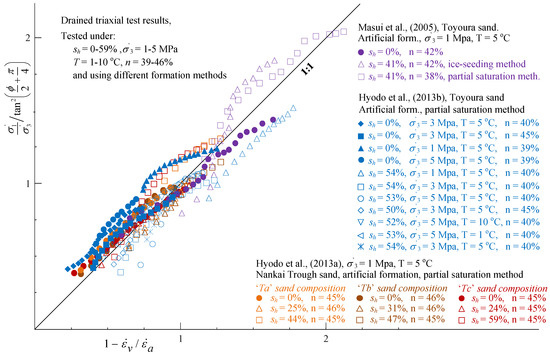
Figure 3.
Results of drained triaxial tests of water-saturated methane-hydrate-bearing sediments (MHBS) of Masui et al. [20], Hyodo et al. [25], and Hyodo et al. [37], plotted on the and axes, for different values, hydrate morphologies, sample porosities, temperatures, and confining stresses.
Figure 2 refers to the results obtained by Abdulla and Kiousis [36] for their tests of standard sand and sand containing Portland cement at different concentrations. The general stress–dilatancy concept is demonstrated in Figure 2a, in which a constant stress–dilatancy relationship is shown in the results for the standard (uncemented) sand, regardless of the stress confinement level, and all the results seem to follow the same linear trend, which intercepts the origin. Following the models both of Rowe [34] and of Zhang and Salgado [38] for non-cohesive soils:
the trend-line slope can be directly related to the critical state friction angle, , as shown in the figure. Equation (1) refers to the stress response evaluation of a single test, which varied with the evaluation of dilation during the test and was valid only up to peak stress [34]. The cementation effect is demonstrated in Figure 2b, where higher cement concentrations yielded higher positioning of the test results under the given axes. The expansion of Equation (1) for cohesive soils was given by Rowe [34], by using the principle of energy-ratio minimization, as:
and by Zhang and Salgado [38], based on a saw-tooth (non-associated) rule, as:
where c is cohesion. The validity of the above equations is demonstrated in Figure 2c by showing that both models captured the major trends of all the experimental results for the same cement content when using a single cohesion value.
If hydrate saturation were shown to be of a cohesive nature, i.e., in Equation (2) or (3), tests of sediments with higher hydrate saturations would have returned higher stress–dilatancy results. However, Figure 3 shows the opposite, i.e., the same stress–dilatancy trends can be observed in MHBS at various hydrate saturations, hydrate morphologies, sand types, porosities, confinement level, and specimen temperatures. The vertical axis in the figure was normalized by (strength factor of Equation (1)) to enable it to include all sand types associated with different friction values. Therefore, a lack of true cohesion in hydrate-bearing sands was concluded by Pinkert [35].
Other geotechnical models for MHBS that do not use cohesion can also be found in DeLaFuente et al. [39] and Uchida et al. [40]. In both, the models showed good agreement with experimental results when using critical state models where hydrate affected the plastic flow rather than related to a cohesion property. The lack of a true cohesion component also coincided with the micro-scale visual evidence of Chaouachi et al. [41]. The existence of thin water films between hydrate in the pores and sand grains (without any direct sand–hydrate contacts) has been consistently shown by X-ray CT scans. In contrast, cemented sand X-ray images showed direct microscale cement-sand contacts [42]. The evidence of water films between hydrate and sand grains supported the energy calculations of Bonnefoy et al. [43], which showed that hydrate–water–quartz interaction was at a lower energetic state than hydrate–quartz interaction.
All the test results mentioned above together with the related analysis are relevant for MHBS that are tested under a full water saturation, in which all free gas in the pore space is replaced with water before testing. However, when such water-gas replacement does not take place, different mechanical trends have been observed. This paper analyses the experimental results of Hyodo et al. [19] on gas-saturated MHBS and suggests different mechanisms to address mechanical differences that can be drawn between water-saturated and gas-saturated MHBS.
2. Dilation Response of Gas-Saturated MHBS
Hyodo et al. [19] presented triaxial test results of gas-saturated MHBS in which the water saturation process did not take place prior to the mechanical testing. In these tests, artificial hydrate was formed in Toyoura sand using the “excess gas” method. In this method, methane gas was injected into a moist sand sample, then the gas pressure was increased to the desired pore pressure while the cell pressures were increased (keeping a difference of 0.2 MPa from the pore pressure), and the temperature was fixed at 1 °C. Under these conditions, methane-hydrate was formed throughout the following 24 h. After complete hydrate formation, the specimen was tested (sheared) under drained conditions. The triaxial testing apparatus was equipped with a double-wall cell system for accurate volumetric change measurement. Test results showed trends of amplified stress and dilation responses with increasing hydrate saturation. However, comparison with test results of water-saturated MHBS (where the free gas in the sample was replaced with water prior to shearing) of the same soil and hydrate saturation showed that there were fundamental mechanical differences between the two testing conditions. The test results of water-saturated (WS) and gas-saturated (GS) MHBS differed markedly in terms of deviatoric stress (q), such that GS samples experienced higher stiffness and strength throughout shearing.
Another critical mechanical difference between GS and WS MHBS was the initial volumetric response to shearing, in which all the GS test results showed a significant compaction when axial deformation was initiated. Moreover, the volumetric change of the GS samples was higher than the axial compaction; or in other words, the GS samples exhibited initial lateral compaction with initial axial compaction. Such a phenomenon can be described using the parameter :
where and are radial (lateral) and axial strains, respectively, and refers to their ratio. Note that is not the formal Poison’s ratio of Hooke’s law (because effective confining pressure was applied), but practically used as such in previous works. Thus, refers to lateral expansion () and to lateral contraction (), and is associated with zero lateral deformation ().
The difference in the dilation response between GS and WS MHBS is presented for the results of [19] in Figure 4, upon test results of the same soil characteristic with similar hydrate saturation. A zoom-in was added to the original figure for the two test results, in which the 1:1 line represents no lateral deformation (i.e., ). As can be seen, the dilation slope of the WS sample () lied above the 1:1 line, and thus, it exhibited initial expansion, while the GS sample () exhibited initial contraction (i.e., lies below the 1:1 line). Numerically, the WS sample in the figure refers to (equivalent to ) and the GS sample to (equivalent to ). Considering all the test results of Hyodo et al. [19], = −0.74–0.0 can be attributed to the GS, while – to the WS samples. Moreover, values calculated for all WS test results shown in Figure 3 were between 0.167 and 0.47; i.e., they were all much above the measured values of the GS test results.
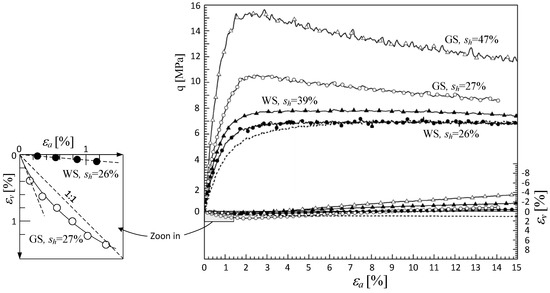
Figure 4.
Triaxial test results for gas-saturated MHBS [19]. For all tests: host soil = Toyoura sand, cell pressure = 13 MPa, pore fluid pressure = 10 MPa (gas and water pressures for GS and WS, respectively), temperature = 5 °C, porosity = 0.389–0.397.
Further evidence for the drastic decrease in Poisson’s ratio, , can be inferred from the ultrasonic measurements in Priest et al. [27]. This work showed a comparison of different velocity waves between GS MHBS, using the “excess gas” hydrate formation method, and WS MHBS, using the “excess water” method. Although this was not the same WS formation method as used in Hyodo et al. [19], similar dilation characteristic may be attributed to different hydrate morphologies when WS testing conditions are used, as shown by Pinkert [35] upon the test results of Masui et al. [20]. Figure 5 shows the ratio between pressure wave velocities, , and shear wave velocities, , for both GS and WS MHBS at a wide range of hydrate saturations. As can clearly be seen in the figure, the ratio was much lower for the GS test results than those measured for the WS test results. Based on the linear-elastic theory and the commonly-used relation between velocity waves and elastic properties, Poisson’s ratio can be evaluated by:
where M and G are the longitudinal modulus and shear modulus, respectively. Using this expression for (in the figure), all WS test results were associated with , and all GS test results were associated with . Specifically, for = 0.5 MPa (to compare the same pressure conditions), for the WS test results, and was extracted for the GS test results. Since and are associated with the sediment bulk and shear modulus, respectively, it can be inferred that the shear resistance of GS MHBS may be significantly higher (for a given bulk resistance) than in WS MHBS. This paper hypothesizes that the unique GS dilation response was associated with additional shear resistance characteristics (than WS) as detailed below.
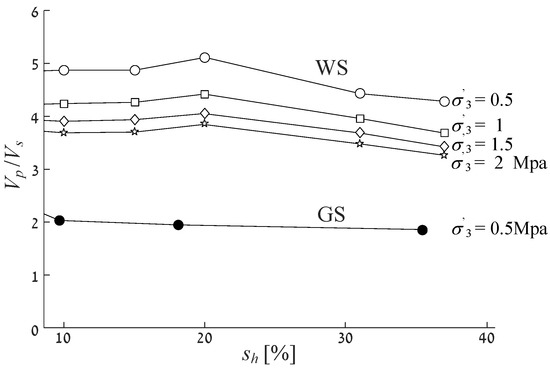
Figure 5.
ratio as a function of hydrate saturation; filled and empty symbols denote GS and WS testing conditions, respectively. By Priest et al. [27].
3. Fundamental Difference between GS and WS MHBS
3.1. Stress–Dilatancy Response
The stress–dilatancy representation of all given WS MHBS (shown in Figure 3) indicated that “true” cohesion may not be attributed to WS testing conditions. Figure 6 shows all available triaxial test results from Hyodo et al. [19], depicted on the “stress–dilatancy” axes, of GS hydrate-bearing Toyoura sand samples and WS Toyoura sand samples. As can be seen, and as expected in standard sands, the hydrate-free Toyoura sand results (in filled symbols) followed a linear trend-line stretching from the origin. Such a linear trend can also be expected for all WS test results, as concluded by Pinkert [33] and Pinkert [35], and can be inferred from Figure 3. The solid line in the figure represents Equation (3) for (depicted from Pinkert [35] for Toyoura sand) and , which well represented the behavior of the two tests. Without exception, all the GS MHBS results were situated higher (in the graph) for larger values. This trend was similar to the effect of cement in sands, as shown in Figure 2b. Some results, (1) MPa, , and (2) MPa, , seemed to follow Equation (3)’s trend for (marked by the dashed lines in the figure). In addition, other GS test results exhibited negative values, which was opposite all given WS test results (Figure 3). As described in the figure, negative values of denote lateral contraction, and positive values denote lateral expansion. These test results were unique in their accuracy in volumetric changes measurements because they were executed by using a special double-wall cell equipment [19]. Therefore, although only a few GS test results were shown, they clearly showed different mechanical trends from the WS test results.
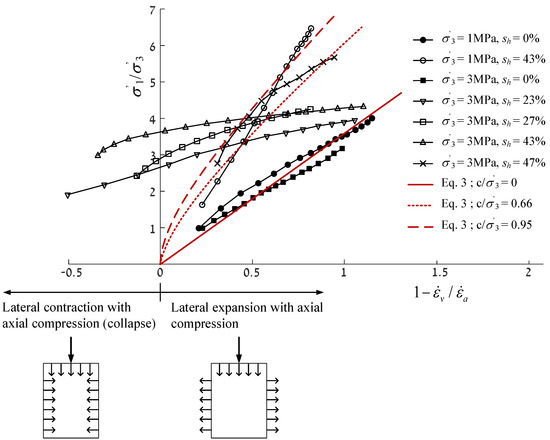
Figure 6.
Triaxial test results of gas-saturated MHBS [19], represented on the and axes.
As shown in Figure 6, the consistent situation of GS MHBS results being higher (in the graph) than the WS results may refer to the development of cohesion forces. Since cohesive soils enable carrying of tension forces, two mechanisms for the development of internal forces in GS MHBS are suggested and detailed in the two following sections:
3.2. Adhesion Due to Capillary Forces
To address the mechanical differences between WS and GS MHBS shown above, a conceptual comparison to differences between saturated and unsaturated clay, respectively, is suggested. The stress dilatancy concept in saturated clay was demonstrated using the drained triaxial test results on the saturated Fukakusa clay of Ye et al. [44] in Figure 7b. The figure shows the drained triaxial test results of normally-consolidated and over-consolidated saturated clays, both of which followed the same stress–dilatancy curve, though they experienced different stress and kinematic responses when presented as a function of (given in Ye et al. [44]). It is therefore concluded that the overconsolidation ratio did not involve true cohesion (can be related to apparent cohesion via a standard failure criterion such as that of Mohr–Coulomb), but affects the kinematic behavior of the clay, which indirectly influences the stress response. This behavior is well characterized in critical state theories such as the Cam–Clay model, in which the size of the failure envelope is governed by plastic flow and not by modification of the strength properties. However, different behavior was observed in unsaturated clays. Figure 7a shows drained triaxial test results of both fully-saturated and partially-saturated Pearl clay [45], in which the unsaturated samples did not follow the same stress–dilatancy response (curve) as the fully-saturated samples, but instead were positioned higher in the graph. Numerically, the saturated sample in the figure refers to (solid line), and the two unsaturated samples in the figure, with suctions of 100 and 150 kPa, refer to 0.25 and 0.5, respectively (according to Equation (3)); represented by the dashed lines. As an amplified stress–dilatancy response may be related to cementation interactions, it may also be related to inter-granular tension forces developed in unsaturated clays due to absorption or capillary forces [46]. The modification of MHBS strength under gas saturation can be compared to the increase in strength in unsaturated clays by using the characteristics detailed below.
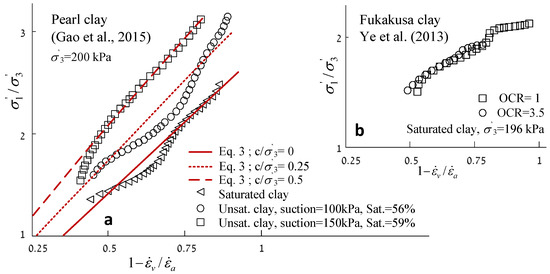
Figure 7.
Stress-dilatancy representation of drained triaxial test results of (a) unsaturated clays in different applied suctions and water saturations, and (b) saturated clays in different overconsilidation ratios. Modified from Gao et al. [45] and Ye et al. [44], respectively.
Fully-water-saturated and fully-gas-saturated sands are generally expected to exhibit similar mechanical responses [47]. In contrast, the mechanical responses of WS and GS MHBS were dissimilar (Figure 3 vs. Figure 6). It is suggested here that the essential difference between sands and methane-hydrate sediment is that MHBS cannot be entirely gas-saturated (without water) since thin films of water develop between the quartz grains and the hydrate (as mentioned before; Bonnefoy et al. [43] and Chaouachi et al. [41]). Therefore, while water-saturated MHBS comprises three phases (solid, hydrate, and water), gas-saturated MHBS possesses four phases (solid, hydrate, gas, and water), as illustrated in Figure 8. Beyond this schematic difference between the GS and WS morphologies in the figure, one should note that the structure of hydrate in the pores might be different between the two morphologies (not similar, as drawn in Figure 8). This difference may stand in equivalence to the difference between saturated and partly-saturated clays, in which a small amount of water makes the mechanical difference through absorption and capillary forces.
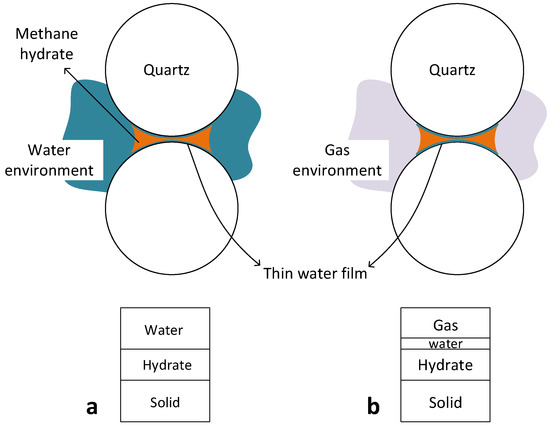
Figure 8.
Qualitative description of the three-phase composition of WS MHBS (a) and the four-phase composition of GS MHBS (b), as well as the developed water film between sand grains and methane-hydrate.
In general, hydrate that is formed in a gas environment is expected to crystallize between grain contacts, where water moisture is trapped (capillaries). Accordingly, thin water films also develop between grain contacts. Similar to how films of water may develop inter-granular tension forces in clay, the water films that occur in GS MHBS (Figure 8) may involve tension forces between grain contacts to the extent of tens of kPa. Such tension forces may affect the overall mechanical stress–dilatancy relationship. The thin water film phenomenon in GS MHBS can also explain adhesive forces that were observed in direct micro-scale measurements. Jung et al. [29] measured tensile stresses greater than 160 kPa between a calcite substrate and a methane-hydrate droplet. Because the hydrate droplet was tested in a gassy environment (i.e., surrounded by methane gas), it is hypothesizes that if the experiments would have been conducted in a wet environment, a significantly lower adhesion would have been measured, just as WS MHBS did not show an overall cohesive nature.
3.3. Tensile Resistance Due to Continuous Hydrate–Hydrate Connections
One may consider these hydrate–sand capillary forces as low impact contacts relative to other effects related to the high pressures in MHBS. Although this hydrate–sand adhesion may be neglected in the sediment, hydrate–hydrate cementation does exist. Thus, in the case of high hydrate saturation, a continuous stiff hydrate bridge may be developed through the whole MHBS’s pore space. In that case, the hydrate by itself may carry tension or shear loads. If the hydrate is formed between the grain contacts (illustrated in Figure 1), as performed in Hyodo et al. [19], such a connection may be developed at roughly (according to Waite et al. [16] and the illustration in Figure 1). This may be the reason for the overall cohesive nature of GS MHBS.
However, in WS MHBS, before testing, the free gas in the sample was replaced by water. The water is typically designed with lower methane consecration than the maximum solubility threshold, to prevent additional hydrate formation and to avoid hydrate blockages. Thus, some hydrate may be dissociated due to methane dissolvement during the water saturation process, which in turn damages the continuous hydrate bridge and disables the sediment from carrying the tensile loads. This constitutes a technical interpretation for the difference between GS and WS MHBS in their resistance to tensile loads, or alternatively, in their ability to develop shear resistance regardless of the frictional contribution of MHBS.
4. Compaction Mechanism of MHBS with Initial Shearing
Two mechanisms regarding the internal tension bearing system are presented above. For both cases, the specimen is capable of carrying compression loads to some extent. In shearing, when relative grain movement develops, the adhesion contacts may break, where (1) continuous hydrate bridges may collapse or (2) the tight hydrate–quartz geometric fitting that emerges due to the adhesion forces is destroyed. This mechanism may address the phenomenon of lateral contraction with initial axial loading (Figure 4 and Figure 6), as illustrated in Figure 9. In the figure, the soil-hydrate skeleton that initially supported the high hydrostatic stress underwent volumetric contraction with initial shearing due to hydrate breakage. As part of this process, lateral contraction took place, fitting the hydrostatic stress to the new, degraded, sediment compressibility.
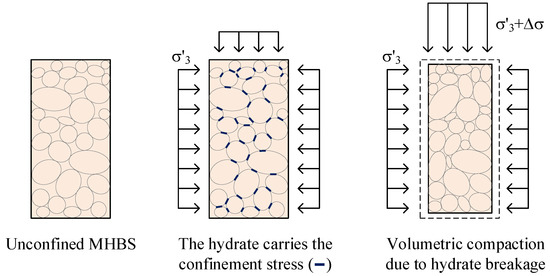
Figure 9.
Illustration of volumetric contraction due to hydrate breakage as deviatoric stress is applied.
A similar link between internal cementation and amplified initial compaction can be found in the work of [48]. This work examined sand with different degrees of cementation (cement content) in triaxial testing. Similar to the GS MHBS, cemented sand samples exhibited both higher strength and initial lateral compaction (than pure sand). For example, for sand samples confined by 1.72 MPa [48], a clear trend of decrease in (Equation (4)) was shown for higher cement content; for example, = 0.28, 0, and −0.15 were calculated for cementation content of 0%, 6%, and 12%, respectively.
5. Discussion and Conclusions
This paper discusses the unique dilatancy behavior of gas-saturated (GS) methane hydrate-bearing sediment (MHBS). The unique mechanical features are discussed by comparing the mechanical behavior of GS to water-saturated (WS) MHBS. First, GS MHBS exhibited lateral contraction with initial axial loading, while WS specimens showed initial lateral expansion. Second, combined analysis of both stress and strain responses of drained triaxial test results showed that all WS MHBS results followed the same stress–dilatancy relationship, while GS MHBS results, in contrast, showed higher stress–dilatancy relations for higher hydrate saturation (Figure 3 vs. Figure 6). This work hypothesized that both phenomena were related to internal tensile forces developed under GS testing conditions.
In shearing, internal relative grain movements disturb the tension resistance, which, in turn, results in hydrostatic contraction without changing the stress confinement level. Such a phenomenon is possible in GS MHBS, where tension forces may exist, but do not appear in WS MHBS. This explanation addresses the experimental observation of Hyodo et al. [19] regarding the comparison of lateral compaction results between GS and WS MHBS. A similar difference in such dilatancy behavior can also be noticed between pure sand and cemented sand [48] (which develops internal tension forces). Further evidence for this dilatancy characteristic in GS MHBS is the comparison of Poisson’s ratio (evaluated from measurements of Priest et al. [27]) between GS and WS MHBS.
The findings regarding the evidence of the internal tensile forces in GS are based on extensive experimental data of WS MHBS (Figure 3) and the experimental work of Hyodo et al. [19] for the GS MHBS data. The analytical fit with the experimental results showed that cohesion ratios of up to can be attributed to the GS MHBS. However, because the work of Hyodo et al. [19] includes only five GS test results (with high precision of volume change measurement that cannot be currently found elsewhere), this paper did not aim at quantifying the geotechnical parameters, but discussed the clear trends that could be inferred from all given test results. The mechanical trends that were found in the GS MHBS test results deviated, without exception, from what we expected in WS test results at similar testing conditions. To explain this apparent deviation, two conceptual mechanisms of GS MHBS were suggested; (1) adhesion due to capillary forces that may be developed in a mechanism similar to that for unsaturated soils and (2) a continuous hydrate bridge throughout the whole pore-space (which may be damaged in WS samples). The first mechanical option was based on a mechanical pore-scale phenomenon, which resulted from the fact that thin water films always existed between hydrate and soil grains, which yielded capillary forces in a gas environment. The second option refers to an experimental procedure (water saturation) at the sediment scale (macro-scale). This paper concluded that the global mechanical difference between GS and WS MHBS may be a result of either one of the phenomena or both.
The paper suggested that GS MHBS can be characterized as a four-phase sediment (quartz, hydrate, gas, and a small amount of water), while WS MHBS was a three-phase composition (quartz, hydrate, and water). Therefore, a conceptual comparison of GS MHBS to unsaturated clay is suggested, regarding both the stress–dilatancy and the suction associated with the water films. In clays, the suction can be a natural outcome of phenomena such as capillarity and absorption [49] and amplified at low values of saturation. In GS MHBS of a granular medium, the water saturation of all water films did not exceed a few percentages of saturation (a function of surface area and the water film width). The suction response in water films at GS MHBS may be an outcome of capillary forces, hydrate–water–grain Van-Der-Waals forces [43], or absorptions [50].
This work showed that mechanical differences between MHBS under water and gas saturation may be addressed using a systematic mechanical interpretation. Therefore, we suggest that alternative conceptual modeling approaches (than those used in the past for WS MHBS) are needed for proper characterization of the mechanical behavior of gas-saturated methane-hydrate-bearing sands.
Funding
This research received no external funding.
Acknowledgments
The author wishes to thank Yonatan Younessi in the development of Figure 1.
Conflicts of Interest
The authors declare no conflict of interest.
References
- Makogon, Y.F.; Holditch, S.A.; Makogon, T.Y. Natural gas-hydrates—A potential energy source for the 21st Century. J. Pet. Sci. Eng. 2007, 56, 14–31. [Google Scholar] [CrossRef]
- Dai, J.; Banik, N.; Gillespie, D.; Dutta, N. Exploration for gas hydrates in the deepwater, northern Gulf of Mexico: Part II. Model validation by drilling. Mar. Pet. Geol. 2008, 25, 845–859. [Google Scholar] [CrossRef]
- Tamaki, M.; Fujii, T.; Suzuki, K. Characterization and prediction of the gas hydrate reservoir at the second offshore gas production test site in the eastern Nankai Trough, Japan. Energies 2017, 10, 678. [Google Scholar] [CrossRef]
- Sadeq, D.; Iglauer, S.; Lebedev, M.; Rahman, T.; Zhang, Y.; Barifcani, A. Experimental pore-scale analysis of carbon dioxide hydrate in sandstone via X-Ray micro-computed tomography. Int. J. Greenh. Gas Control. 2018, 79, 73–82. [Google Scholar] [CrossRef]
- Sadeq, D.; Alef, K.; Iglauer, S.; Lebedev, M.; Barifcani, A. Compressional wave velocity of hydrate-bearing bentheimer sediments with varying pore fillings. Int. J. Hydrog. Energy 2018, 43, 23193–23200. [Google Scholar] [CrossRef]
- De-La-Fuente, M.; Vaunat, J.; Marín-Moreno, H. Thermo-Hydro-Mechanical Coupled Modeling of Methane Hydrate-Bearing Sediments: Formulation and Application. Energies 2019, 12, 2178. [Google Scholar] [CrossRef]
- Kvenvolden, K.A. Potential effects of gas hydrate on human welfare. Proc. Natl. Acad. Sci. USA 1999, 96, 3420–3426. [Google Scholar] [CrossRef] [PubMed]
- Collett, T.S.; Lewis, R.; Uchida, T. Growing interest in gas Hydrates. Schlumberger Oilfield Rev. Mag. 2000, 12, 42–57. [Google Scholar]
- Moridis, G.; Collett, T.S.; Pooladi-Darvish, M.; Hancock, S.H.; Santamarina, C.; Boswell, R.; Kneafsey, T.J.; Rutqvist, J.; Kowalsky, M.B.; Reagan, M.T.; et al. Challenges, Uncertainties, and Issues Facing Gas Production From Gas-Hydrate Deposits; Society of Petroleum Engineers: Richardson, TX, USA, 2011. [Google Scholar]
- Merey, S.; Al-Raoush, R.I.; Jung, J.; Alshibli, K.A. Comprehensive literature review on CH4-CO2 replacement in microscale porous media. J. Pet. Sci. Eng. 2018, 171, 48–62. [Google Scholar] [CrossRef]
- Castellani, B.; Gambelli, A.M.; Nicolini, A.; Rossi, F. Energy and environmental analysis of membrane-based CH4-CO2 replacement processes in natural gas hydrates. Energies 2019, 12, 850. [Google Scholar] [CrossRef]
- Kezirian, M.T.; Phoenix, S.L. Natural Gas Hydrate as a Storage Mechanism for Safe, Sustainable and Economical Production from Offshore Petroleum Reserves. Energies 2017, 10, 828. [Google Scholar] [CrossRef]
- Sloan, E.D.; Koh, C.A. Clathrate Hydrates of Natural Gases, 3rd ed.; CRC Press: Boca Raton, FL, USA, 2008. [Google Scholar]
- Helgerud, M.B.; Dvorkin, J.; Nur, A.; Sakai, A.; Collett, T. Elastic-wave velocity in marine sediments with gas hydrates: Effective medium modeling. Geophys. Res. Lett. 1999, 26, 2021–2024. [Google Scholar] [CrossRef]
- Kvenvolden, K.A.; Lorenson, T.D. The global occurrence of natural gas hydrates. In Natural Gas Hydrates: Occurrence, Distribution, and Detection; Paull, C.K., Dillon, W.P., Eds.; Geophysical Monograph Series; AGU: Washington, DC, USA, 2001; Volume 124, pp. 3–18. [Google Scholar]
- Waite, W.F.; Santamarina, J.C.; Cortes, D.D.; Dugan, B.; Espinoza, D.N.; Germaine, J.; Jang, J.; Jung, J.W.; Kneafsey, T.J.; Shin, H.; et al. Physical properties of hydrate-bearing sediments. Rev. Geophys. 2009, 47. [Google Scholar] [CrossRef]
- Uchida, S.; Klar, A.; Yamamoto, K. Sand production model in gas hydrate-bearing sediments. Int. J. Rock Mech. Min. Sci. 2016, 86, 303–316. [Google Scholar] [CrossRef]
- Klar, A.; Deerberg, G.; Janicki, G.; Schicks, J.; Riedel, M.; Fietzek, P.; Mosch, T.; Tinivella, U.; De La Fuente Ruiz, M.; Gatt, P.; et al. Marine Gas Hydrate Technology: State of the Art and Future Possibilities for Europe; Technical report, WG2 report, COST Action ES 1405; GEOMAR: Kiel, Germany, 2019. [Google Scholar] [CrossRef]
- Hyodo, M.; Li, Y.; Yoneda, J.; Nakata, Y.; Yoshimoto, N.; Nishimura, A.; Song, Y. Mechanical behavior of gas-saturated methane hydrate-bearing sediments. J. Geophys. Res. Solid Earth 2013, 118, 5185–5194. [Google Scholar] [CrossRef]
- Masui, A.; Haneda, H.; Ogata, Y.; Aoki, K. Effects of Methane Hydrate Formation on Shear Strength of Synthetic Methane Hydrate Sediments. In Proceedings of the 15th International Offshore and Polar Engineering Conference, ISOPE, Seoul, Korea, 19–24 June 2005; pp. 364–369. [Google Scholar]
- Priest, J.A.; Best, A.I.; Clayton, C.R.I. A laboratory investigation into the seismic velocities of methane gas hydrate-bearing sand. J. Geophys. Res. Solid Earth 2005, 110. [Google Scholar] [CrossRef]
- Jiang, M.J.; Yu, H.S.; Harris, D. Bond rolling resistance and its effect on yielding of bonded granulates by DEM analyses. Int. J. Numer. Anal. Meth. Geomech. 2006, 30, 723–761. [Google Scholar] [CrossRef]
- Winters, W.; Waite, W.; Mason, D.; Gilbert, L.; Pecher, I. Methane gas hydrate effect on sediment acoustic and strength properties. J. Pet. Sci. Eng. 2007, 56, 127–135. [Google Scholar] [CrossRef]
- Miyazaki, K.; Tenma, N.; Aoki, K.; Yamaguchi, T. A Nonlinear Elastic Model for Triaxial Compressive Properties of Artificial Methane-Hydrate-Bearing Sediment Samples. Energies 2012, 5, 4057–4075. [Google Scholar] [CrossRef]
- Hyodo, M.; Yoneda, J.; Yoshimoto, N.; Nakata, Y. Mechanical and dissociation properties of methane hydrate-bearing sand in deep seabed. Soils Found. 2013, 53, 299–314. [Google Scholar] [CrossRef]
- Pinkert, S.; Grozic, J.L.H. Experimental verification of a prediction model for hydrate-bearing sand. J. Geophys. Res. Solid Earth 2016, 121. [Google Scholar] [CrossRef]
- Priest, J.A.; Rees, E.V.L.; Clayton, C.R.I. Influence of gas hydrate morphology on the seismic velocities of sands. J. Geophys. Res. Solid Earth 2009, 114. [Google Scholar] [CrossRef]
- Soga, K.; Lee, S.L.; Ng, M.Y.A.; Klar, A. Characterisation and engineering properties of methane hydrate soils. In Characterization and Engineering Properties of Natural Soils; Tan, T.S., Hight, K.K.P.D.W., Leroueil, S., Eds.; Taylor and Francis: London, UK, 2006; Volume 4, pp. 2591–2642. [Google Scholar]
- Jung, J.W.; Santamarina, J.C.; Soga, K. Stress-strain response of hydrate-bearing sands: Numerical study using discrete element method simulations. J. Geophys. Res. 2012, 117. [Google Scholar] [CrossRef]
- Klar, A.; Uchida, S.; Soga, K.; Yamamoto, K. Explicitly coupled thermal-flow-mechanical formulation for gas hydrate sediments. SPE J. 2012, 18, 196–206. [Google Scholar] [CrossRef]
- Pinkert, S.; Grozic, J.L.H. Prediction of the mechanical response of hydrate bearing sands. J. Geophys. Res. Solid Earth 2014, 119, 4695–4707. [Google Scholar] [CrossRef]
- Hvorslev, M.J. Conditions of failure for remodeled cohesive soils. 1st ICSMFE 1936, 3, 51. [Google Scholar]
- Pinkert, S. Rowe’s stress–dilatancy theory for hydrate-bearing sand. Int. J. Geomech. 2016, 17, 06016008. [Google Scholar] [CrossRef]
- Rowe, P.W. The stress dilatancy relation for static equilibrium of an assembly of particles in contact. Proc. R. Soc. Lond. Ser. A 1962, 269, 500–527. [Google Scholar]
- Pinkert, S. The lack of true cohesion in hydrate-bearing sands. Granul. Matter 2017, 19, 57. [Google Scholar] [CrossRef]
- Abdulla, A.A.; Kiousis, P.D. Behavior of Cemented Sands—1. Testing. Int. J. Numer. Anal. Meth. Geomech. 1997, 21, 533–547. [Google Scholar] [CrossRef]
- Hyodo, M.; Yoshimoto, N.; Kato, A.; Yoneda, J. Shear strength and deformation of methane hydrate bearing sand with fines. In Proceedings of the International Conference on Soil Mechanics and Geotechnical Engineering, Paris, France, 2–6 September 2013. [Google Scholar]
- Zhang, J.; Salgado, R. Stress-dilatancy relation for Mohr-Coulomb soils following a non-associated flow rule. Géotechnique 2010, 60, 223–226. [Google Scholar] [CrossRef]
- DeLaFuente, M.; Vaunat, J.; Marín-Moreno, H. Composite model to reproduce the mechanical behavior of Methane Hydrate Bearing Sediments. In Energy Geotechnics, Proceedings of the 1st International Conference on Energy Geotechnics, ICEGT 2016, Kiel, Germany, 29–31 August 2016; CRC CRC Press: Boca Raton, FL, USA, 2016; pp. 483–489. [Google Scholar]
- Uchida, S.; Xie, X.G.; Leung, Y.F. Role of critical state framework in understanding geomechanical behavior of methane hydrate-bearing sediments. J. Geophys. Res. Solid Earth 2016, 121, 5580–5595. [Google Scholar] [CrossRef]
- Chaouachi, M.; Falenty, A.; Sell, K.; Enzmann, F.; Kersten, M.; Haberthür, D.; Kuhs, W.F. Microstructural evolution of gas hydrates in sedimentary matrices observed with synchrotron X-ray computed tomographic microscopy. Geochem. Geophys. Geosyst. 2015, 16, 1711–1722. [Google Scholar] [CrossRef]
- DeJong, J.; Fritzges, M.; Nüsslein, K. Microbially Induced Cementation to Control Sand Response to Undrained Shear. J. Geotech. Geoenviron. Eng. ASCE 2006, 132, 1381–1392. [Google Scholar] [CrossRef]
- Bonnefoy, O.; Gruy, F.; Herri, J.M. Van der Waals interactions in systems involving gas hydrates. Fluid Phase Equilibria 2005, 231, 176–187. [Google Scholar] [CrossRef]
- Ye, G.l.; Ye, B.; Zhang, F. Strength and Dilatancy of Overconsolidated Clays in Drained True Triaxial Tests. J. Geotech. Geoenviron. Eng. 2013, 140, 06013006. [Google Scholar] [CrossRef]
- Gao, Y.; Sun, D.; Zhou, A. Hydromechanical behavior of unsaturated soil with different specimen preparations. Can. Geotech. J. 2016, 53, 909–917. [Google Scholar] [CrossRef]
- Fredlund, D.G.; Morgenstern, N.R.; Widger, R.A. The shear strength of unsaturated soils. Can. Geotech. J. 1978, 15, 313–321. [Google Scholar] [CrossRef]
- Bishop, A.W. The principle of effective stress. Nor. Geotech. Inst. Oslo Nor. 1959, 32, 1–4. [Google Scholar]
- Lade, P.V.; Overton, D.D. Cementation Effects in Frictional Materials. J. Geotech. Eng. 1989, 115, 1373–1387. [Google Scholar] [CrossRef]
- McQueen, I.S.; Miller, R.F. Approximating soil moisture characteristics from limited data: Empirical evidence and tentative model. Water Resour. Res. 1974, 10, 521–527. [Google Scholar] [CrossRef]
- Olsen, R.; Leirvik, K.N.; Kvamme, B.; Kuznetsova, T. Molecular Dynamics Study of the Interactions Between Minerals and Gas Hydrate Species; AGU Fall Meeting: San Francisco, CA, USA, 2014. [Google Scholar]
© 2019 by the author. Licensee MDPI, Basel, Switzerland. This article is an open access article distributed under the terms and conditions of the Creative Commons Attribution (CC BY) license (http://creativecommons.org/licenses/by/4.0/).