1. Introduction
During the last two decades, the European Commission has issued a series of directives in order to improve the building energy efficiency and the exploitation of renewable energy sources with the aim to reduce the environmental costs of the energy consumption linked to building heating and cooling. These new rules are pushing all the European countries towards the diffusion of the concept of Near Zero Energy Buildings (NZEBs), following a strict and tight roadmap which requires all new buildings to be nearly zero-energy by the end of 2020. The design of NZEBs can start from a multi-objective optimisation of the building energy needs which determines important feedback for the selection of the envelope elements and of the HVAC components. In order to help designers comply with this goal, specific numerical tools able to manage both the energy dynamic simulation of the whole building-HVAC system and the strategy for the conduction of different multi-objective optimisation are needed. In the literature, multi-objective optimizations, based on the concept of “co-simulation”, are becoming more and more popular [
1,
2]. In these works, two or more software platforms are combined together in order to obtain detailed information about the observed system. As an example, Ferroukhi et al. [
1], coupled COMSOL and TRNSYS in order to evaluate the dynamic hygro-thermal behaviour of a building. Dols et al. [
2] combined CONTAM with Energy Plus with the aim of evaluating the indoor contaminant distribution in a multi-zone building. In many cases, the multi-objective optimization is obtained by using specific software (i.e., modeFRONTIER [
3] able to drive multiple Computed Aided Engineering (CAE) tools (i.e., TRNSYS and CFD software).
MATLAB allows one to achieve, within a unique environment, both dynamic building thermal simulation and multi-objective optimisation, avoiding “co-simulation” based on the combination of different software platforms thanks to the availability of specific toolbox like Optimization toolbox
TM and SIMULINK toolbox
TM [
4,
5]. The development of specific SIMULINK blocks for the dynamic analysis of thermal behaviour of a building and its HVAC system adopting a time step on the order of seconds was successfully proposed in the past. Riederer et al. [
6] introduced the SIMBAD library by demonstrating that a reliable room model can be efficiently obtained using SIMULINK. In the same year, the Solar Institute Juelich [
7] proposed the Conventional And Renewable eNergy Optimization Toolbox (CARNOT) blockset, a SIMULINK library for the dynamic analysis of HVAC systems. Later, Van Schijndel and De Wit [
8] developed WAVO, later upgraded and renamed HAMBASE in 2006, a program built in SIMULINK for the calculation of the thermal and hygrometric performance of a multi-zone building. The main advantage of building energy simulation software developed with SIMULINK is that this tool is suitable for modelling the complex control systems which are nowadays used in contemporary HVAC systems. In fact, as remarked by Wetter [
9], in traditional dynamic simulation software, like TRNSYS or EnergyPlus, the building and HVAC model is based on numerical solution algorithms that use discrete time representation of the building envelope dynamics that does not allow time step in the order of seconds, which is the typical time domain of the system control dynamics. In addition, the advantage to operate in a MATLAB/SIMULINK framework is that this platform is very well known and widely applied both in academic and professional environment and for this reason the potential user’s audience able to add new components to the library, both by designing directly new SIMULINK models or by using C-, Fortran-or MATLAB M-scripting languages is very large.
However, the success of these software based on SIMULINK has been scarce up to now, as proved by the actual limited diffusion of these libraries. The weak point of these libraries is the creation of the building model. In fact, up to now an automatic link between the SIMULINK environment and computer graphics software (CAD) in order to import the geometry of a complex building is not possible and the implementation of the complete energy building model in SIMULINK is left to the user by selecting and linking each to other the appropriate blocks from the library.
Since the authors are convinced of the huge potential of the development of a dynamic simulation open-source software based on SIMULINK toolbox, in this paper a new SIMULINK open blockset named ALMABuild, useful for the realization of single or multi-“thermal zone” building models is presented. The choice to distribute ALMABuild as an open toolbox source software is done with the aim to increase the diffusion of the building dynamic energy simulation among the designers and to enable each user to develop and share own models in order to accelerate innovations. ALMABuild is composed by several elementary blocks that are used to write and solve the energy balance equations, according to a lumped formulation scheme. The ALMABuild blocks are automatically linked to each other in order to obtain the energy balance of a thermal zone by means of a series of Graphical User Interfaces (GUIs). In this paper, the benchmarking of the ALMABuild SIMULINK blockset by following the BESTEST procedure [
10] and a series of comparisons with the results obtained following the EN ISO 52016 norm [
11] are presented with the aim of demonstrating the accuracy of the proposed approach for the analysis of the dynamic thermal behaviour of multi-“thermal zone” buildings.
2. The ALMABuild Rationale
The ALMABuild blockset is composed by a series of SIMULINK blocks useful for the thermal modelling of a multi-zone building.
The modelling is obtained by means of the following steps:
The building is subdivided into internal environments with assumed sufficiently uniform thermal conditions to enable a thermal balance calculation (thermal zone).
Each massive envelope element (i.e., walls, roofs, floors) of the thermal zone is modelled by means of a three thermal resistance + four capacitances (3R4C) network using a specific SIMULINK Building Massive Element (BME) block. Windows and heat transfer through gaps are modelled according to Elsherbiny et al. [
12] by means of a SIMULINK Building Clear Component (BCC) block.
The model of a thermal zone is obtained by connecting together BME and BCC blocks, linked to each massive building element or window of the zone; in this way the thermal balance of the zone is solved, according to different models, by means of a SIMULINK Building Thermal Balance (BTB) block having the BME’s and BCC’s blocks as inputs.
2.1. The ALMABuild Physics Model
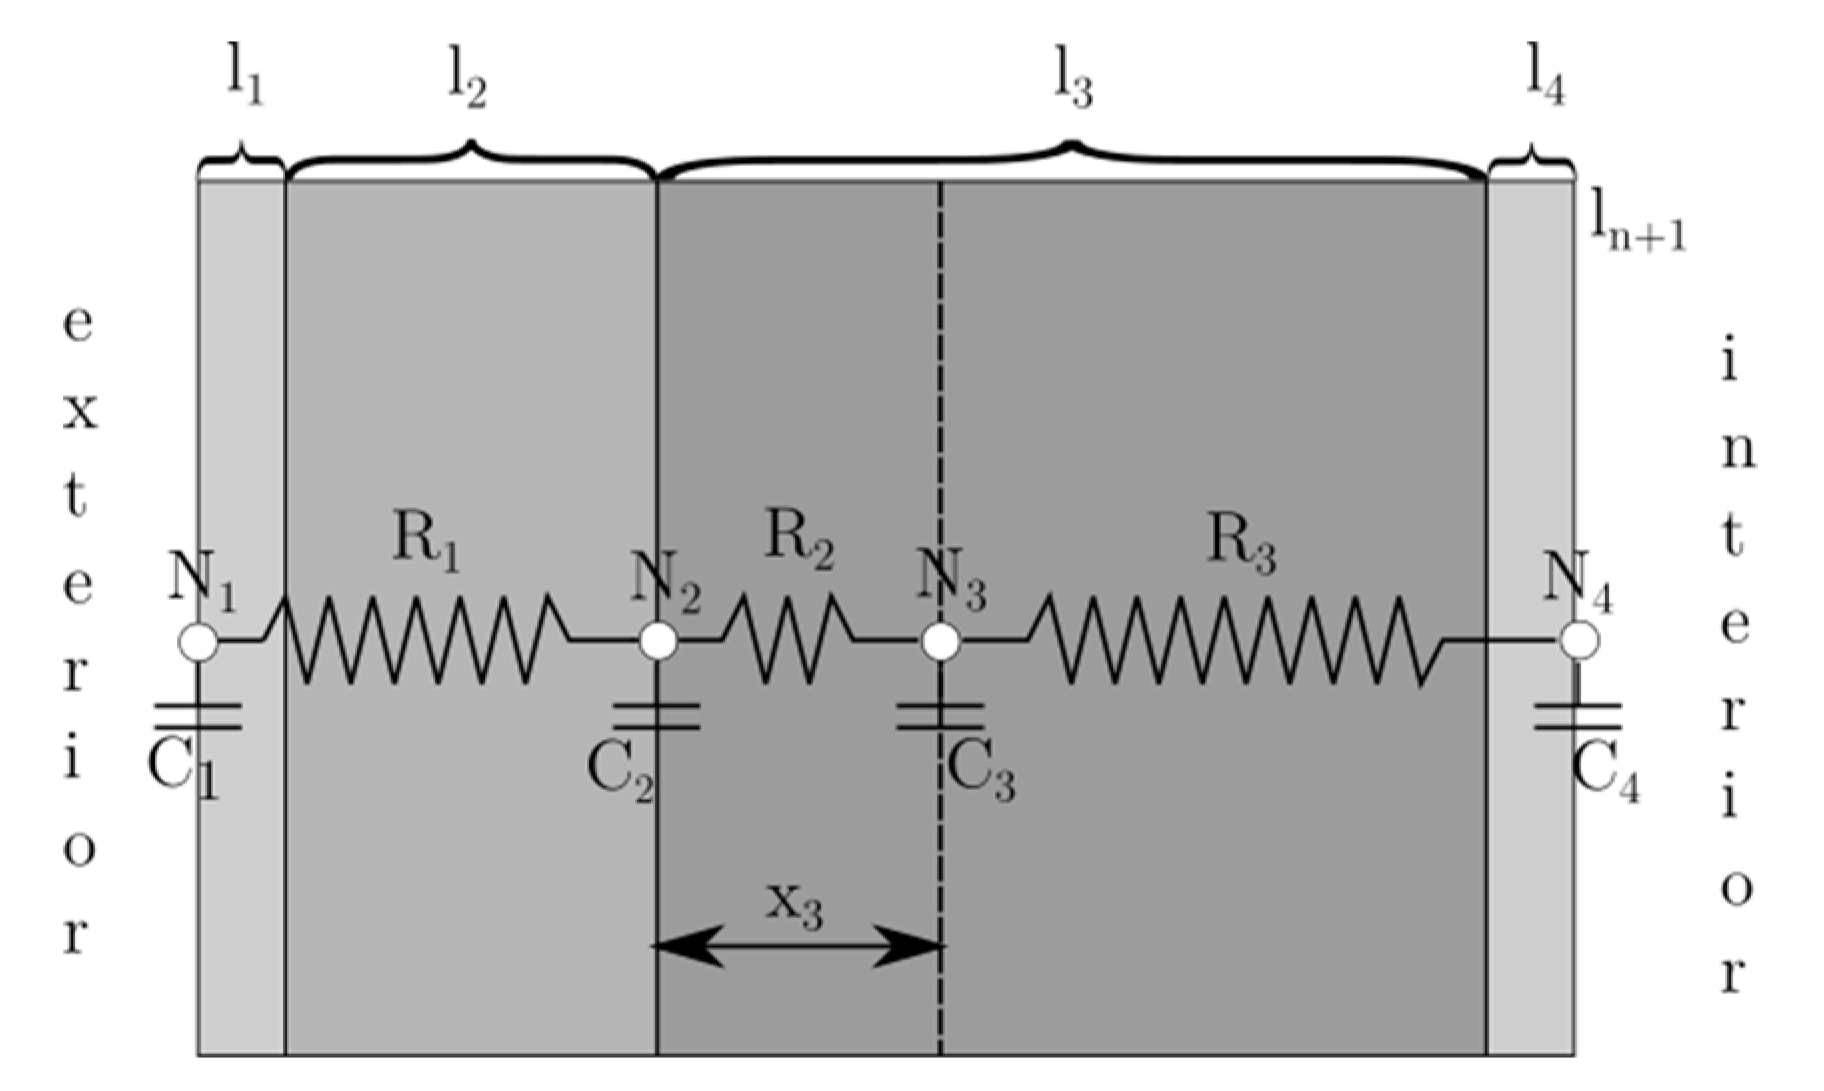
In
Figure 1, the stratigraphy of a multi-layer wall (composed by plaster, insulation, brick and plaster, from external to internal side) together with its equivalent RC network, in agreement with the BME 3R4C model, is represented. This figure shows that the 3R4C model adopted for the description of massive elements is composed by four nodes: two of them are positioned to the internal and external surface of the element (1 and 4), whilst the other two nodes are located in the interface between insulation (light) and brick (massive) layer (node 2) an where the first quarter of the total heat capacity is reached (node 3), starting from the external side. As it is possible to see from
Figure 1, the internal nodes of the RC network can be positioned everywhere in the wall stratigraphy, not only in the interface between two adjacent layers:
The position (
xc) and the wall layer (
lc) in which the first quarter of the total thermal capacity of the wall is reached can be found thanks to the following relationship:
where the layers are counted starting from the external wall layer (
i = 1).
The position of the thermal insulation is found by comparing the thermal conductivity of each wall layer:
Now, the positions of the internal nodes
N2 and
N3 can be obtained as:
After having determined the position of the four nodes of the RC network, thermal resistances that connect two adjacent nodes (Rj) are calculated as the sum of the thermal resistances of the BME layers that are contained within the two considered nodes, whilst thermal capacitance of a node is estimated as the sum of half the thermal capacity of the layers adjacent to the node.
The convective and radiative heat transfer coefficients, both for interior and exterior convective and radiative heat transfer between the surface of the element and surroundings, are evaluated according to EN 6946 [
13], whilst UNI 11300-1 [
14] is adopted for the evaluation of the “fictive” sky temperature and the calculation of the radiative heat transfer between external surface of the element and sky. In any case, expert users can modify the values of convective and radiative heat transfer coefficients, adopting specific values that can be more suitable for specific applications.
BCC blocks contain different RC network, depending on the number of panes of the windows. In detail, except for single glass windows, BCC RC networks contain
n thermal resistance and
n + 1 thermal capacitance, where
n is the number of panes of the window. By means of these RC models, the temperature of each pane is evaluated. The solar radiation entering to the thermal zone by the windows is distributed among the surface of the thermal zone, considering separately beam and diffuse components. Beam radiation is distributed among the surfaces by means a weighted mean of the areas, whilst the distribution of diffuse radiation, which is summed up the beam solar radiation that is reflected by the internal surfaces of the zone, is evaluated by means an algorithm similar to the one proposed in Judkoff and Neymark [
10].
Shadings due to disturbed horizon profile (e.g., due to the presence of mountains in the landscape), external objects and overhangs are accounted in ALMABuild evaluating the instantaneous shading factor for beam and diffuse solar radiation [
15].
Finally, a BTB block solves the thermal balance of the zone considering the convective and radiative heat transfer between the interior surface of each building element and the zone, according to different models. If the “simple” model is selected, a two-star model [
16] is adopted for the evaluation of the mean air temperature and the mean radiant temperature of the zone.; otherwise if a “detailed” model is chosen (convective [
17], radiative [
18] or fully detailed [
17]), the BTB block implements models that enable the evaluation of the spatial distribution of the air, radiant and operative temperature in the zone.
2.2. Development of Graphical User Interface (GUI)
The connection between blocks is made by means of customized vectors. A detailed description of all this kind of blocks can be found in Campana et al. [
19]. The blocks require different input data, such as wall stratigraphy for BME or optical glass and gap gas properties for BCC blocks. In addition, each building element (i.e., walls, roofs, floors, ceilings, windows) differ from each other in terms of exposure (internal, external or to ground), slope (vertical, inclined or horizontal) and area. Since the set of data needed for the description of each envelope element and of each thermal zone can be very large for complex buildings, a manual implementation of a multi-zone building can become highly time-consuming and a source of errors. This kind of problem is common to all the commercial software for dynamic energy simulations based on SIMULINK environment. In the first release of SIMBAD [
6], the most popular SIMULINK-based software for dynamic simulations, the users were not able to introduce multi-zone building models. So, to simulate a multi-zone building the user had to combine several mono-zone buildings and to connect them manually. This procedure was recognized as an important source of errors and, for this reason, in the most recent versions of SIMBAD a specific building description interface named SIMbad Building Description Interface (SIMBDI) [
20] was developed. SIMBDI is a graphical user interface that allows the user to draw the building and to enter all input data interactively. By means of SIMBDI, the user is driven to insert the complete set of building input data; the program automatically introduces these data within the vectors and matrixes needed by the SIMBAD multi-zone building model for the solution of the set of the governing equations.
In ALMABuild, a similar way has been used in order to drive the implementation of the building model. Like in the last versions of SIMBAD, also in ALMABuild the introduction of the building input data is obtained by means of Graphical User Interfaces (GUIs), developed in MATLAB, but the main advantage of ALMABuild with respect to SIMBAD is that the creation of the SIMULINK model is completely automatized. In addition, since ALMABuild is developed by an academic institution as an open-source library, each user can create, modify and add new blocks and GUIs to ALMABuild; this option is not possible with SIMBAD.
Starting from the main interface of ALMABuild, the user is driven towards the construction of the building energy model by a series of specific interfaces, each one linked to a specific aspect of the building modelling. The GUIs available for the introduction of the building input data in ALMABuild are the following:
- (1)
Weather data GUI, which guides the user to define the weather data by using the METEONORM database [
21] or, only for Italy, the TRY defined by the CTI database [
22];
- (2)
Structures GUI, by means of which the user defines the main characteristics of massive elements; specific GUI’s are dedicated to special building elements (i.e., Slab on grade floor, windows, shutters, curtains);
- (3)
Orientation GUI, by means of which a specific orientation is linked to each envelope element;
- (4)
Thermal zone GUI, which drives the user to the definition of the position of a thermal zone in the building. The user can choose between a manual definition of the thermal zone position or he can import the geometric properties of the building from a SketchUp project;
- (5)
Thermal zone properties GUI, by means of which the main characteristics of the thermal zones (in terms of set-point temperature, occupancy profiles and so on) and the envelope elements that compose the thermal zone, can be defined. Moreover, by means of this GUI the typology of model adopted for solving the thermal balance of the zone can be selected.
The data introduced by means of GUIs are then collected in two MATLAB structures, named “Ambient Data” and “Building Data”, by means of which the input data are shared among the other SIMULINK blocks. In addition, a series of specific interfaces have been developed to allow the user to modify the input data, adding or erasing elements or thermal zones. In this way, by recalling a MATLAB function from the ALMABuild main interface, all the elementary SIMULINK blocks are taken from the ALMABuild library, filled with the input data and connected each other in SIMULINK, in a fully automatic way without any active role of the user.
Following this procedure, the data required by each block are automatically set in a correct format to be exchanged among the blocks. In this way the model of a building can be created in SIMULINK in a short time by reducing the possibility to make mistakes during the input data upload. Therefore, the user can concentrate his attention on the building physics, avoiding to spend time on computational aspects. Moreover, during the creation of the building model in the Simulink desktop, the annual profile of the incident solar radiation over the external building surfaces (considering their slope and orientation) is calculated following the Perez model [
23]. The same is done for the evaluation of the annual profile of instantaneous shading factors. In this way, the computational effort during the building energy simulations is reduced, since all the weather data are already available as an input data for the whole duration of the simulation.
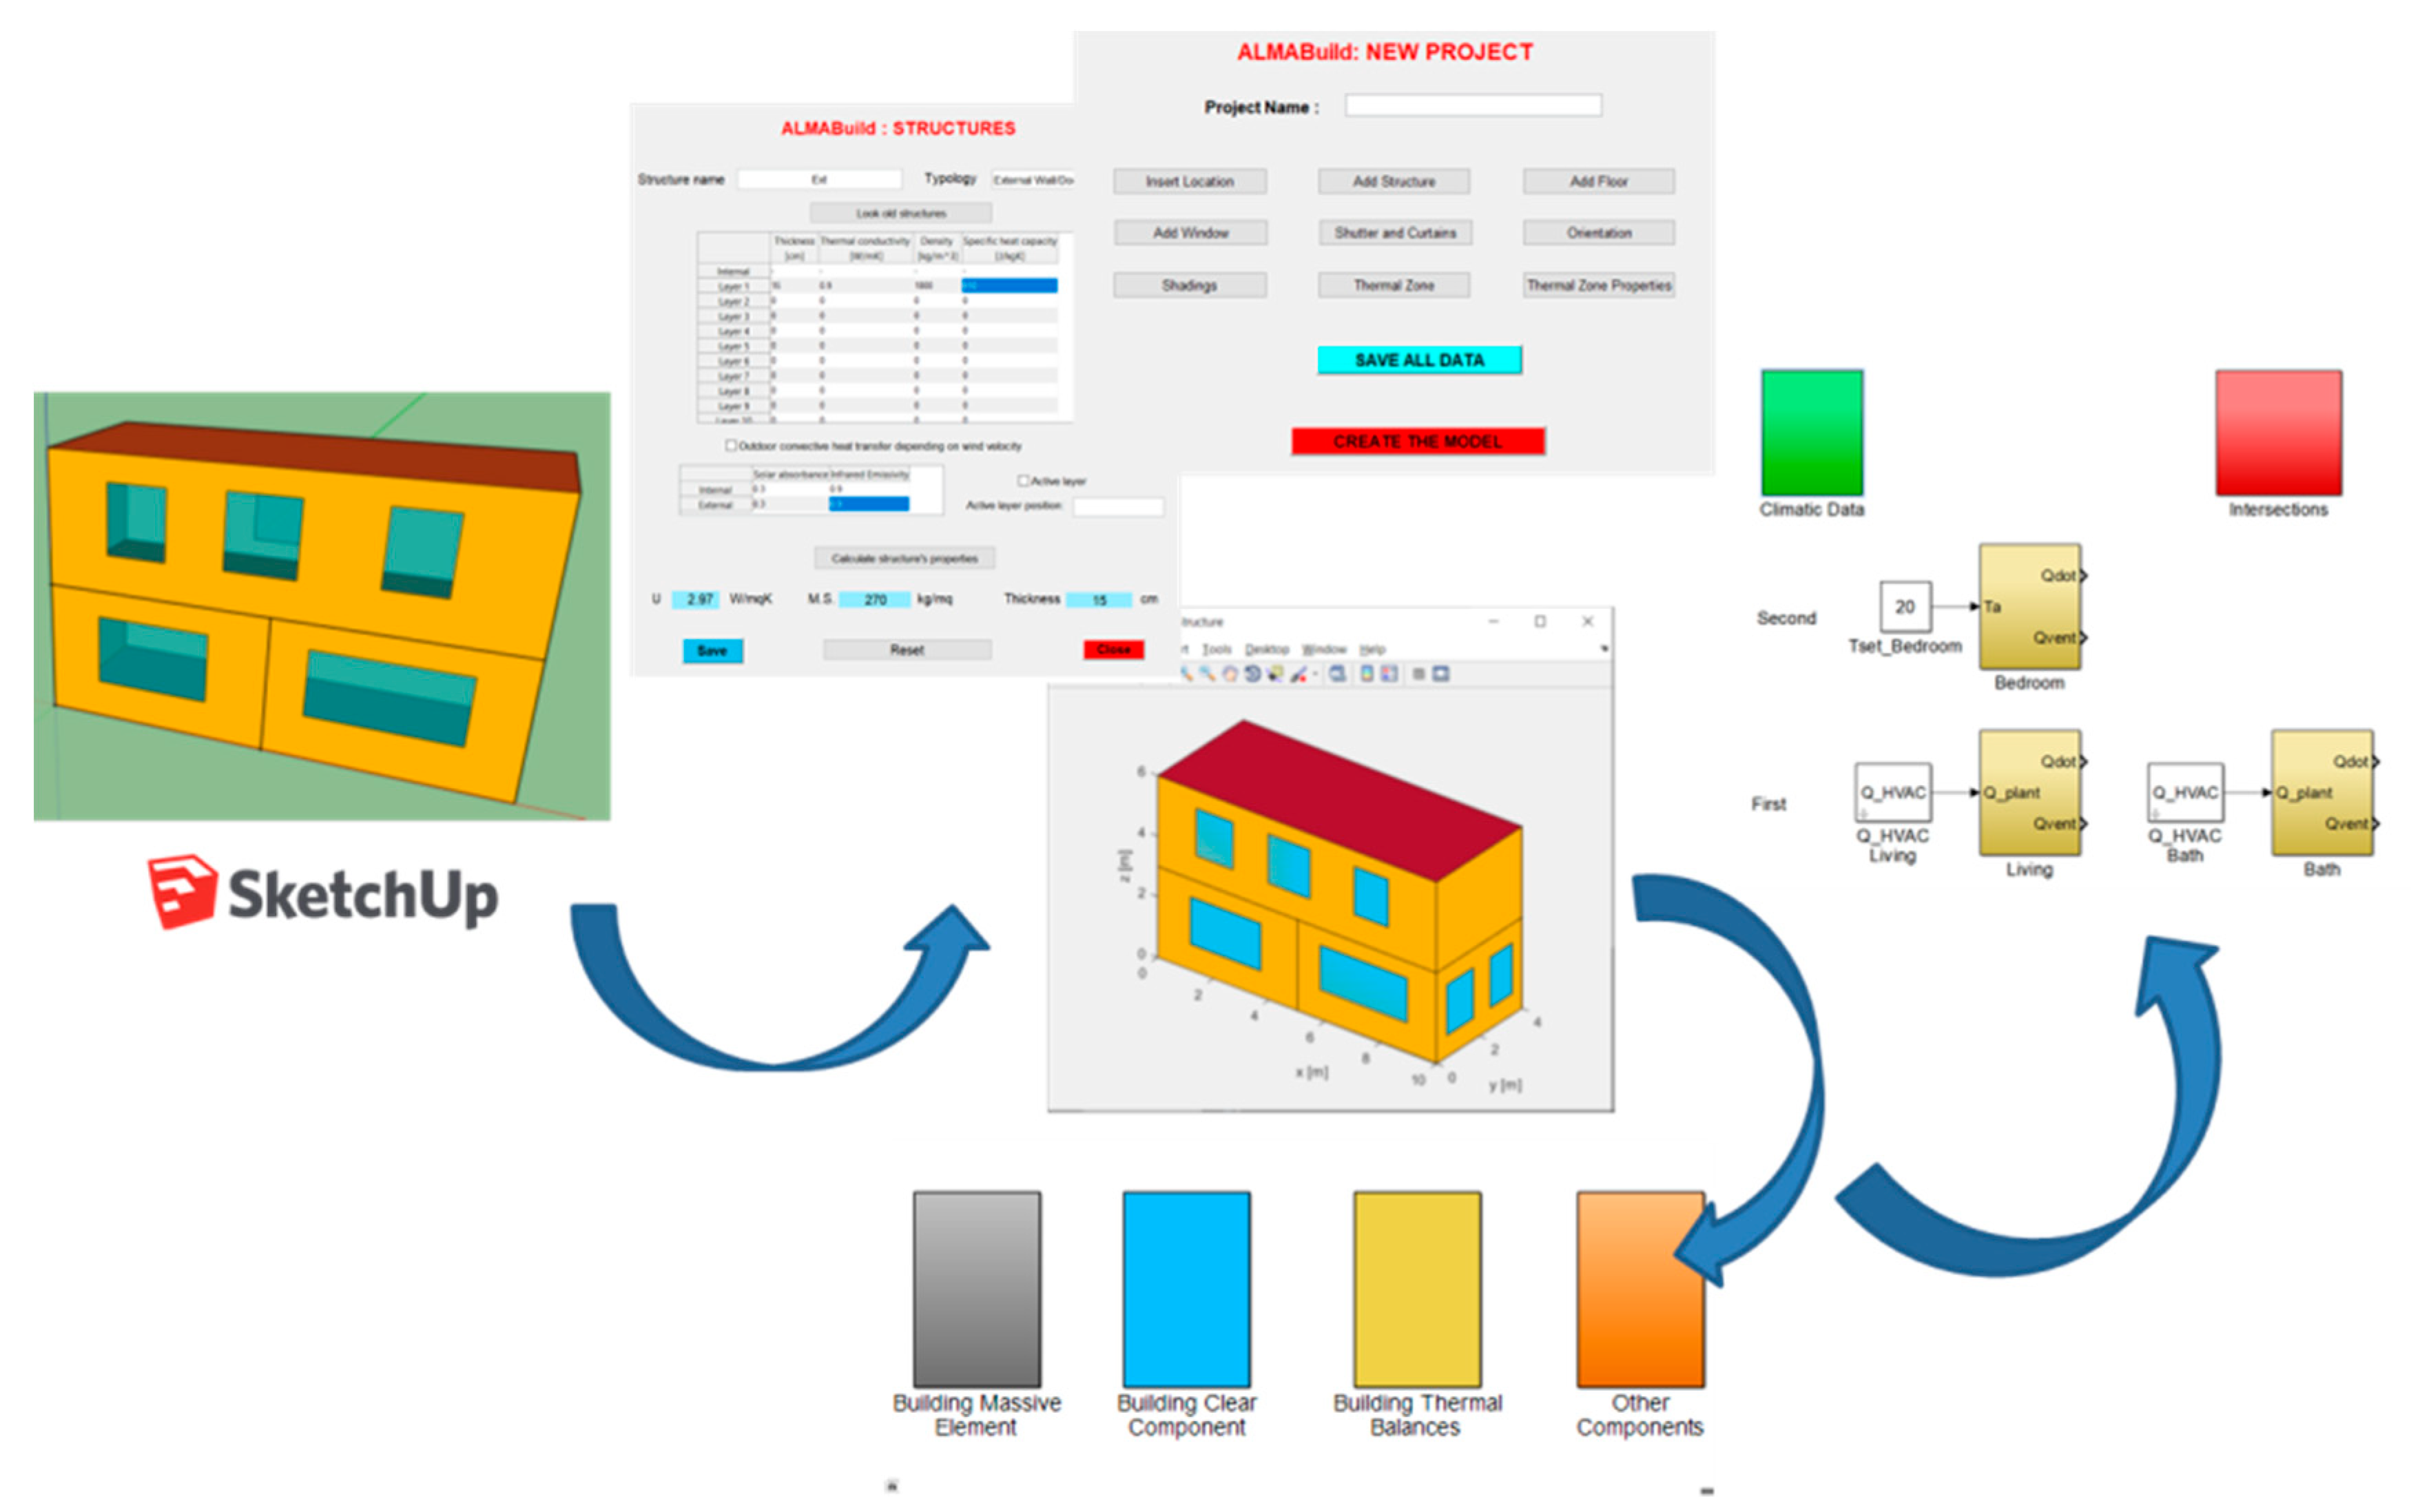
Figure 2 shows the rationale of the creation of a SIMULINK model by means of the ALMABuild GUI-based procedure. By observing in
Figure 1 the typical structure of an ALMABuild model in the SIMULINK desktop, four block types are present:
The “climatic data” block (in green in
Figure 2);
The “thermal zone” blocks (in yellow in
Figure 2);
The “intersections” block (in red in
Figure 2);
The “HVAC” block (in white in
Figure 2).
The “climatic data” block recalls from the MATLAB workspace the data collected in the “Ambient Data” structures (i.e., hourly values of external air temperature, humidity, wind velocity, solar radiation over external building surfaces) and calculates the fictive sky temperature. From
Figure 2 it can be noticed that the “climatic data” block has no output ports: the output vector of the climatic data block is connected to the other blocks by means of the “Goto” Simulink command.
In each “thermal zone” block, the elementary BME and BCC blocks linked to the envelope components (walls, roofs, windows…) are collected to the BTB block. The “intersection” block allows to model the heat transfer across the partition walls which separate different thermal zones. The BME blocks of these internal structures interact with the “thermal zone” block by means of the SIMULINK “Goto” and “From” commands. In fact, the “intersection” block receives as input from the “thermal zone” block the temperature and the incoming solar radiation of the involved zones; on the other hand, the “intersection” block gives as output to the “thermal zone” block the heat fluxes exchanged by the intersection elements.
The “thermal zone” block works with two bus signals: the “Power bus”, which contains all the heat fluxes involved on thermal balance of both the zone and each envelope element, and the “Ventilation bus”, where heat fluxes and air mass flows due to ventilation are contained.
The air and mean radiant temperature of the thermal zone, collected in the “Temperature zone bus”, are exchanged among the blocks by means of a “Goto” command. Once the thermal zone blocks have been created, the user has to connect these blocks with the “HVAC” block which defines the main characteristics of the heating/cooling plant. The connection between the HVAC block and the “thermal zone” block is obtained by means of the “Power bus”, that in this case contains as non-zero elements the convective and radiative part of the thermal power released by the HVAC emitters to the room. In order to guarantee the compatibility of ALMABuild with CARNOT, a well-known SIMULINK library of HVAC components, a conversion block able to translate the CARNOT S-vector in a format compatible with the ALMABuild blocks has been developed. In this way, it is possible to use in ALMABuild all the blocks available in the CARNOT library for the modelling of the main HVAC components (i.e., boilers, thermal solar panels, thermal storage and so on).
3. The ALMABuild Validation
The ALMABuild benchmark has been conducted by following the approach described by the Building Energy Simulation Test (BESTEST) reported by Judkoff and Neymark [
10]. This approach has been followed for the validation of the main dynamic building energy simulation programs, like TRNSYS, ESP-r, EnergyPlus and, more recently DeST [
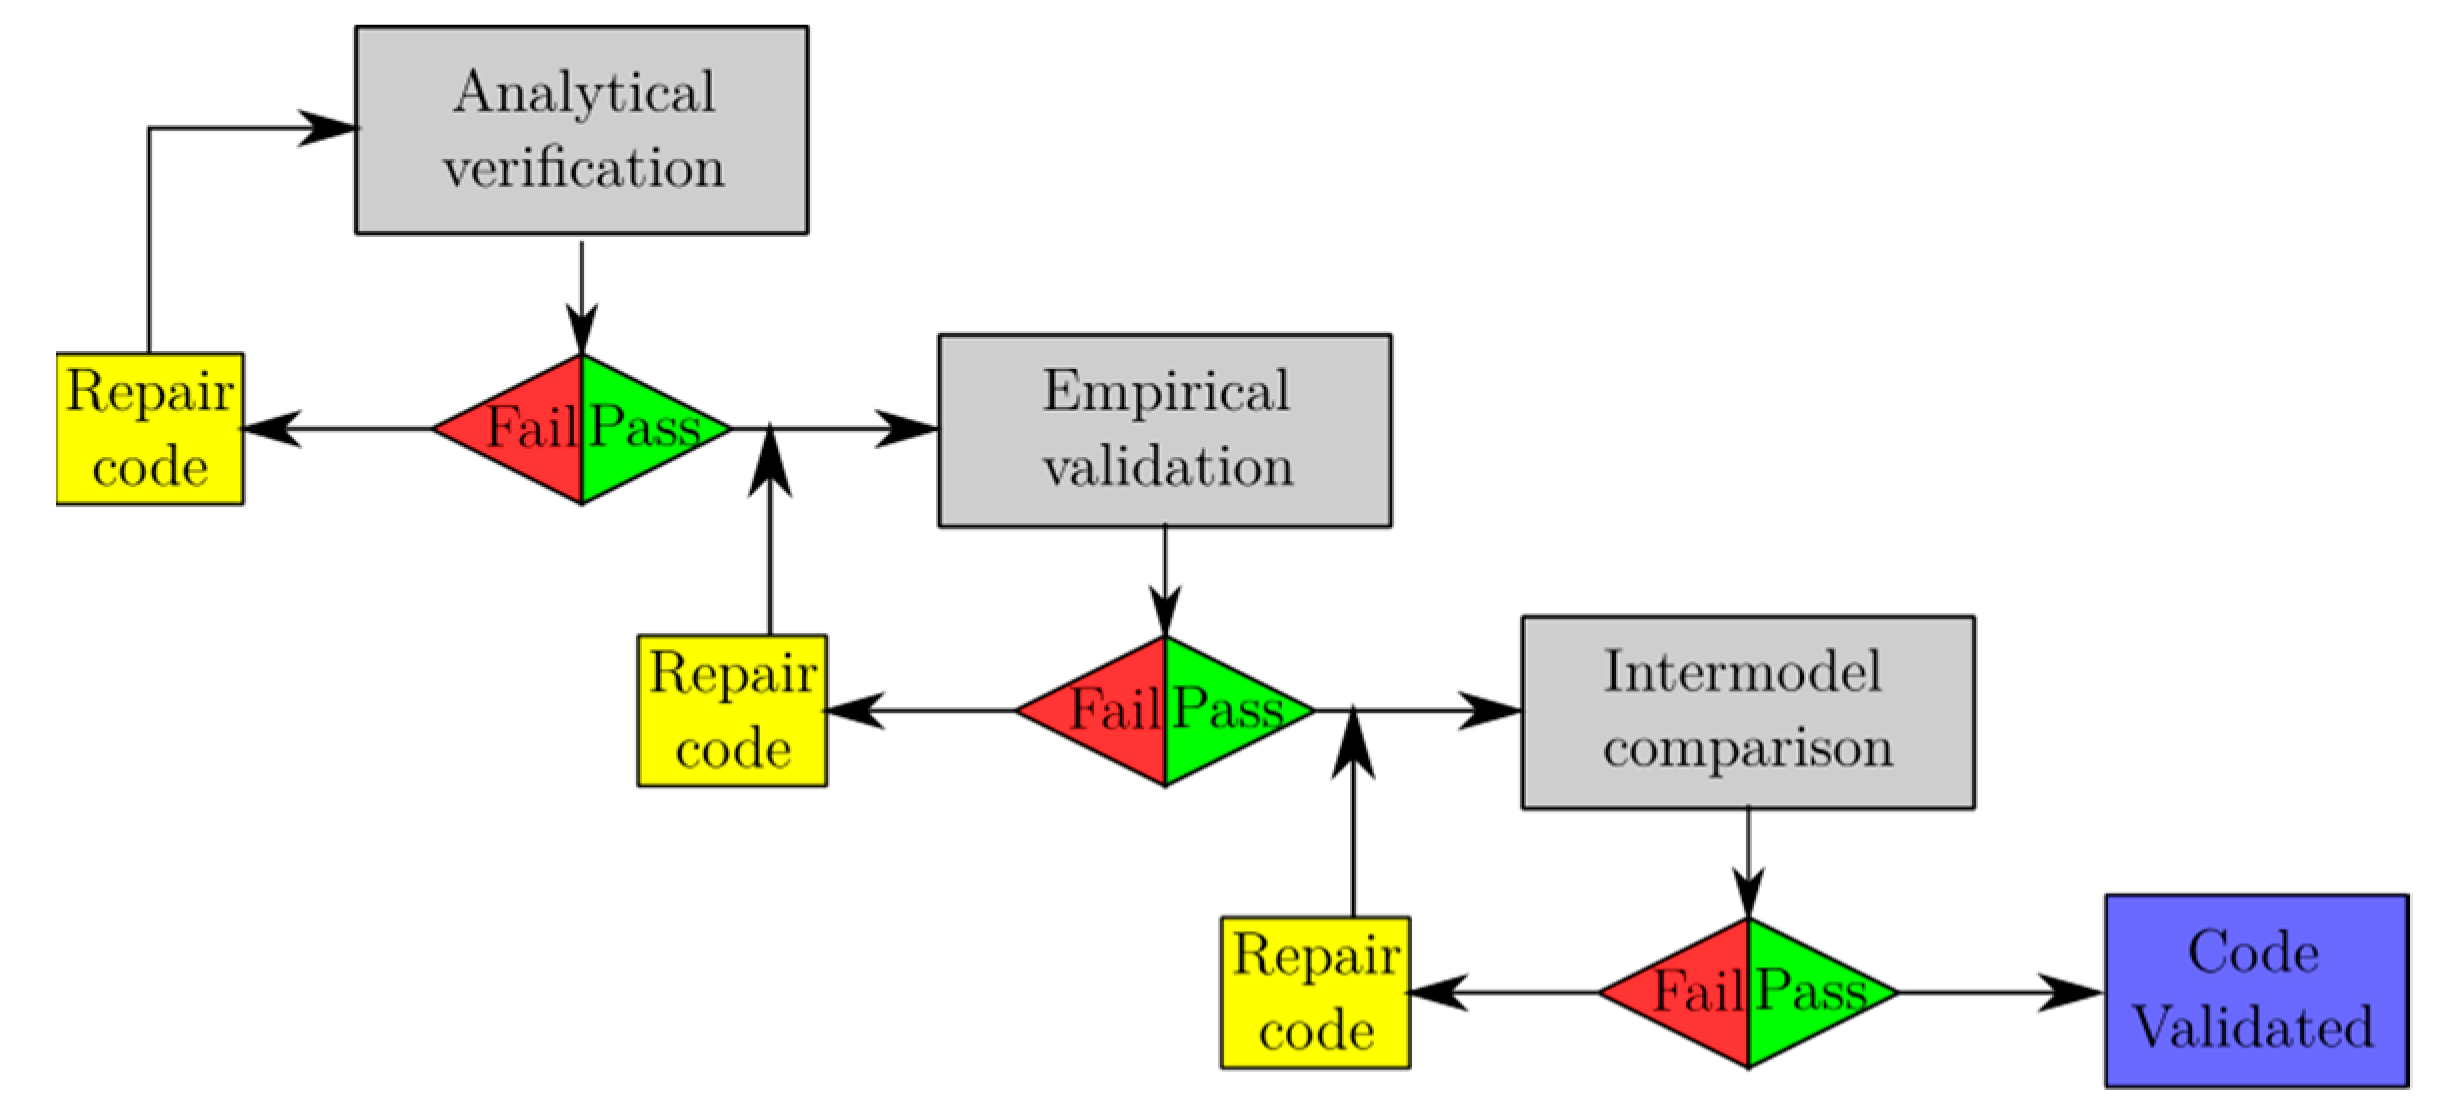
24]. In the BESTEST procedure, analytical verifications, empirical validations and inter-model comparisons must be performed systematically, following the scheme represented in
Figure 3.
As evident in
Figure 3, analytical verifications are considered the first step of this benchmark procedure. Only if analytical verifications give a positive result the numerical code is tested by using empirical validation data, in order to correct errors that cannot be detected considering only single heat transfer mechanisms or simplified boundary conditions, like in analytical tests. After these two steps, the software is run against reference software, in well-defined reference cases, with the aim to ensure that the numerical results of the new software are in good agreement with those obtained with the most diffuse software for dynamic building energy simulations (which were yet tested following the BESTEST procedure). In this paper, only the inter-model comparison test performed by ALMABuild are reported, even if both analytical and empirical validations have been carried out [
15].
Description of the BESTEST Comparative Tests
As represented in
Figure 3, the third, and last, step of the BESTEST method consists in the comparison of the numerical results obtained by using the software being validated, with the results obtained with other codes. In the BESTEST report [
10], a series of cases univocally defined are collected, together with the results obtained for each case by some software assumed as reference for the dynamic building energy simulations. In this way, it becomes possible to compare the results obtained with ALMABuild to those obtained for the same cases by different reference software. In the BESTEST report of 1995, eight reference software are indicated: ESP-r, TRNSYS, DOE2, SRES/SUN, SERIRES, S3PAS, TASE and BLAST. However, it can be observed that this set of reference software could be considered as representative of the state-of-the-art of the building energy simulation in the 90 s but not today, due to the evolution of the physical models used in that software. For this reason, ASHRAE Standard 140 [
25] proposed an updated set of reference software, which is considered in the benchmark described in this paper. In the following, the results collected in this Standard are labelled as BESTEST.
The set of test cases specified in the BESTEST report consists of 40 cases, that progress systematically from extremely simple to more complex and realistic cases. For each test case, the BESTEST report specifies all the input data, like the hourly external weather data, building geometry, internal gains schedules, composition of each envelope element and air ventilation. The simplest cases are used for diagnostic purposes; in fact, single heat transfer mechanisms are added from one case to the following, in order to easily detect errors in the physical modelling. On the contrary, the following fourteen qualifications tests are more realistic, and are used to test the ability of the software to take into account, at the same time, different heat transfer mechanisms and to model building features, like different windows positions, shading devices and different control strategies.
By adopting the same notation of the BESTEST report, the comparative qualification tests selected for the ALMABuild benchmark are listed in
Table 1. From
Table 1 it can be noted that the qualification cases (not considering the free float cases) selected for the ALMABuild validation are 13: only Case 990, that is related to the ground coupling, has not be considered.
As indicated in
Table 1, the envelope element’s composition changes among the tests; in particular, the heat capacity and the density of the building elements are modified, whilst the total thermal transmittance is constant over the cases. In this way, the ability of the software to model both heavy and light buildings is tested. As reported in
Table 1, in the qualification tests different control strategies of the ideal HVAC system integrated to the building are considered. As defined in the BESTEST report, adopting the “Dead-Band” control strategy the HVAC system is switched on in the heating mode if the internal air temperature is less than 20 °C, whereas if the internal air temperature is higher than 27 °C the HVAC system works on cooling mode. With the “Setback” control strategy a night attenuation is imposed for the heating mode, whilst the cooling mode is the same of the “Dead-Band” control strategy. Finally, the “Venting” control strategy is characterised by an hourly profile of the air ventilation and the HVAC system works only in cooling mode from 7 a.m. to 6 p.m., if the internal air temperature is higher than 27 °C.
Cases labelled FF are the free-float cases, in which the HVAC system is switched off and only the air ventilation conditions can change if the control strategy is “Venting” (imposing an hourly profile of the air infiltration rate). For case 960 in which two thermal zones are present, the adopted conditions during the numerical tests are indicated in
Table 1 separately for the back zone and the sun zone.
As suggested by BESTEST, the building geometry reported in
Figure 4 has been used during the numerical tests. The reference room is characterised by a horizontal roof, a near-adiabatic slab-on-ground floor and two windows, both inserted in the South wall. In order to model the near-adiabatic slab-on-ground floor, a thick (1 m) under-floor thermal insulation layer has been considered in the numerical runs of ALMABuild. For Cases 620, 630, 920 and 930 the position of the windows is different from the building geometry reported in
Figure 4; in these cases, a window both in the East and the West wall is present. For case 960, two thermal zones are considered by adding the room indicated with dashed lines in
Figure 4. In this last case the original South wall becomes an internal wall (without windows) which separates the room considered in the other cases (Back zone) from the additional zone having two windows on the South Wall (Sun Zone).
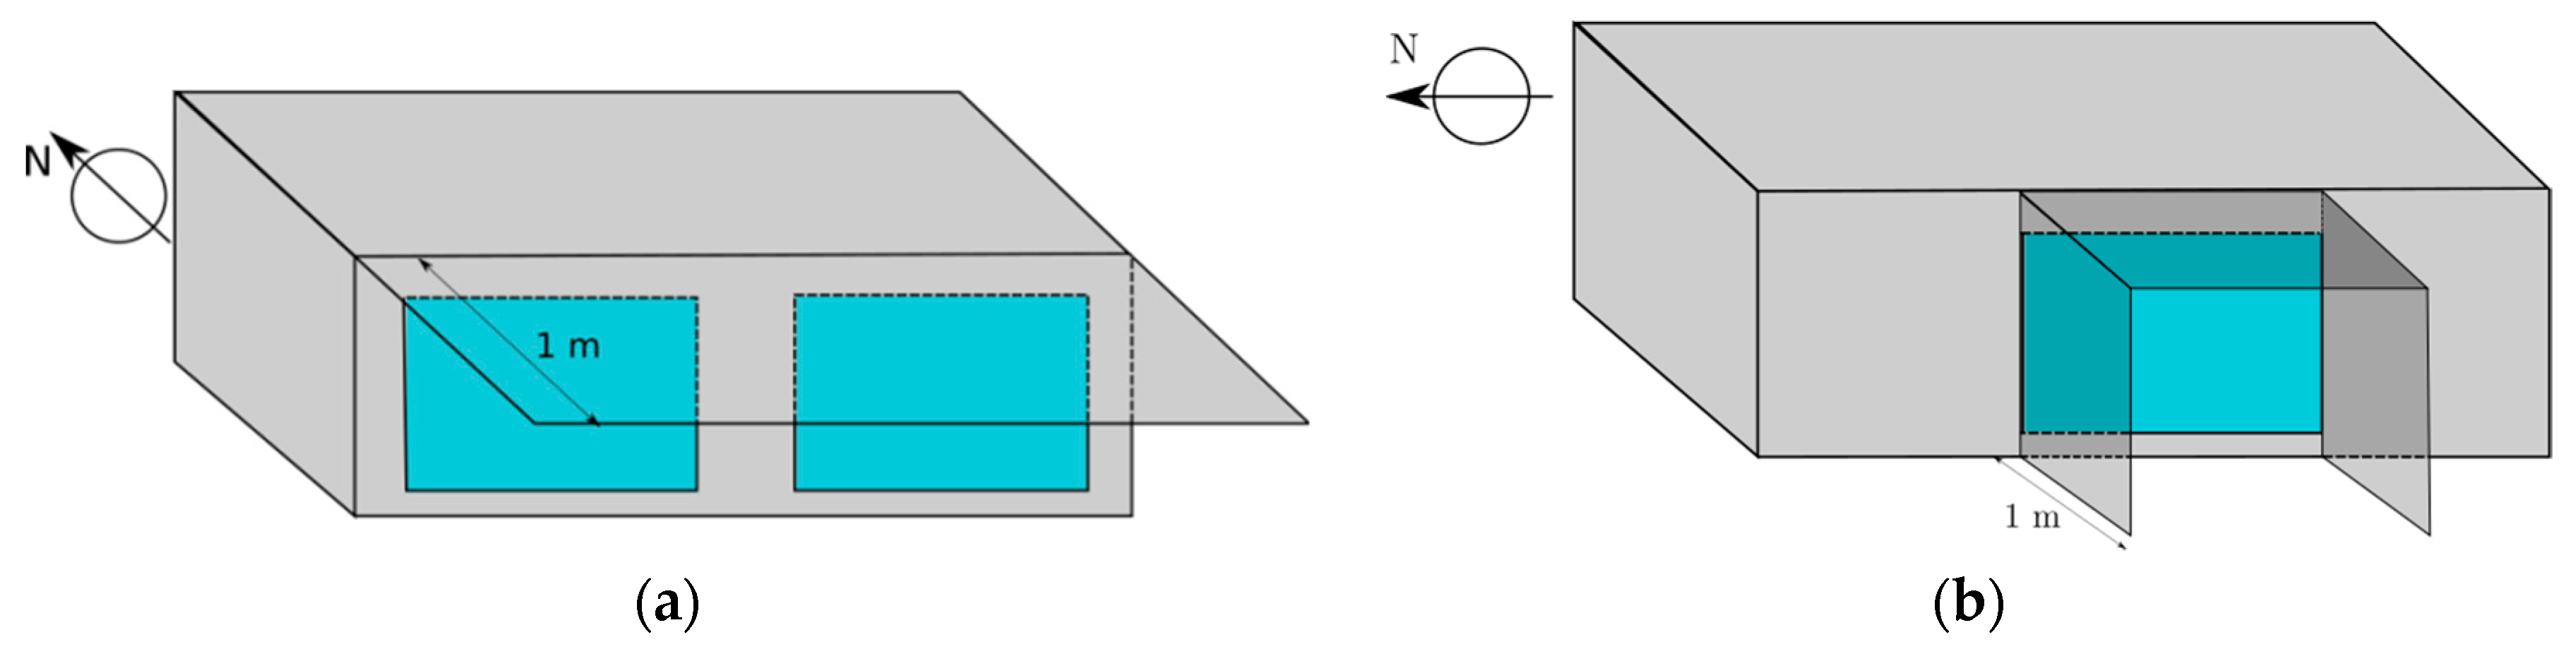
The geometry of the shading devices that are present in cases 610, 630, 910 and 930 is represented in
Figure 5. In particular, for cases 610 and 910, characterised by two windows in the South wall, there is a single horizontal shading device (
Figure 5a); whilst for cases 630 and 930, for both the windows in the East and West wall, the shading device is composed by a horizontal and two vertical overhangs (
Figure 5b).
For each case, the weather data are the same and the Typical Meteorological Year (TMY) is supplied by the BESTEST report. The building is located in Denver (CO, USA), which is characterised by cold clear winters and hot dry summers. The minimum, maximum and mean annual temperatures are −24.4 °C, 35 °C and 9.7 °C respectively, whereas the mean and maximum daily temperature ranges are 14.2 °C and 29.4 °C.
In agreement with the procedure suggested by the BESTEST report, the comparative test was performed focusing the attention on the evaluation of the hourly free-float internal air temperature, the energy consumption and the power peak released by the HVAC system to the room both for heating and cooling conditions.
5. Comparison with Other References
Analysing the maximum and minimum BESTEST threshold values collected from
Table 3 to
Table 11, a great discrepancy can be observed. More in detail, as reported in
Table 12 discrepancies between maximum and minimum threshold values, for each qualification case, go from the 16% to more than 100%: the highest differences concern the annual cooling energy for the heavyweight buildings, whilst the lowest discrepancies are related to the heating power peak for lightweight buildings.
Therefore, for some cases, due to the great spread between the reference results, the BESTEST procedure is not really strict. This is due to the fact that BESTEST and ASHRAE 140 reference software lists contain outdated codes, like SERIRES, S3PAS and TASE, that are no more used. It has to be underlined how the highest discrepancies between ALMABuild and BESTEST results have been observed just referring to these software and the outdated version of ESP-r. In fact, in both the BESTEST and ASHRAE 140 reference software lists the updated version of reference software are omitted as well as recent software for the dynamic building energy simulation, like EnergyPlus. Therefore, in order to obtain a stricter verification, with converging reference threshold values, the reference software list should be periodically updated, eliminating codes based on outdated models and introducing new software recognized as reliable and well diffused.
For these reasons, with the aim to have an additional benchmark of the ALMABuild library, a comparison with other references is performed. In particular, the ALMABuild predictions are compared to the results obtained with EnergyPlus and the hourly method proposed by the recent European Standard EN ISO 52016 [
11]. The BESTEST qualification cases are considered for this comparison. Predictions of the annual heating and cooling energy demand and power peak obtained with EnergyPlus are available for the version 8.3.0 [
26], whereas in EN 52016 are collected the results obtained with the hourly method proposed only for Cases 600, 640, 900 and 940.
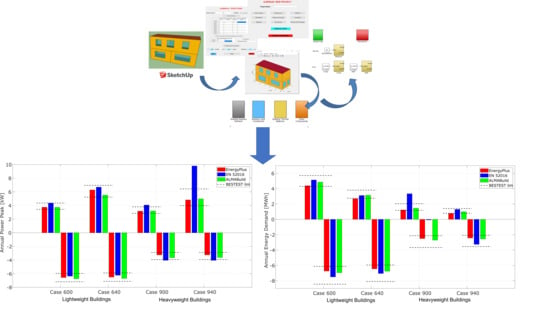
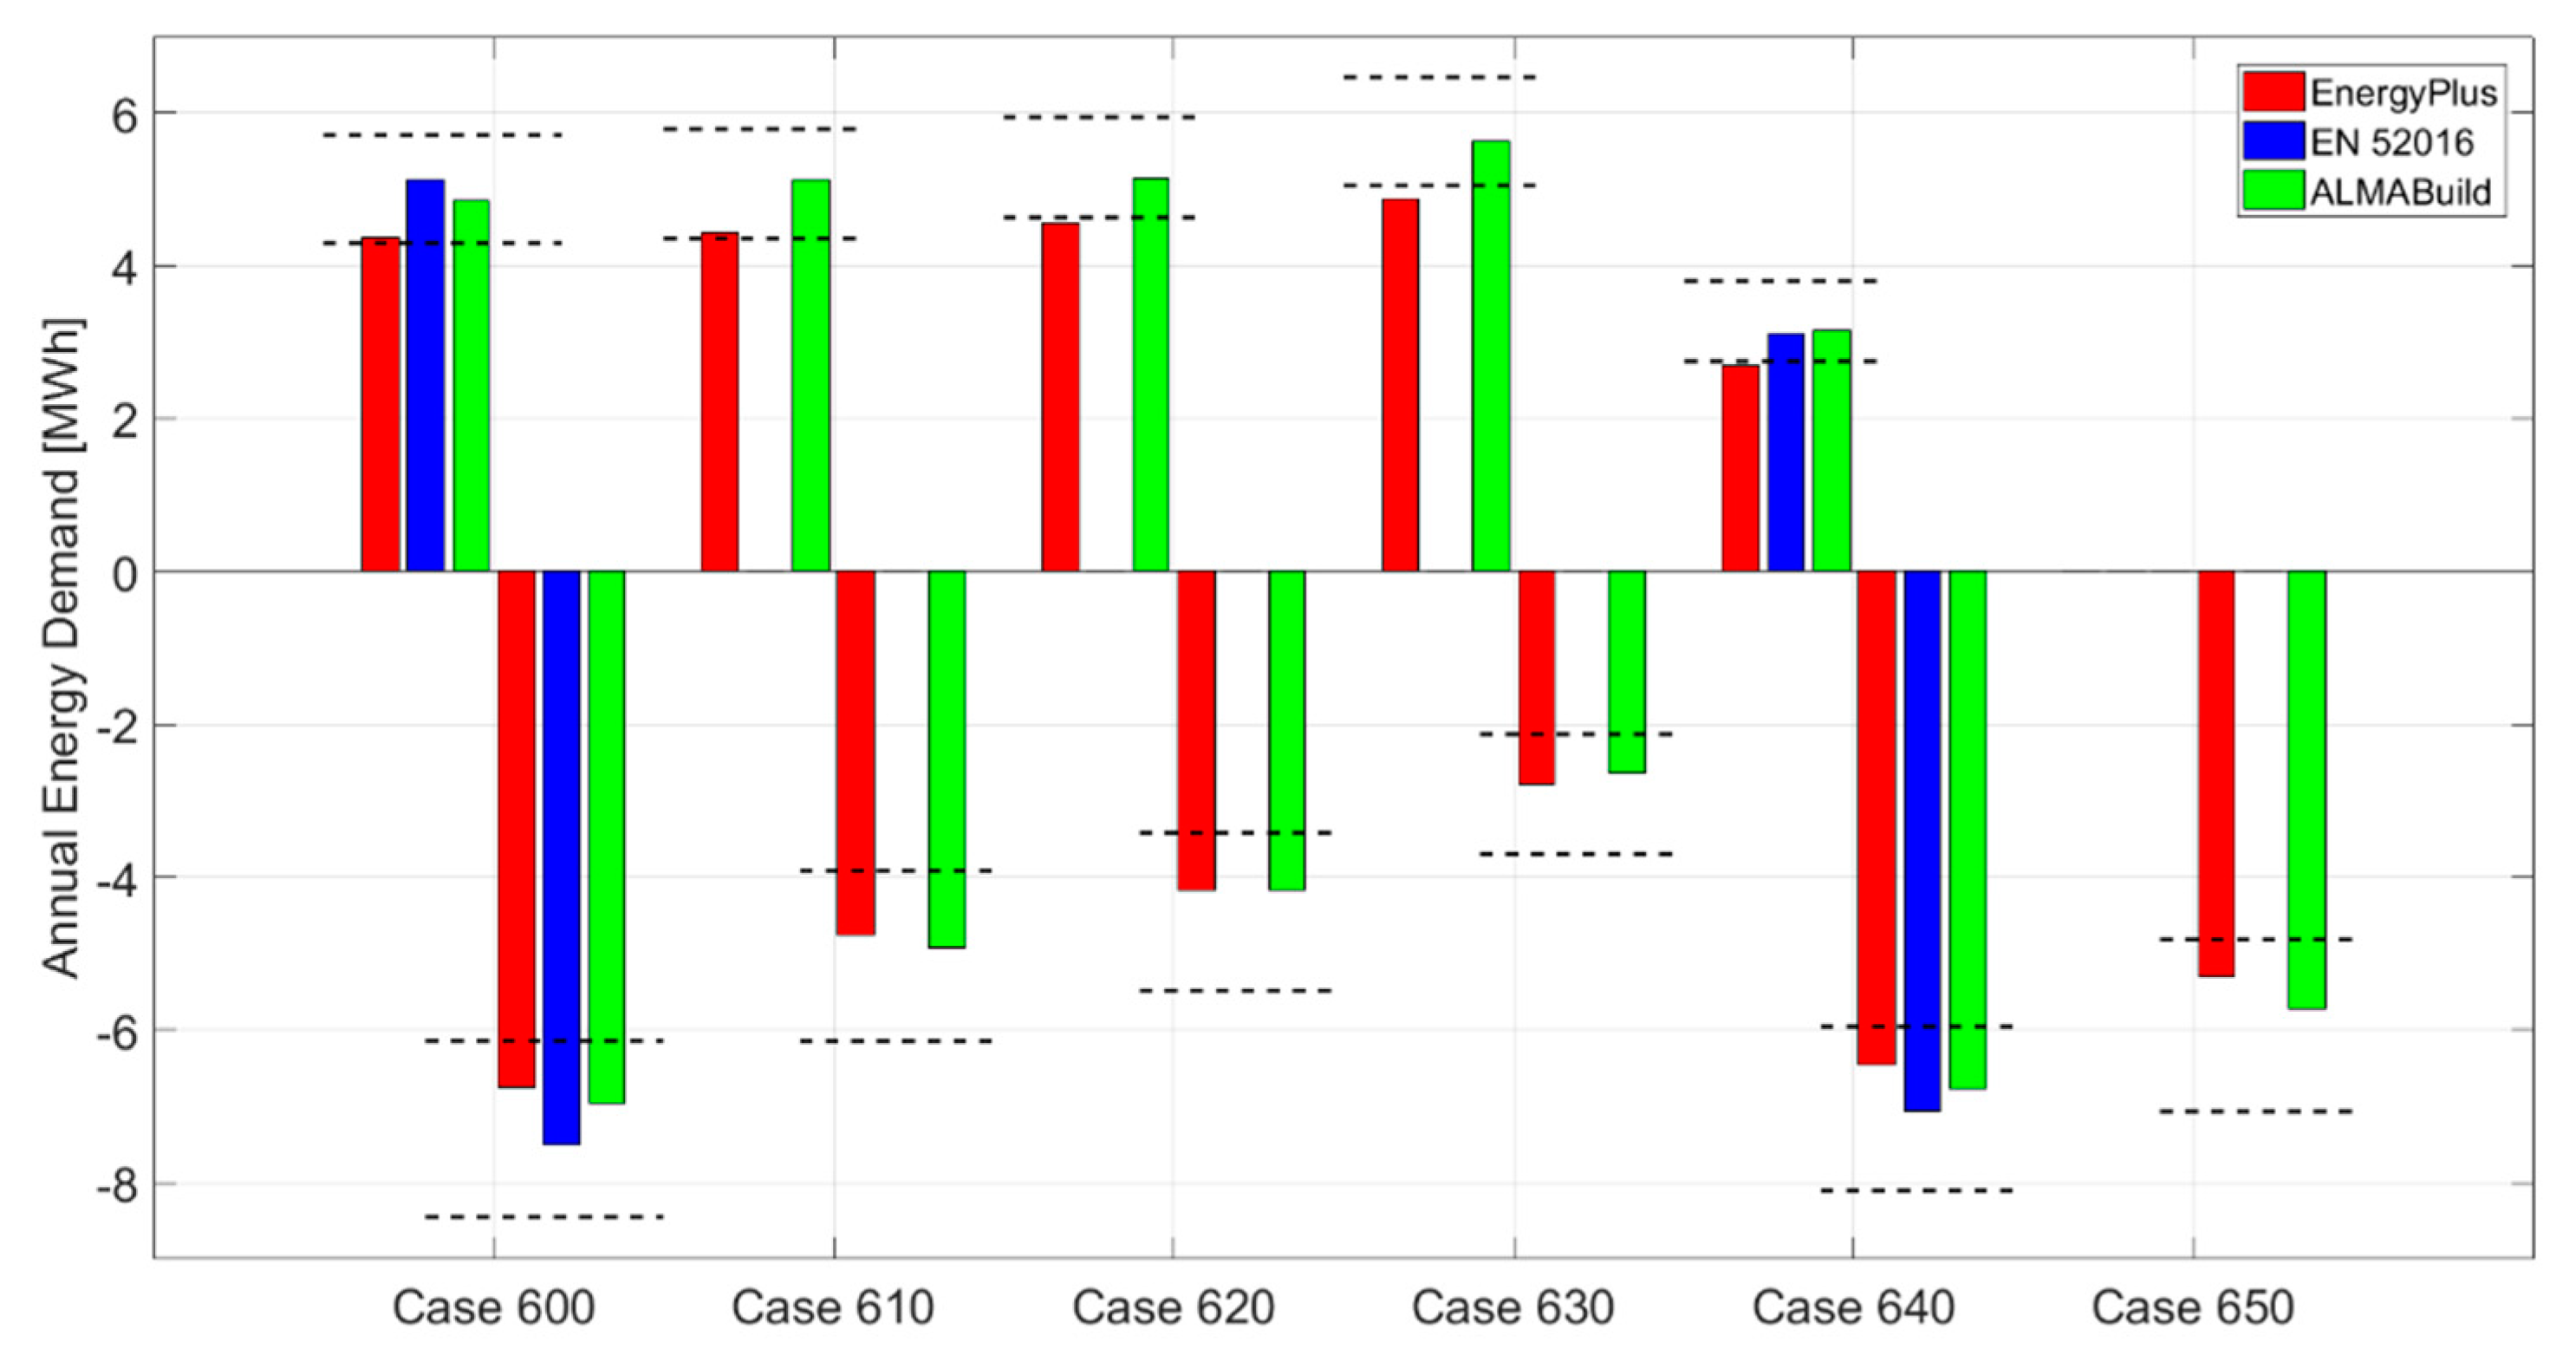
In
Figure 8, the annual energy demand for heating (positive values) and cooling (negative values) predicted by EnergyPlus, EN 52016 and ALMABuild for the lightweight cases are represented, together with the minimum and maximum BESTEST threshold values (dashed lines).
In this figure it is possible to appreciate that the results obtained with the new hourly method described by EN ISO 52016 (for the cases for which results are available), like the ALMABuild results, are within the BESTEST range, whilst EnergyPlus do not. More in detail, EnergyPlus slightly underestimates the annual heating load for Cases 620, 630 and 640; on the contrary the predicted annual cooling load is always within the BESTEST range. Discrepancies between ALMABuild and EnergyPlus go from the 10% (Case 600) to 15% (Case 640) for the heating loads, whilst for the cooling energy demand deviations are less than 5%, except for Case 630, for which the difference between ALMABuild and EnergyPlus is 6%. Also the results obtained with the new European Standard are close to the ALMABuild predictions: the maximum deviation, equal to 8%, is observed for the evaluation of the cooling load in Case 600.
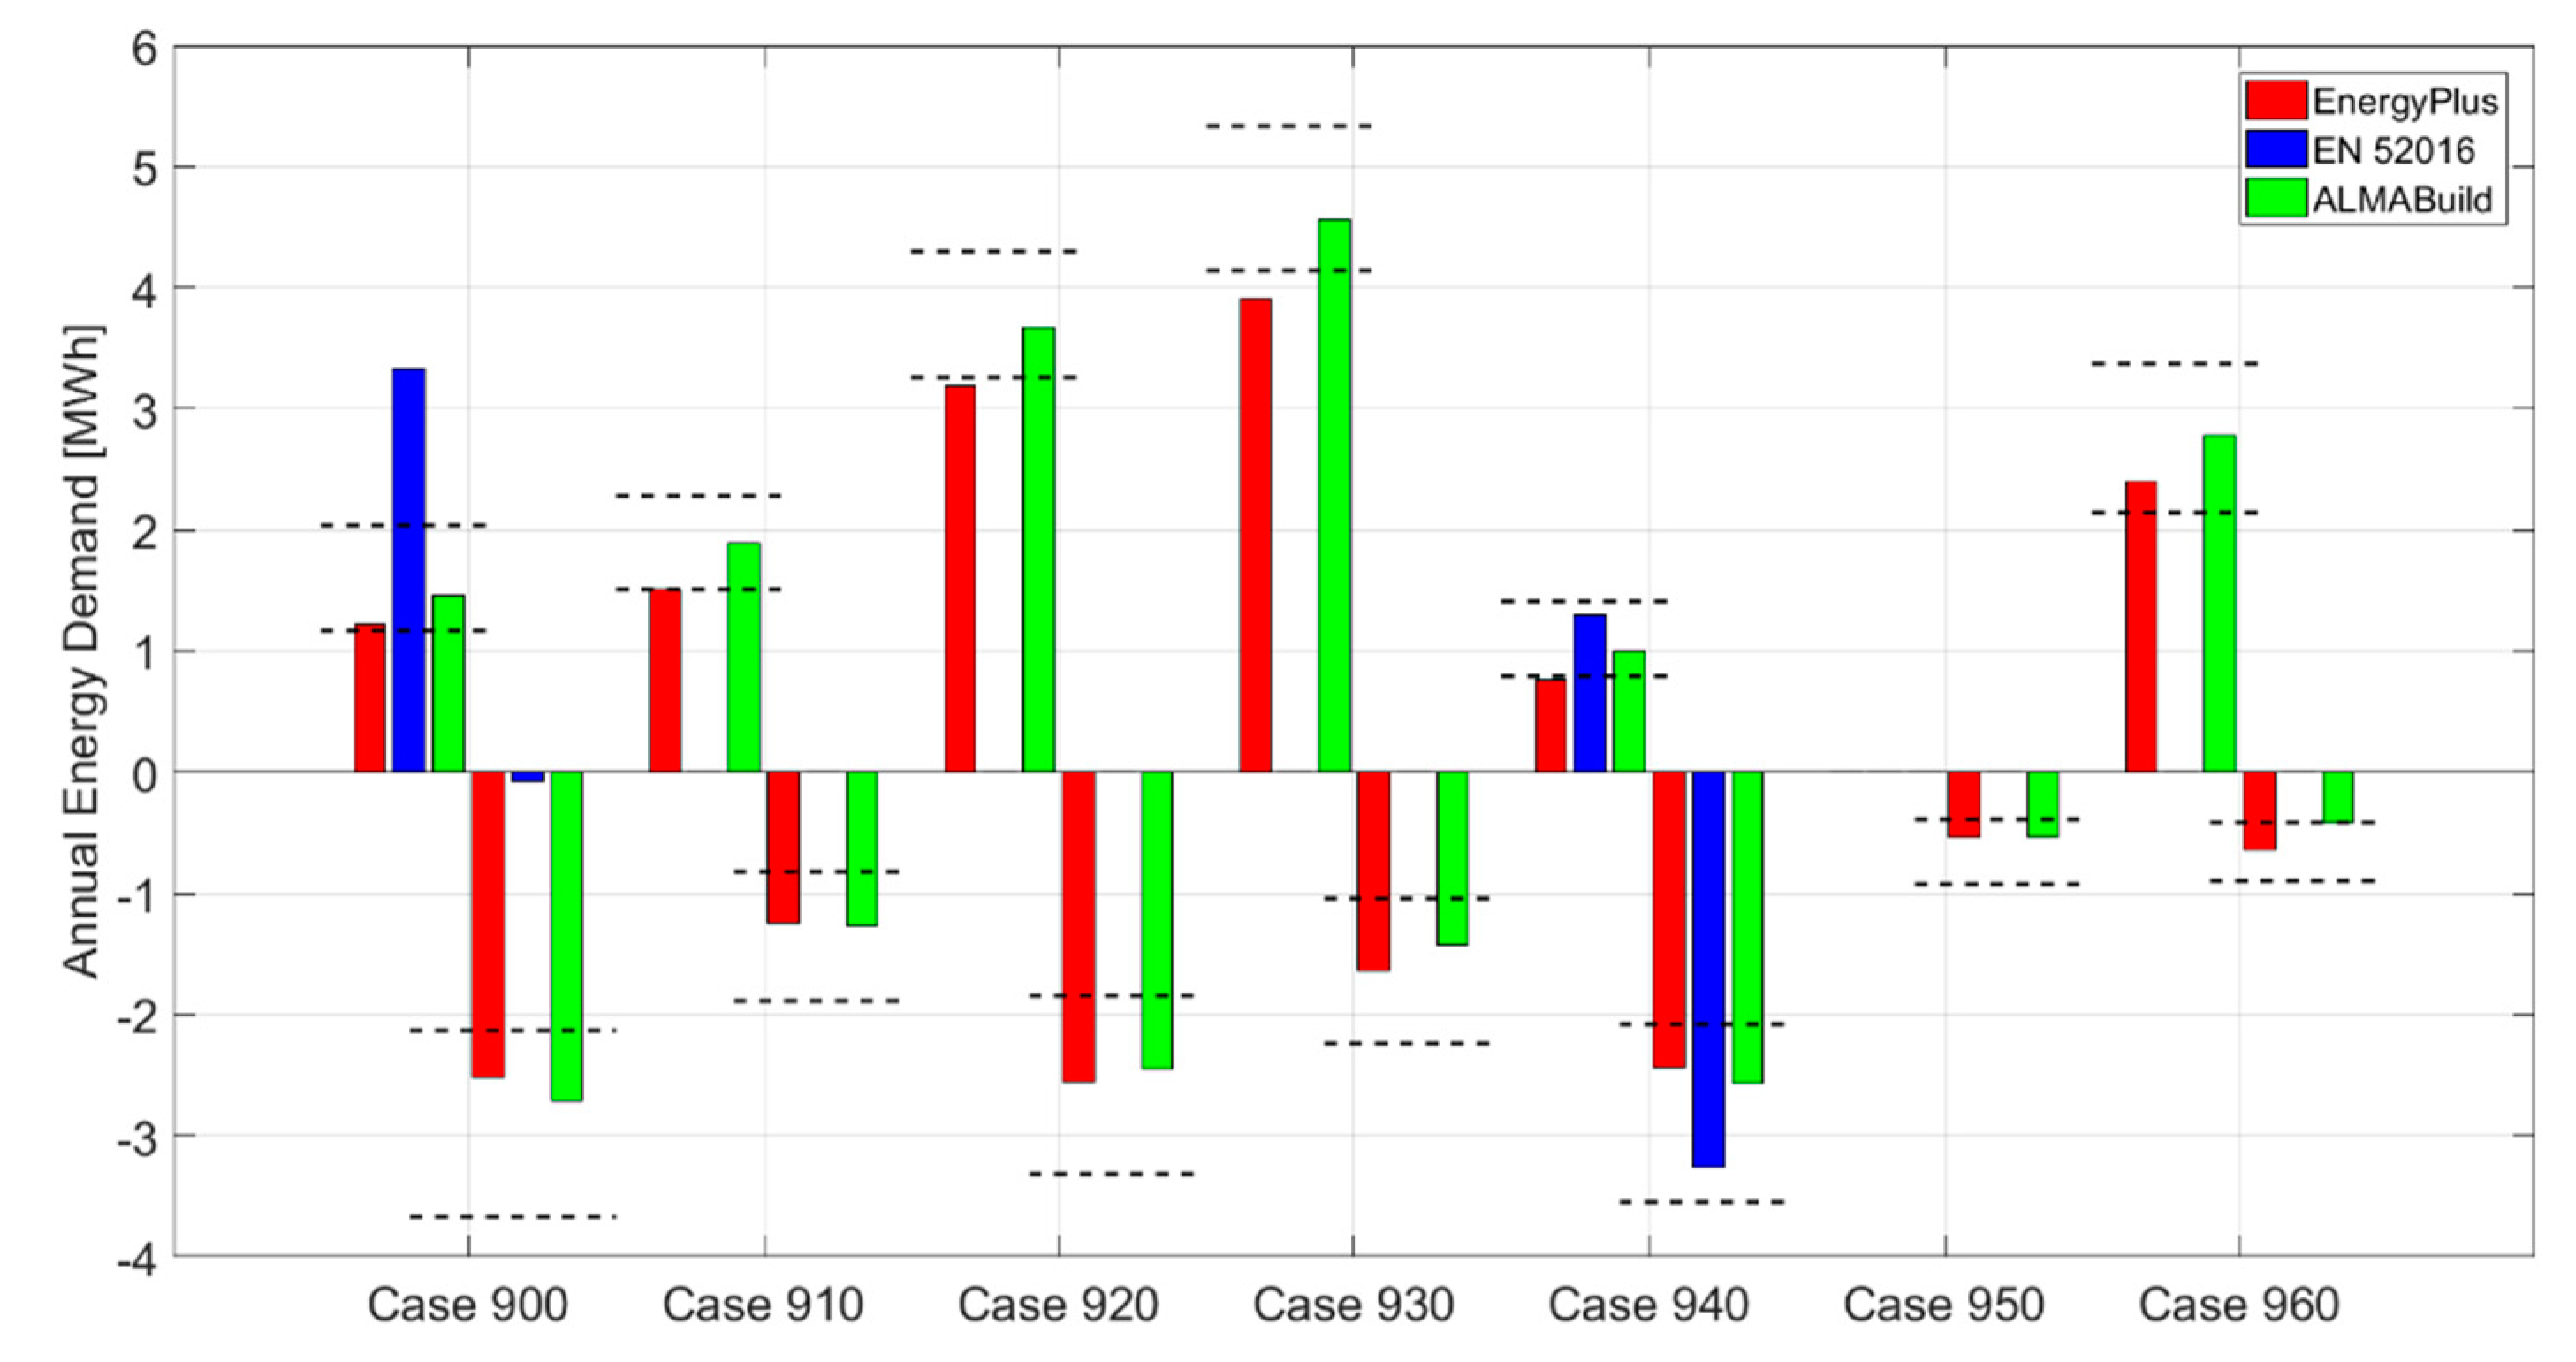
Predictions of the annual energy demand for the BESTEST heavyweight buildings and the multizone case, obtained with ALMABuild and the additional references are reported in
Figure 9.
In this figure it can be noted that, as previously demonstrated, the ALMABuild results are within the BESTEST range, on the contrary EnergyPlus and EN 52016 do not. Again, as for lightweight buildings, the EnergyPlus annual heating loads are always around the minimum BESTEST threshold values and from Case 910 to Case 940 the EnergyPlus predictions are lower the BESTEST range. On the contrary, the evaluation of the cooling energy demand by means of EnergyPlus is always within the BESTEST range. Comparing EnergyPlus and ALMABuild heating demand predictions, the minimum deviation is observed for Case 920 (+13%), whilst the maximum occurs for Case 940 (+23%). On the contrary, regarding the annual cooling loads, discrepancies are around 5%, except in Case 930 (−15%) and Case 960 (−54%).
Considering the EN 52016 results, it can be noted that for Case 940 predictions are within the BESTEST range, even if a large discrepancy with ALMABuild, around 30%, for both the cooling and heating demand there exists. However, in Case 900, EN 52016 predictions are very far from the BESTEST range: the heating demand is too high (+129% with respect to ALMABuild) and the cooling load is too lower (−97%).
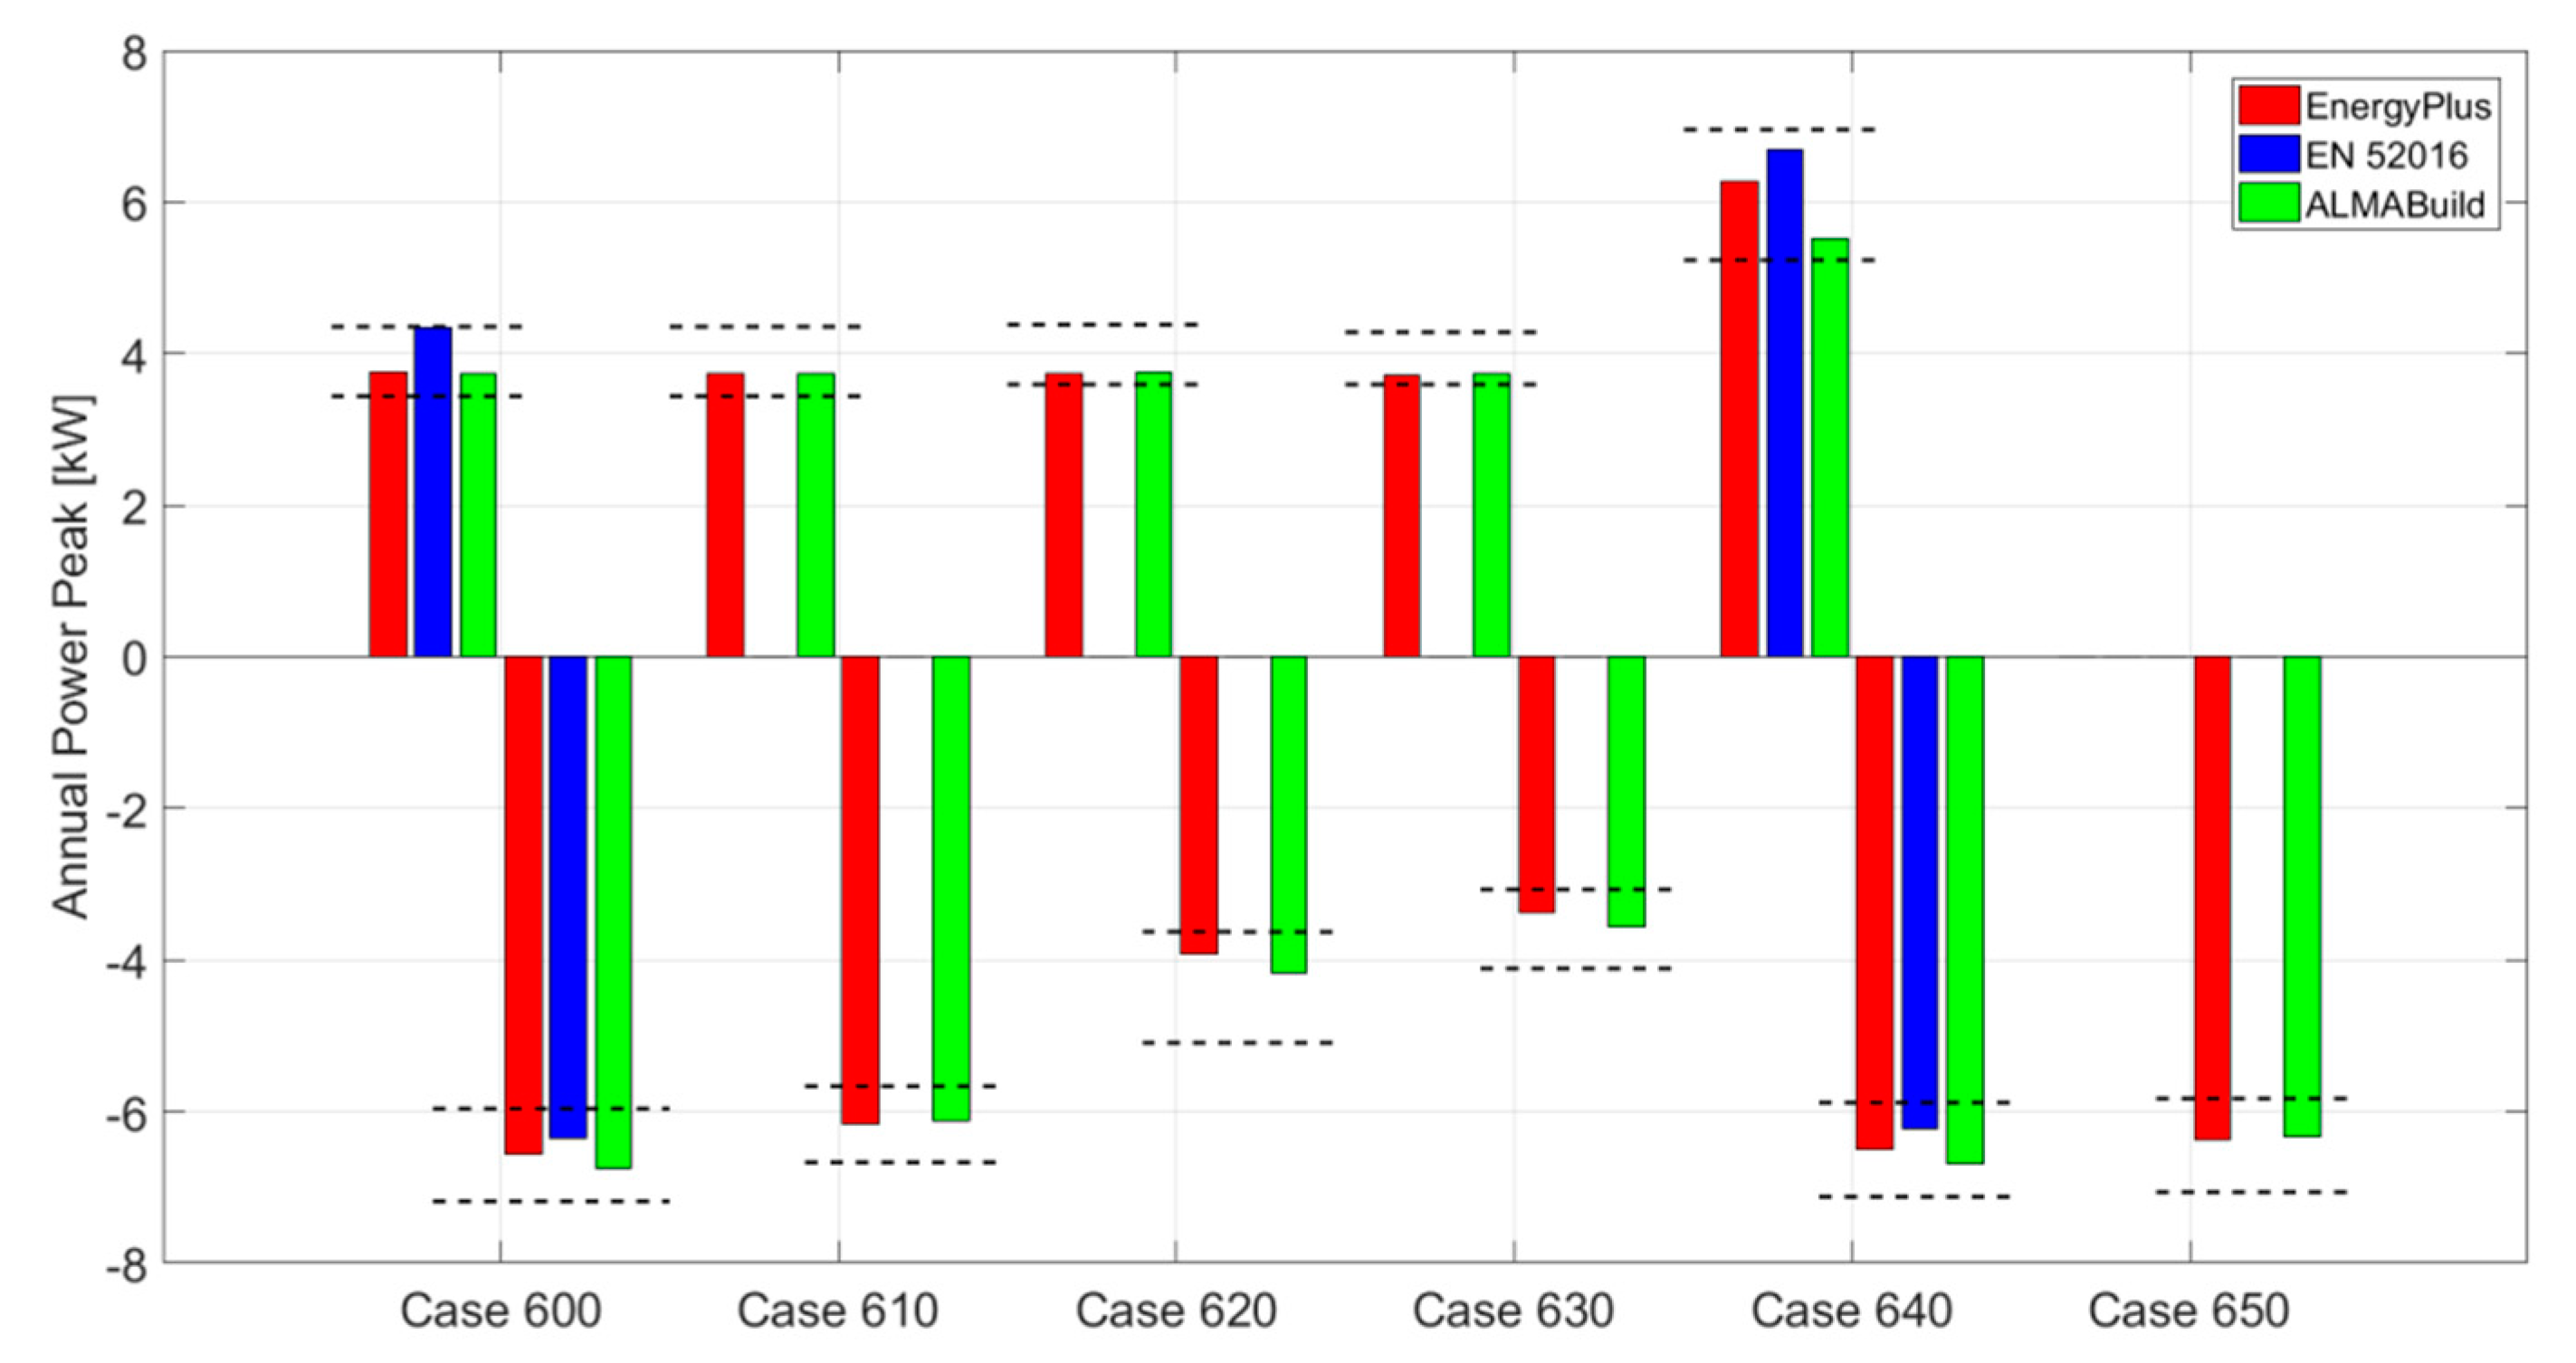
The predictions of the heating and cooling power peak delivered by the ideal HVAC system for lightweight buildings, reported in
Figure 10, show a good agreement among the different numerical method considered. In fact, for ALMABuild, EnergyPlus and EN 52016 the results are always contained within the BESTEST range. Moreover, the discrepancies between ALMABuild and EnergyPlus are around 0.5% for the heating power peak and around 5% for the cooling one, except the heating power peak evaluation in Case 640, for which a deviation of 14% is observed. Comparing the EN 52016 predictions to the ALMABuild ones, deviations are around 20% for the heating power peak and around 6% for the cooling.
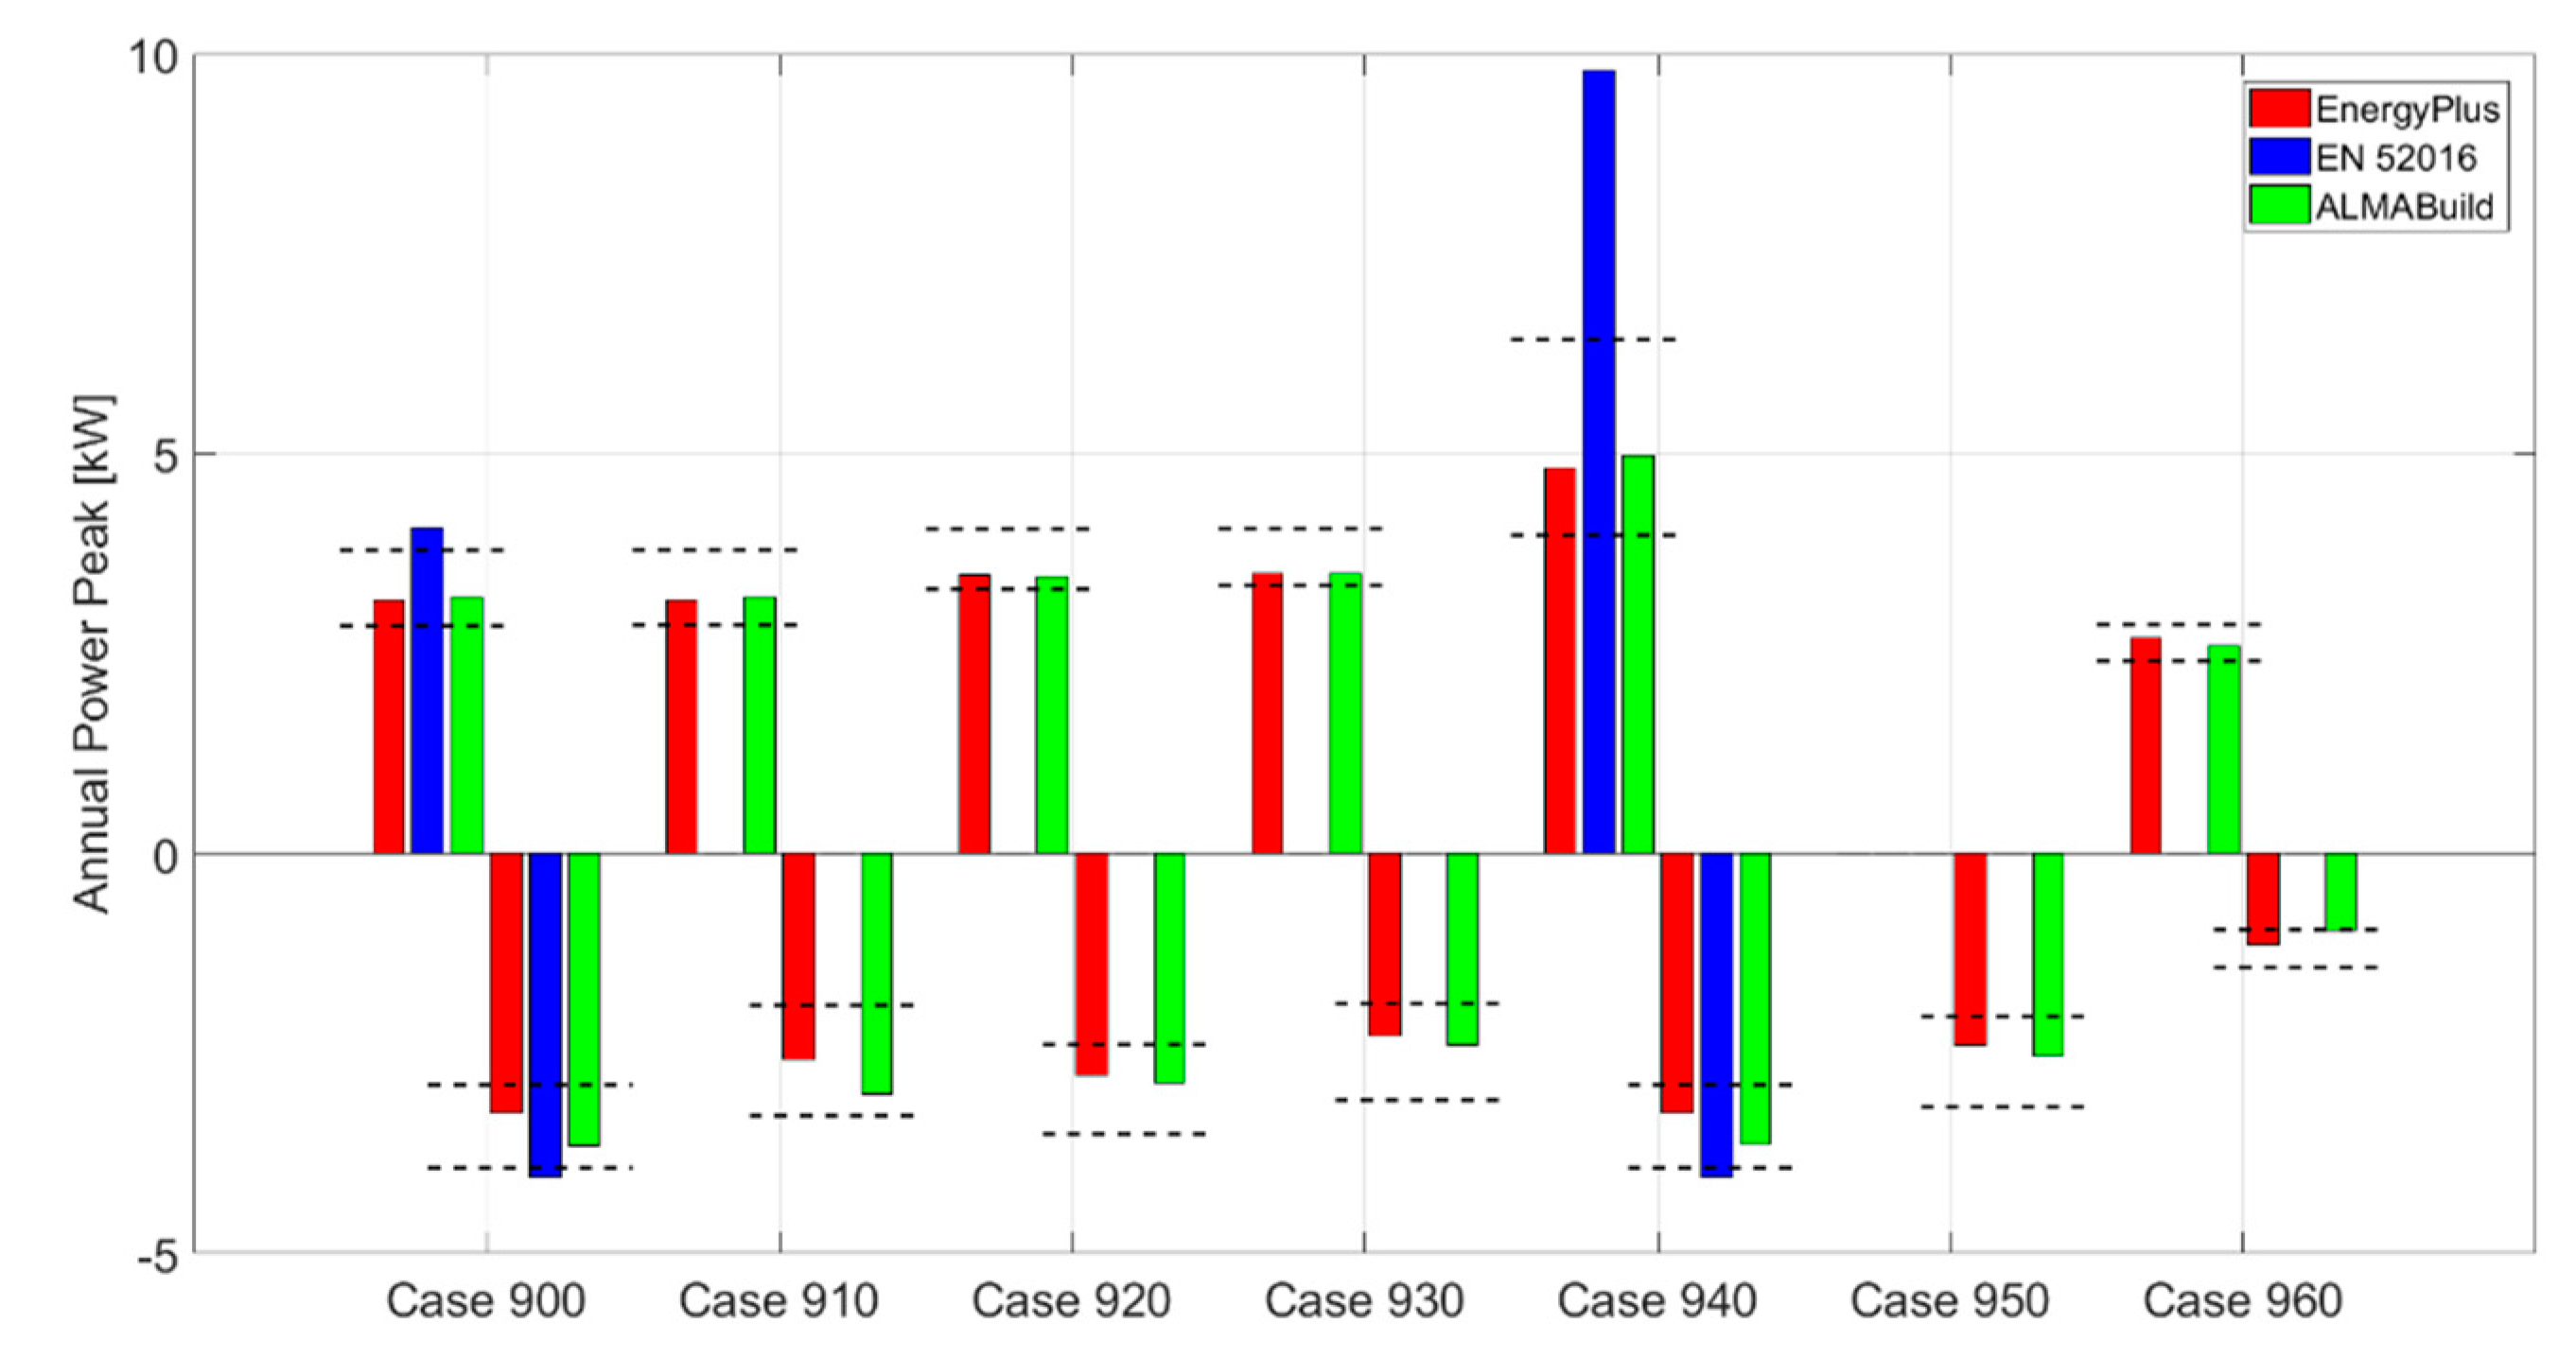
Finally, in
Figure 11 are shown the heating and cooling power peaks predicted for the BESTEST heavyweight cases. In this figure it can be appreciated that ALMABuild and EnergyPlus results are always within the BESTEST range, whereas EN 52016 predictions are always higher than the BESTEST range. In particular, for Case 940 the difference between ALMABuild and EN 52016 heating peak prediction is very high (+97%), whilst in the other case the deviation is around 20%; on the contrary deviations for the cooling power peak for both Case 900 and 940 are around 11%. On the other hand, the discrepancies between ALMABuild and EnergyPlus for the heating peak evaluation are very low: the maximum absolute deviation is 3%. Larger deviations are observed for the cooling peak estimations: the difference between ALMABuild and EnergyPlus are less than 10%, except for Case910 (+14%) and Case 960 (−20%).
From the results reported from
Figure 8 to
Figure 11, some general conclusions can be assessed. First of all, it can be noted that the predictions obtained with a wide diffuse software for the building energy simulation like EnergyPlus not always are contained within the BESTEST range. This fact underlines that the BESTEST procedure should be updated taking into account the most recent programs for building energy simulations. However, the comparison between ALMABuild, whose results are always contained in the BESTEST range, and EnergyPlus shows a good agreement among these programs, with discrepancies generally lower than 10%, confirming the validity of the numerical models implemented in ALMABuild. The maximum differences between these two software are observed in Case 960, in which a multizone building is considered.
On the contrary, the comparison between ALMABuild and the new hourly model proposed by EN 52016 is less significative. This is due not only to the few Cases for which results obtained with the new hourly model are available, but also because, as it has been demonstrated, predictions obtained following the EN 50126 for heavyweight buildings are significantly out from the BESTEST range, revealing some problems to model correctly the thermal inertia of buildings. In fact, even if the rationale of this Standard is the same followed in ALMABuild (the building is divided in thermal zones, each building element of a zone is studied by using a RC model and the heat fluxes across these elements are combined to obtain the energy loads and the internal air temperature of the thermal zone), there are important differences between the 3R4C model adopted in ALMABuild and the RC model proposed in the Standard.
The main differences between the ALMABuild RC network adopted in the BME blocks and the 4R5C network proposed by the EN 52016 for the wall modelling concern the evaluation of the total capacity of the wall and its distribution to each node. In EN 52016, the value of the total capacity of the envelope element is obtained by classifying each element by means of definitions based on the main layers composing the element. It can be remarked that, contrary to the procedure followed in ALMABuild, adopting the method proposed by EN 52016, the total capacity of massive envelope elements is not equal to the actual capacity of the element, but it is set to a specific constant value based on the class of the element (very light, light, medium, heavy, very heavy).
6. Conclusions
In this paper, a new open SIMULINK blockset (ALMABuild) for the dynamic energy modelling of buildings and HVAC systems has been presented. ALMABuild is able to drive the user to the automatic creation of the building model in the SIMULINK desktop by means of a series of Graphical User Interfaces (GUIs), developed in MATLAB. In this paper a series of comparative tests, conducted by using the reference cases defined by the BESTEST procedure, have been shown in order to validate the numerical procedure followed by ALMABuild for the analysis of the dynamic behaviour of a thermal zone, both in presence or not of a HVAC system. For all the cases analysed it is shown that results obtained using ALMABuild are always within the maximum and minimum threshold values, defined by the reference data collected in ASHRAE Standard 140. In addition, a comparison between ALMABuild, EnergyPlus and with the results obtained by using the new EN ISO 52016 has been made using relevant BESTEST cases. EnergyPlus results in same cases are slightly lower than the minimum BESTEST threshold values for the evaluation of annual heating loads, however discrepancies among ALMABuild and EnergyPlus are less than 30% for heating loads, whilst for the evaluation of the power peak is generally lower than 5%. On the contrary, the results reported in the paper demonstrate that predictions obtained following the simplified hourly method proposed in the new EN ISO 52016, for heavyweight building, are very different to the results obtained with ALMABuild (with discrepancies higher than 90%) and the reference software.
Further development of the algorithm presented in this paper are planned. In particular, two main aspects of the numerical code are to be improved. The first one is related to the development of the mass transfer modelling across the envelope elements. In this way, the evaluation of the water condensation risks within the element and the indoor air humidity ratio in the thermal zone will be available. Therefore, accurate studies about the cooling thermal loads, considering also the latent heat loads (especially in summer and in presence of high occupancy density) will be enabled. The second point to be improved in ALMABuild concerns the air flow modelling between thermal zones and within a thermal zone in presence of driving flows (e.g., in the case of adoption of convective HVAC systems).


