Abstract
This paper reports experimental and analytical results of partial discharge degradation of silicone rubber sheets in accordance with proposed procedures. Considering the actual usage condition of silicone rubber as an insulating material of polymer insulators, an experimental procedure is established to evaluate long-term surface erosion caused only by partial discharge. Silicone rubber is subjected to partial discharge for 8 h using an electrode system with air gap. Voltage application is stopped for subsequent 16 h for recovery of hydrophobicity. The 24 h cycle is repeated 50 or 100 times. Deterioration of sample surface is evaluated in terms of contact angle and surface roughness. It is confirmed the proposed experimental procedure has advantage of no arc discharge occurrence, good repeatability of results, and possible acceleration of erosion. Surface erosion of silicone rubber progresses gradually and finally breakdown of silicone rubber occurs. Alumina trihydrate (ATH), an additive to avoid tracking and erosion by discharge, is not necessarily effective to prevent breakdown caused by partial discharge when localized electric field in air is enhanced by adding ATH. In such a situation, lower permittivity and higher resistance of silicone rubber seem dominant factors to prevent partial discharge breakdown and a careful insulation design should be required.
Keywords:
silicone rubber; partial discharge; degradation; breakdown; contact angle; surface roughness; FTIR; ATH 1. Introduction
Silicone rubber has been widely used as an electrical insulating material of polymer insulators of power transmission and distribution lines, because of advantages like light weight, easy handling, and water repellency. Electrical and mechanical degradation of silicone rubber is caused by discharges on its surface, exposure to ultraviolet ray, surface contamination, and heavy rain.
With respect to degradation of silicone rubber caused by discharge, arc discharge gives serious and irreversible damage to silicone rubber when compared with partial discharge. To improve resistance to tracking and erosion of silicone rubber caused by arc discharge, alumina trihydrate (ATH) is usually added to silicone rubber [1]. Water of crystallization contained in ATH evaporates by absorbing energy of arc discharge, resulting in good performance. Arc discharge usually occurs on silicone rubber surface under sever condition such as high electric field, heavy contamination and wetting [2]. However, occurrence probability of such conditions may be low.
On the contrary, partial discharge occurs more easily under less sever condition. Partial discharge is a localized breakdown observed in a small portion of an insulation system subjected to high electric field. It does not cause short-circuit of the insulation system. In the case of polymer insulators, partial discharge may be observed at the triple junction point-like interface of silicone rubber/electrode/air and silicone rubber/water droplet/air [3,4]. Partial discharge generated in air attacks the surface of silicone rubber. It is difficult for partial discharge to breakdown silicone rubber by one attack because its energy is not sufficient enough. However, silicone rubber subjected to partial discharge over a long period of time will be eroded gradually from the surface to the bulk and finally breakdown. Knowledge of partial discharge degradation of silicone rubber is considered essential to electrical insulation design of composite insulator. However, researches focused on partial discharge degradation of silicone rubber have not been performed much.
Analysis of contact angle and SEM images of surface after 48 and 96 h partial discharge treatment show that the resistance to partial discharge is improved by adding nano-sized silica to silicone rubber [5]. Effect of partial discharge on rheological and chemical properties of silicone rubber has been discussed in terms of oxidization and localized temperature rise, moisture, and depolymerization [6]. Another paper reports that deposited charge on silicone rubber surface by partial discharge may have an impact on its flashover voltage, but the material degradation caused by partial discharge is limited [7]. To understand partial discharge degradation phenomena of silicone rubber, further fundamental long-term experiments under various conditions in accordance with appropriate procedures seem necessary.
The authors have carried out experiments in rather actual conditions, where silicone rubber was subjected to partial discharge in salt or clean fog [8,9]. To simplify the experimental condition by avoiding the effect of water droplet on silicone rubber, we started experiments in the atmosphere without fog [10]. The present paper reports a series of results obtained in accordance with proposed experimental procedures, which are suitable to study degradation of hydrophobic silicone rubber caused only by partial discharge. The repeatability of results is good and the acceleration rate can be changed in a certain range by adjusting applied voltage and spacing of the gap where partial discharge occurs. The effect of alumina trihydrate (ATH)—a typical additive for mitigating tracking and erosion of silicone rubber—on partial discharge degradation and breakdown is studied by using five kinds of silicone rubber samples including different amount of additives. Results of chemical analysis show that ATH is decomposed by partial discharge as reported in the case of arc discharge. However, it is suggested addition of ATH lowers permittivity and resistivity of silicone rubber, which results in active partial discharge in air gap and shorter lifetime to breakdown.
2. Experimental Procedures
2.1. Sample and Electrode
Five kinds of silicone rubber samples of the same size (45 × 45 × 2 mm) were used as samples. The matrix of each sample was identical. Respective samples had different amount and surface treatment of additives: ATH and silica. The physical properties of samples [11] are summarized in Table 1.

Table 1.
Physical properties of samples.
A bundle of four steel round bars of 6 mm diameter was used as high voltage electrode; each bar had a hemispherical tip of 3 mm radius of curvature. The ground electrode was a stainless steel disc of 30 mm in diameter. A silicone rubber sample was placed on the ground electrode. An air gap of 1 or 2 mm spacing was formed between the tip of the round bars (high voltage electrode) and a sample surface. The electrode system is shown in Figure 1. Five electrode systems in total, each sample was placed in one electrode system, were set in an acrylic chamber of 1 m3.

Figure 1.
Electrode system.
The level of applied ac voltage was determined so that no arc discharge occurred throughout the experiment and surface degradation progressed as fast as possible only by partial discharge. In the present study, 6.6 and 8.5 kVrms (60 Hz) were selected for air gap spacing of 1 and 2 mm, respectively. Voltage was applied simultaneously to five electrode systems for 8 h and then interrupted for 16 h for recovery of hydrophobicity of sample surface. The 24-h cycle was repeated 50 or 100 times, during these cycles degradation performance of five samples is categorized into 3 groups. Applied voltage and current of each sample were monitored and recorded. A schematic diagram of the experimental setup is shown in Figure 2.

Figure 2.
Schematic diagram of experimental setup.
In the present study, samples were not tested under the same partial discharge conditions (for example, amount of charge, and number of pulses). The magnitude of applied voltage was fixed instead, considering the actual usage condition of polymer insulators at the site. It result in different partial discharge activities among samples because localized electric field in the air gap depends on permittivity and conductivity of the sample.
2.2. Analyses of Surface Erosion
Contact angle was measured with a Drop Master DM500 (Kyowa Interface Science Co., LTD.) just before voltage application and just after voltage interruption of every cycle. A water droplet of 1 μl (conductivity: ~50 μS/cm) was dropped on a horizontally placed sample. Measurement was performed at five spots on the eroded area of a sample by partial discharge and the average contact angle was calculated.
Surface erosion of a sample was evaluated after 8-h voltage application with a surface roughness meter (TOKYO SEIMITSU CO., LTD., Surfcom 1400D) every three cycles. Measurement was carried out by 3 mm-long linear motion of a sensor on a sample surface.
Confocal microscope (Lasertec Corporation, OPTELICS HYBRID C3) enabled close observation of a sample surface of the area 1.5 mm × 1.5 mm. Images of samples were obtained every ten cycles. The arithmetic average roughness Ra of the surface in the observed area was also available. Ra gives the average of the absolute values of the roughness profile ordinates [12].
Infrared absorption spectrum was obtained every three cycles with a Fourier transformation infrared spectrophotometer (JASCO Corporation, FT/IR 6300).
3. Results
3.1. Sample Breakdown
No arc discharge was observed during the experiments. Samples C, D, and E were broken-down under some conditions as shown in Table 2. Higher relative permittivity of these samples compared with samples A and B as shown in Table 1 generates higher localized electric field in the air gap, resulting in active partial discharge and shorter lifetime to breakdown. Also, lower resistivity of these samples may have some relation to breakdown.
Table 2.
Number of cycles of sample breakdown.
3.2. Contact Angle
Figure 3a,b shows the change in contact angle with number of cycle just before voltage application and just after voltage interruption in the 50-cycle test with 2 mm air gap spacing, respectively. Characteristics obtained in the 100-cycle test with 2 mm gap spacing are shown in Figure 4a,b. The initial value of contact angle is about 100 degrees for any sample. After 8-h voltage application, it decreased at most 20 degrees due to reduction of hydrophobicity of sample surface by partial discharge. Reduction in contact angle of Sample A is much lower than those of other samples. This corresponds to lower surface erosion of Sample A as described below. Recovery of contact angle to almost the initial value is confirmed after 16-h voltage interruption. It is considered that 16 h in the present experimental procedures are appropriate for low-molecular weight silicone oil to migrate from the bulk to the surface of a sample and to recover hydrophobicity. No remarkable reduction is observed with the number of cycle. Samples A and B are superior to the other samples when repeating cycles.

Figure 3.
Change in contact angle with number of cycles in 50-cycle test with gap spacing 2 mm. (a) Just before commencement of voltage application. (b) Just after voltage interruption.
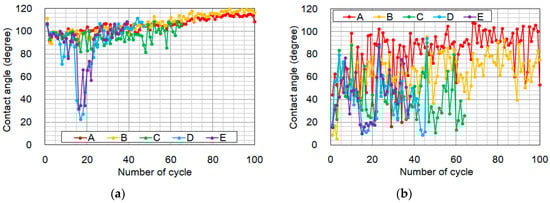
Figure 4.
Change in contact angle with number of cycles in 100-cycle test with gap spacing 2 mm. (a) Just before commencement of voltage application. (b) Just after voltage interruption.
Large fluctuation of contact angle may be attributed to microscopic uneven surface caused by partial discharge, not only erosion like pitting but also accumulation of discharge by-product on the surface as suggested by the results of surface roughness measurement shown later in Figure 7. Contact angle does not necessarily reflect the surface profile in a small area, because the size of a water droplet for evaluation of contact angle is large enough to mask microscopic uneven surface and consequently an average information on surface in a larger area will be given.
3.3. Observation of Sample Surface
Optical and confocal microscope images of sample surface are shown in Figure 5, which indicate change in surface erosion in the area of 1.5 mm × 1.5 mm of samples A and E in the 100-cycle test with 1 mm air gap. It is clearly shown especially by confocal microscope images that surface erosion progresses gradually with the number of cycle and degree of erosion is much different between samples A and E; surface erosion of sample E is serious and sample A is eroded slightly even after completing 80th cycle.

Figure 5.
Optical and confocal microscope images of surface of samples A and E obtained in the 100-cycle test with 1 mm air gap.
Figure 6 shows confocal microscopic images of all samples taken after completing 80 cycles in the 100-cycle test with 1 mm air gap. Appearance of surface erosion of Sample B is similar to that of Sample C. Sample D has eroded surface similar to Sample E. Samples D and E are severely damaged, which relates to the shorter lifetime to breakdown as shown in Table 2.

Figure 6.
Confocal microscope images of sample surface obtained after completing 80 cycles in the 100-cycle test with 1 mm air gap. (a) Sample A; (b) Sample B; (c) Sample C; (d) Sample D; (e) Sample E.
A quantitative discussion of surface erosion will be given in the next section.
3.4. Surface Erosion
3.4.1. Analysis Based on Surface Roughness Meter
Figure 7 shows surface roughness profiles of samples A and E, which are obtained after completing 6 and 60 cycles in the 100-cycle test with 1 mm air gap. Negative surface roughness means pitting on a sample surface generated by partial discharge. Discharge by-product accumulated on the sample surface may be a possible reason for the positive surface roughness. No remarkable change in surface roughness of sample A is observed between after 6 and 60 cycles. On the contrary, the surface of sample E is more eroded after completing 60 cycles; surface roughness is ~10 times larger compared with that after completing six cycles. These results correspond well to lower contact angle and shorter lifetime to breakdown of sample E compared with those of sample A, which is described above.

Figure 7.
Examples of surface roughness profiles obtained with surface roughness meter in the 100-cycle test with 1 mm air gap.
To evaluate quantitatively surface roughness shown in Figure 7, the arithmetic mean roughness Ra is used. Change in Ra in the 50-cycle tests with 1 and 2 mm air gap are shown in Figure 8a,b, respectively. When applied voltage is low, it is clear from Figure 8a that erosion of samples B to E progresses gradually with the number of cycle. Surface erosion is progressed in the order of samples D and E, samples B and C, and A, but difference among samples is not significant. In the case of 2 mm air gap, higher applied voltage intensifies partial discharge activity in the air gap and samples are clearly divided into three groups from standpoint of surface erosion. Samples D and E are eroded seriously by partial discharge and finally break down before completing 100 cycles. Erosion of samples B and C progresses steadily with the number of cycle. Sample A is eroded little. It is understood from Figure 8a,b that acceleration of partial discharge erosion is achieved by increasing applied voltage and gap spacing, especially for samples D and E.

Figure 8.
Change in Ra with number of cycle in the 50-cycle tests. (a) 1 mm air ga; (b) 2 mm air gap.
Ra obtained in the 100-cycle test is shown in Figure 9 for 1 mm air gap. Ra increases gradually with the number of cycle except sample A. The characteristics of samples B and C are similar to each other. The same can be said of samples D and E. The result for 2 mm air gap are not shown because only limited data were available due to failure of the measuring instrument. Comparing Figure 9 with Figure 8a, obtained under the same applied voltage and the same gap spacing, surface roughness after completing 40 cycles, for example, is almost the same for any sample. This shows a good repeatability of results, suggesting the proposed experimental procedures are suitable to investigate partial discharge degradation of silicone rubber.

Figure 9.
Change in Ra with number of cycle in the 100-cycle test with 1 mm air gap.
3.4.2. Analysis Based on Confocal Microscopic Images
In the previous section, surface roughness along the 3 mm straight line is discussed. Analysis of surface roughness in the area (1.5 mm × 1.5 mm) is available with confocal microscopic images shown in Section 3.2. Three-dimensional coordinate can be obtained at the time of surface scanning, where X- and Y-coordinates indicate the location on the sample surface and Z-coordinate shows height with reference to the sample surface without erosion.
Figure 10a,b shows changes in the arithmetic average roughness Ra over the 1.5 mm × 1.5 mm area with the number of cycle in the 100-cycle tests with 1 mm and 2 mm air gap, respectively. Samples D and E give larger Ra when compared with the other samples, which is the same tendency with results obtained with the surface roughness meter. Ra in Figure 10 is much larger than that in Figure 8 and Figure 9. A possible reason is the difference in resolution of measuring instruments used. As the surface roughness meter is a stylus type apparatus, a fine probe needle is moved on a sample surface. Surface roughness is obtained based on up-and-down movement of the probe. Thus, it is considered difficult to measure precisely the depth of a narrow pitting smaller than the probe diameter, resulting in lower value of Ra. Meanwhile, LASER beam is used to evaluate surface roughness in the confocal microscope. Since the resolution is higher and a long and narrow pitting can be evaluated precisely, larger Ra is obtained.

Figure 10.
Change in Ra with number of cycle in the 100-cycle tests. (a) 1 mm air gap; (b) 2 mm air gap.
3.5. FTIR Spectrum
Change in FTIR spectrum with the number of cycle is shown in Figure 11 for all samples, which are obtained in the 100-cycle test with 2 mm air gap. Characteristics of Samples B and C are similar to each other. The same can be said of Samples D and E. These results correspond to progress of surface roughness described above.
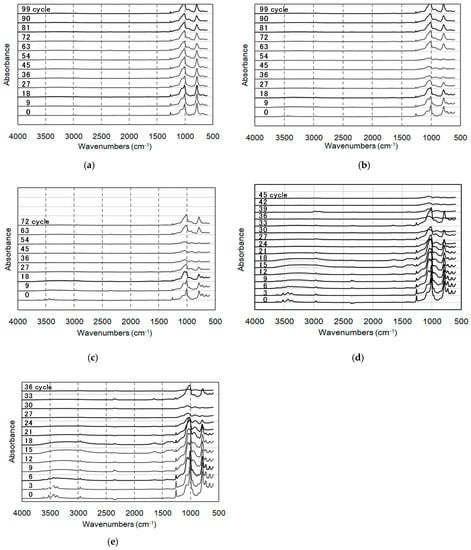
Figure 11.
Change in FTIR spectra with the number of cycle obtained in the 100-cycle test with 2 mm air gap. (a) Sample A; (b) Sample B; (c) Sample C; (d) Sample D; (e) Sample E.
In the case of sample A without ATH, absorbance around 786 and 1257 cm−1 attributed to hydrophobic Si-CH3 [13] decreases with the number of cycle. Almost no change is observed in absorbance around 1008 cm−1 attributed to Si-O-Si. Increase of silica-related absorbance [13] is observed around 1060 cm−1 with increase in the number of cycle. A decrease in absorbance of hydrophobic Si-CH3 and almost no change in absorbance of Si-O-Si, shown in Figure 12a, suggest that a side chain of silicone rubber is cleaved by partial discharge but main chain is damaged little, leading to limited erosion.

Figure 12.
Change in normalized absorption of Si-CH3 and O-Si-O with the number of cycle obtained in the 100-cycle test with 2 mm air gap. (a) Sample A; (b) Sample E.
In sample E, eroded more by partial discharge compared with sample A, absorbance around 3620–3370 cm−1 vanishes when the number of cycle is large, which is related to ATH [13]. At the same time, absorbance around 940 cm−1 increases, which is attributed to Si-H [13]. It is suggested that ATH changes into aluminum hydroxide by losing hydroxyl groups. Not only absorbance of hydrophobic group Si-CH3 but also that of Si-O-Si of main chain of silicone rubber decrease rather rapidly with the number of cycle as shown in Figure 12b, suggesting progress of silicone rubber decomposition and short lifetime to breakdown.
4. Discussion
The proposed experimental procedures containing a cycle of 8-h voltage application and 16-h interruption seem suitable to evaluate partial discharge degradation of hydrophobic material like silicone rubber because hydrophobicity recovers almost to the initial value during 16 h. It reflects a practical usage condition of polymer insulators that hydrophobicity recovers if factors affecting hydrophobicity are removed.
Consistent results are obtained in 50- and 100-cycle tests. In both tests, surface erosion is larger in the order of samples D and E, samples B and C, and sample A. Progress of partial discharge degradation of silicone rubber, especially samples D and E, is accelerated in the case of 2 mm gap spacing compared with that of 1 mm in both tests.
Figure 13 shows change in Ra of five kinds of samples up to 50 cycles measured with the surface roughness meter, which are obtained by carrying out experiments 3 times under the condition of 1 mm air gap. Each sample shows almost the same performance in any experiment. Also Ra is larger in the order of samples D and E, samples B and C, and sample A in any experiment. It is considered the proposed experimental procedures give acceptable repeatability of results.

Figure 13.
Repeatability of change in Ra with number of cycle obtained for 1 mm gap spacing. (a) samples A, C, and E; (b) samples B and D.
Surface erosion of a sample increases gradually by partial discharge with the number of cycle. In samples D and E, decrease in hydrophobic Si-CH3 and Si-O-Si of main chain is confirmed by FTIR analysis. This is a possible reason for low contact angle, sever surface erosion, and consequently short cycles to breakdown. Samples D and E contain ATH, which is considered effective to enhance resistance to tracking and erosion by discharge because heat is absorbed by releasing the water of hydration from ATH molecule when the temperature of an ATH filled polymer reaches ~200 degrees [1,14]. This role of ATH seems effective for partial discharge because decrease in ATH is suggested through FTIR analysis in the present study. Nevertheless, surface erosion of samples D and E containing ATH is serious compared with sample A without ATH. This is attributed to intensified partial discharge activities in the air gap for samples D and E because their higher permittivity generates higher localized electric field in the air gap of the electrode system. Lower resistivity of samples D and E may also relate to shorter lifetime to breakdown.
5. Conclusions
The proposed experimental procedures of partial discharge degradation of silicone rubber are evaluated by experimental results using five kinds of silicone rubber samples. Also the difference in resistance to partial discharge among samples are discussed. The results are summarized as follows.
- The procedures proposed in this study is considered suitable for investigation of partial discharge degradation of hydrophobic material like silicone rubber. It has advantages of no arc discharge occurrence, recovery of hydrophobicity during the resting time, acceptable repeatability of results, and possible acceleration of degradation by adjusting gap spacing and applied voltage.
- It is confirmed that surface erosion of silicone rubber progresses gradually and finally breakdown occurs only by partial discharge, though instantaneous damage is smaller compared with arc discharge. Partial discharge is one of the important factors in the long-term electrical insulation design of polymer insulators.
- It is suggested ATH is not necessarily effective to prevent breakdown of silicone rubber by partial discharge when localized electric field in air gap is enhanced by adding ATH. In such a situation, lower permittivity and higher resistance of silicone rubber seem more dominant factors to prevent damage by partial discharge and a careful insulation design should be required.
- Considering the actual usage condition of polymer insulators, applied voltage is fixed in the present study. Quantification of partial discharge activities and discussion of erosion from this standpoint are also important. Furthermore, degradation phenomena when discharge is kept constant across different sample is another important topic. The authors would like to investigate them in the near future.
Author Contributions
Conceptualization, K.K. and Y.M.; Methodology, K.K., H.L. and M.S.; Validation, K.K.; Formal Analysis, K.K., H.L. and M.S.; Investigation, K.K. and H.L.; Resources, Y.M.; Data Curation, K.K.; Writing-Original Draft Preparation, K.K.; Writing-Review & Editing, Y.M.; Visualization, K.K. and M.S.; Supervision, Y.M.; Project Administration, K.K. and Y.M.; Funding Acquisition, Y.M.
Funding
This research received no external funding.
Acknowledgments
The silicone rubber samples were supplied in connection with activities of an Investigating R & D Committee of the Institute of Electrical Engineers of Japan. The authors would like to thank the members of the committee.
Conflicts of Interest
The authors declare no conflict of interest.
References
- Kumagai, S.; Yoshimura, N. Tracking and Erosion of HTV Silicone Rubber and Suppression Mechanism of ATH. IEEE Trans. Dilectr. Electr. Insul. 2001, 8, 203–211. [Google Scholar] [CrossRef]
- Aeshad; Nekahi, A.; McMeekin, S.G.; Farzaneh, M. Flashover Characteristics of Silicone Rubber Sheets under Various Environmental Conditions. Energies 2016, 9, 683. [Google Scholar] [CrossRef]
- Nazemi, M.H.; Hinrichsen, V. Experimental Investigations on Water Droplet Oscillation and Partial Discharge Inception Voltage on Polymeric Insulating Surface under the Influence of AC Electric Field Stress. IEEE Trans. Dielectr. Electr. Insul. 2013, 20, 443–453. [Google Scholar] [CrossRef]
- Sarathi, R.; Mishra, P.; Gautam, R.; Vinu, R. Understanding the Influence of Water Droplet Initiated Discharges in Damage Caused to Corona-Aged Silicone Rubber. IEEE Trans. Dielectr. Electr. Insul. 2017, 24, 2421–2431. [Google Scholar] [CrossRef]
- Nazir, M.T.; Phung, B.T.; Hoffman, M. Performance of Silicone Rubber Composites with SiO2 Micro/Nano-filler under AC Corona Discharge. IEEE Trans. Dielectr. Electr. Insul. 2016, 23, 2084–2815. [Google Scholar] [CrossRef]
- Habas, J.P.; Arrouy, J.M.; Perrot, F. Effect of Electric Partial Discharges on the Rheological and Chemical Properties of Polymers Used in HV Composite Insulators after Railway Service. IEEE Trans. Dielectr. Electr. Insul. 2009, 16, 1444–1454. [Google Scholar] [CrossRef]
- Gubanski, S.M. Outdoor Polymeric Insulators: Role of Corona in Performance of Silicone Rubber Housings. In Proceedings of the IEEE International Conference on Electrical Insulation and Dielectric Phenomena (CEIDP), Ann Arbor, MI, USA, 18–21 October 2015; pp. 1–9. [Google Scholar]
- Ueda, F.; Oue, K.; Mizuno, Y. Degradation of Silicone Rubber Caused by Partial Discharge in Clean Fog. In Proceedings of the 11th International Conference on the Properties and Applications of Dielectric Materials, Sydney, Australia, 11–22 July 2015. Paper No. AL0-5. [Google Scholar]
- Ueda, F.; Tamamura, M.; Mizuno, Y. Degradation of Silicone Rubber Caused by Partial Discharge in Clean Fog and in Atmosphere. In Proceedings of the Conference on Electrical Insulation and Dielectric Phenomena, Toronto, ON, Canada, 16–19 October 2016. Paper No. 8A-12. [Google Scholar]
- Komatsu, K.; Shimada, M.; Mizuno, Y. Interaction of Partial Discharge in Air with Silicone Rubber. In Proceedings of the International Conference on High Voltage Engineering, Athens, Greece, 10–13 September 2018. Paper No. P-AM-4. [Google Scholar]
- Hikita, M.; Hishikawa, S.; Kondo, T.; Yaji, K. Surface Modification and Performance of Polymer Composite Materials for Outdoor Insulation. In Proceedings of the Annual Meeting of IEEJ, Nagoya, Japan, 20–22 March 2013. Paper No. 2-S1-4. [Google Scholar]
- Surface Roughness Terminology and Parameters. Available online: https://www.predev.com/pdffiles/surface_roughness_terminology_and_parameters.pdf (accessed on 18 June 2019).
- Gao, Y.; Wang, J.; Liang, X.; Yan, Z.; Liu, Y.; Cai, Y. Investigation on Permeation Properties of Liquids into HTV Silicone Rubber Materials. IEEE Trans. Dielectr. Electr. Insul. 2014, 21, 2428–2437. [Google Scholar] [CrossRef]
- Meyer, L.; Grishko, V.; Jayaram, D.; Cherney, E.; Duley, W.W. Thermal Characteristics of Silicone Rubber Filled with ATH and Silica under Laser Heating. In Proceedings of the Conference on Electrical Insulation and Dielectric Phenomena, Cancun, Mexico, 20–24 October 2002; pp. 848–852. [Google Scholar]
© 2019 by the authors. Licensee MDPI, Basel, Switzerland. This article is an open access article distributed under the terms and conditions of the Creative Commons Attribution (CC BY) license (http://creativecommons.org/licenses/by/4.0/).