Abstract
In a nuclear power plant, it is essential to improve the seismic safety of the piping system for the coolant transfer to cool the high temperature caused by the nuclear reaction. Under this background, this study makes two major contributions. The first is that though tuned mass dampers (TMDs) were originally used only to reduce the vibration of piping itself, through this research, it was first proved that it had a positive effect on the improvement of the seismic performance of nuclear piping systems. Additionally, this study proposed a design approach that effectively obtains the optimal design values of TMDs associated with seismic performance. In order to effectively derive the TMD optimum design values, we not only utilized the existing TMD optimum design formula, but also additionally proposed a frequency response analysis-based TMD optimal design method. As a result, it was seen that primary responses of system were significantly reduced under the input seismic load due to the use of TMDs for the piping system. It was also confirmed that the use of the existing TMD formula brought about a similar degree of response reduction effect, while it was possible to get the improved effect when using the proposed method.
1. Introduction
A tuned mass damper (TMD) is one of the most used devices for structural vibration control. The concept of vibration control using a TMD began in 1909 when Frahm [1] developed a vibration control device called the “Dynamic Vibration Absorber”. Although a TMD is the oldest structural vibration control technique concept, it is still widely used in many fields. Examples of applications of TMDs include but are not limited to various civil/architectural/mechanical structural systems such as buildings, bridges, control towers, mechanical structures, etc. The actual application of TMDs to structures is usually achieved when the external excitation’s major frequency and the major natural vibration modes of the target structure are close together.
The TMD is attached to the target structure as an auxiliary device consisting of a mass, spring, and damper and converts the main vibration of the structure into a motion in the TMD, thereby reducing the vibration of the structure itself. Numerous studies on how to obtain the mass ratio, stiffness coefficient, and damping coefficient, which are the main design parameters of the TMD, have been performed to date. Den Hartog [2] proposed an optimal TMD design equation for a single-degree-of-freedom (SDOF) structure subjected to a harmonic excitation as a closed-form function of the mass ratio. Warburton [3] derived a closed equation for optimal TMD design values for an un-damped SDOF structure system under various vibrational loading conditions. However, in the case of damped structures, with respect to obtaining the TMD design value, it is necessary to use numerical schemes since no closed-form expressions can be derived. The reason for this is that once a damping is present in the target structure, it loses a useful feature of a structure-TMD system. This feature is the existence of a two ‘fixed point’ frequency, at which the transmission of vibration is independent of the damping of the attached TMD. Moreover, because the target structure is generally represented as a complex system of multiple-degrees-of-freedom (MDOF), there is a practical limitation to obtain the TMD optimum design formula or to use the existing optimum design formula of the SDOF structure. Accordingly, Ioi and Ikeda [4], Sadek et al. [5], etc. have proposed a TMD optimum design formula taking into account the damping ratio of the target structure utilizing a certain assumption. Such assumption is that the existence of ‘two fixed points’ frequencies may still be assumed to be valid in an approximate sense for the moderately damped structures [6]. In particular, Rana and Soong [7] proposed an optimal TMD design method for a MDOF structural system. The proposed design method was done by replacing a damped MDOF structure with a damped SDOF structure of the target mode, which needs to be mitigated, and then numerically obtaining the optimal TMD design values based on such a SDOF structure. Besides the above studies, other studies have been done by many researchers to find the optimal TMD design values for diverse seismic loadings through various numerical optimization techniques for the purpose of enhancing the seismic performance of structures of interest [8,9,10,11,12,13,14,15,16]. One study [17] presented a TMD design framework that could consider two types of uncertainties such as the stochastic excitation modeling of an earthquake, and the inherent uncertainty of internal parameters of the damping device and the subsoil. Thus, the study of TMD optimal design up to now has provided important theoretical insights and methodologies for the seismic reinforcement of high-rise buildings, towers, bridges, etc., and has enabled intuitive designs of the TMDs for such structures. However, it is not easy to apply such a TMD optimal design methodology to improve the seismic performance of complex systems such as piping systems where various modes affect the overall seismic response. Due to this reason, quantitative research has rarely been done on how much TMDs can reduce the seismic response and improve the seismic performance with respect to a piping system that contains many dominant modes.
In a piping system, it has already been proven theoretically and experimentally that the use of various damping devices, such as direct dampers, dynamic absorber, connecting dampers, etc., are effective tools for improving seismic performance [18]. Moreover, concerning vibration reduction studies of piping systems, these devices have been frequently used for the vibration mitigation plans of various piping systems. Specifically, Park et al. [19] applied common snubbers and energy absorption supports to piping systems and analyzed their effects on seismic response reduction by performing shake table tests and numerical analyses. Fujita et al. [20] performed a seismic response analysis on piping systems with non-linear support by using a differential algebraic equation and analyzed the effects of the device based on this result. Bakre et al. [21,22] established a relevant piping numerical model based on the results of the shake table tests of a piping system that used a sliding friction damper and x-plate damper carried out in 1995 at Tsukuba NIED, Japan, and analyzed these devices’ effects on the seismic performance of piping system. Jia et al. [23] developed a new type of damper applicable to piping systems and verified it experimentally. Kumar et al. [24] applied a semi-active variable stiffness damper to a piping system, and its effects on the seismic response reduction of the piping system were analyzed for three-way seismic input.
The studies on improving the seismic performance of piping systems through dampers so far have mostly been done using direct dampers or snubbers in many cases. These types of devices are basically supported on the floor, which increases the dynamic stiffness of the system through connection with a particular part of the piping or by dissipating the seismic input energy into the inside of a device, thereby increasing the seismic performance of the piping. Because of these characteristics, the use of a device with a support point has a considerable effect on the dynamic characteristics of the original piping system. Furthermore, there is some limitation in that a space and a structure are required for this support point. The TMD, on the other hand, is attached only to the piping and performs energy absorption functions, which has little effect on the dynamic characteristics of the original piping system, and does not require a separate support structure or space. Thus, some studies have been done for the application of TMDs on piping systems. However, such studies using the TMDs on the piping so far have focused on reducing the vibration of the piping system itself [25,26,27,28], and these studies were not for the purpose of increasing the seismic performance of the piping system, and very few studies have quantitatively analyzed the effects of TMDs. Although Kunieda et al. [18] had demonstrated experimentally against the possibility of raising the seismic performance of a piping system through a TMD, this was a study conducted with an emphasis on the operational performance of a single TMD on some elements of the piping subjected to a harmonic ground motion. Chang et al. [29] analyzed the effects of applying a TMD in the form of a stock bridge damper (SBD) to a piping system on the reduction of the seismic response; however, they did not present a generalized TMD design method because their study concentrated on the application of a particular single SBD. Moreover, they did not study the piping response reduction effect in terms of the difference between the TMD design methods.
Based on this background, this study quantitatively analyzed the effects of increasing the seismic performance of a piping system by using multiple TMDs and developed a process that effectively finds the optimal TMD design values. In this respect, this study offers two major contributions. The first is that though TMDs were originally used only to reduce the vibration of piping itself, through this research, it was first proved that it had a positive effect on the improvement of the seismic performance of nuclear piping systems. The second, this study proposed a design approach that effectively obtains the optimal design values of TMDs associated with seismic performance. Specifically, obtaining the TMD optimal design values is basically based on utilizing the existing TMD optimum design formula to avoid conducting numerical optimization approach through a direct earthquake time history analysis which is much costly to calculate. Moreover, an additional TMD optimal design method based on frequency response analysis is proposed to effectively consider the mode linkage effect of a TMD-piping integrated system which the existing TMD optimal design formula approach cannot handle. To verify the validity of the proposed design process, the TMDs, which are designed by using various existing TMD optimum design formula/methods and the proposed frequency response analysis-based TMD optimal design (hereafter, FRA-based TMD optimal design) approach, were respectively applied to a piping system. Their performances were analyzed by comparing the seismic responses of the original piping system with those of the TMD-piping integrated system designed by various optimal design formula/methods.
2. Existing Formula/Method and Proposed Approach
2.1. Existing TMD Optimum Design Formula and Methods
Numerous studies on how to derive the TMD optimal design values for the mass ratio, the stiffness coefficient, and the damping coefficient have been performed to date. Den Hartog [2] proposed a TMD optimum design formula as a function of the mass ratio for a SDOF structural system subjected to a harmonic excitation. Specifically, he developed a closed-form equation for the optimal TMD design parameters such as the frequency ratio fopt and damping ratios ζd,opt which minimize the steady-state response of the structure subjected to a harmonic excitation acting on the structure mass. Here, the harmonic excitation was considered as this harmonic function P(t) = P0*sin(ωt), and the damping effect of the structure was neglected. As such, the TMD optimum design formula was derived based on the fact that the dynamic amplification factor (i.e., R = Xmax/Xst, the ratio of the dynamic response to the static response) of Equation (1) passes through two fixed points, regardless of the values of ζd, and these were formulated as Equations (2) and (3) as follows:
where μ is the TMD mass (m) to main structure mass (M) ratio; and β is ratio of excitation frequency to the natural frequency of structure.
Subsequently, Warburton [3] derived closed equations for optimal TMD design values for an un-damped SDOF structural system under various vibrational loading conditions. The following equation shows the TMD optimum design formula derived when a random ground motion with a white noise acts on the target structure:
However, in the case of damped structures, the two fixed points at both ends, which exist regardless of the damping ratio of the TMD, are no longer valid due to the damping of the structure. Therefore, the optimal TMD parameter cannot be basically derived as a closed-form formula, but only be obtained by a numerical method that minimizes the dynamic amplification factor. Moreover, because the target structure is generally represented as a MDOF complex structural system, there is also some practical limitation in obtaining the TMD optimum design formula. Under these conditions, Ioi and Ikeda [4] and Sadek et al. [5] derived the TMD optimum design function as Equations (6), (7) and Equations (8), (9), respectively, by considering the damping ratio (ζ) of the target structure with some major assumptions:
In particular, Rana and Soong [7] proposed a method for numerically obtaining the TMD optimal design values by replacing a damped MDOF structural system with a damped SDOF system only containing a mode with a vibration reduction target. Here, the dynamic amplification factor for the harmonic excitation is derived as follows from the governing equation of motion for a Two-DOF system which is the combination of a SDOF system of TMD and a SDOF system of the damped SDOF target structural system:
Based on this dynamic amplification factor, the TMD optimal design values are obtained through an optimal combination that minimizes the dynamic amplification factor among the various combinations of the TMD design parameters f and ζd through the following numerical optimization approach:
Finally, the optimum TMD stiffness (kopt) and damping coefficient (copt) can be estimated as follows based on the TMD optimum design values fopt and ζd,opt obtained from above:
The proposed generalized TMD optimum design formula and method proposed above are basically a method for deriving the TMD optimum design parameter values by minimizing the dynamic amplification factor response in the frequency domain based on the simplified SDOF target structure. Recently, a number of case studies have been reported by researchers. These case studies are mostly focused on finding the optimal TMD design values by directly minimizing the response of interest of a target MDOF structure under a specific earthquake at a target site through various numerical optimization techniques.
2.2. TMD Optimal Design Approach for a Piping System
In the TMD optimal design for a typical MDOF structural system, it is not straightforward to apply the proposed TMD optimum design formula for the purpose of a SDOF structural system introduced in Section 2.1. Thus, Soong and Dargush [30] proved theoretically that this proposed TMD optimal design formula is valid even for MDOF complex structural systems, and Rana and Soong [7] specifically described the TMD optimal design process for a three-story structure system subjected to harmonic base excitation. Specifically, in that study, a 3-DOF structural system was replaced with a SDOF system aimed at a specific mode (primary mode), and based on this, it is considered as a 2-DOF structural system which is combined by a SDOF system of TMD and a SDOF system of such SDOF target mode structure. The TMD optimal design values for fopt and ζd,opt are derived by minimizing the dynamic amplification factor regarding the 2-DOF system which are basically extracted from the decoupled target mode and the TMD, using a numerical optimization. Based on these design values, the optimum design stiffness and damping coefficient values are calculated by Equations (12) and (13). Recently, several studies, where a number of time history analyses were conducted by directly considering the seismic load and simplified MDOF dynamic numerical analysis models, and based on this, optimal TMD design values were derived through numerical optimization techniques, have been studied [14,15]. However, the proposed TMD optimal design method so far is applicable to buildings, towers and bridges where one mode represents the dynamic characteristics of a structure, and it is not easy to apply it directly to relatively complex structural systems, such as piping systems, in which various modes affect the overall dynamic response of a structure. Furthermore, the recently studied TMD optimal design approach has a fundamental limitation: during the process of finding the optimal design, thousands of earthquake time history analyses of the target structure should be carried out, which has a large computational cost, and such a process often leads to no optimal value.
Under these circumstances, in this paper, we present the process for effectively finding the optimum TMD design values for a piping system under an earthquake load. This is basically based on the use of the existing TMD optimum design formula to avoid the optimization process through direct earthquake time history analyses. Moreover, to effectively consider the mode coupling effect of the TMD-piping integrated system, which cannot be considered by the existing TMD optimum design equation, a FRA-based TMD optimal design method is proposed. To verify the validity of the optimal design approach for the piping system proposed in this study, the TMD design values, which were obtained from the various conventional TMD optimum design formula/methods and from the FRA-based TMD optimal design method, were applied to an example piping system. Their TMD performances according to the difference in design methods were compared and analyzed based on the response of the original piping system without the TMDs. Specific details of the TMD optimal design approach for the piping system proposed in this study are as follows:
- (1)
- A mode analysis is performed on a target piping system. From these mode analysis results, the modes with a high mass participation rate (that is, the modes contributing greatly to the overall piping system response) are selected as the “TMD installation target mode candidate”.
- (2)
- Given the design seismic load in the frequency domain (i.e., a design spectrum), the frequency band in which the earthquake input energy is concentrated is identified and based on this frequency band, the “TMD installation target mode” is finally selected.
- (3)
- The specific TMD installation location becomes the point where the maximum response shape of the “TMD installation target mode” occurs.
- (4)
- Option 1: After the TMD installation location has been selected, the optimal TMD design values for each TMD installation target mode are calculated using the TMD optimum design formula (Den Hartog equation, etc.) or the TMD optimal design method of Rana and Soong [7]. These approaches basically have some limitation that the mode linkage effect of the TMD-piping integrated system cannot be taken into account because these types of methods find the TMD optimal design values by replacing the TMD installation target mode of the target structure with the SDOF system.
- (5)
- Option 2: After the TMD installation location is chosen, a piping dynamic numerical model is constructed by applying all the desired TMDs. Based on such an established TMD-piping coupled dynamic numerical model, numerical optimization technique is used to derive the TMD optimal design value that minimizes the frequency response of interest. Here, the numerical cost is minimized through the response surface method (RSM) based on an appropriate sampling technique because numerous frequency response analyses must be performed during the numerical optimization process.
- (6)
- Finally, the TMD optimal design values acquired from “Option 1” or “Option 2” are directly applied to the piping dynamic numerical model to analyze the frequency response and seismic response and to verify and analyze the actual response reduction effect.
In summary, the reason for using these two options basically in the proposed design process above is as follows: For the first option, the use of the existing design formula developed for a SDOF structure-SDOF TMD system is also valid for the multiple TMD design for complex piping systems. Thus, this approach can fundamentally eliminate the cost of related analysis and optimization necessary to find TMD design parameters. However, since the first option does not take into account the associated mode linkage effect of the coupled system of the TMD-structure, there is a limit to which the global optimal TMD design solution cannot be obtained. Accordingly, the second option suggests deriving the optimal TMD design value through numerical optimization based on the frequency response analyses of the combined numerical model of the TMD- structure. Because the numerical analysis utilizes the frequency response analysis, the numerical inefficiency problem of numerical optimization based on the direct seismic response analysis can be improved. In the following section, the TMD optimal design process approach for the piping system subjected to the earthquake load introduced in this section was applied to the benchmark piping system presented in NUREG/CR-1677 [31]. Basically, the seismic responses of the piping systems with/without TMDs were compared and analyzed. Additionally, the comparison results of the seismic performance of the piping according to the differences between the used TMD optimal design formula/methods are revealed.
3. Results and Discussion
In this section, the TMD optimal design approach for the piping system subjected to seismic loads introduced in this study was applied to the NUREG/CR-1677 benchmark piping system presented by Bezler et al. [31]. Additionally, the related results are compared and analyzed according to the TMD optimum design formula and methods. The piping system consists of a 3.5-inch diameter water pipeline connecting two points at two different heights. Both end points of the piping at different heights are fixed by anchors, and the piping part between both anchor points is constrained to intermediate supports. The related numerical modeling information, material properties, and piping layout for this piping system are shown in Table 1 and Figure 1, and more details are given in the references mentioned above.

Table 1.
Material properties and modeling information for NUREG/CR-1677 Benchmark piping system.
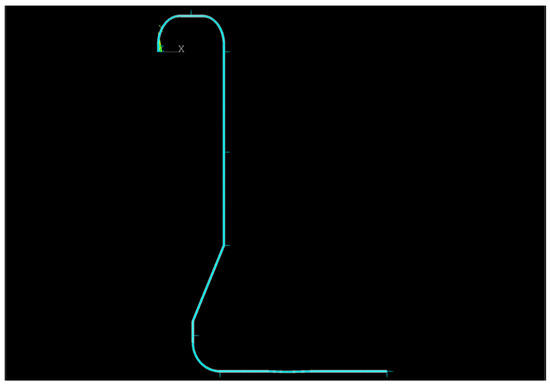
Figure 1.
NUREG/CR-1677 Benchmark piping system layout and numerical model
3.1. TMD Optimal Design for the NUREG/CR-1677 Benchmark Piping System
To begin with, the mode analysis of the target piping system was performed according to the TMD optimal design approach for the piping system subjected to the seismic load mentioned in Section 2.2. In this study, numerical analysis was performed in the ANSYS framework; thus, the target piping system defined above was modeled using ANSYS (see Figure 1), and such, the model was verified by comparing with the original mode analysis results (Bezler et al. [31]). One of the major contributions of this paper is the use of TMDs for upgrading the seismic performance of piping systems of nuclear power plants. In this respect, this study basically utilized seismic design loadings used in nuclear power plants. The seismic loads mainly used in nuclear power plants are defined in the USNRC Regulatory Guide (RG) 1.60 [32], and these loads have been developed in the form of a design ground response spectrum (called DGRS or DRS) based on measured earthquake ground motions in the United States. The measured earthquake motions on the ground surface are the earthquake ground motion records of the ground surface created by the seismic wave that passed through the multiple strata from the earthquake source (i.e., hypocenter). Such records are the final output results generated through body waves of P-wave and S-wave and surface waves of Love-wave, Rayleigh-wave, Stoneley-waves, etc. In this study, seismic load was defined as the DRS setting a design-basis seismic intensity (also called safe shutdown earthquake: SSE) as 0.3 g based on the spectrum presented in USNRC RG 1.60 as in the current seismic design practice of nuclear power plant (see Figure 2). In order to perform the earthquake time history response analyses, artificial earthquake time history loadings enveloping the defined DGRS were generated and the generated artificial earthquake loadings satisfied the requirements (USNRC Standard Review Plan 3.7.2 [33]) required by the regulatory body (strong earthquake duration, spectrum requirements, etc.). Figure 3 shows seismic artificial time histories (ATH) generated based on the defined 0.3g SSE DRS. The seismic ATH was generated such that the response spectrum calculated from the seismic ATH enveloped the defined DRS as we can see in Figure 2. The elements of the numerical model of the piping system were beam elements and links, and the total system mass was 444.1 kg, consisting of 844 nodes and 281 elements in total. Figure 3 shows the numerical model of the target piping system modeled in ANSYS and the three major mode shapes. Table 2 summarizes the frequencies obtained through the mode analysis and the mode participation mass results for these frequencies. The detailed TMD optimal design process for this target piping system can be described as follows.
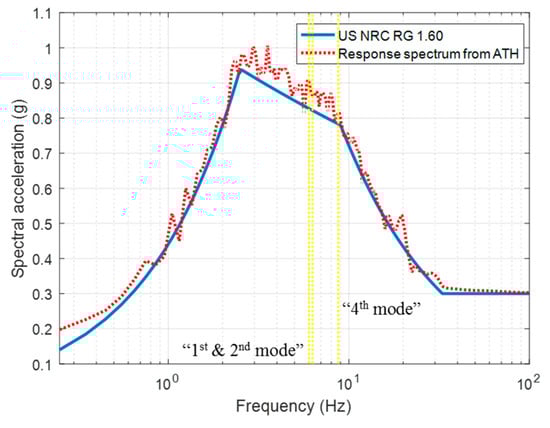
Figure 2.
Seismic design response spectrum and expression of the TMD installation target modes
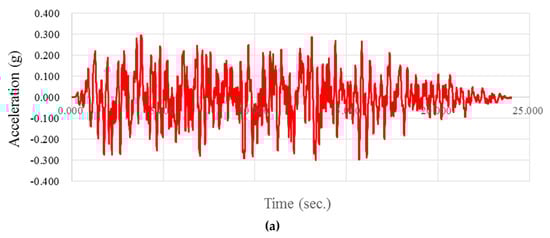
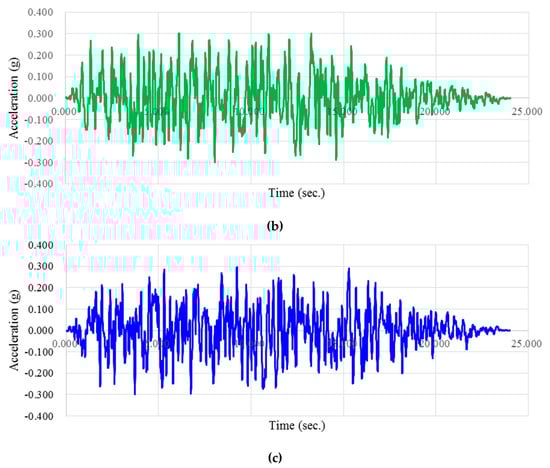
Figure 3.
Seismic artificial time histories (ATH) enveloping US NRC RG 1.60 seismic design spectrum: (a) X direction; (b) Y direction; (c) Z direction.
Table 2.
Mode analysis result of the NUREG/CR-1677 Benchmark piping system
- (1)
- Based on the results of the mode mass participating rate of Table 2 calculated from the validated numerical model, five candidate modes (1st, 2nd, 4th, 12th and 13th modes: modes with a mass participating rate of approximately 10% or higher) that could affect the overall response as the target mode for installing the TMDs were chosen. These candidates for the TMD installation target modes are shaded in the results of the mode analysis of Table 2.
- (2)
- The shape of the seismic load for the design response spectrum input (i.e., design seismic load in the frequency domain) to the target piping system is defined in Figure 2, which shows that the frequency band with concentrated seismic energy is approximately 2.5 to 9 Hz. Therefore, based on such a frequency band for which the seismic input energy was concentrated, the candidates for the target modes for the TMD installation were reviewed, and 1st, 2nd, and 4th mode were finally selected as the target modes for the TMD installation because these modes were the most valid. To show more clearly the determination of the target modes for installing the TMD, “TMD installation target modes” were expressed in the design response spectrum of Figure 2 as a yellow dotted column (Table 2 as “yellow shading”). As can be seen from Figure 2, it is confirmed that the TMD installation target modes are located in the frequency band where the seismic energy is concentrated.
- (3)
- To determine the specific TMD installation location, the detailed shapes of the TMD installation target modes are presented in Figure 4. Based on these individual target mode shapes, the points at which the maximum responses by the modes were generated were selected as the locations at which the TMDs should be installed. Figure 5 shows the specific TMD installation locations and the numerical piping model integrated with the TMDs.
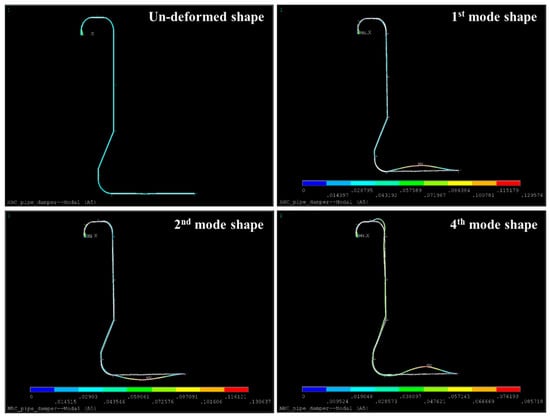 Figure 4. Numerical model and major mode shapes of the NUREG/CR-1677 Benchmark piping system
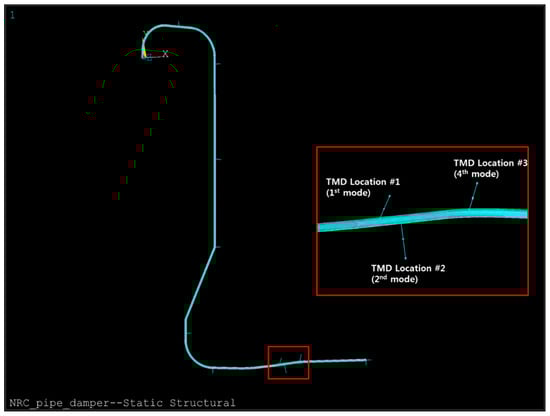 Figure 5. TMD-Piping coupled numerical model and locations of the TMD installation on the piping.
 - (4)
- The optimal TMD design values for each TMD installation target mode were derived with the TMD optimum design formula introduced in Section 2.1 according to Option 1 of Section 2.2. Table 3 and Table 4 summarize the obtained values for the TMD optimal design variables. The TMD optimum design formula used was the Den Hartog equation and the Warburton equation as the case where the damping of the target system was not considered, and the Rana and Soong design method was used as the case where the damping of the target system was considered. Here, each TMD mass was set to 4 kg, which was about 1% of the total piping system mass. The damping ratio of the numerical model of the overall piping system was set to 4% according to the USNRC RG 1.61 [34] recommendation on the damping ratio of the piping system subjected to the SSE load. As mentioned in the above section, Option 1 is a method to find the optimal TMD design value by converting the individual TMD installation target mode into a SDOF system and thus, cannot consider the mode linkage effect of the TMD-piping integrated system.
Table 3. TMD optimal design values for the NUREG/CR-1677 Benchmark piping system: fopt & ζd,opt.
Table 4. TMD optimal design values for the NUREG/CR-1677 Benchmark piping system: kopt & copt.
- (5)
- Next, for the TMD optimal design method, the Option 2 procedure in Section 2.2 was applied. Based on the TMD-piping coupled dynamic numerical model (see Figure 5), the TMD optimal design values (kopt and copt) that minimize the directional maximum responses of the frequency acceleration were obtained through the optimization technique. In this case, the design variables are the k and c values of each TMD installed at the maximum response point of the mode shape in the TMD installation target modes (i.e., 1st, 2nd, and 4th modes). Each TMD mass and applied damping ratio were equally applied as 4 kg and 4% as in Option 1 above. Figure 6 conceptually illustrates the FRA-based TMD optimal design approach. Specifically, the Multi-Objective Genetic Algorithm (MOGA) was used to simultaneously minimize the maximum response of the frequency acceleration in three directions (X, Y, and Z direction). In addition, because many frequency response analyses should be performed in the course of the optimization process, the response surface technique based on Kriging with auto revision was used to efficiently proceed with this analysis. A Latin Hypercube Sampling (LHS) technique was utilized as a tool of DOE (Design of Experience) for generating response surfaces. The detailed descriptions of the concepts of the MOGA and the RSM are described in Kwag and Ok [35] and Kwag et al. [36], respectively. Specifically, a total of 1,000 samples were extracted from the design variable space in six dimensions, and the fitness of the derived response surface was verified through the performance indices of R2 and RMSE. The total number of the population for the MOGA optimization was selected as 100, and the number of generations was determined according to the degree of convergence of the solutions. The final obtained values for the TMD optimal design variables are shown in Table 3 and Table 4 along with the others. The characteristic of the TMD optimal design values obtained by this proposed approach is that the TMD damping ratio has been reduced relative to the values obtained by the conventional TMD optimum design formula/method (see Table 3 and Table 4: The case with TMD location #2 and #3). The reason for this result is that the maximum value of the acceleration frequency response is effectively mitigated when optimized in a direction that reduces the maximum response in the target mode, with a focus on TMD self-movement rather than energy dissipation by TMD self-damping.
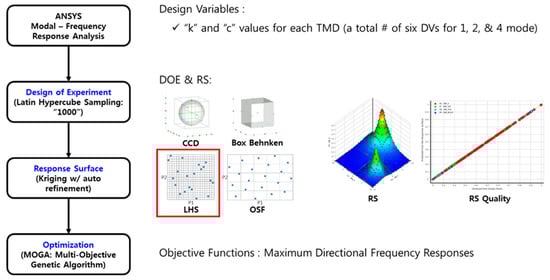 Figure 6. Conceptual diagram of the FRA-based TMD optimal design method using RSM and MOGA.
 - (6)
- The frequency response analysis and the seismic response analysis results of the target piping system with the TMD optimal design values applied derived by various optimum design formula and methods are compared and analyzed in detail in the next section.
3.2. Results and Discussion of the Frequency Response Analyses
In order to compare the responses of the target piping system according to whether the TMD installations and the differences between the TMD optimal design methods (i.e., (1) Den Hartog formula; (b) Warburton formula; (c) Rana and Soong optimal design method; (d) Frequency response analysis-based optimal design method), a unit acceleration of 1 m/s2 was applied to the piping system with the TMDs and the piping system without the TMDs, each as a directional input. Therefore, with respect to the piping systems defined above, the directional maximum acceleration frequency responses of the location of the piping around which the TMDs were installed (see Figure 7) and the directional maximum acceleration frequency response generated in the overall piping system (see Figure 8) were compared. From the figures, the following observations can be confirmed:
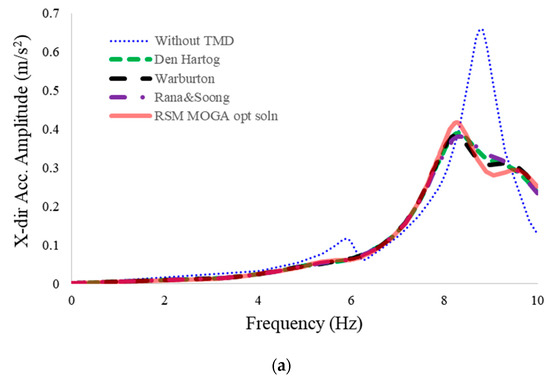
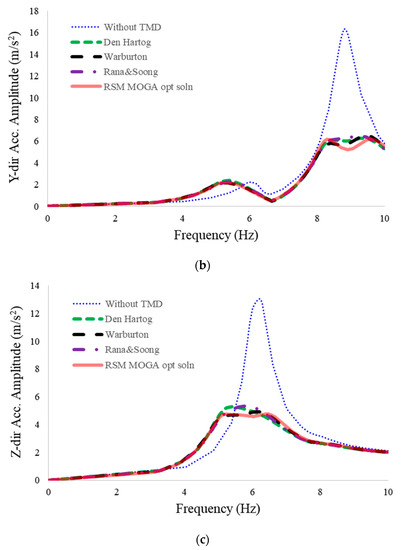
Figure 7.
Comparison of the maximum frequency acceleration response at the TMD installation location of the piping: (a) X direction; (b) Y direction; (c) Z direction.
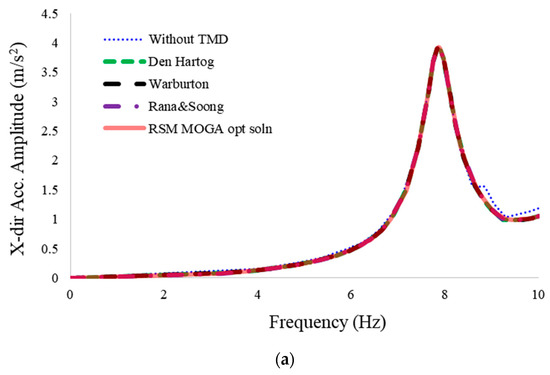
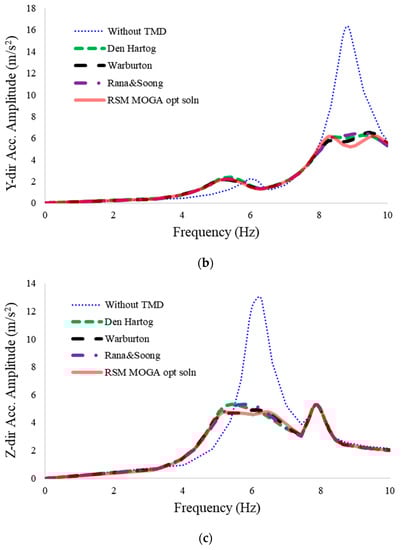
Figure 8.
Comparison of the maximum frequency acceleration responses in the overall piping system: (a) X direction; (b) Y direction; (c) Z direction.
- X direction input and response: Because the TMD target modes were selected about the 1st, 2nd and 4th mode, there was no target mode that affected the X direction response; thus, there was little overall response reduction in this direction (see Figure 8a). However, because the X directional mass participation rate in the 4th mode was approximately a degree of 2%, it appeared to have had an acceleration response reduction effect in the local TMD installation area (see Figure 7a). It was found that, for this X direction, there was little difference in the reduction in response to the difference between optimal design methods.
- Y direction input and response: Because the TMD was installed targeting the 4th mode, where the Y directional mass participation rate is about 60% (i.e., it has a significant effect on the Y direction overall response), it can be seen that the frequency response reduction is a considerably large as shown in Figure 7b and Figure 8b. Additionally, it can be seen that the maximum value of the acceleration frequency response obtained by using the FRA-based TMD optimal design method ("RSM MOGA opt. soln.") is slightly reduced compared with the results using the existing TMD optimum design formula and method.
- Z direction input and response: Because the TMDs are installed at the mode maximum response points for modes targeting the 1st and 2nd mode, in which the Z direction total mass participation rate of the 1st and 2nd modes is approximately 20%, it was observed that significant frequency response reductions occurred shown in Figure 7c and Figure 8c. As with the Y direction response result, it was found that the results of the FRA-based TMD optimal design method were slightly decreased compared to the results obtained using the conventional TMD optimal design formula and method.
Therefore, the results of the above frequency response analysis are summarized as follows. It was confirmed that installing TMDs for the 1st, 2nd, and 4th target modes is effective in reducing the maximum acceleration frequency response in all directions. In addition, it was confirmed that by using the frequency response analysis-based TMD optimum design method proposed in this study, the maximum value of the acceleration frequency response is slightly reduced compared with the conventional TMD optimum design formula and method. Hence, this tendency is expected to be similarly reflected in the results of the actual earthquake time history response analysis.
3.3. Results and Discussion of the Earthquake Time History Analyses
In this subsection, we looked at how a piping system without TMDs and with TMDs, designed by various optimum design formula and methods, react to actual seismic loads. As mentioned above, the damping ratio of the numerical model was set to 4%, and the damping matrix was calculated by assuming a damping ratio of 4% in the mode of 6 Hz and 460 Hz through the Rayleigh damping generation approach (a0 = 2.971, a1 = 2.7325e-5). The effective mass within such a frequency range is above 90% in all three directions.
As a result of the analysis, the directional acceleration responses at the TMD installation point of the piping system (see Figure 9), the maximum combined normal stresses in the overall piping system (see Figure 10) and directional reaction forces at the bottom of the piping system (see Figure 11) were compared in the time domain. Based on this, the comparisons of the maximum response ratios according to whether TMDs were installed and to the differences between the TMD optimal design methods are summarized in Table 5. Here, the response ratio is defined as “the piping response with TMDs installed” divided by “the piping response without TMDs installed”. Accordingly, as the value becomes smaller, the seismic performance of the piping system increases, In addition, the response spectra of the directional acceleration responses at the TMD installation location of the piping system (see Figure 12), the frequency responses through the FFT (Fast Fourier Transform) of the maximum combined normal stress time-series responses of the overall piping system (see Figure 13), and the frequency responses through the FFT of the directional reaction force time-series responses at the lowest point of the piping system (see Figure 13) were compared and presented. Table 6 summarizes the maximum response ratios in the frequency domain responses based on the use of the TMDs and the changes in the optimal design method. A concrete discussion of these results is summarized below:
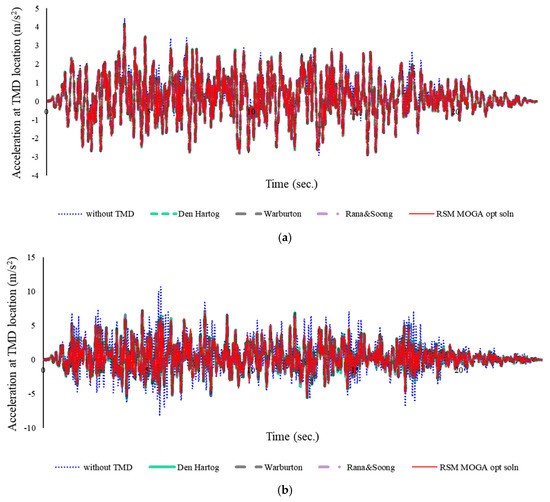
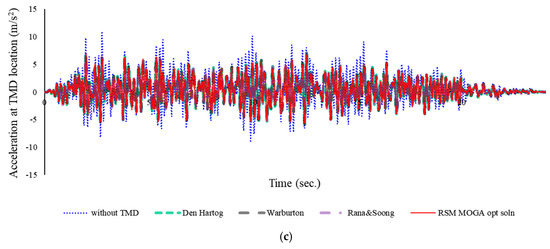
Figure 9.
Comparison of the directional acceleration responses at the TMD installation location of the piping: (a) X direction; (b) Y direction; (c) Z direction.
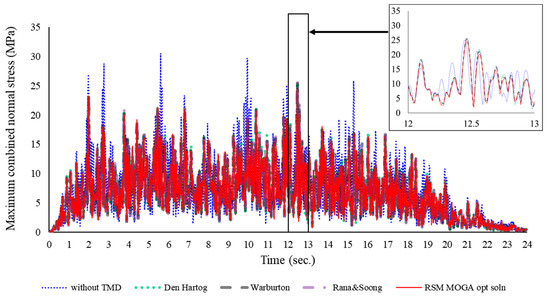
Figure 10.
Comparison of the maximum combined normal stresses in the overall piping system.
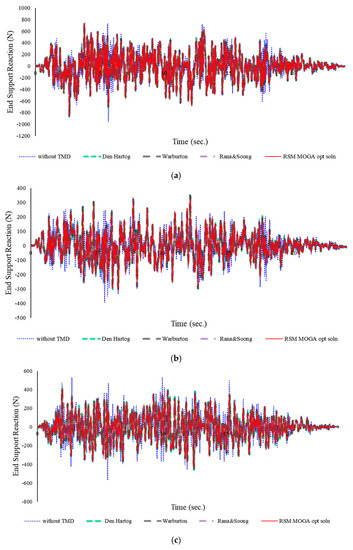
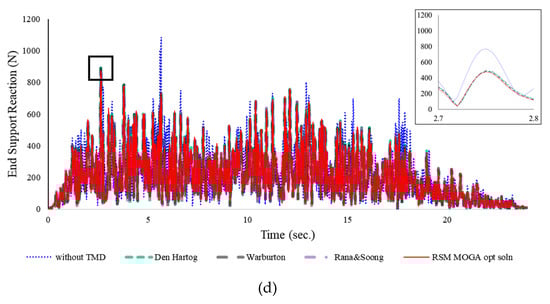
Figure 11.
Comparison of the reaction forces at the lowest support of the piping system: (a) X direction; (b) Y direction; (c) Z direction; (d) total.
Table 5.
Comparison of the maximum response ratios according to whether TMDs were installed and the difference between the optimal design formula/methods.
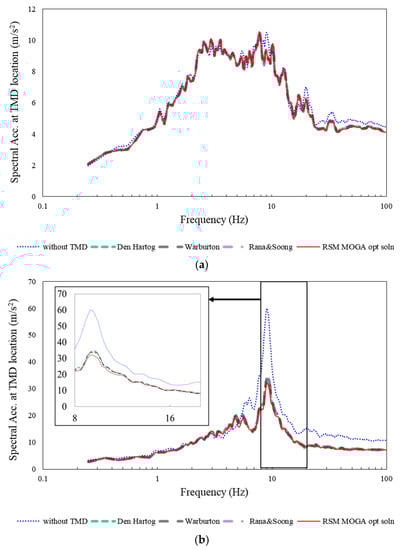
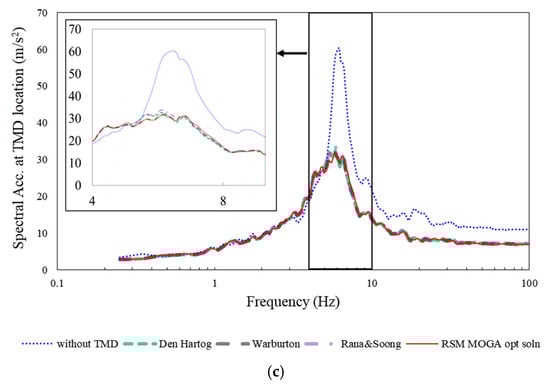
Figure 12.
Comparison of the response spectra of directional acceleration responses at the TMD installation location of the piping: (a) X-direction spectrum (5%); (b) Y-direction spectrum (5%); (c) Z-direction spectrum (5%).
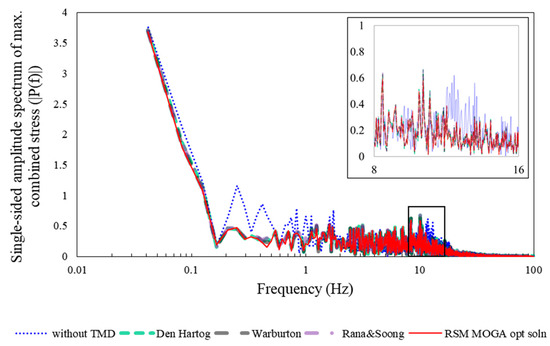
Figure 13.
Comparison of the FFT frequency responses of the maximum combined normal stresses of the overall piping system.
Table 6.
Comparison of the maximum spectral response ratios according to whether TMDs were installed and the difference between the optimal design formula/methods.
- As seen in Figure 9, it can be confirmed that the installation of the TMDs significantly reduces the acceleration time-series responses in all directions as a whole. Specifically, the installation of TMDs reduced about 8% from the original maximum response with respect to X direction, and mitigated approximately 32% and 37% from the original maximum response regarding Y direction and Z direction, respectively (see Table 5). Here, the main reason that the reduction in the maximum responses in Y and Z direction is relatively greater than the decrease in the maximum response in X direction is because the Y direction and Z direction mass participation rates of the TMD installation target modes (i.e., in primary, secondary, and fourth modes) are larger than the X direction mass participation rate. The trend of these results can also be seen through the comparison of response spectra in Figure 12. Specifically, the overall reduction in response can be seen from the comparison of directional response spectra in over 5 Hz frequency region, and particularly stands out in the TMD target mode area.
- As shown in Figure 10, it can be seen that the maximum combined normal stresses in the entire time domain is considerably reduced due to the TMD installations. Comparing the maximum values within the whole time domain, it can be confirmed that the stress reduction is about 20% due to the TMD installations. The stress reduction through the TMDs can be also confirmed by a comparison of the maximum normal stress response (see Figure 13) in the frequency domain by FFT. Specifically, a stress reduction can be seen in the entire frequency range, which is considered to be due to the fact that the TMDs absorb a considerable part of the energy of the earthquake input to the piping instead of the piping system.
- As shown in Figure 11, the reduction of the reaction forces of the supporting point is observed in the entire time domain. Specifically, there was no change in the amplitude of the maximum reaction force values with respect to the X direction and Y direction time-series reaction force responses, but it can be confirmed that that of the Z direction and the total vector sum of directional reactions are reduced by about 20% from the original maximum reaction force amplitude. Figure 14 shows the comparison of the frequency-domain of the time-series responses of the reaction forces by the FFT. Overall, the results show a significant reduction in the reaction force responses in the entire frequency domain in all three directions. Such tendency is noticeable in the TMD target mode frequency region. The energy absorption capacity of the TMDs regarding some part of the seismic energy input seems to have a role in causing the decrease of the reaction forces in the end supporting point.
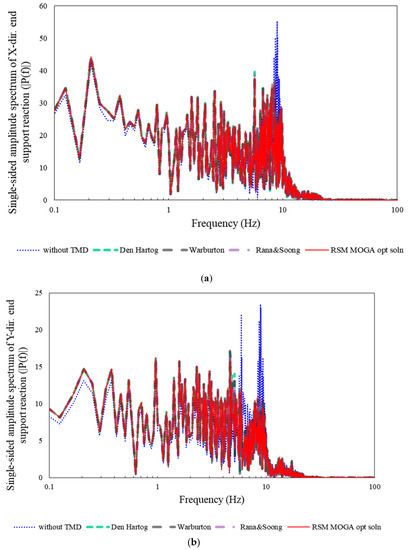
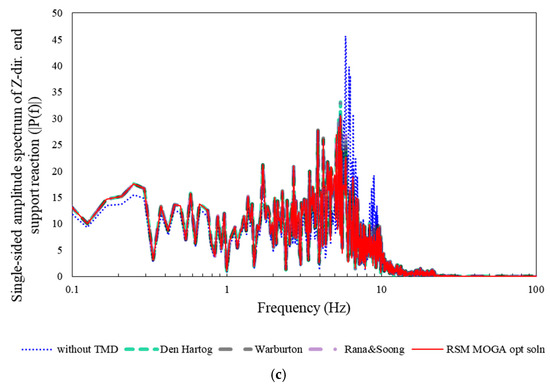 Figure 14. Comparison of the FFT frequency responses of the reaction forces at the lowest support of the piping system: (a) X direction FFT spectrum; (b) Y direction FFT spectrum; (c) Z direction FFT spectrum.
 - As a result of comparing the difference according to the optimal design methods for each response, the maximum value of the acceleration response acquired from the FRA-based TMD optimal design method was overall somewhat reduced compared with those obtained from the conventional TMD optimum design formula/method. Especially, in relation to the maximum combined normal stress and end support reaction force responses, the response reduction from the FRA-based TMD optimal design method was relatively large compared with those of the conventional TMD optimum design formula/method. This tendency can also be observed in Figure 12, Figure 13 and Figure 14 and Table 6 of frequency response comparisons. The reason for this result was that the existing TMD optimum design formula/method individually took into account the target modes, but the FRA-based TMD optimal design method found the TMD optimal design values by directly considering the associated coupled modes of the TMD-Piping integrated model.
Through these results and discussions, it has been confirmed that the application of multiple TMDs to a piping system can reduce major system responses, thereby raising the seismic performance of the piping system directly. In addition, the existing TMD optimum design formula/methods were found to have similar response-reduction effects, but it was confirmed that the FRA-based TMD optimal design method proposed in this study was able to achieve somewhat improved response-reduction effects.
4. Conclusions
In this study, the application of multiple TMDs was reviewed for the purpose of improving the seismic performance of a piping system subjected to a seismic load, and a process that effectively finds the optimal TMD design values was proposed. This study makes two major academic contributions. The first is that though dynamic absorbers or TMDs were originally used only to reduce the vibration of the piping itself, through this research, it was first proved that it had a positive effect on the improvement of the seismic performance of the piping systems of nuclear facilities, and the design method related to this is presented. Specifically, it was based on the use of the existing TMD optimal design formula to avoid optimization techniques based on many direct earthquake time history analyses. The other one is that this study suggested a method of finding optimal design values of TMD through numerical optimization based on frequency response analyses. Through such approach, the mode linkage effect of the TMD-piping coupled system, for which methods using the existing TMD optimum design formula/method could not consider, could be well reflected in a TMD design process. To verify the validity of these proposed approaches, the effects of the TMD optimal design values on the responses of the original piping system due to the differences between the TMD optimum design formula/methods were compared and analyzed based on the response of the piping system without TMDs installed. As a result, for the piping system with the installed TMDs we were able to confirm that the major responses of the system under input seismic loads were significantly reduced. It is judged that this could be an effective tool for TMDs to directly upgrade the seismic performance of piping systems. In addition, the various existing TMD optimum design formula/methods used in this study were found to have similar response-reduction effects, whereas the FRA-based TMD optimal design method, proposed in this study, was able to achieve relatively somewhat improved response-reduction effects. As a result, it is expected that these findings could be used as a basic data for improving the seismic performance of piping systems, one of the main vulnerable systems of nuclear power plants to be targeted in the future. However, since the FRA-based TMD optimal design method proposed in this study cannot directly consider the frequency input of the design earthquake loading, it is considered that an effective method to consider this aspect is necessary for the future research. In addition, it is necessary to experimentally verify and validate the effect of piping seismic performance increase due to the TMD numerically revealed in this study.
Author Contributions
Conceptualization, S.K., J.O. and G.-H.K.; Methodology, S.K., J.K., H.L and J.O.; Validation, J.K.; Formal Analysis, S.K. and J.K.; Data Curation, S.K. and J.K.; Writing—Original Draft Preparation, S.K.; Writing—Review & Editing, S.K., G.-H.K., and H.L.; Funding Acquisition, G.-H.K.
Funding
This study was funded by the Ministry of Trade, Industry and Energy through KETEP (Korea Institute of Energy Technology Evaluation Planning). (No. 20171510102050).
Acknowledgments
This study was supported by the Ministry of Trade, Industry and Energy through KETEP (Korea Institute of Energy Technology Evaluation Planning). (No. 20171510102050).
Conflicts of Interest
The authors declare no conflict of interest.
References
- Frahm, H. Device for Damping Vibrations of Bodies. U.S. Patent No.989958, 18 April 1909. [Google Scholar]
- Den Hartog, J.P. Mechanical Vibrations, 4th ed.; McGraw-Hill: New York, NY, USA, 1956. [Google Scholar]
- Warburton, G.B. Optimum absorber parameters for various combinations of response and excitation parameters. Earthq. Eng. Struct. Dyn. 1982, 10, 381–401. [Google Scholar] [CrossRef]
- Ioi, T.; Ikeda, K. On the dynamic vibration damped absorber of the vibration system. Bull. JSME 1978, 21, 64–71. [Google Scholar] [CrossRef]
- Sadek, F.; Mohraz, B.; Taylor, A.W.; Chung, R.M. A method of estimating the parameters of tuned mass dampers for seismic applications. Earthq. Eng. Struct. Dyn. 1997, 26, 617–635. [Google Scholar] [CrossRef]
- Ghosh, A.; Basu, B. A closed-form optimal tuning criterion for TMD in damped structures. Struct. Control Health Monit. 2007, 14, 681–692. [Google Scholar] [CrossRef]
- Rana, R.; Soong, T.T. Parametric study and simplified design of tuned mass dampers. Eng. Struct. 1998, 20, 193–204. [Google Scholar] [CrossRef]
- Desu, N.B.; Deb, S.K.; Dutta, A. Coupled tuned mass dampers for control of coupled vibrations in asymmetric buildings. Struct. Control Health Monit. 2006, 13, 897–916. [Google Scholar] [CrossRef]
- Marano, G.C.; Greco, R.; Trentadue, F.; Chiaia, B. Constrained reliability-based optimization of linear tuned mass dampers for seismic control. Int. J. Solids Struct. 2007, 44, 7370–7388. [Google Scholar] [CrossRef]
- Hoang, N.; Fujino, Y.; Warnitchai, P. Optimal tuned mass damper for seismic applications and practical design formulas. Eng. Struct. 2008, 30, 707–715. [Google Scholar] [CrossRef]
- Chakraborty, S.; Roy, B.K. Reliability based optimum design of tuned mass damper in seismic vibration control of structures with bounded uncertain parameters. Probab. Eng. Mech. 2011, 26, 215–221. [Google Scholar]
- Mrabet, E.; Guedri, M.; Ichchou, M.; Ghanmi, S. New approaches in reliability based optimization of tuned mass damper in presence of uncertain bounded parameters. J. Sound Vib. 2015, 355, 93–116. [Google Scholar] [CrossRef]
- Greco, R.; Marano, G.C.; Fiore, A. Performance–cost optimization of tuned mass damper under low-moderate seismic actions. Struct. Des. Tall Special Build. 2016, 25, 1103–1122. [Google Scholar] [CrossRef]
- Zhang, H.Y.; Zhang, L.J. Tuned mass damper system of high-rise intake towers optimized by improved harmony search algorithm. Eng. Struct. 2017, 138, 270–282. [Google Scholar] [CrossRef]
- Kamgar, R.; Samea, P.; Khatibinia, M. Optimizing parameters of tuned mass damper subjected to critical earthquake. Struct. Des. Tall Special Build. 2018, 27, e1460. [Google Scholar] [CrossRef]
- Lavan, O. Multi-objective optimal design of tuned mass dampers. Struct. Control Health Monit. 2017, 24, e2008. [Google Scholar] [CrossRef]
- Schmelzer, B.; Adam, C.; Oberguggenberger, M. Seismic performance of tuned mass dampers with uncertain parameters. In Proceedings of the 6th European Congress on Computational Methods in Appl. Sci. and Engineering (ECCOMAS 2012), Vienna, Austria, 10–14 September 2012; p. 20. [Google Scholar]
- Kunieda, M.; Chiba, T.; Kobayashi, H. Positive use of damping devices for piping systems—some experiences and new proposals. Nuclear Eng. Des. 1987, 104, 107–120. [Google Scholar] [CrossRef]
- Park, Y.; DeGrassi, G.; Hofmayer, C.; Bezler, P.; Chokshi, N. Analysis of Nuclear Piping System Seismic Tests with Conventional and Energy Absorbing Supports; No. BNL-NUREG-64173; CONF-970826-7; Brookhaven National Lab.: Upton, NY, USA, 1997. [Google Scholar]
- Fujita, K.; Kimura, T.; Ohe, Y. Seismic response analysis of piping systems with nonlinear supports using differential algebraic equations. J. Press. Vessel Technol. 2004, 126, 91–97. [Google Scholar] [CrossRef]
- Bakre, S.V.; Jangid, R.S.; Reddy, G.R. Seismic response of piping systems with isolation devices. In Proceedings of the 13th World Conference on Earthquake Engineering, Vancouver, BC, Canada, 1–6 August 2004. [Google Scholar]
- Bakre, S.V.; Jangid, R.S.; Reddy, G.R. Optimum X-plate dampers for seismic response control of piping systems. Int. J. Press. Vessels Piping 2006, 83, 672–685. [Google Scholar] [CrossRef]
- Jia, J.; Shen, X.; Du, J.; Wang, Y.; Hua, H. Design and mechanical characteristics analysis of a new viscous damper for piping system. Arch. Appl. Mech. 2009, 79, 279. [Google Scholar] [CrossRef]
- Kumar, P.; Jangid, R.S.; Reddy, G.R. Response of piping system with semi-active variable stiffness damper under tri-directional seismic excitation. Nuclear Eng. Des. 2013, 258, 130–143. [Google Scholar] [CrossRef]
- Lenz, J. Magic cube-three-dimensional vibration absorber for pipeline vibrations. In Proceedings of the International Compressor Engineering Conference, West Lafayette, IN, USA, 14–17 July 2008; p. 1901. [Google Scholar]
- Barutzki, F.; Gurr-Beyer, C.; Hinz, G.; Kerkhof, K.; Schwenkkros, J. Identification and Reduction of Piping-Vibrations under Different Conditions; Chapter 8; IRIS: Wuhan, China, 2013; pp. 165–194. [Google Scholar]
- Rechenberger, S.; Mair, D. Vibration control of piping systems and structures using tuned mass dampers. In Proceedings of the ASME 2017 Pressure Vessels and Piping Conference, Waikoloa, HI, USA, 16–20 July 2017; Volume 3B. [Google Scholar]
- Tan, J.; Ho, M.; Chun, S.; Zhang, P.; Jiang, J. Experimental Study on Vibration Control of Suspended Piping System by Single-Sided Pounding Tuned Mass Damper. Appl. Sci. 2019, 9, 285. [Google Scholar] [CrossRef]
- Chang, S.; Sun, W.; Cho, S.G.; Kim, D. Vibration control of nuclear power plant piping system using stockbridge damper under earthquakes. Sci. Technol. Nuclear Install. 2016, 2016, 12. [Google Scholar] [CrossRef]
- Soong, T.T.; Dargush, G.F. Passive Energy Dissipation Systems in Structural Engineering; John Wiley & Sons Ltd.: Chichester, UK, 1997. [Google Scholar]
- Bezler, P.; Subudhi, M.; Hartzman, M. Piping Benchmark Problems: Dynamic Analysis Independent Support Motion Response Spectrum Method; No. NUREG/CR--1677-VOL. 2; Brookhaven National Lab.: Upton, NY, USA, 1985. [Google Scholar]
- USNRC RG 1.60. Design Response Spectra for Seismic Design of Nuclear Power Plants; Rev. 2; U.S. Nuclear Regulatory Commission: Washington, DC, USA, 2014.
- USNRC Standard Review Plan 3.7.2. Seismic System Analysis; Rev. 3; NUREG-0800; U.S. Nuclear Regulatory Commission: Washington, DC, USA, 2007.
- USNRC RG 1.61. Damping Values for Seismic Design of Nuclear Power Plants; Rev. 1; U.S. Nuclear Regulatory Commission: Washington, DC, USA, 2007.
- Kwag, S.; Ok, S.Y. Robust design of seismic isolation system using constrained multi-objective optimization technique. KSCE J. Civ. Eng. 2013, 17, 1051–1063. [Google Scholar] [CrossRef]
- Kwag, S.; Gupta, A.; Dinh, N. Probabilistic risk assessment based model validation method using Bayesian network. Reliab. Eng. Syst. Saf. 2018, 169, 380–393. [Google Scholar] [CrossRef]
© 2019 by the authors. Licensee MDPI, Basel, Switzerland. This article is an open access article distributed under the terms and conditions of the Creative Commons Attribution (CC BY) license (http://creativecommons.org/licenses/by/4.0/).