Minimum Energy Management Strategy of Equivalent Fuel Consumption of Hybrid Electric Vehicle Based on Improved Global Optimization Equivalent Factor

Abstract
:1. Introduction
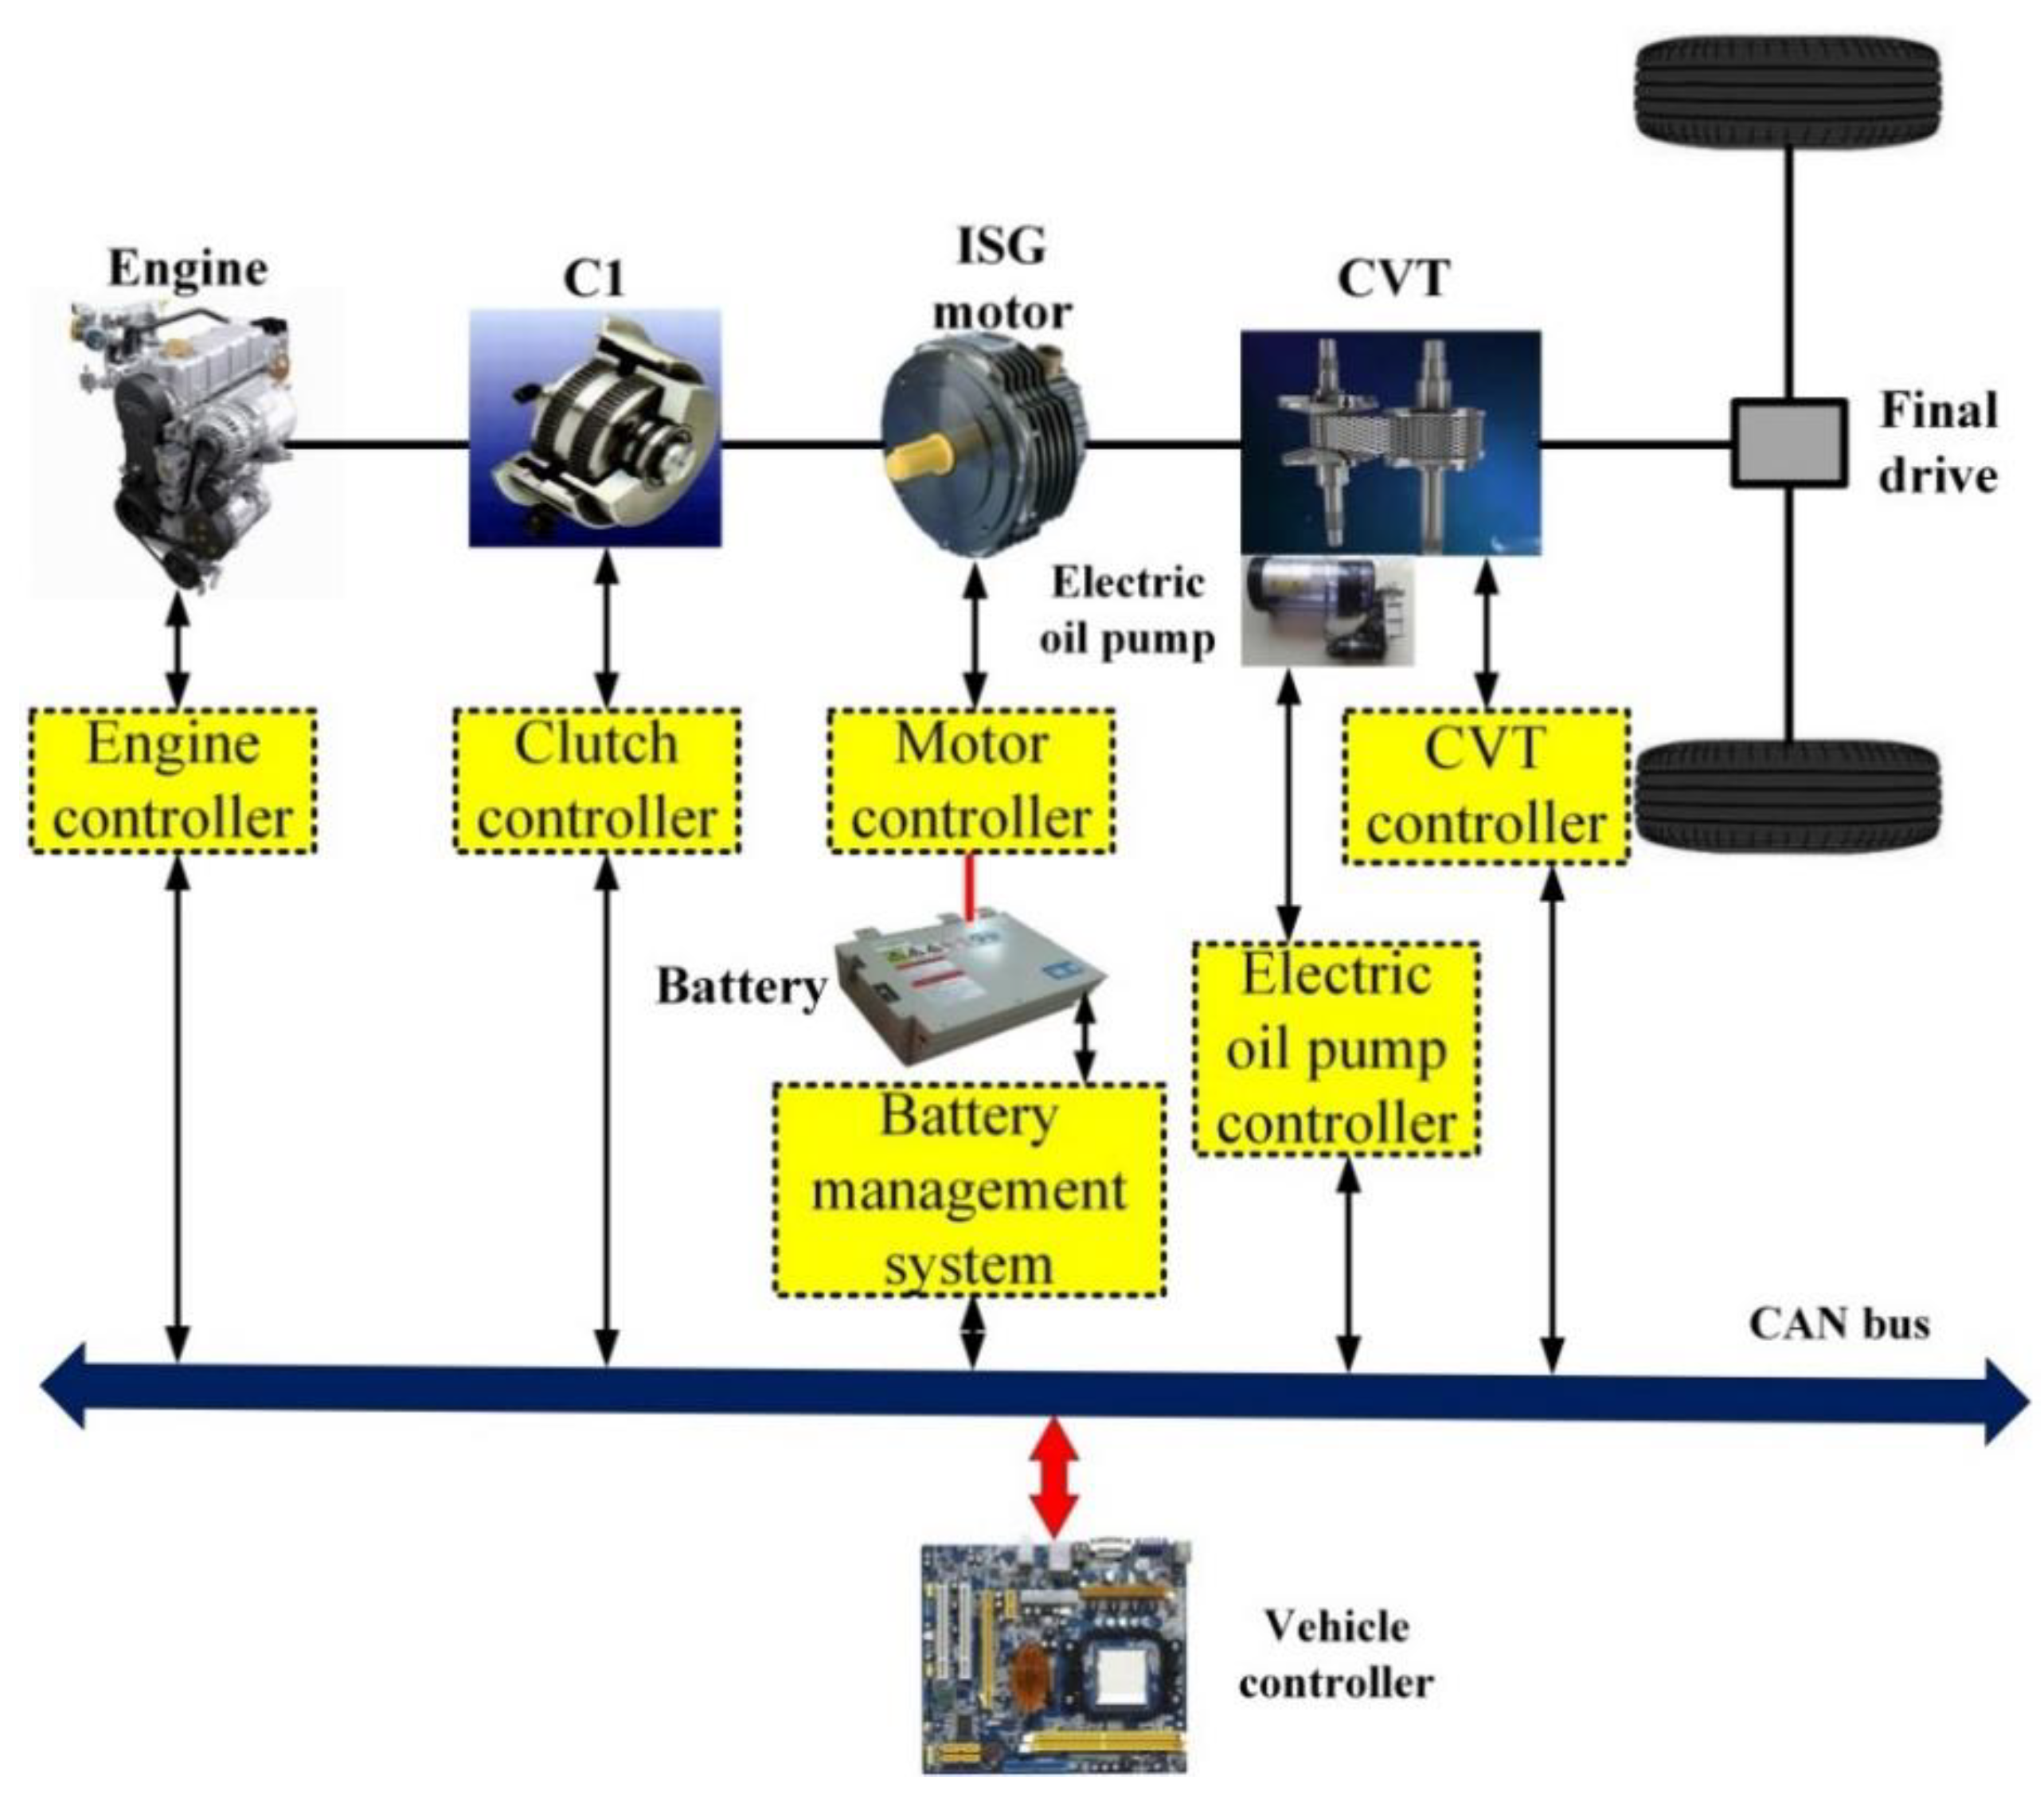
2. Vehicle Dynamical Systems Structure and Modeling
2.1. Vehicle Longitudinal Dynamics Model
2.2. Engine and Motor Model
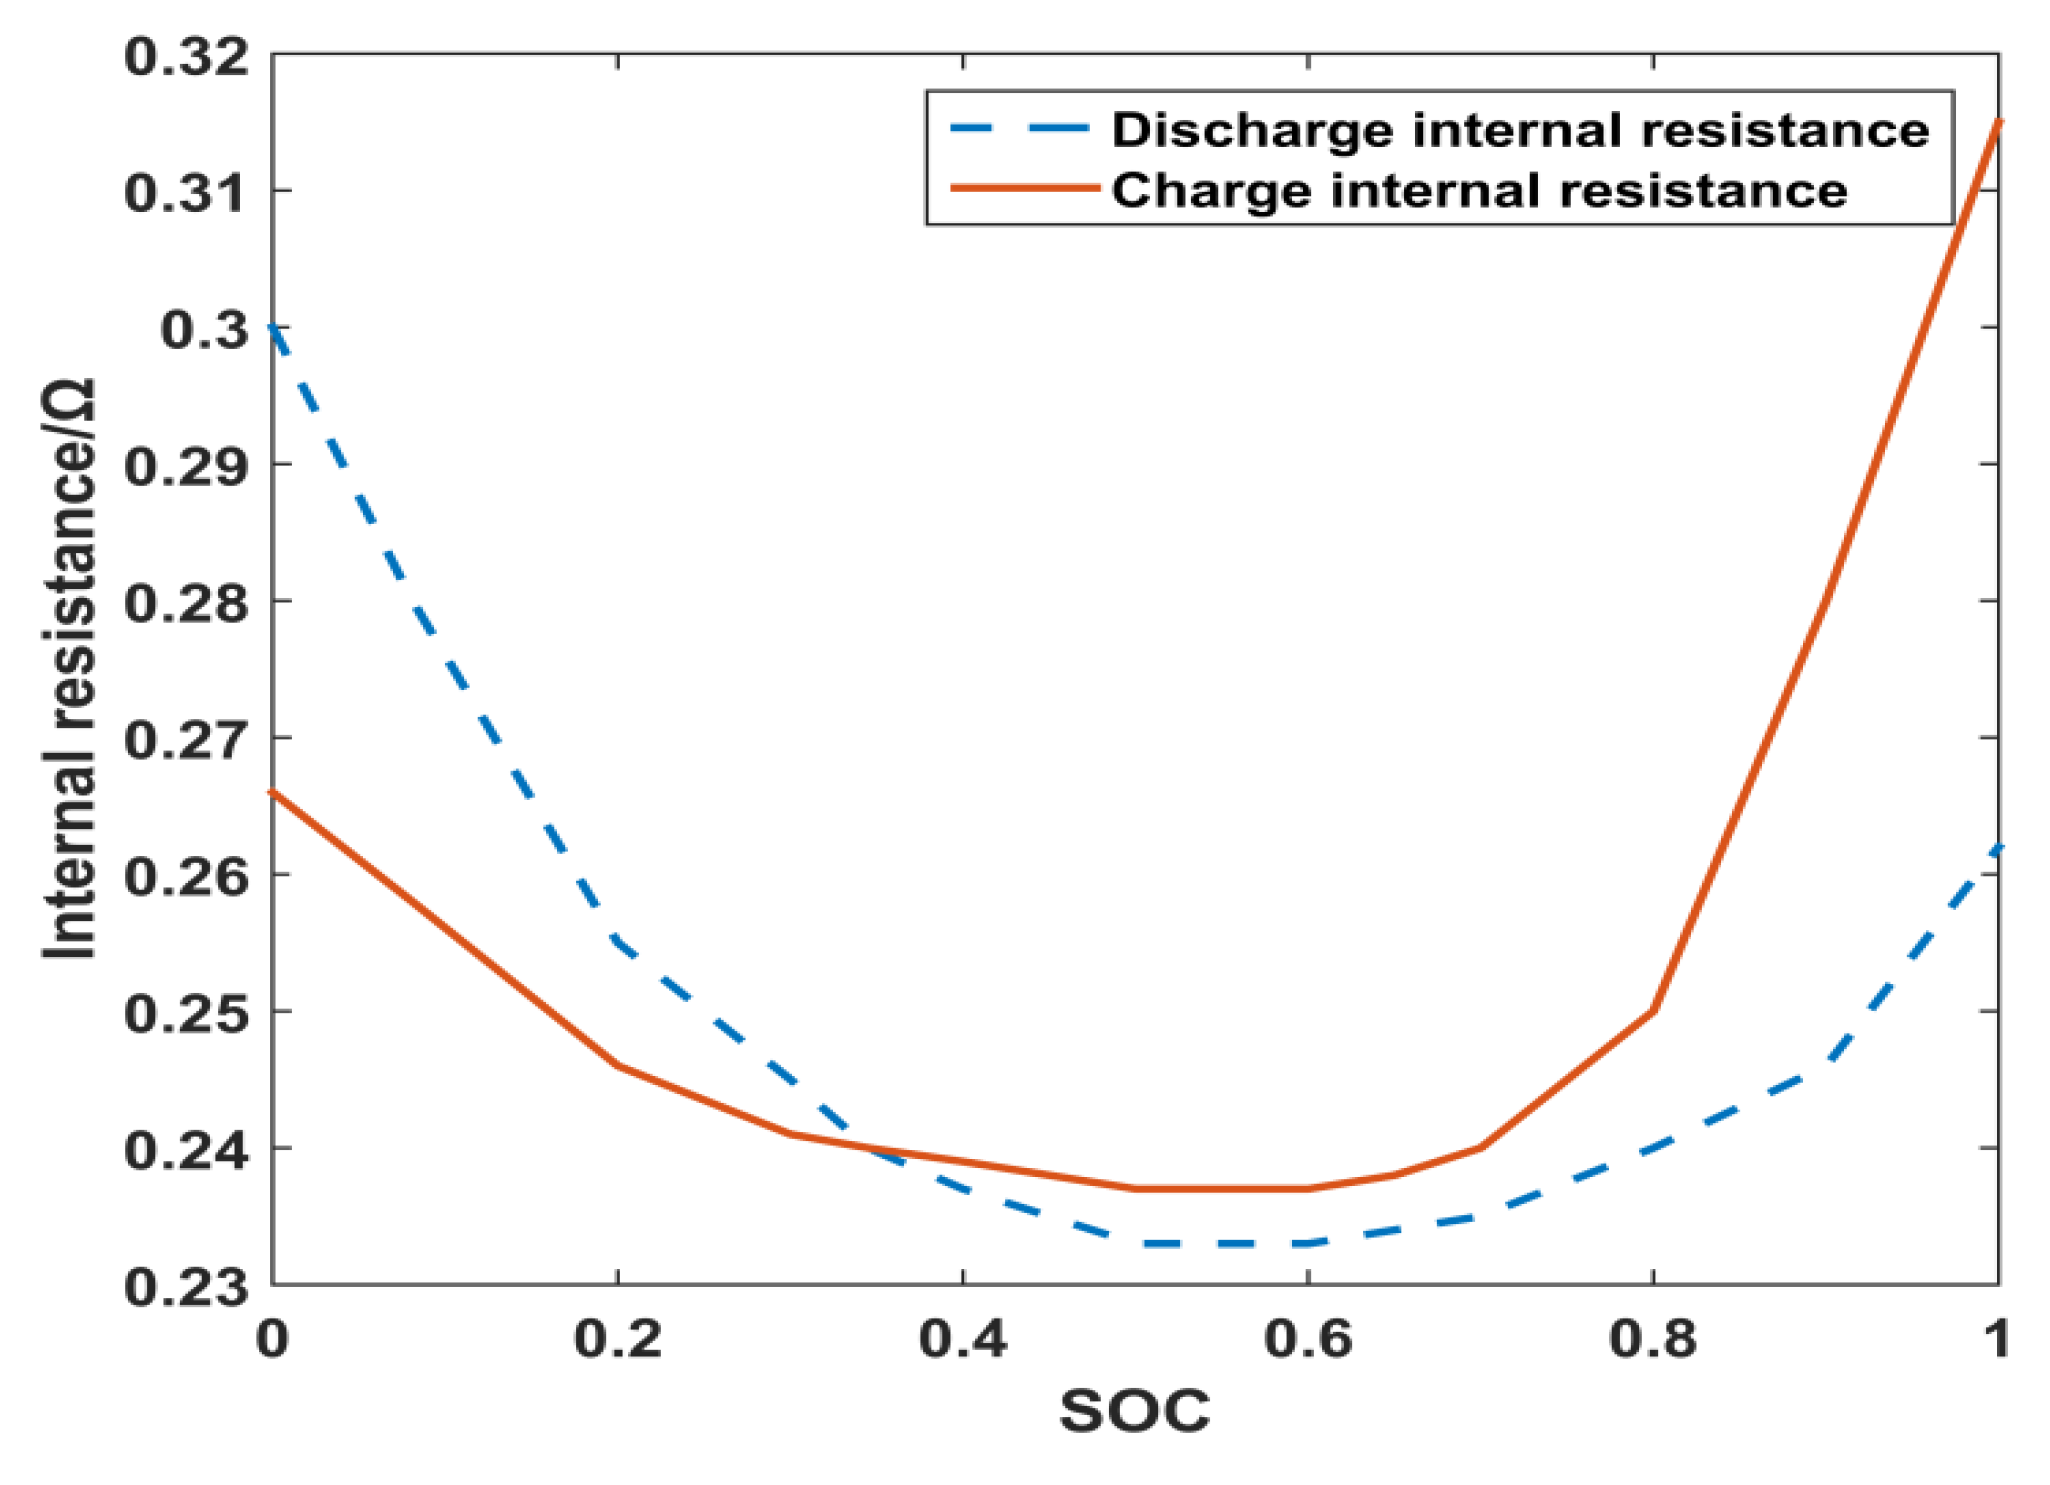
2.3. Battery Model
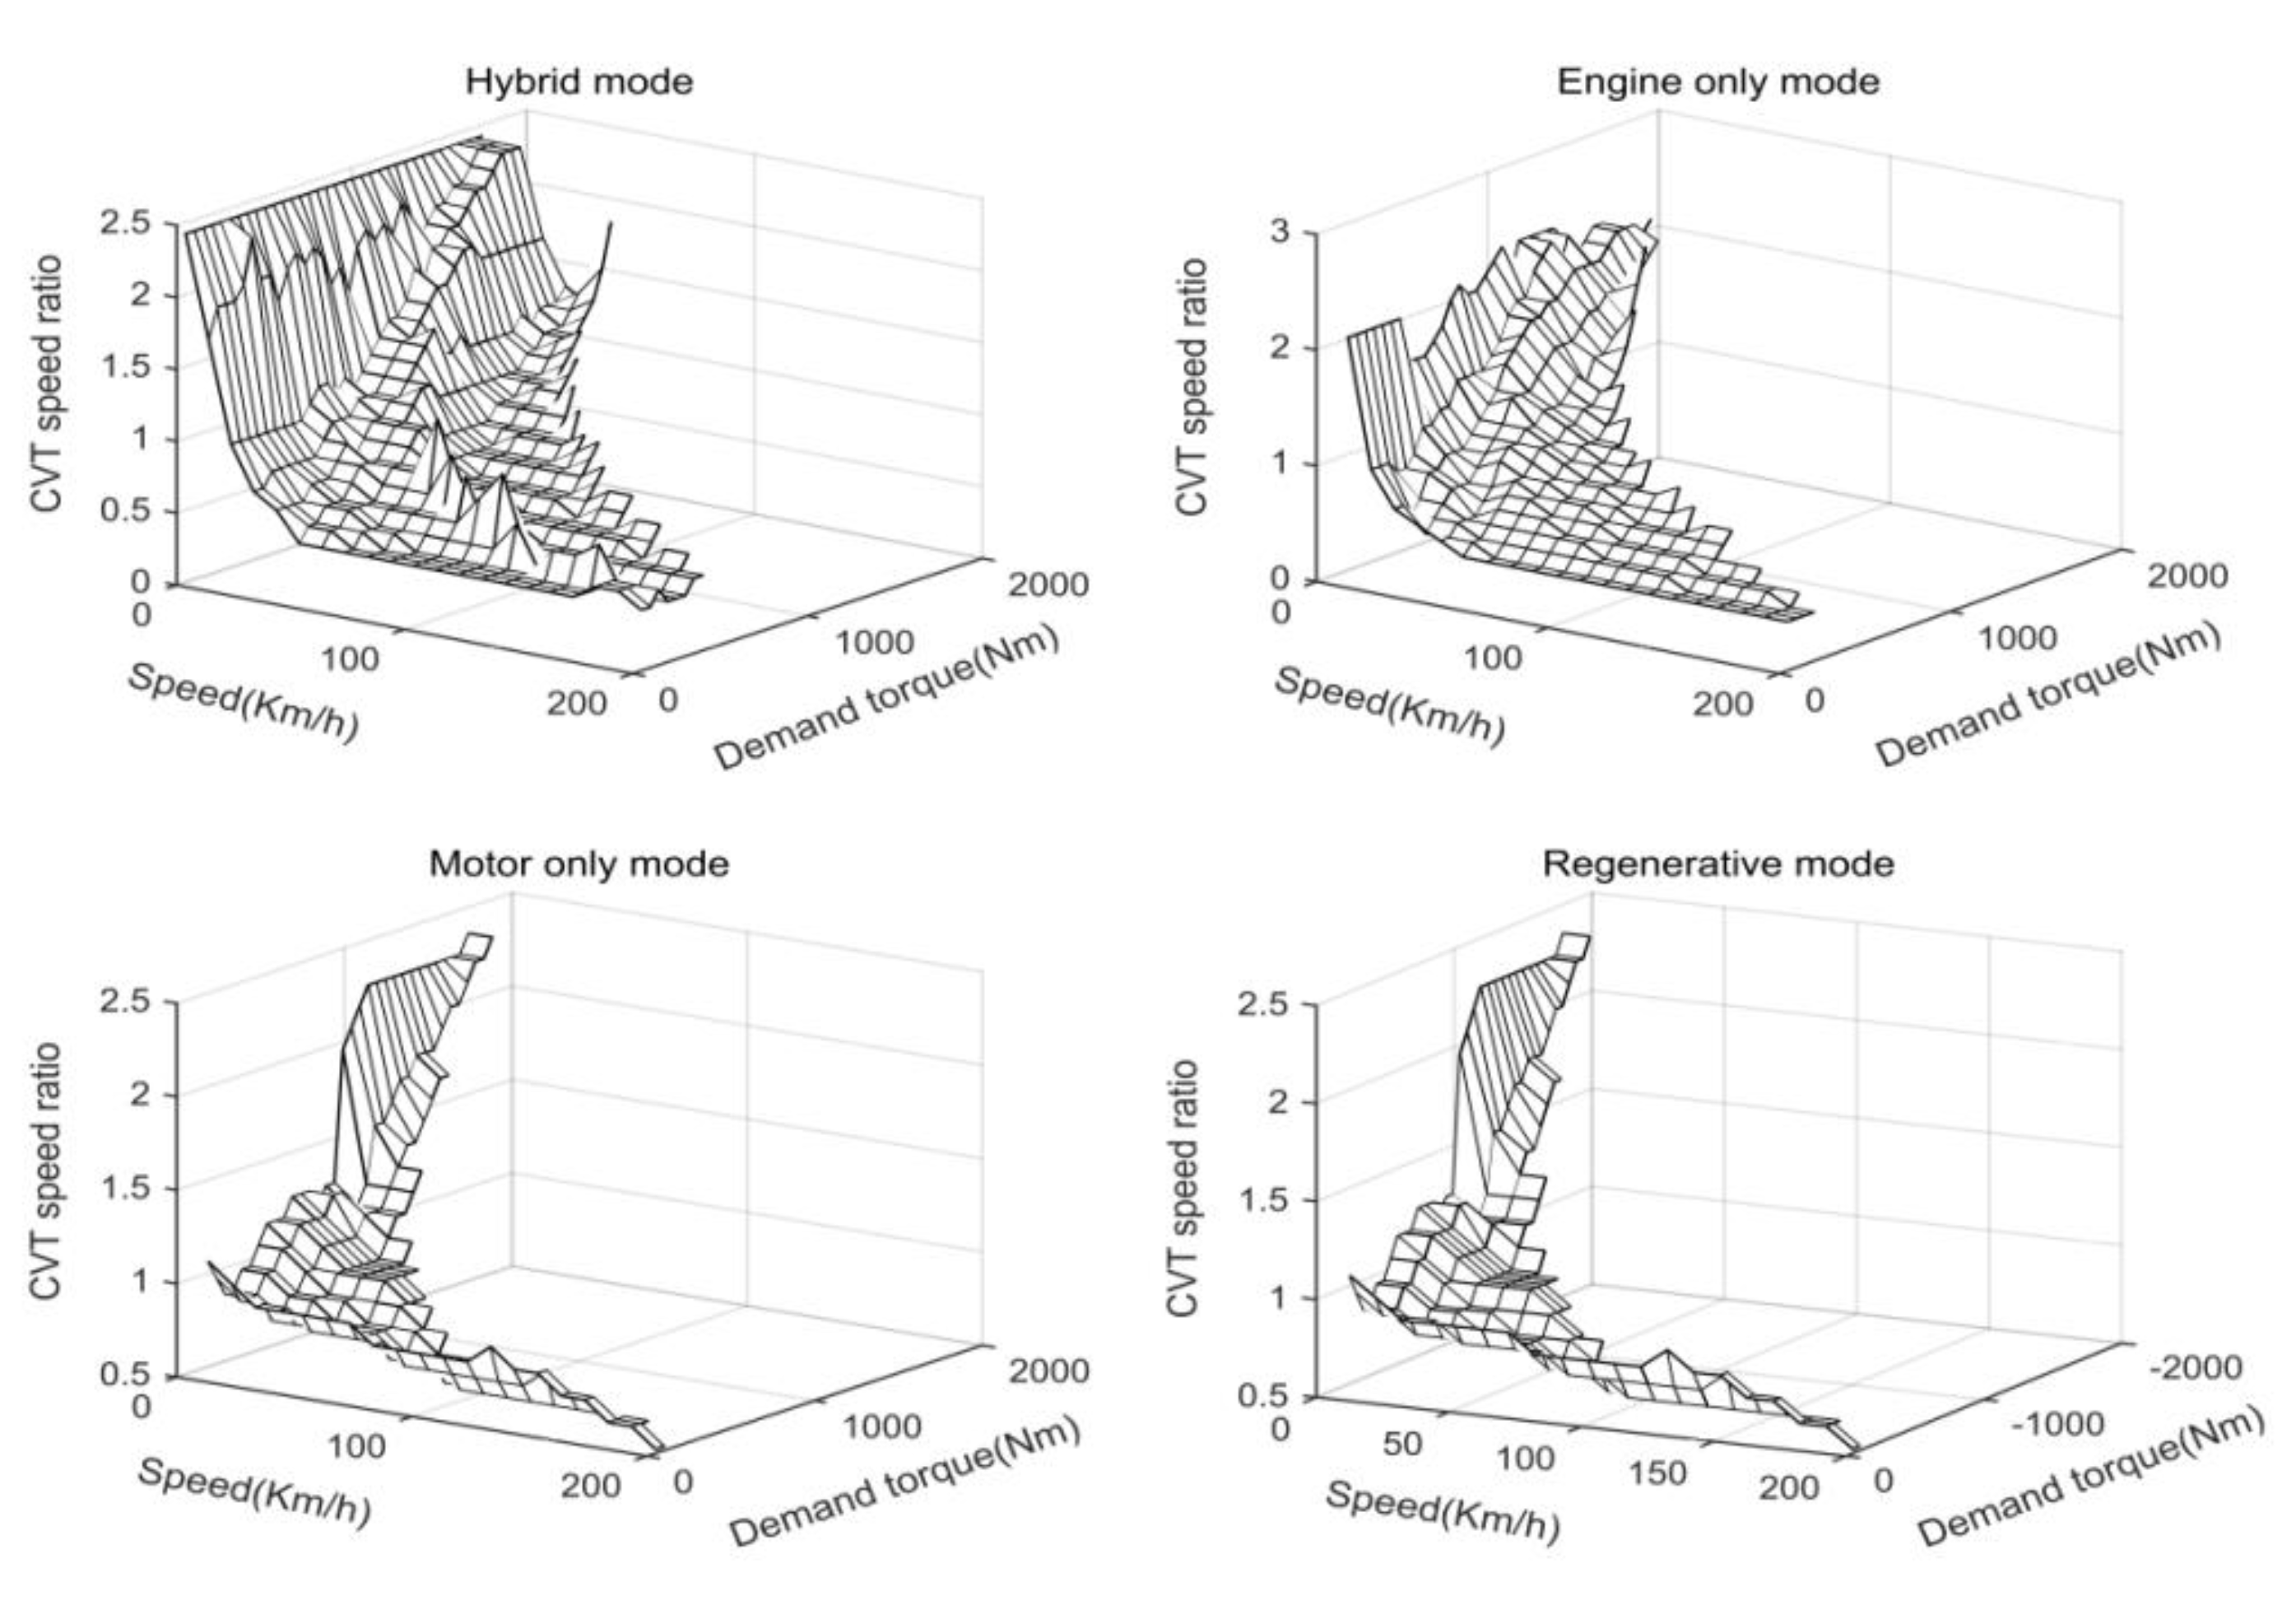
2.4. CVT Model
3. Conventional ECMS Model
3.1. Build ECMS Optimization Objective Functions
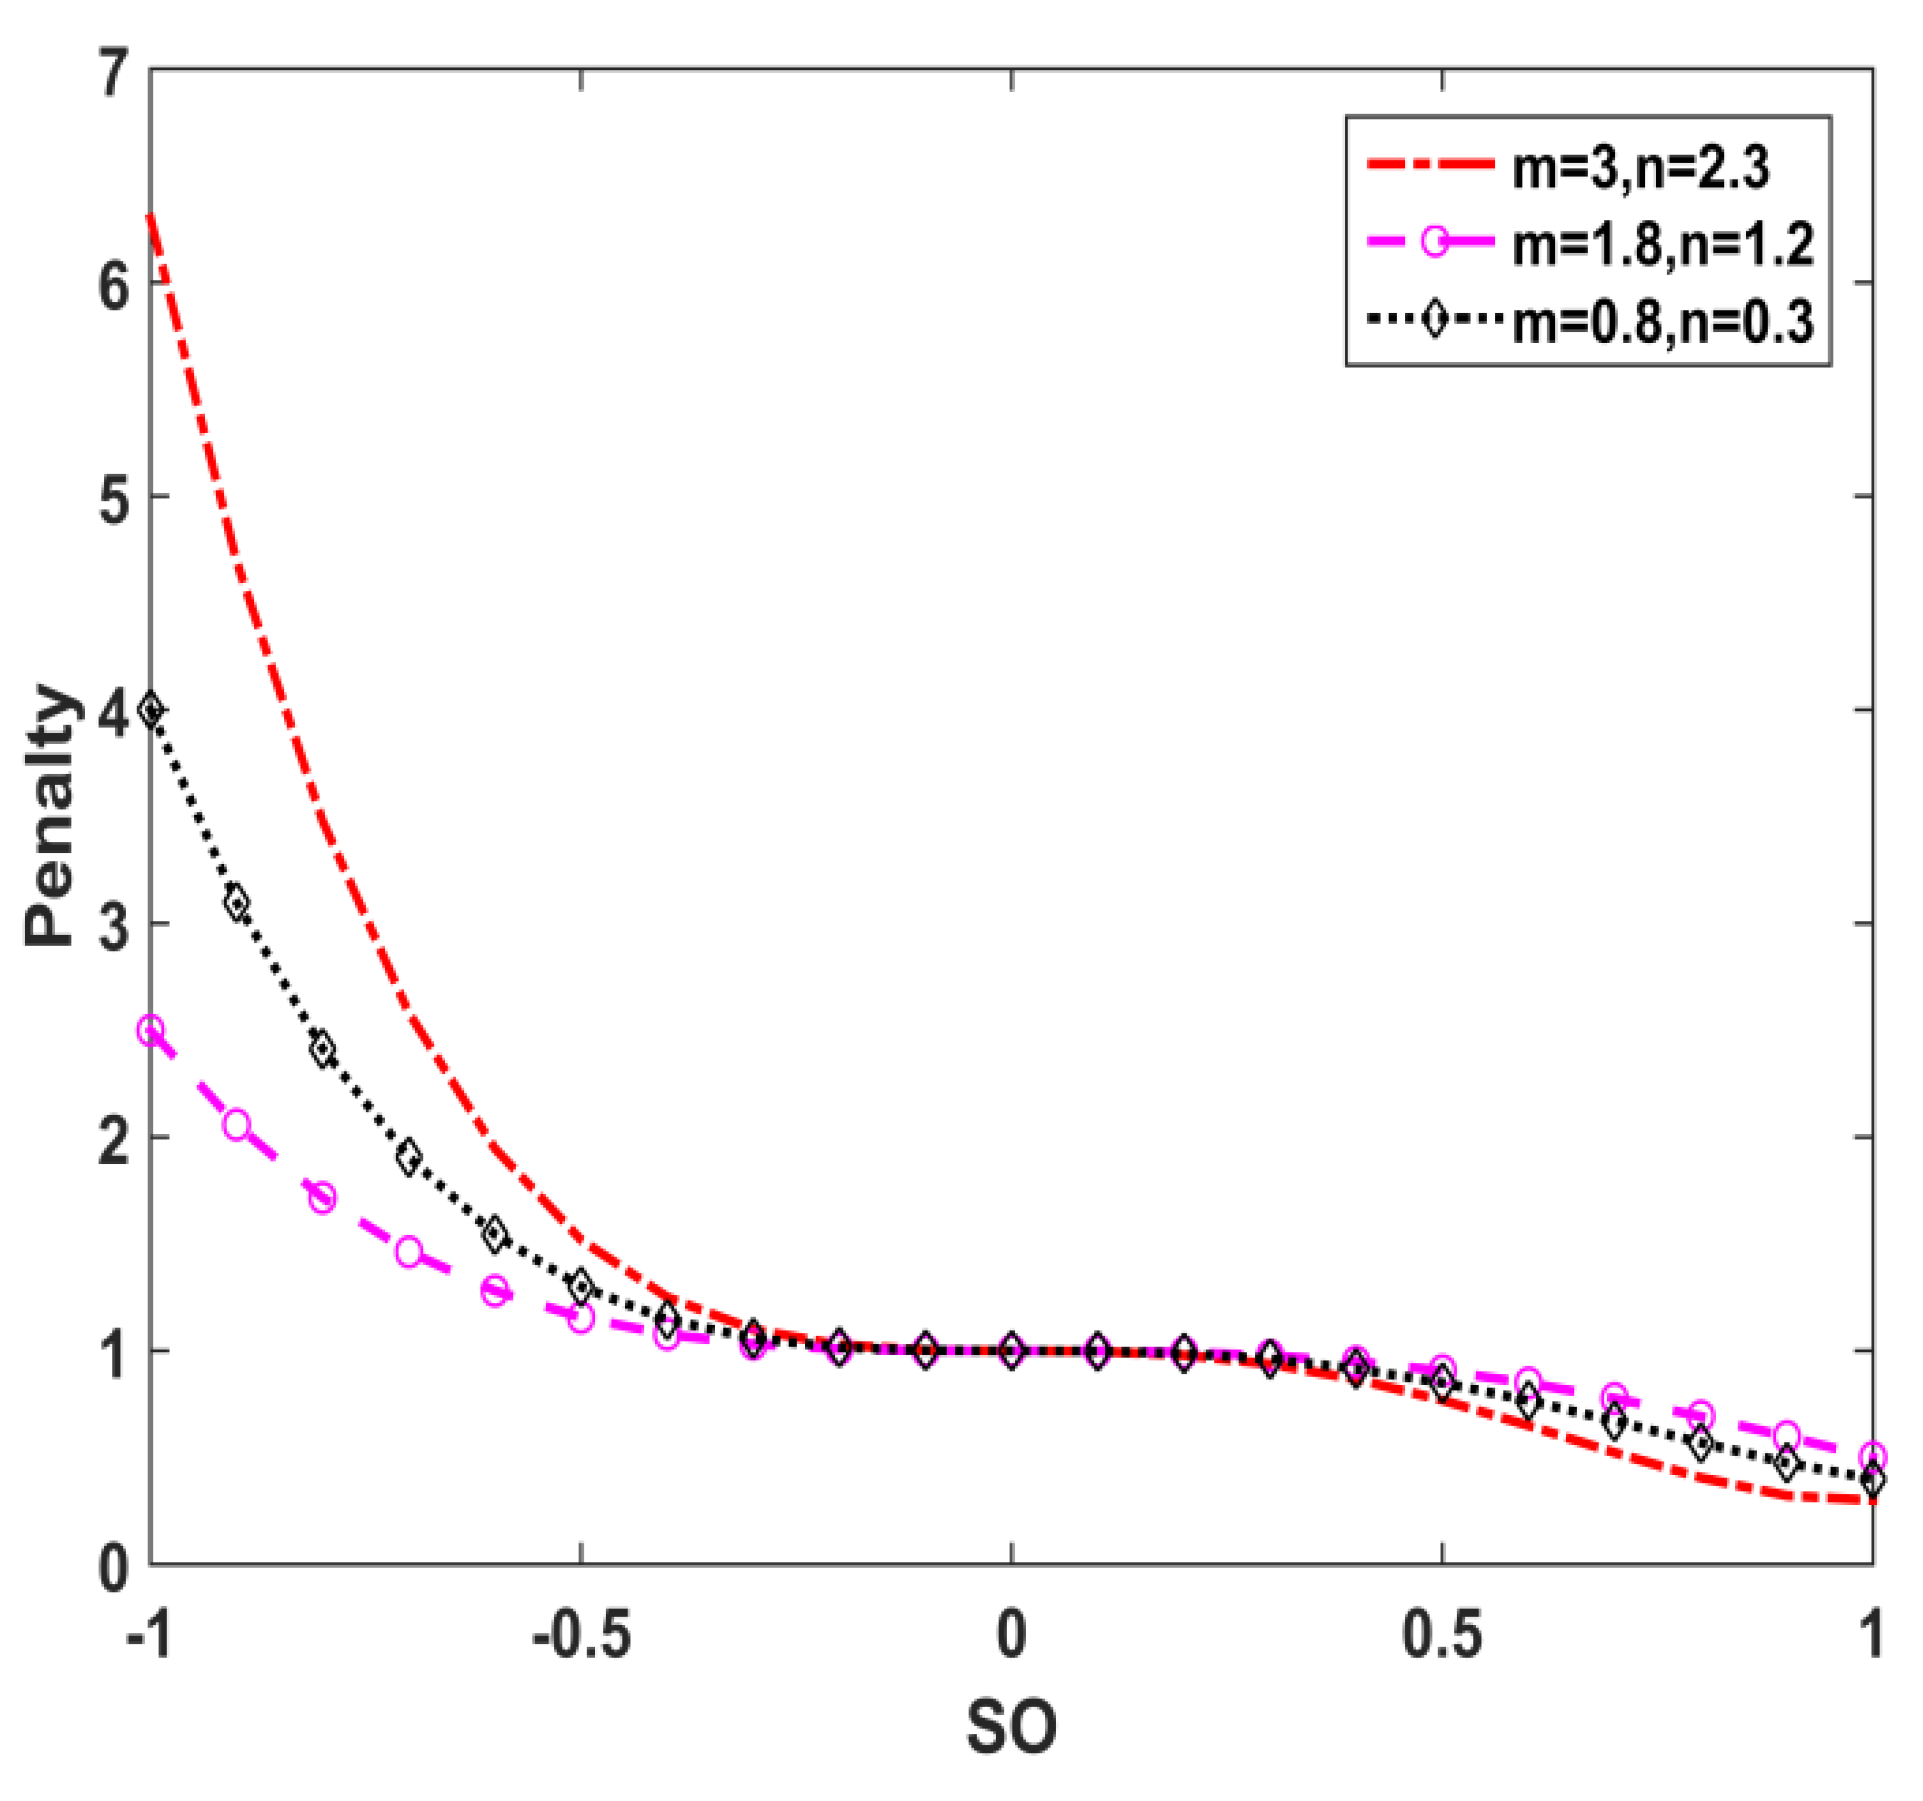
3.2. Correction Function with SOC as Independent Variable
4. Improved ECMS Model
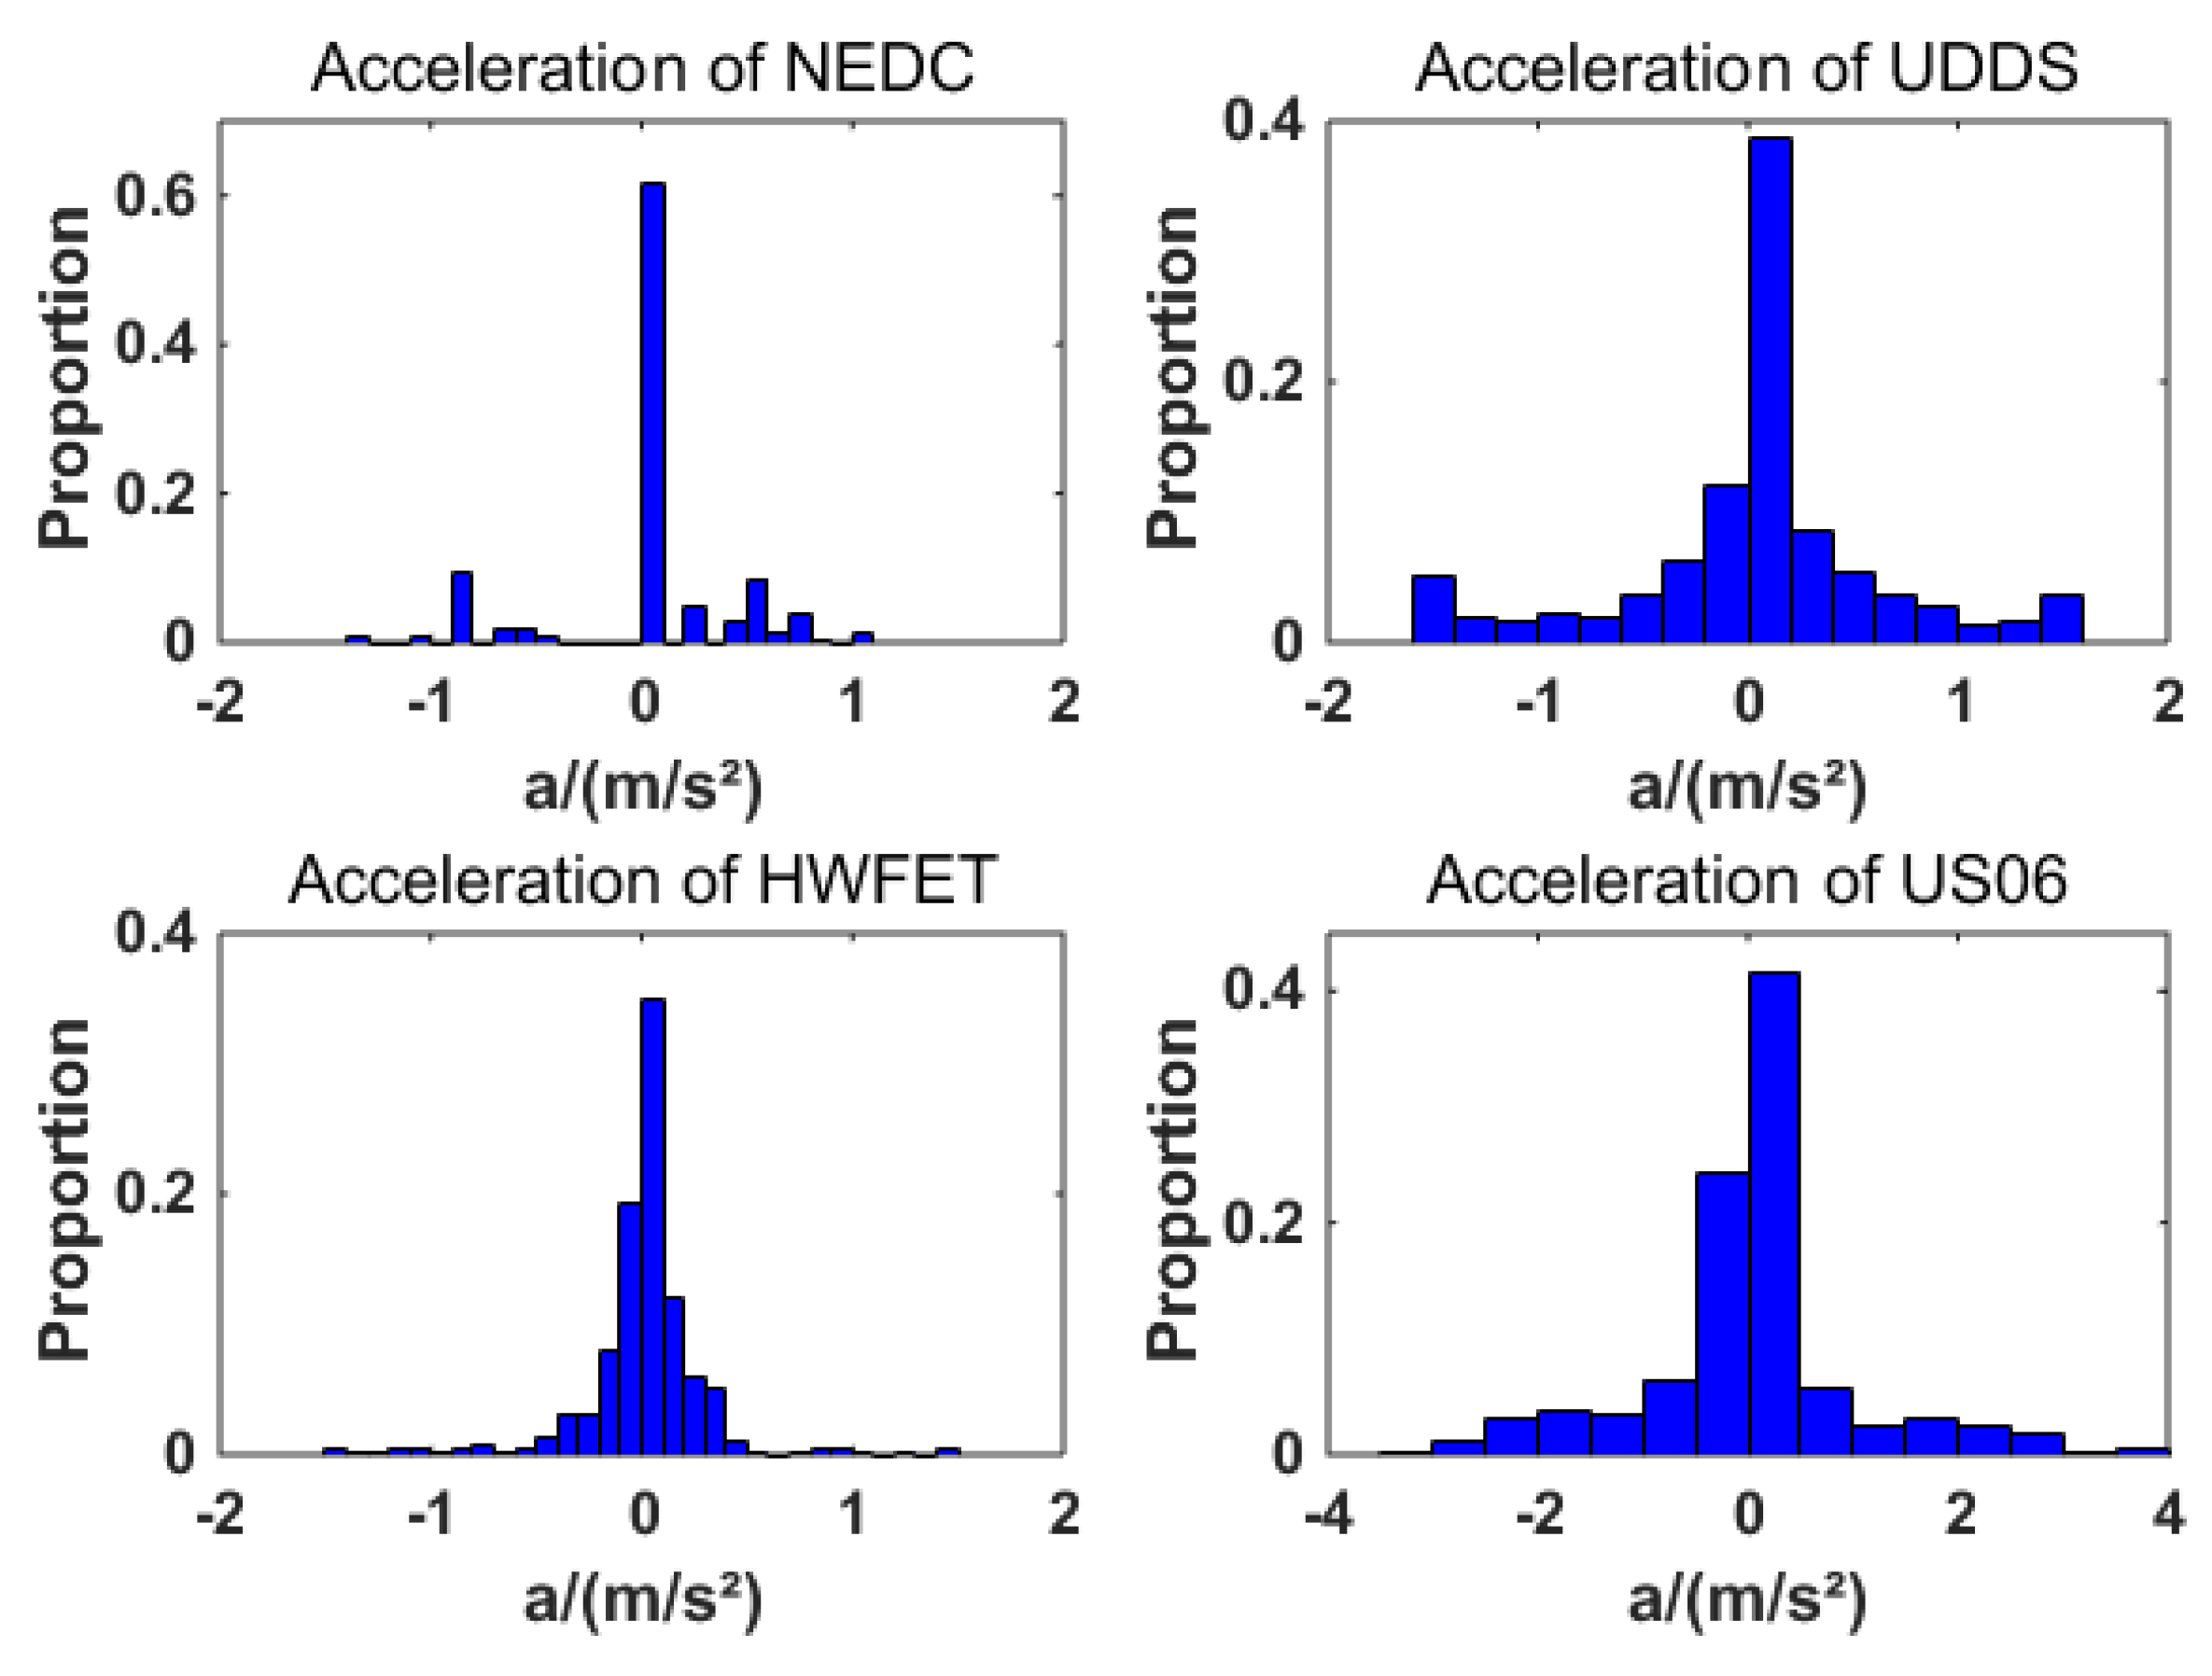
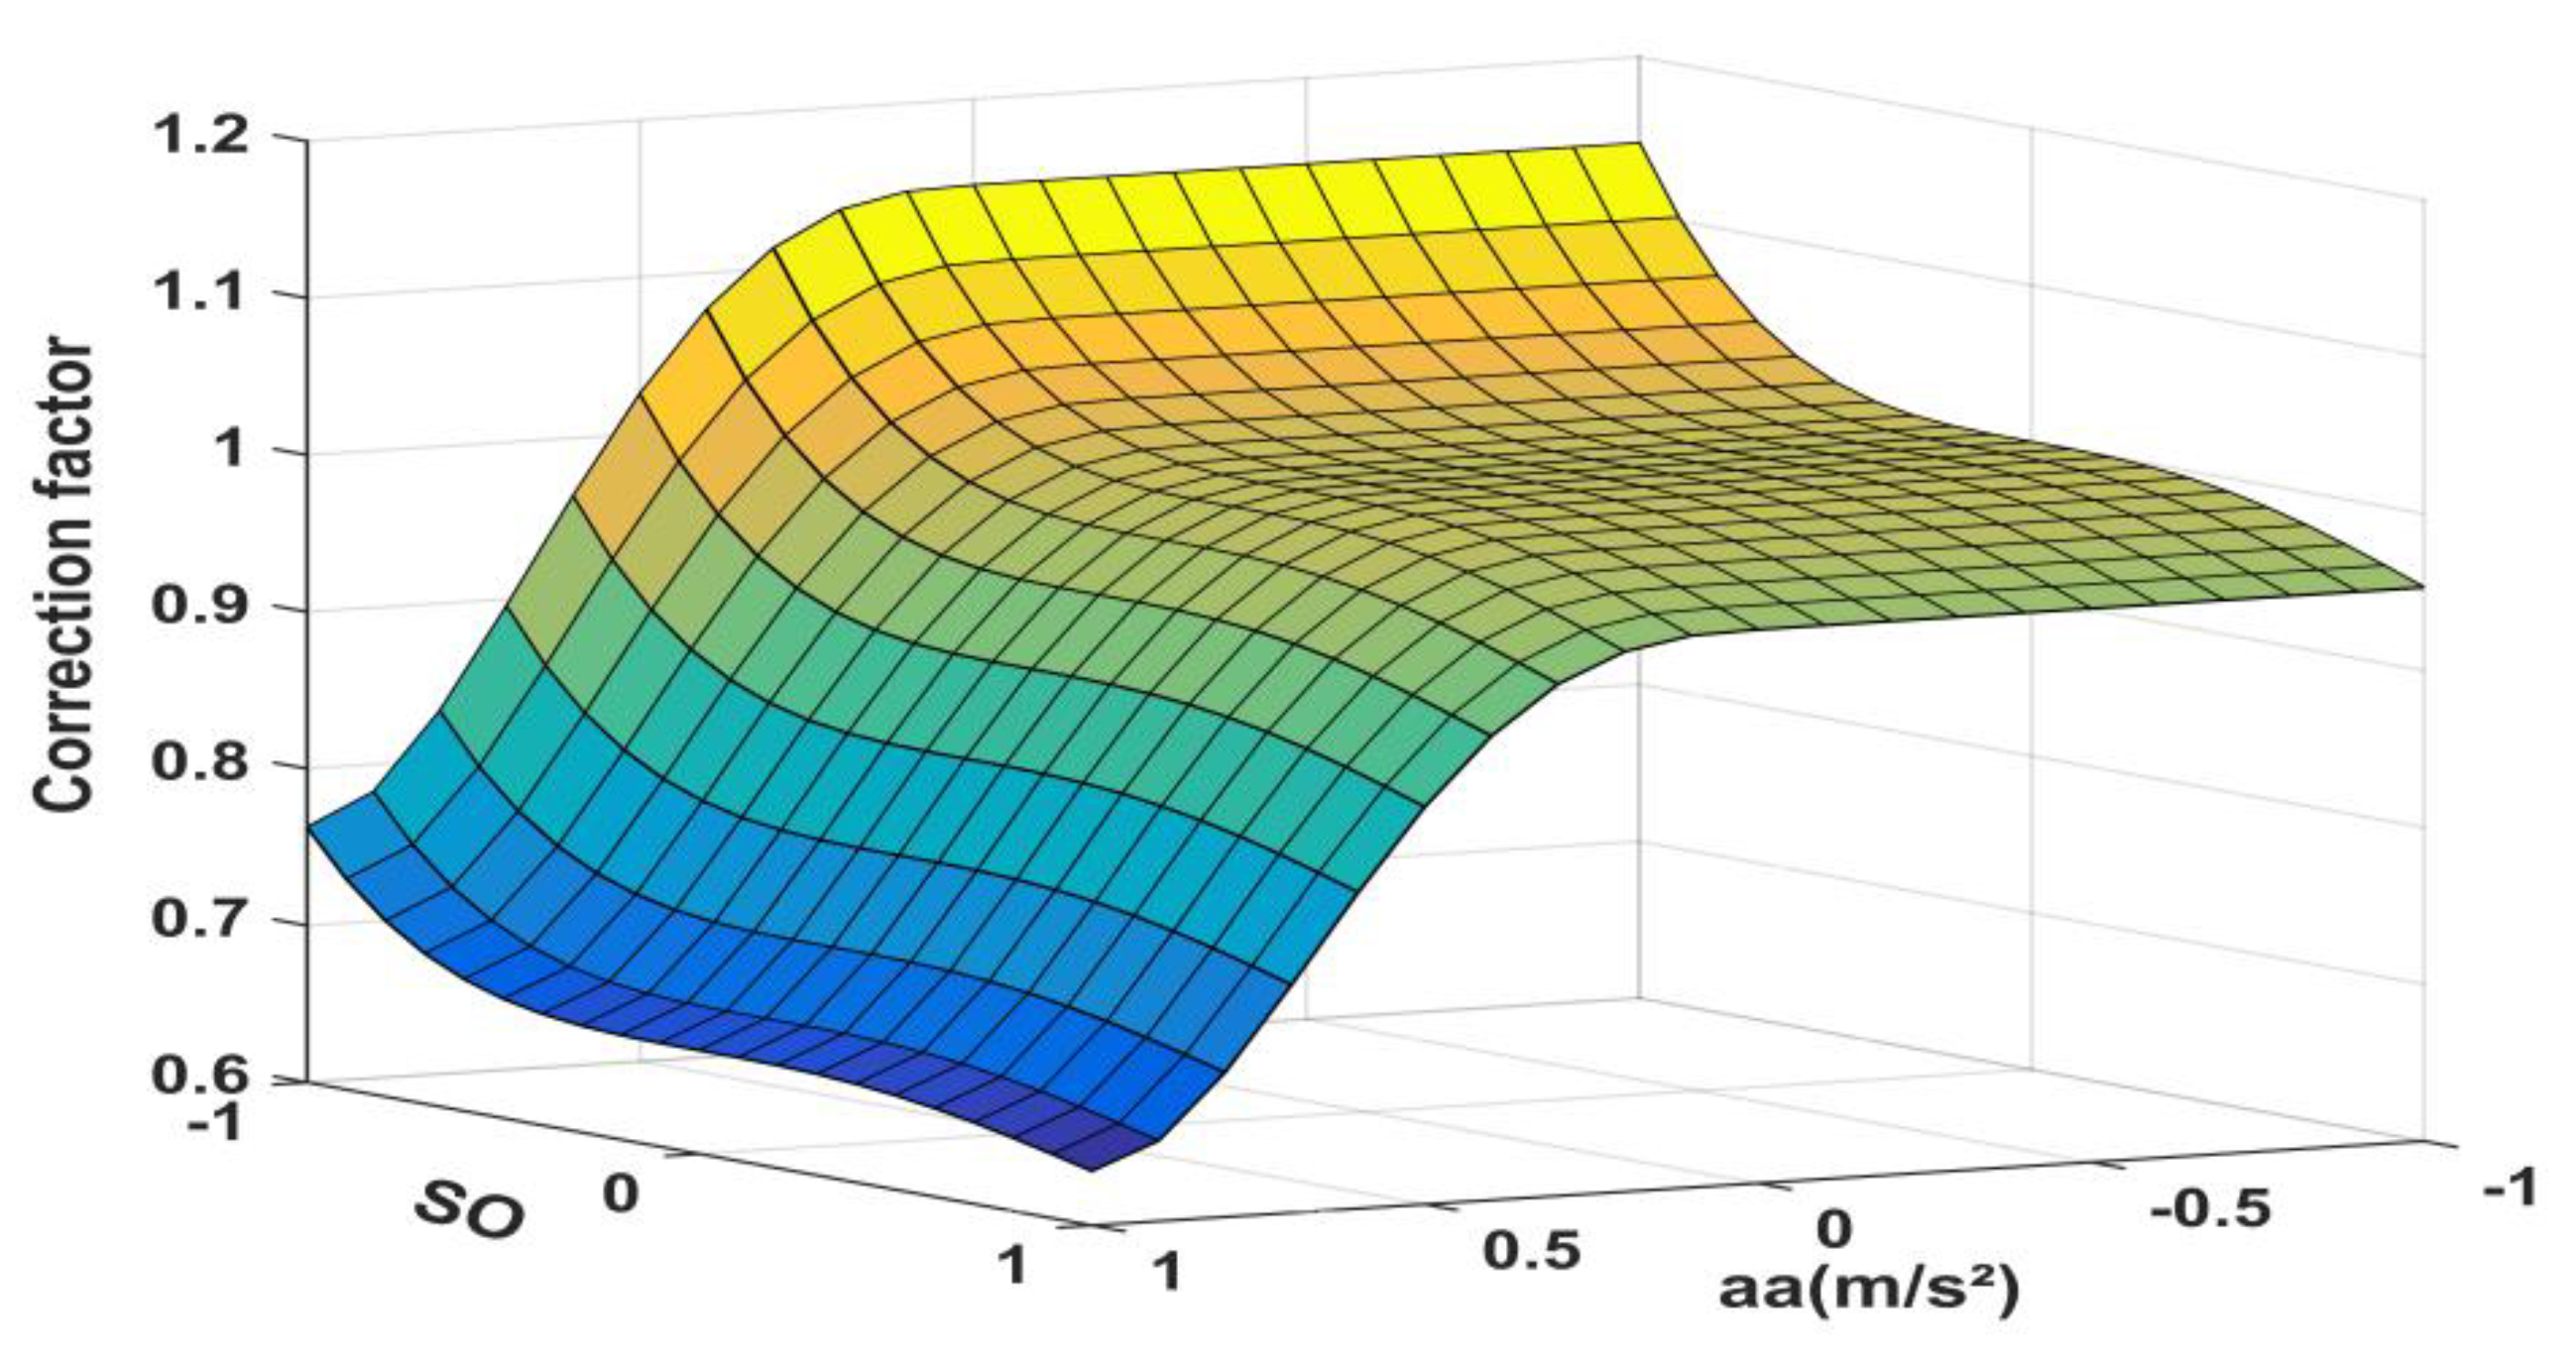
4.1. Correction Function with Acceleration a as the Independent Variable
4.2. Optimal Equivalence Factor MAP Establishment
Establishment of Equivalence Factor MAP with SOC and a as Independent Variables
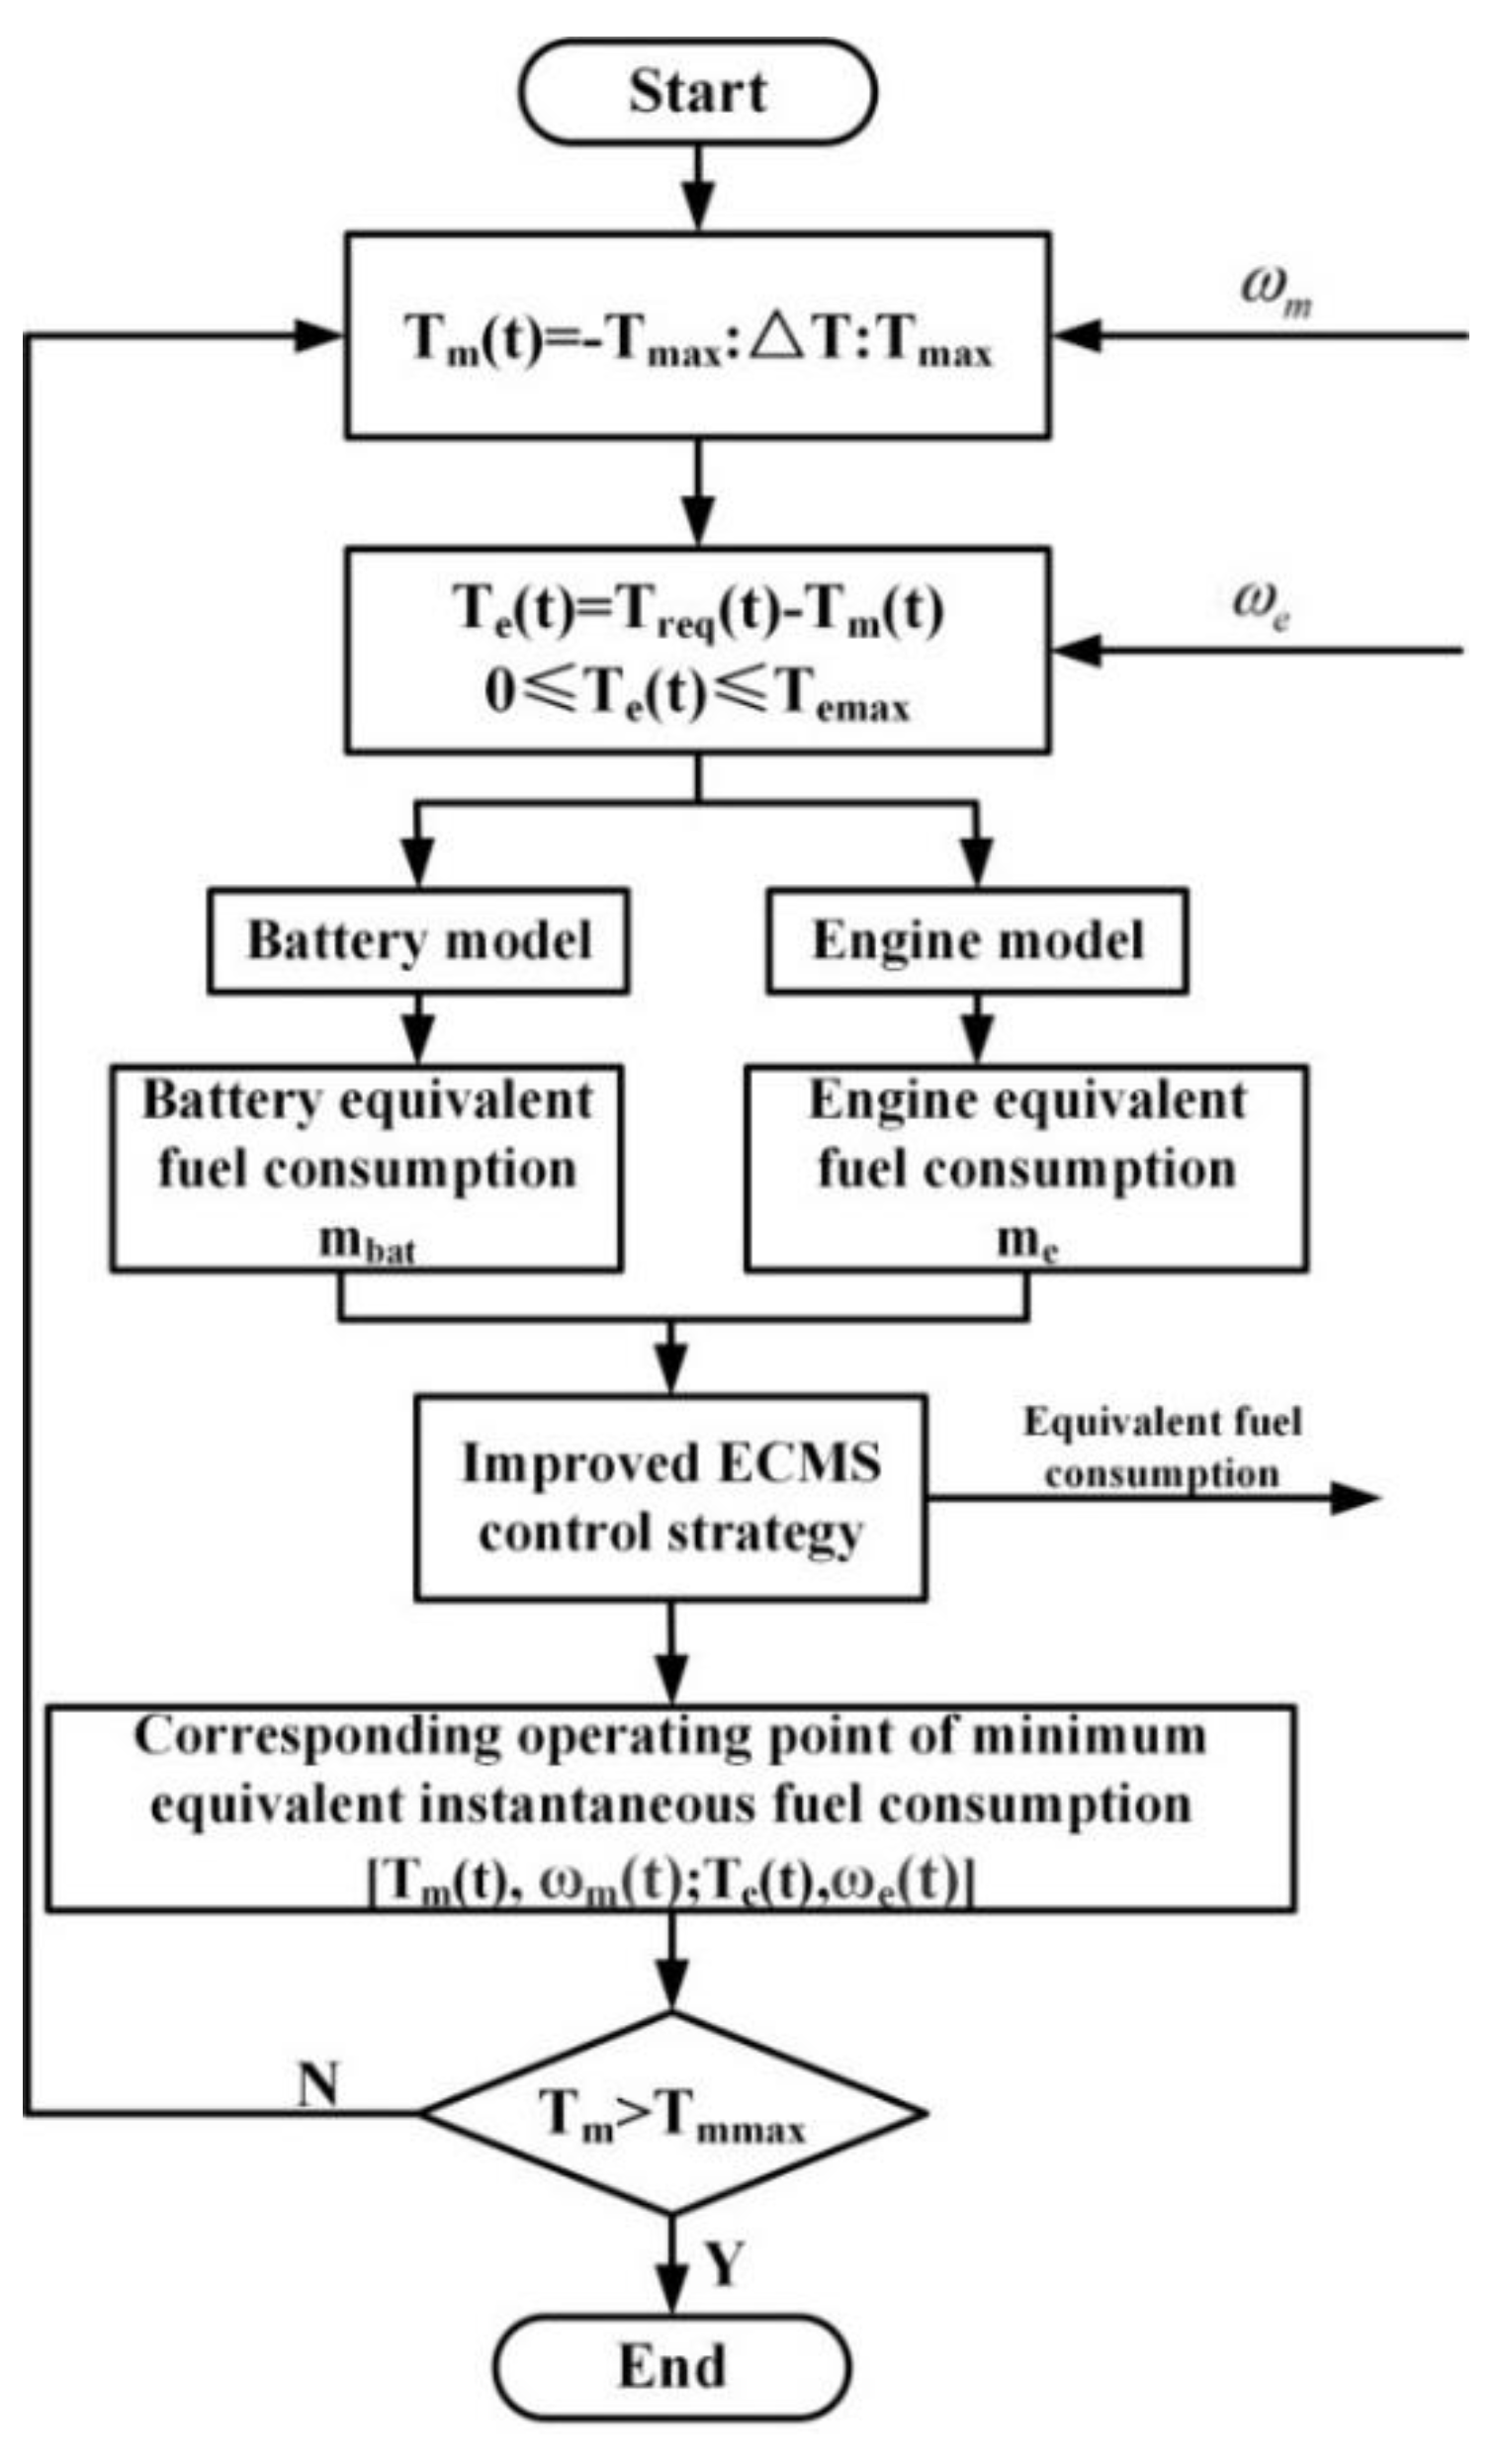
4.3. Improved ECMS Real-Time Optimization Solution
5. Simulation and Analysis
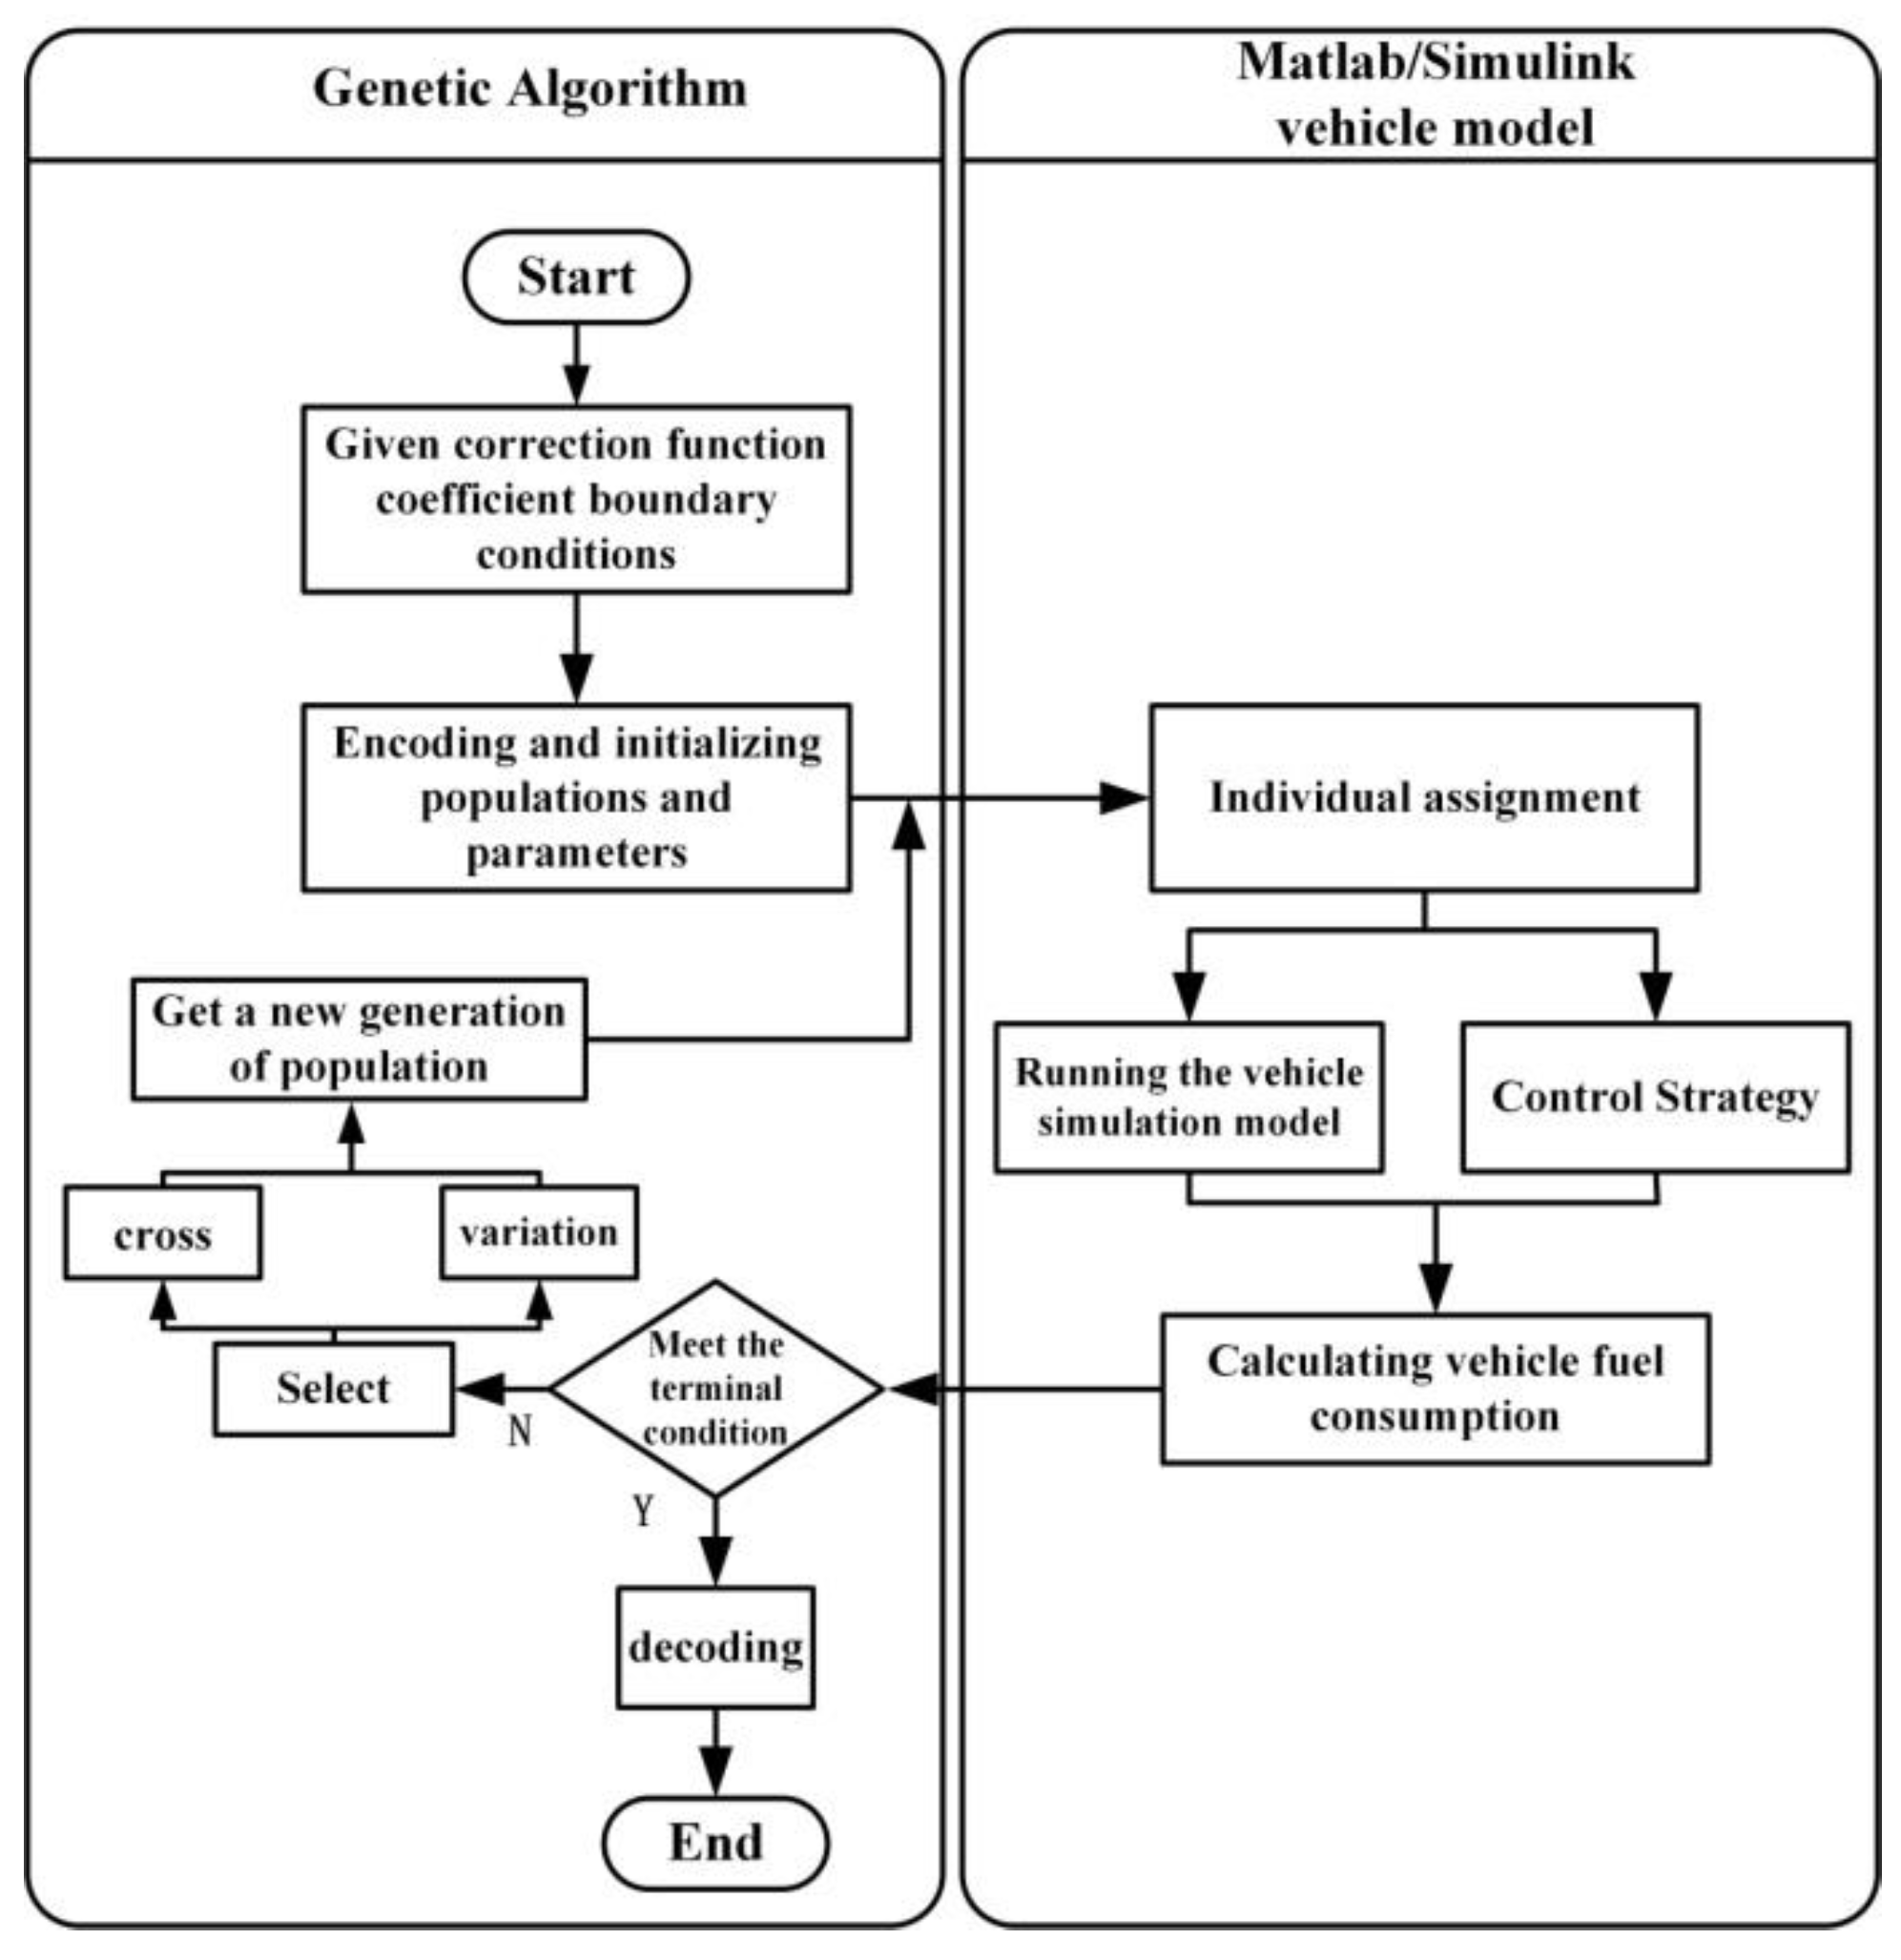
5.1. GA Optimization Result
5.2. Vehicle Simulation Results and Analysis
6. Conclusions
- A study was conducted to improve the fuel economy of a parallel hybrid electric vehicle using an ECMS with the equivalent factor as the core. The relationship model between acceleration a, battery SOC, and equivalent factor S was established according to the vehicle driving state, and the best equivalent factor MAP was obtained and verified by simulation.
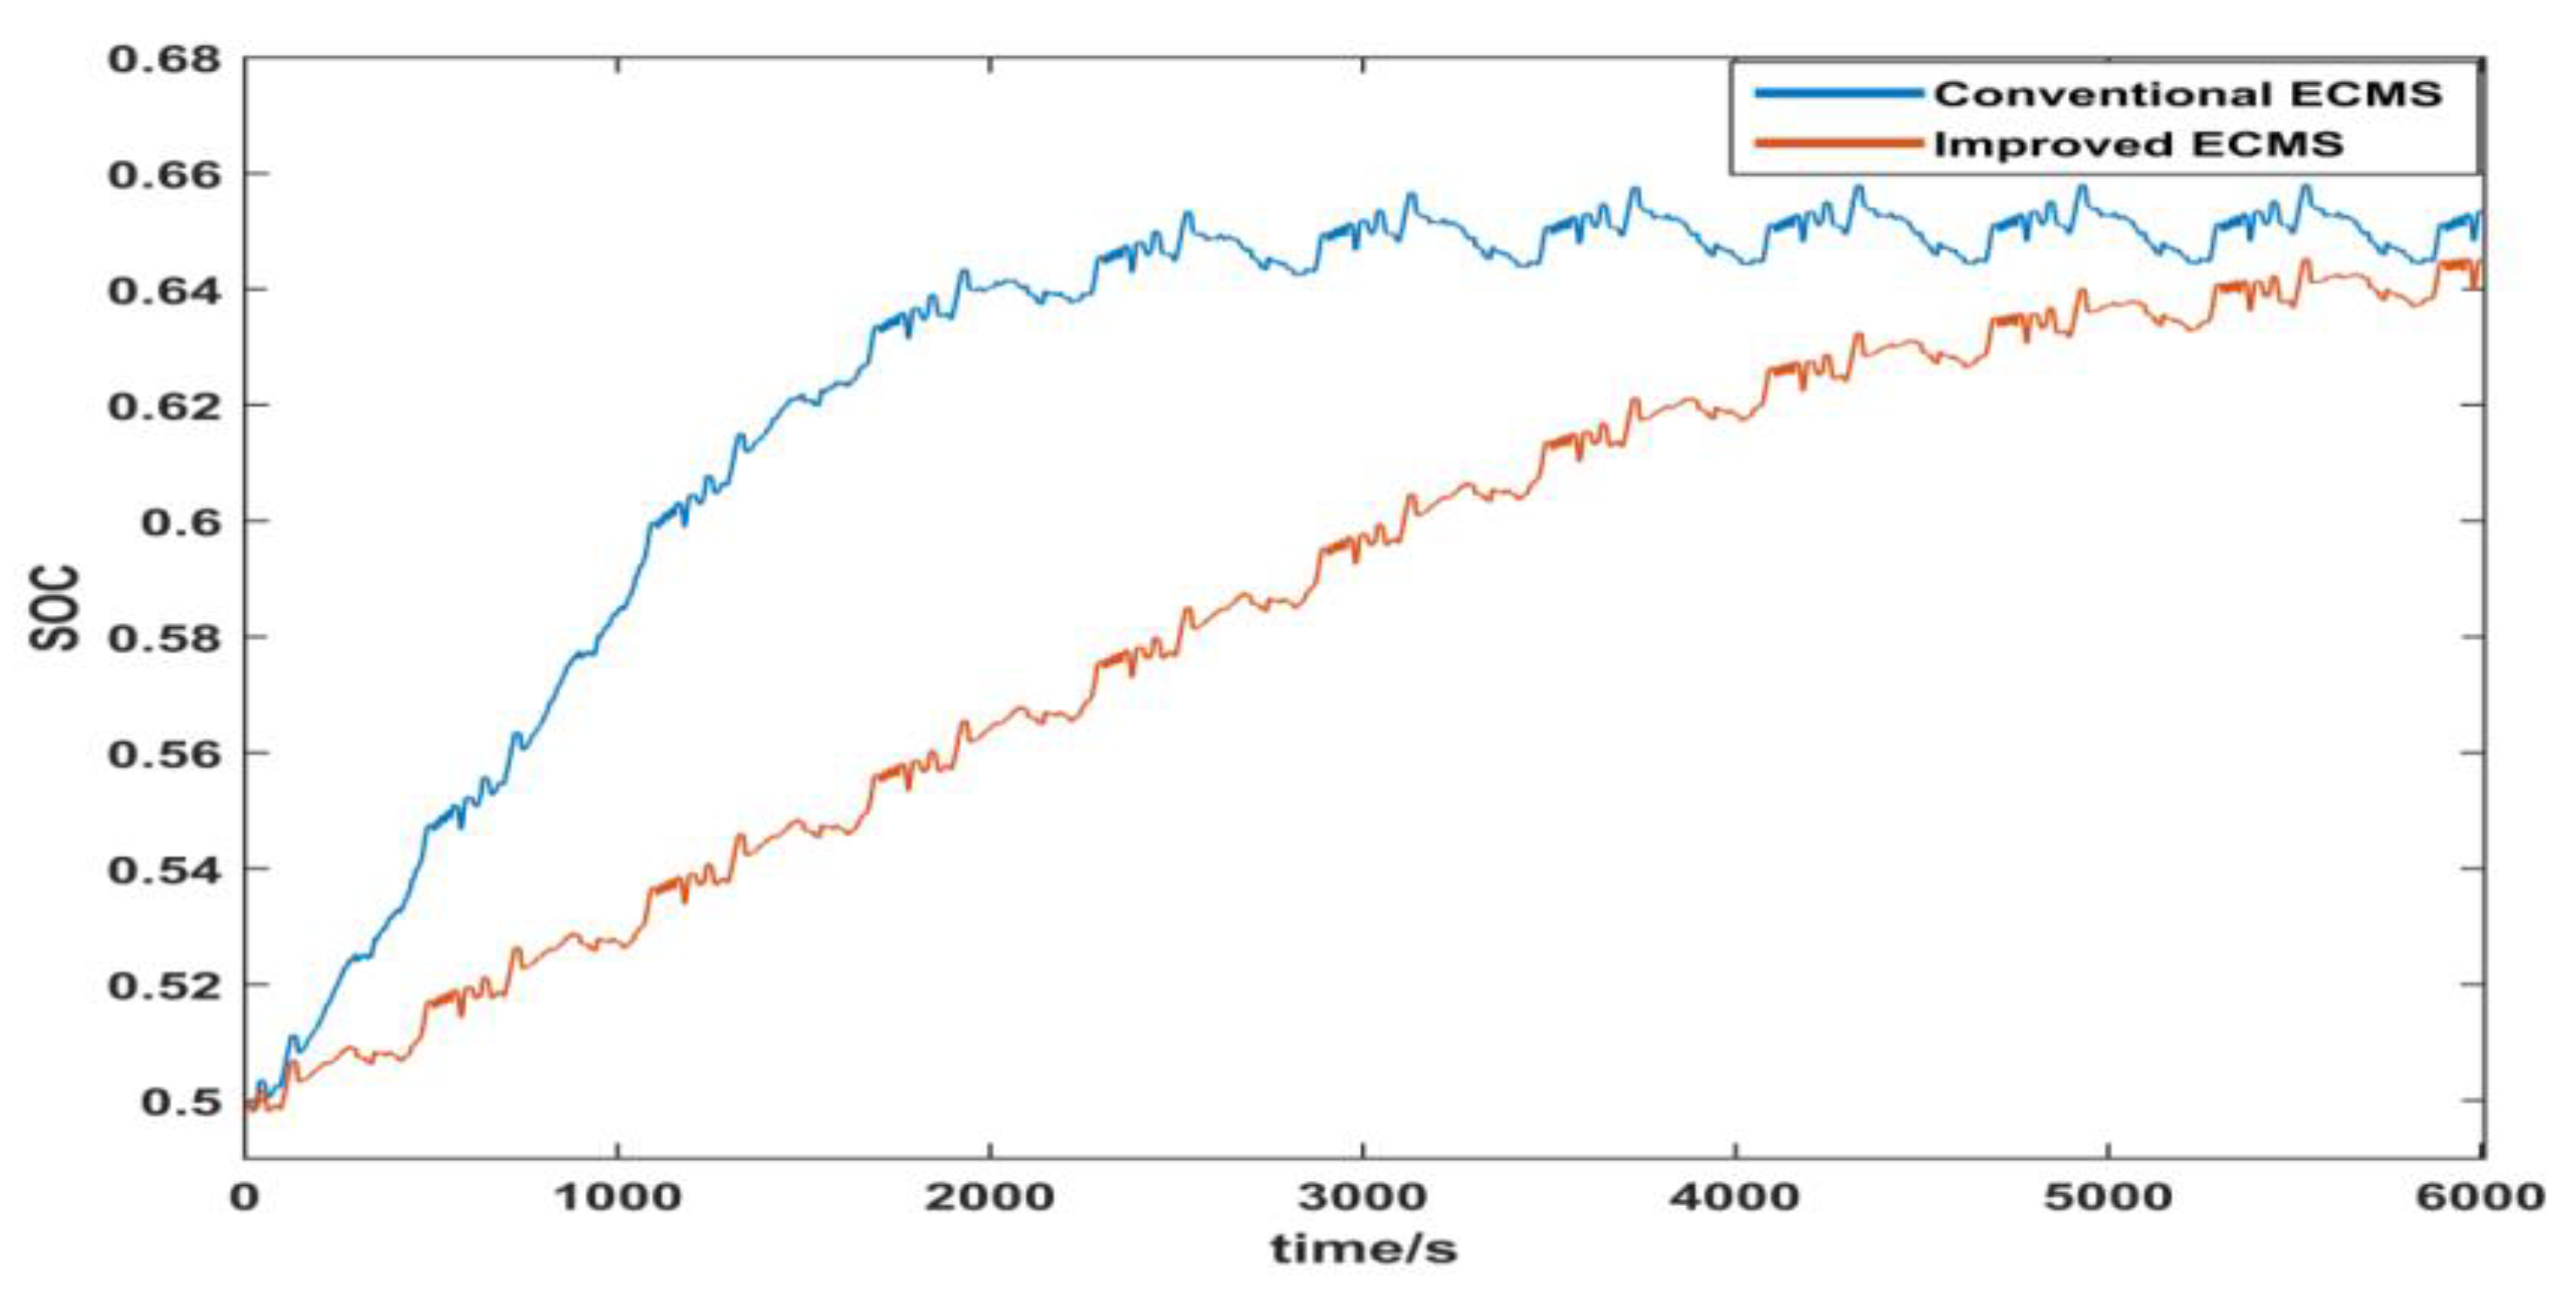
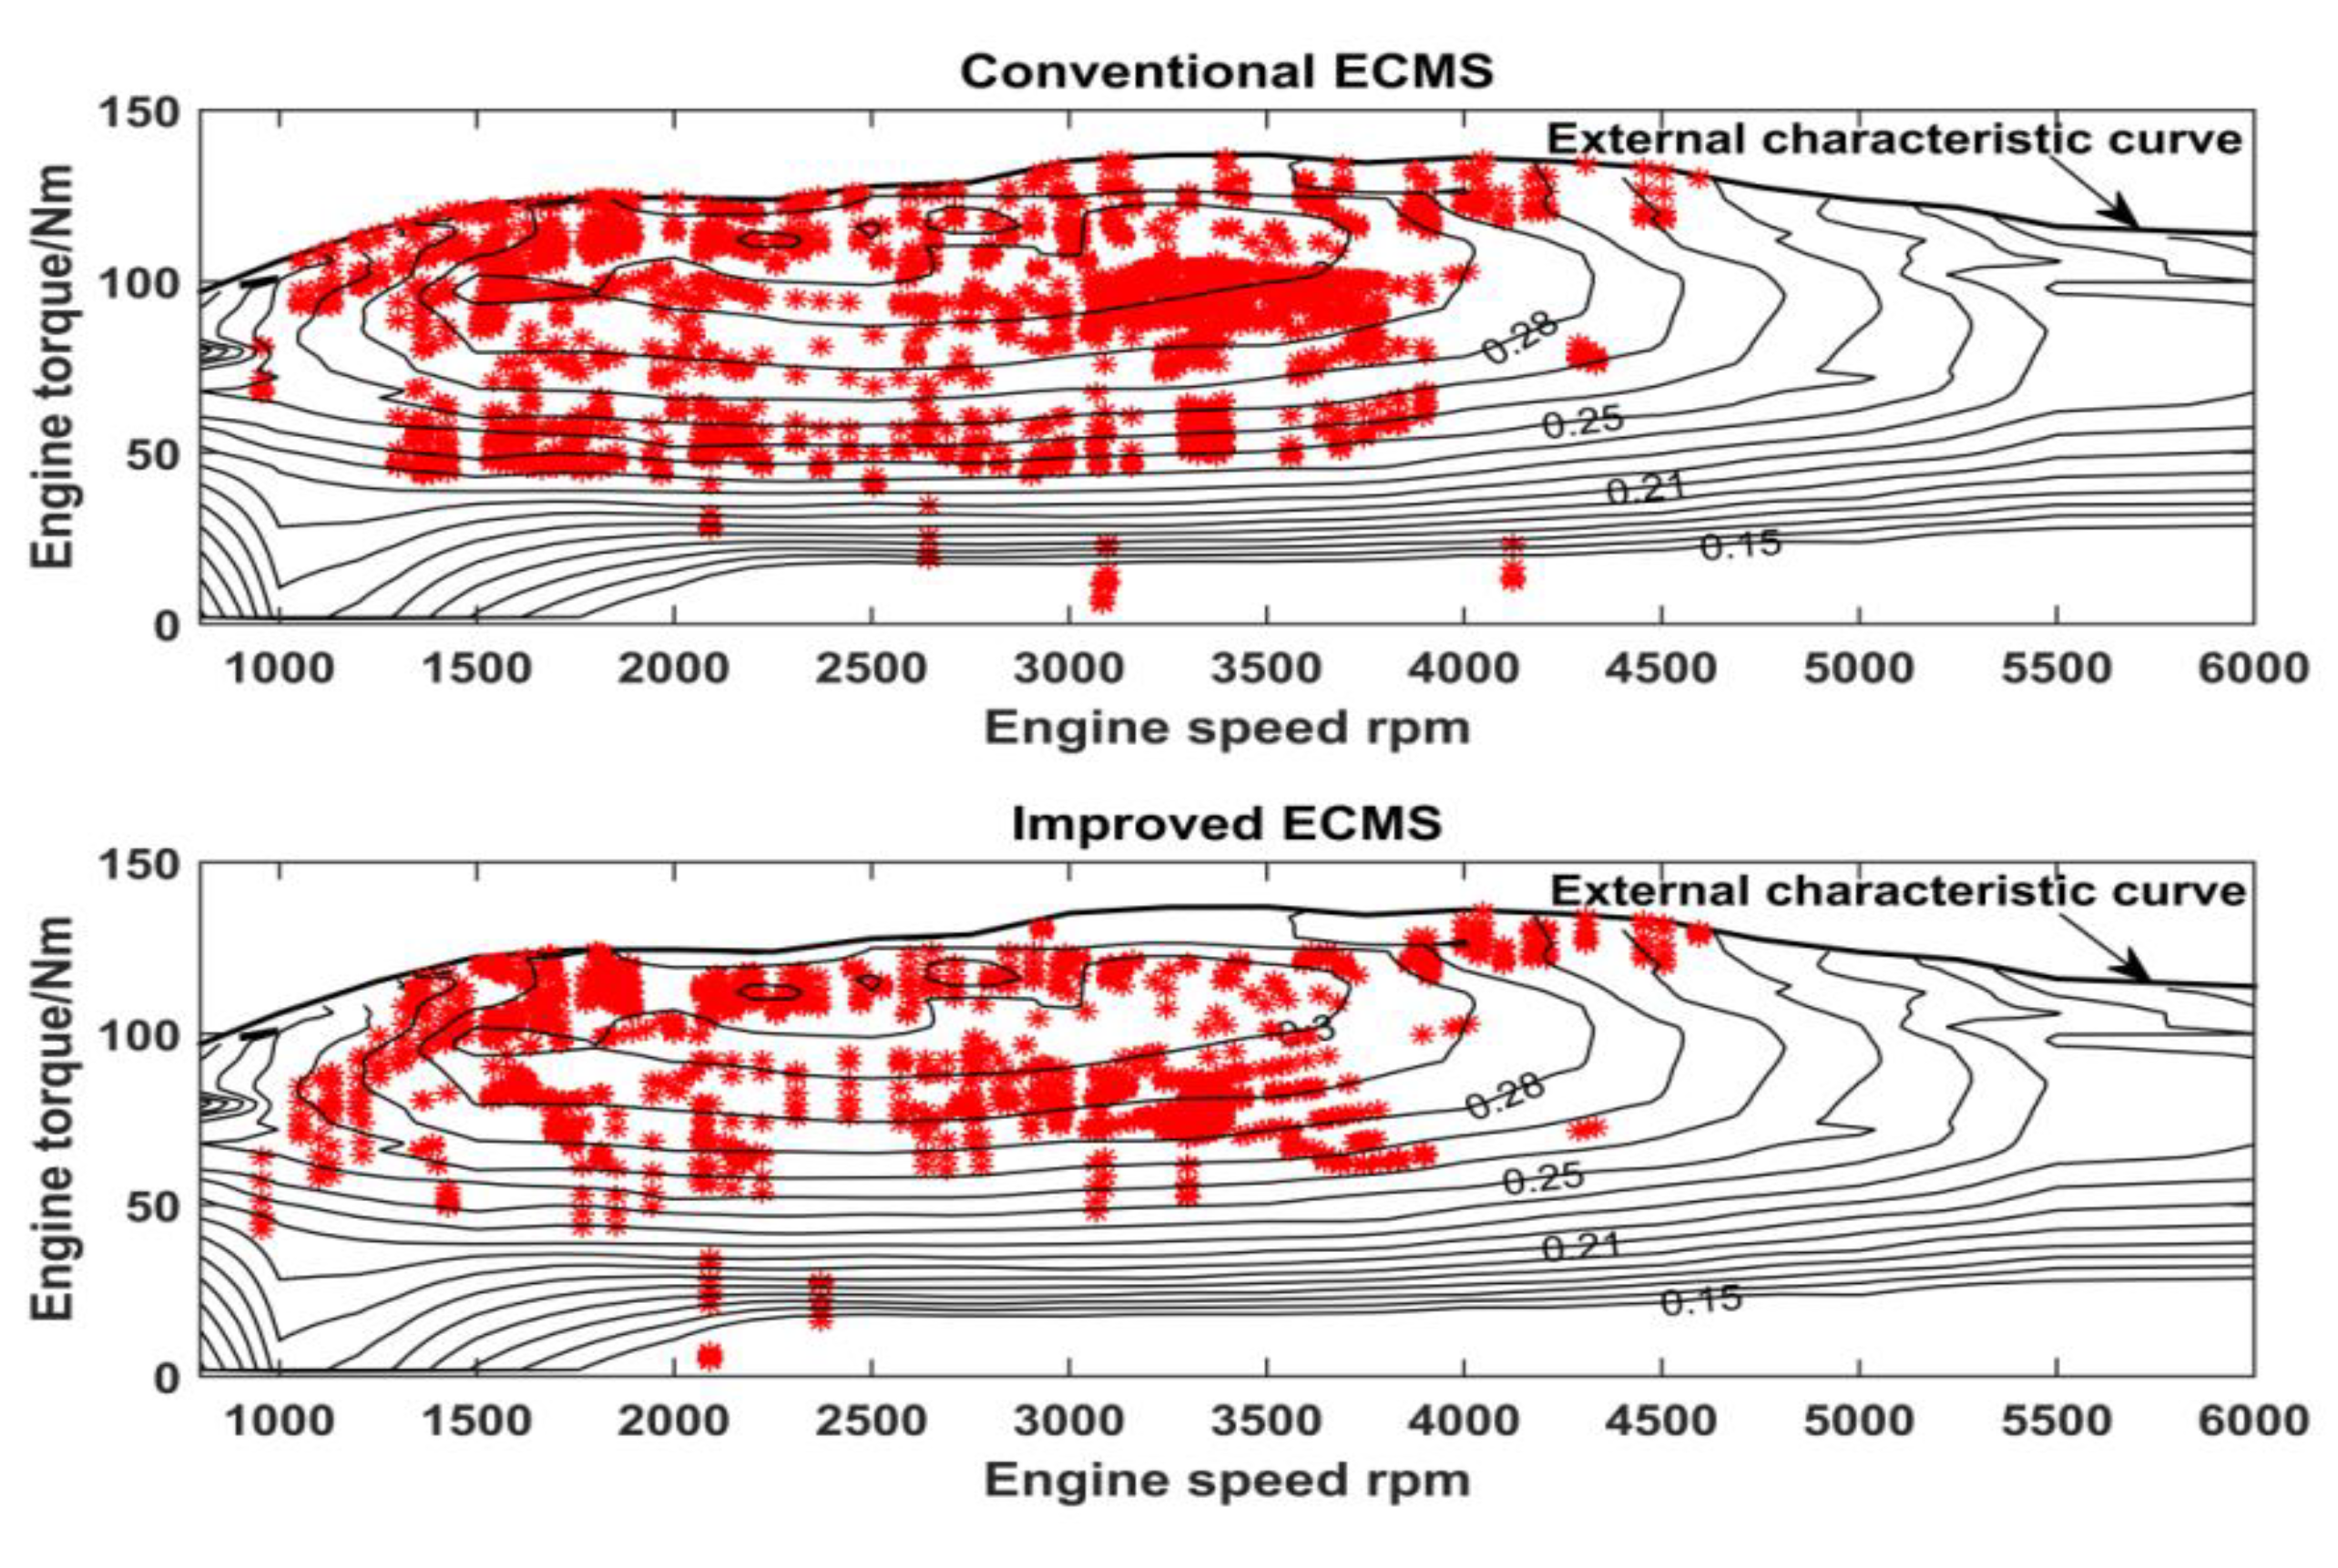
- The simulation results show that compared with conventional ECMS, the proposed ECMS better maintains the SOC of the battery at the end of the driving process and improves fuel economy by 1.88%; compared with the RB energy management strategy, the fuel economy is improved by 10.17%. The results thus confirm the effectiveness of the proposed control strategy.
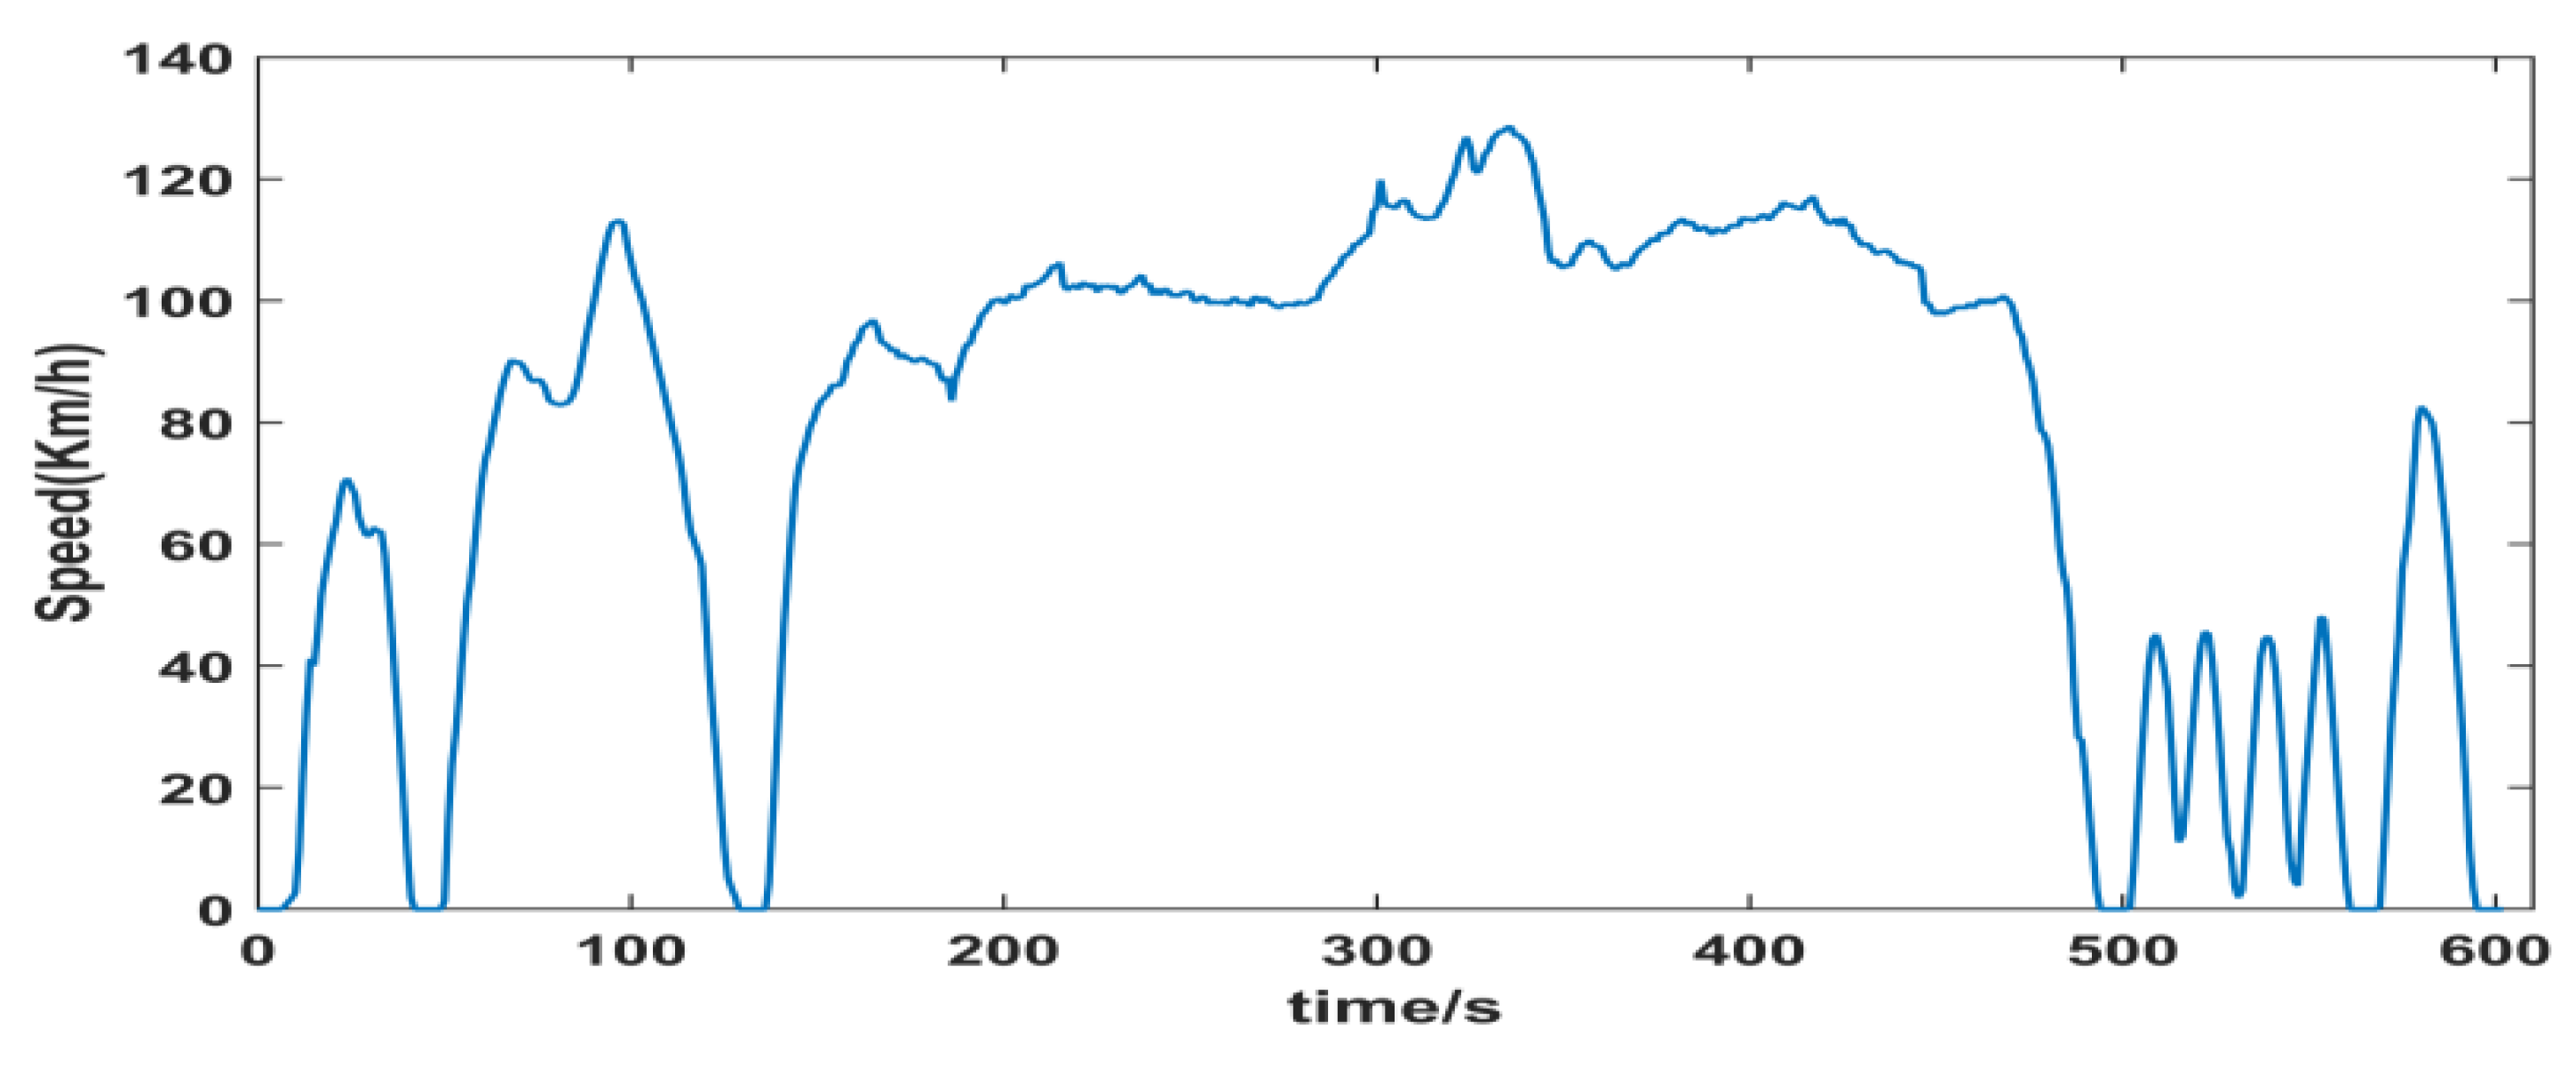
- A simulation was carried out under the US06 conditions with the initial SOC = 0.5. Since the establishment of the equivalent factor correction function depends on the acceleration of the vehicle and the battery SOC, the control strategy proposed in this article is still applicable to other driving conditions; meanwhile, this strategy still applies when the initial battery SOC changes. But if the working condition and the initial SOC change, the fuel-saving effect of the vehicle will also change.
- The engine model studied in this paper is a steady-state model obtained by two-dimensional interpolation under steady-state engine conditions. During the whole vehicle driving process, most of the engine operation points were under dynamic conditions. When the vehicle accelerates, the engine torque fluctuation range is large; thus, the next step is to compare the fuel economy effect according to the engine dynamics model.
Author Contributions
Funding
Conflicts of Interest
References
- Yi, T. Real-time simulation and research on control algorithm of parallel hybrid electric vehicle. Chin. J. Mech. Eng. 2003, 39, 156–161. [Google Scholar]
- Wirasingha, S.G.; Emadi, A. Classification and Review of Control Strategies for Plug-In Hybrid Electric Vehicles. IEEE Trans. Veh. Technol. 2011, 60, 111–122. [Google Scholar] [CrossRef]
- Bianchi, D.; Rolando, L.; Serrao, L.; Onori, S. A Rule-Based Strategy for a Series/Parallel Hybrid Electric Vehicle: An Approach Based on Dynamic Programming. In Proceedings of the 3rd Annual Dynamic Systems and Control Conference, Cambridge, MA, USA, 13–15 September 2010; pp. 507–514. [Google Scholar]
- Zhu, H.; Yongfa, Q.; Sun, H.; Chao, Y.; Lin, Z. Research of energy management strategy in PHEV based on fuzzy control. Agric. Equip. Technol. 2016, 42, 62–64. [Google Scholar]
- Chen, Z.; Mi, C.C.; Xu, J.; Gong, X. Energy Management for a Power-Split Plug-in Hybrid Electric Vehicle Based on Dynamic Programming and Neural Networks. IEEE Trans. Veh. Technol. 2014, 63, 1567–1580. [Google Scholar] [CrossRef]
- Qin, D.; Yang, G.; Liu, Y.; Lin, Y. A research on energy consumption optimization control strategy for plug-in hybrid electric vehicle. Automot. Eng. 2015, 37, 1366–1377. [Google Scholar]
- Park, J. Development of equivalent fuel consumption minimization strategy for hybrid electric vehicles. Int. J. Automot. Technol. 2012, 13, 835–843. [Google Scholar] [CrossRef]
- Paganelli, G.; Delprat, S.; Guerra, T.M. Equivalent Consumption Minimization Strategy for Parallel Hybrid Powertrains. In Proceedings of the 55th IEEE Vehicular Technology Conference, Birmingham, AL, USA, 6–9 May 2002; pp. 2076–2081. [Google Scholar]
- Hosseini, S.M.; Carli, R.; Dotoli, M. Model Predictive Control for Real-Time Residential Energy Scheduling under Uncertainties. In Proceedings of the IEEE International Conference on Systems, Man, and Cybernetics, IEEE Syst Man & Cybernet Soc (SMC), Miyazaki, Japan, 7–10 October 2018; pp. 1386–1391. [Google Scholar]
- Lin, X.; Feng, Q.; Zhang, S. Global Optimal Discrete Equivalent Factor of Equivalent Fuel Consumption Minimization Strategy Based Energy Management Strategy for a Series-parallel Plug-in Hybrid Electric Vehicle. Chin. J. Mech. Eng. 2016, 52, 102–110. [Google Scholar] [CrossRef]
- Larsson, V.; Johannesson, L.M.; Egardt, B.; Lassson, A. Benefit of Route Recognition in Energy Management of Plug-in Hybrid Electric Vehicles. In Proceedings of the American Control Conference (ACC), Montreal, QC, Canada, 27–29 June 2012; pp. 1314–1320. [Google Scholar]
- Hongfei, H.; Xiangdong, H.; Amp, L.Y. Real-time Equivalent Energy Consumption Minimization Strategy for HEV. Automot. Eng. 2006, 28, 516–520. [Google Scholar]
- Qin, S.; Duoyang, Q.; Bing, W. A Research on Equivalent Fuel Consumption Minimization Strategy Optimization Based on Double-loop Multi-objective Particle Swarm Optimization Algorithm. Automot. Eng. 2018, 40, 1005–1013. [Google Scholar]
- Lin, X.Y.; Sun, D.Y. Driving Pattern Recognition Based on ECMS and its Application to Control Strategy for a Series-parallel Hybrid Electric Bus. J. Hunan. Univ: Nat. Sci. Ed. 2012, 39, 43–49. [Google Scholar]
- Ying, W. Study on Energy-saving Driving Skills of City Bus. J. Trans. Eng. Info. 2013, 11, 114–120. [Google Scholar]
- Xiang, C.; Ding, F.; Wang, W. Energy management of a dual-mode power-split hybrid electric vehicle based on velocity prediction and nonlinear model predictive control. Appl. Energy 2017, 189, 640–653. [Google Scholar] [CrossRef]
- Carli, R.; Dotoli, M. Energy Scheduling of a Smart Home Under Nonlinear Pricing. In Proceedings of the 53rd IEEE Annual Conference on Decision and Control (CDC), Los Angeles, CA, USA, 15–17 December 2014; pp. 5648–5653. [Google Scholar]
- Krein, P.T. Battery Management for Maximum Performance in Plug-In Electric and Hybrid Vehicles. In Proceedings of the IEEE Vehicle Power and Propulsion Conference (VPPC), Arlington, TX, USA, 9–12 September 2007; pp. 2–5. [Google Scholar]
- Gökce, K.; Ozdemir, A. An instantaneous optimization strategy based on efficiency maps for internal combustion engine/battery hybrid vehicles. Energy Convers. Manag. 2014, 81, 255–269. [Google Scholar] [CrossRef]
- Wang, Q.; You, S.; Li, L. Survey on Energy Management Strategy for Plug-in Hybrid Electric Vehicles. Chin. J. Mech. Eng. 2017, 53, 1–19. [Google Scholar] [CrossRef]
- Paganelli, G.; Ercole, G.; Brahma, A. General supervisory control policy for the energy optimization of charge-sustaining hybrid electric vehicles. J.SAE Rev. 2001, 22, 511–518. [Google Scholar] [CrossRef]
- Sun, C.; Sun, F.; He, H. Investigating adaptive ECMS with velocity forecast ability for hybrid electric vehicles. Appl. Energy. 2017, 185, 1644–1653. [Google Scholar] [CrossRef]
- Zhao, D.; Stobart, R.; Dong, G.; Winward, E. Real-Time Energy Management for Diesel Heavy Duty Hybrid Electric Vehicles. IEEE Trans. Contr. Syst. Technol. 2015, 23, 829–841. [Google Scholar] [CrossRef]
- Gong, Q.; Li, Y.; Peng, Z.R. Trip-Based Optimal Power Management of Plug-in Hybrid Electric Vehicles. Trans. Veh. Technol. 2008, 57, 3393–3401. [Google Scholar] [CrossRef]


| Components | Parameter and Units | Values |
|---|---|---|
| Vehicle | Mass m/kg | 1547 |
| Frontal area A/m2 | 2.28 | |
| Wind resistance coefficient CD | 0.357 | |
| Wheel radius r/m | 0.289 | |
| Rolling drag coefficient f | 0.0083 | |
| Engine | Maximum power Pemax/kW | 90 |
| Maximum torque Temax/Nm | 160/3900 rpm | |
| ISG motor | Maximum power Pmax/kW | 32 |
| Maximum torque Tmax/Nm | 113 | |
| Range of rotation ωm rpm | 0–6000 | |
| Battery | Capacity Q0/(A·h) | 40 |
| Rated voltage U0/V | 352 | |
| CVT | Speed ratio range icvt | 0.422–2.432 |
| Final drive ratio i0 | 5.297 |
| Variable | Meaning (Units) | Variable | Meaning (Units) |
|---|---|---|---|
| Treq(t) 1 | vehicle demand torque (Nm) | ωm(t) 1 | motor speed (rpm) |
| Te(t) 1 | engine torque (Nm) | ωe(t) 1 | engine speed (rpm) |
| Tm(t) 1 | motor torque (Nm) | ωw(t) 1 | wheel speed (rpm) |
| icvt(t) 1 | CVT speed ratio | u(t) 1 | vehicle speed (Km/h) |
| i0 | the final drive ratio | r | wheel radius (m) |
| ηT(t) 1 | the efficiency of the transmission system | - | - |
| Variable | Meaning (Units) | Variable | Meaning (Units) |
|---|---|---|---|
| be(t) 1 | the engine fuel consumption rate (g/kW·h) | ηm_chg(t) 1 | efficiency of the motor during power generation |
| ηe(t) 1 | the engine efficiency | ηm_dis(t) 1 | efficiency of the motor during driving |
| Vfuel(t) 1 | the engine fuel consumption (L) | Tm_chg(t) 1 | torque of the motor during power generation (Nm) |
| 0 and tf | the initial and end time of engine operation (s) | Tm_dis(t) 1 | torque of the motor during driving (Nm) |
| Pe(t) 1 | engine power (kW) | - | - |
| Variable | Meaning (Units) | Variable | Meaning (Units) |
|---|---|---|---|
| 1 | SOC change of the battery | ηb_chg(t) 1 | the battery charge efficiency |
| the capacitance of the battery (Ah) | ηb_dis(t) 1 | the battery discharge efficiency | |
| 2 | the battery open circuit voltage (V) | Pb(t) 1 | the power of the battery (kW) |
| 2 | the battery internal resistance (Ω) | Pm(t) 1 | the power of the motor (kW) |
| Variable | Meaning (Units) | Variable | Meaning (Units) |
|---|---|---|---|
| ηcvt(t) 1 | the efficiency of CVT | Tcvt(t) 1 | CVT transmission torque (Nm) |
| Variable | Meaning (Units) | Variable | Meaning (Units) |
|---|---|---|---|
| QECMS(t) 1 | the total equivalent fuel consumption (L) | average efficiency of the motor during power generation | |
| JECMS | instantaneous equivalent fuel consumption (L) | average engine efficiency | |
| 0 and tv | the initial and end time of the vehicle operation (s) | Qf | the low calorific value of the fuel |
| 1 | the engine instantaneous fuel consumption (L) | SO | the battery SOC after normalization |
| Sequ(Pb(t)) 1 | the battery instantaneous equivalent fuel consumption (L) | SOCup | the upper limit of the battery during operation |
| Sequ(t) 1 | battery equivalent factor | SOCl | the lower limit of the battery during operation |
| average charge efficiency of the battery | P(SO) | the correction factor of the battery SOC | |
| average discharge efficiency of the battery | m and n | SOC correction function coefficients | |
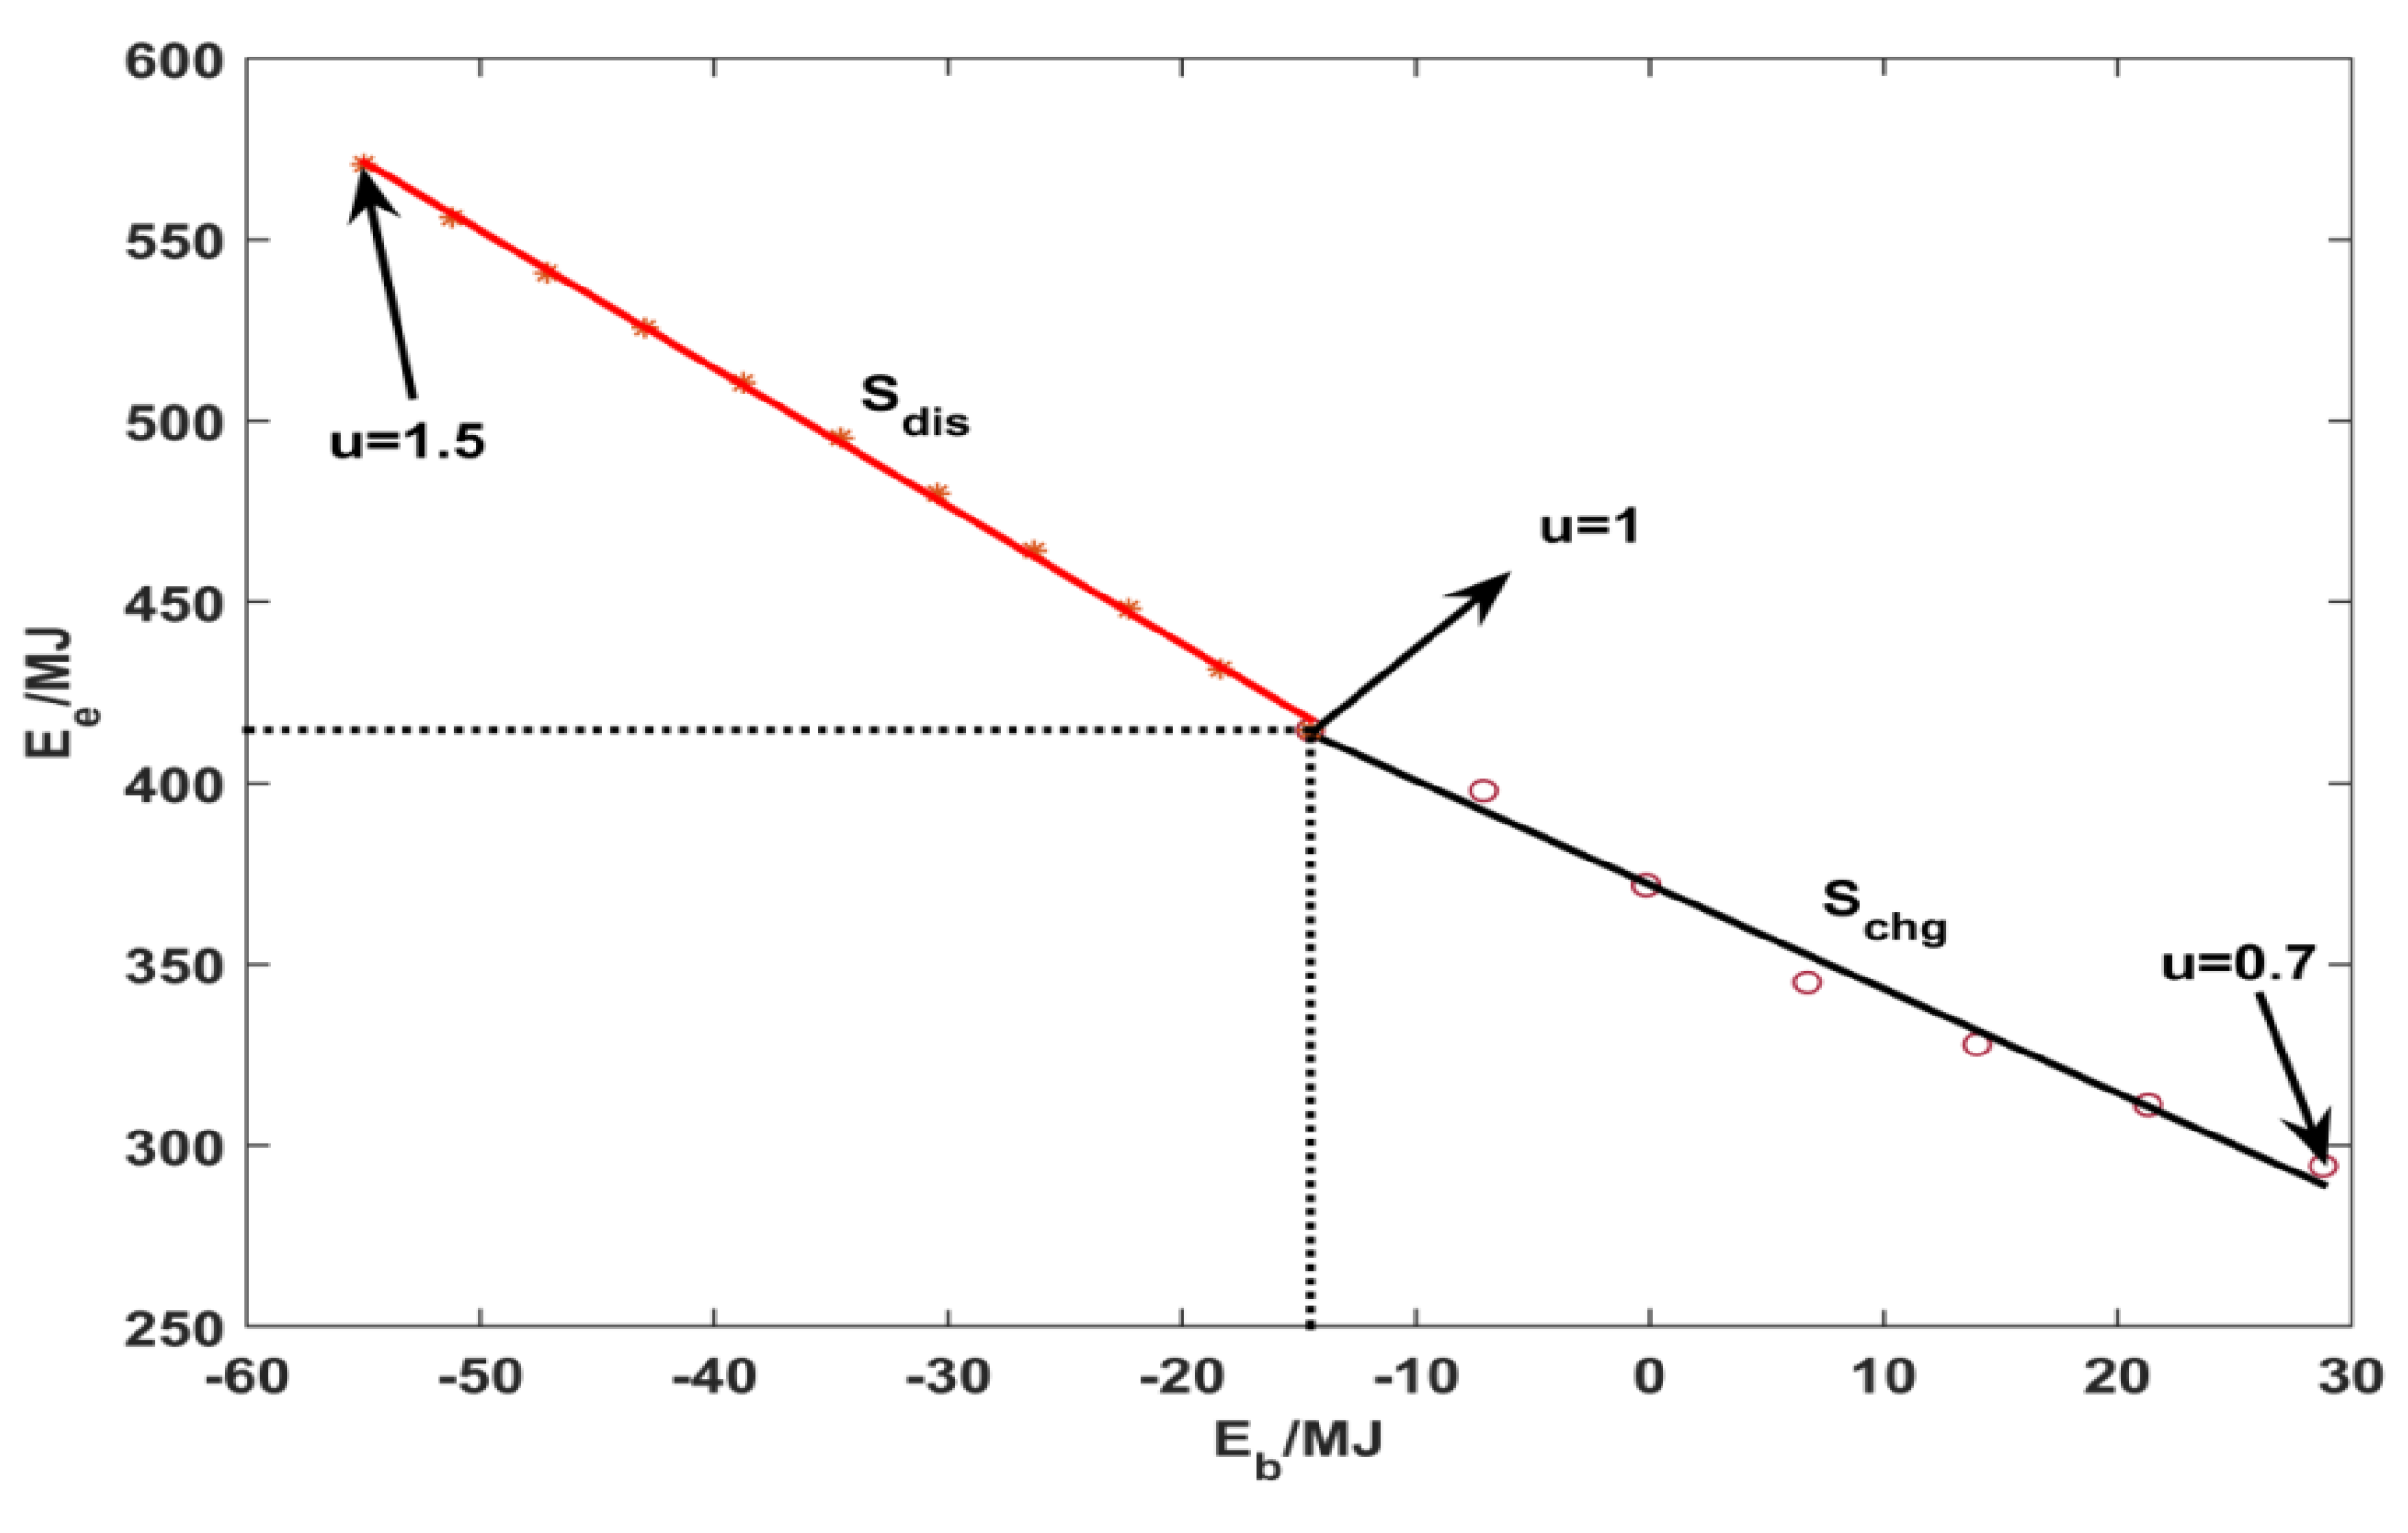
| average efficiency of the motor during driving | Sdis(t), Schg(t) 1 | the discharge and charge equivalent factors of the battery |
| Variable | Meaning (Units) | Variable | Meaning (Units) |
|---|---|---|---|
| aa | the acceleration after normalization (m/s2) | ωmmax | the maximum rotating speed of the motor (rpm) |
| aup | The upper limit of acceleration (m/s2) | Temin(ωe(t)) 1 | the minimum torque of the engine when the rotating speed is ωe(t)(Nm) |
| al | the lower limit of acceleration (m/s2) | Temax(ωe(t)) 1 | the maximum torque of the engine when the rotating speed is ωe(t)(Nm) |
| P(aa) | correction factor of the vehicle acceleration | Tmmin(ωm(t)) 1 | the minimum torque of the motor when the rotating speed is ωm(t)(Nm) |
| δ,γ | acceleration correction function coefficients | Tmmax(ωm(t)) 1 | the maximum torque of the motor when the rotating speed is ωm(t)(Nm) |
| P(SO,aa) | correction function with battery SOC and vehicle acceleration a as independent variables | SOCobj | the target value of the battery SOC |
| Pbr(t) 1 | regenerative braking energy (MJ) | 1 | the optimal torque distribution of the engine (Nm) |
| ωemin(t), ωemax(t) | the minimum and maximum rotating speed of the engine (rpm) | 1 | the optimal torque distribution of the motor (Nm) |
| Coefficient | ||||
| Values | 0.1577 | 0.015 | 1.38 | 1.035 |
| Parameters | Rule-Based | Conventional ECMS | Improved ECMS |
|---|---|---|---|
| Equivalent fuel consumption(L/100 km) | 8.6801 | 7.9472 | 7.7975 |
| Initial SOC | 0.5 | 0.5 | 0.5 |
| Final SOC | 0.6458 | 0.6535 | 0.6451 |
© 2019 by the authors. Licensee MDPI, Basel, Switzerland. This article is an open access article distributed under the terms and conditions of the Creative Commons Attribution (CC BY) license (http://creativecommons.org/licenses/by/4.0/).
Share and Cite
Liu, X.; Qin, D.; Wang, S. Minimum Energy Management Strategy of Equivalent Fuel Consumption of Hybrid Electric Vehicle Based on Improved Global Optimization Equivalent Factor. Energies 2019, 12, 2076. https://doi.org/10.3390/en12112076
Liu X, Qin D, Wang S. Minimum Energy Management Strategy of Equivalent Fuel Consumption of Hybrid Electric Vehicle Based on Improved Global Optimization Equivalent Factor. Energies. 2019; 12(11):2076. https://doi.org/10.3390/en12112076
Chicago/Turabian StyleLiu, Xixue, Datong Qin, and Shaoqian Wang. 2019. "Minimum Energy Management Strategy of Equivalent Fuel Consumption of Hybrid Electric Vehicle Based on Improved Global Optimization Equivalent Factor" Energies 12, no. 11: 2076. https://doi.org/10.3390/en12112076
APA StyleLiu, X., Qin, D., & Wang, S. (2019). Minimum Energy Management Strategy of Equivalent Fuel Consumption of Hybrid Electric Vehicle Based on Improved Global Optimization Equivalent Factor. Energies, 12(11), 2076. https://doi.org/10.3390/en12112076