Article

Characteristics of Soot and Radiation of Post Combustion Simulated Gas from a Gas Generator

School of Mechanical Engineering, Pusan National University, Busan 46241, Korea
*
Author to whom correspondence should be addressed.
Energies 2018, 11(7), 1731; https://doi.org/10.3390/en11071731
Submission received: 31 May 2018 / Revised: 28 June 2018 / Accepted: 29 June 2018 / Published: 2 July 2018
(This article belongs to the Section I: Energy Fundamentals and Conversion)

Abstract

:
It is necessary to install a specific burner system to burn out fuel-rich post combustion gas produced from a gas generator in a rocket engine when the performance of gas generator is separately evaluated in a test facility. Because of the fuel-rich reburning conditions, the burner still emits a significant amount of soot and produces thermal radiation. In this study, a laboratory-scale coflow diffusion burner was developed to examine the effects of fuel composition in combustion products on the soot emission and radiation behavior. The post combustion gas was simulated by adding carbon monoxide and carbon dioxide to two different base fuels: kerosene vapor and ethylene. The radiation flux sensor and laser extinction apparatus were used to measure the radiation intensity and soot emission, respectively, within a flame. The flame length and temperature were measured to examine the combustion behavior of each sooting flame having a strong radiation. Finally, the relationship between soot emission and radiation intensity was proposed based on all the experimental data.

1. Introduction

In Korea, a test facility was developed to separately evaluate the components of rocket engines, such as the turbopump, gas generator, and combustor. In some instances, this test, conducted around the facility, produces large amounts of combustion gas products, including soot. Accordingly, because of the soot emission, radiative heat is produced, creating environmental and safety issues for humans and buildings in the surrounding area. An example of the source of these soot and heat is the reburning system for combustion products from the gas generator, which is required for the separate testing of the gas generator. Because it is operated under fuel-rich conditions to maintain the exit temperature below 1000 °C, the flue gas may contain significant amounts of unburned fuel vapor, partially burned products, such as carbon monoxide (CO), hydrogen (H2), and carbon dioxide (CO2) [1,2]. Under an insufficient air supply condition, the reburning of these combustion products would still produce large amounts of soot. The soot is formed from aromatic soot precursors to soot aggregates by the complex process of surface growth, coagulation and agglomeration, and oxidation. Fuel types and fuel dilutions are known to change the size and morphology of soot. In an ethylene-based flame, such an effect of the fuel additive is well evaluated and documented in literature [3,4,5,6]. A strong soot suppressing effect was reported, particularly when using CO2 as the diluent [7,8]. In addition, the effect of different hydrocarbon components in kerosene fuel was evaluated on soot formation [9]. Previous studies have shown that soot levels in flames are proportional to aromatics concentrations in the fuel. However, it is not clear how each component diluted with pre-vaporized kerosene fuel in real combustion products of a gas generator would affect the soot emission and resultant radiation from the flame during the reburning process.
In general, a fire hazard or safety issue is closely related with flame radiation, which is mainly affected by soot emission [10,11]. The emission from soot is known to be the dominant source of radiation in the reburning system of post combustion gas. Thus, if there is no soot in a certain flame, the total radiation could be less. Some researchers found that the presence of soot in the combustion product of fuel rich mixture greatly affected the explosion behavior [12]. The higher initial temperature increases the explosion pressure significantly due to lesser soot emission and thus radiation heat loss as fuel-air mixture is at rich condition. This effect is more prevalent with methanol blended fuel because of suppression effect of the methanol on the soot formation. However, some studies showed that the presence of soot would not affect radiation [13,14]. This provides the incentive for measuring the radiation intensity and checking any dependence of the radiation on the soot emission in the reburning system fed with combustion products.
In this study, a burner system for reburning combustion products was developed to examine the effect of fuel composition on the soot formation and radiation mechanism. Several different flames diluted with combustion products, including kerosene vapor, CO, and CO2 were used during the reburning experiment. Finally, a primary mechanism governing flame radiation was identified through a further analysis of experimental data.

2. Experiment

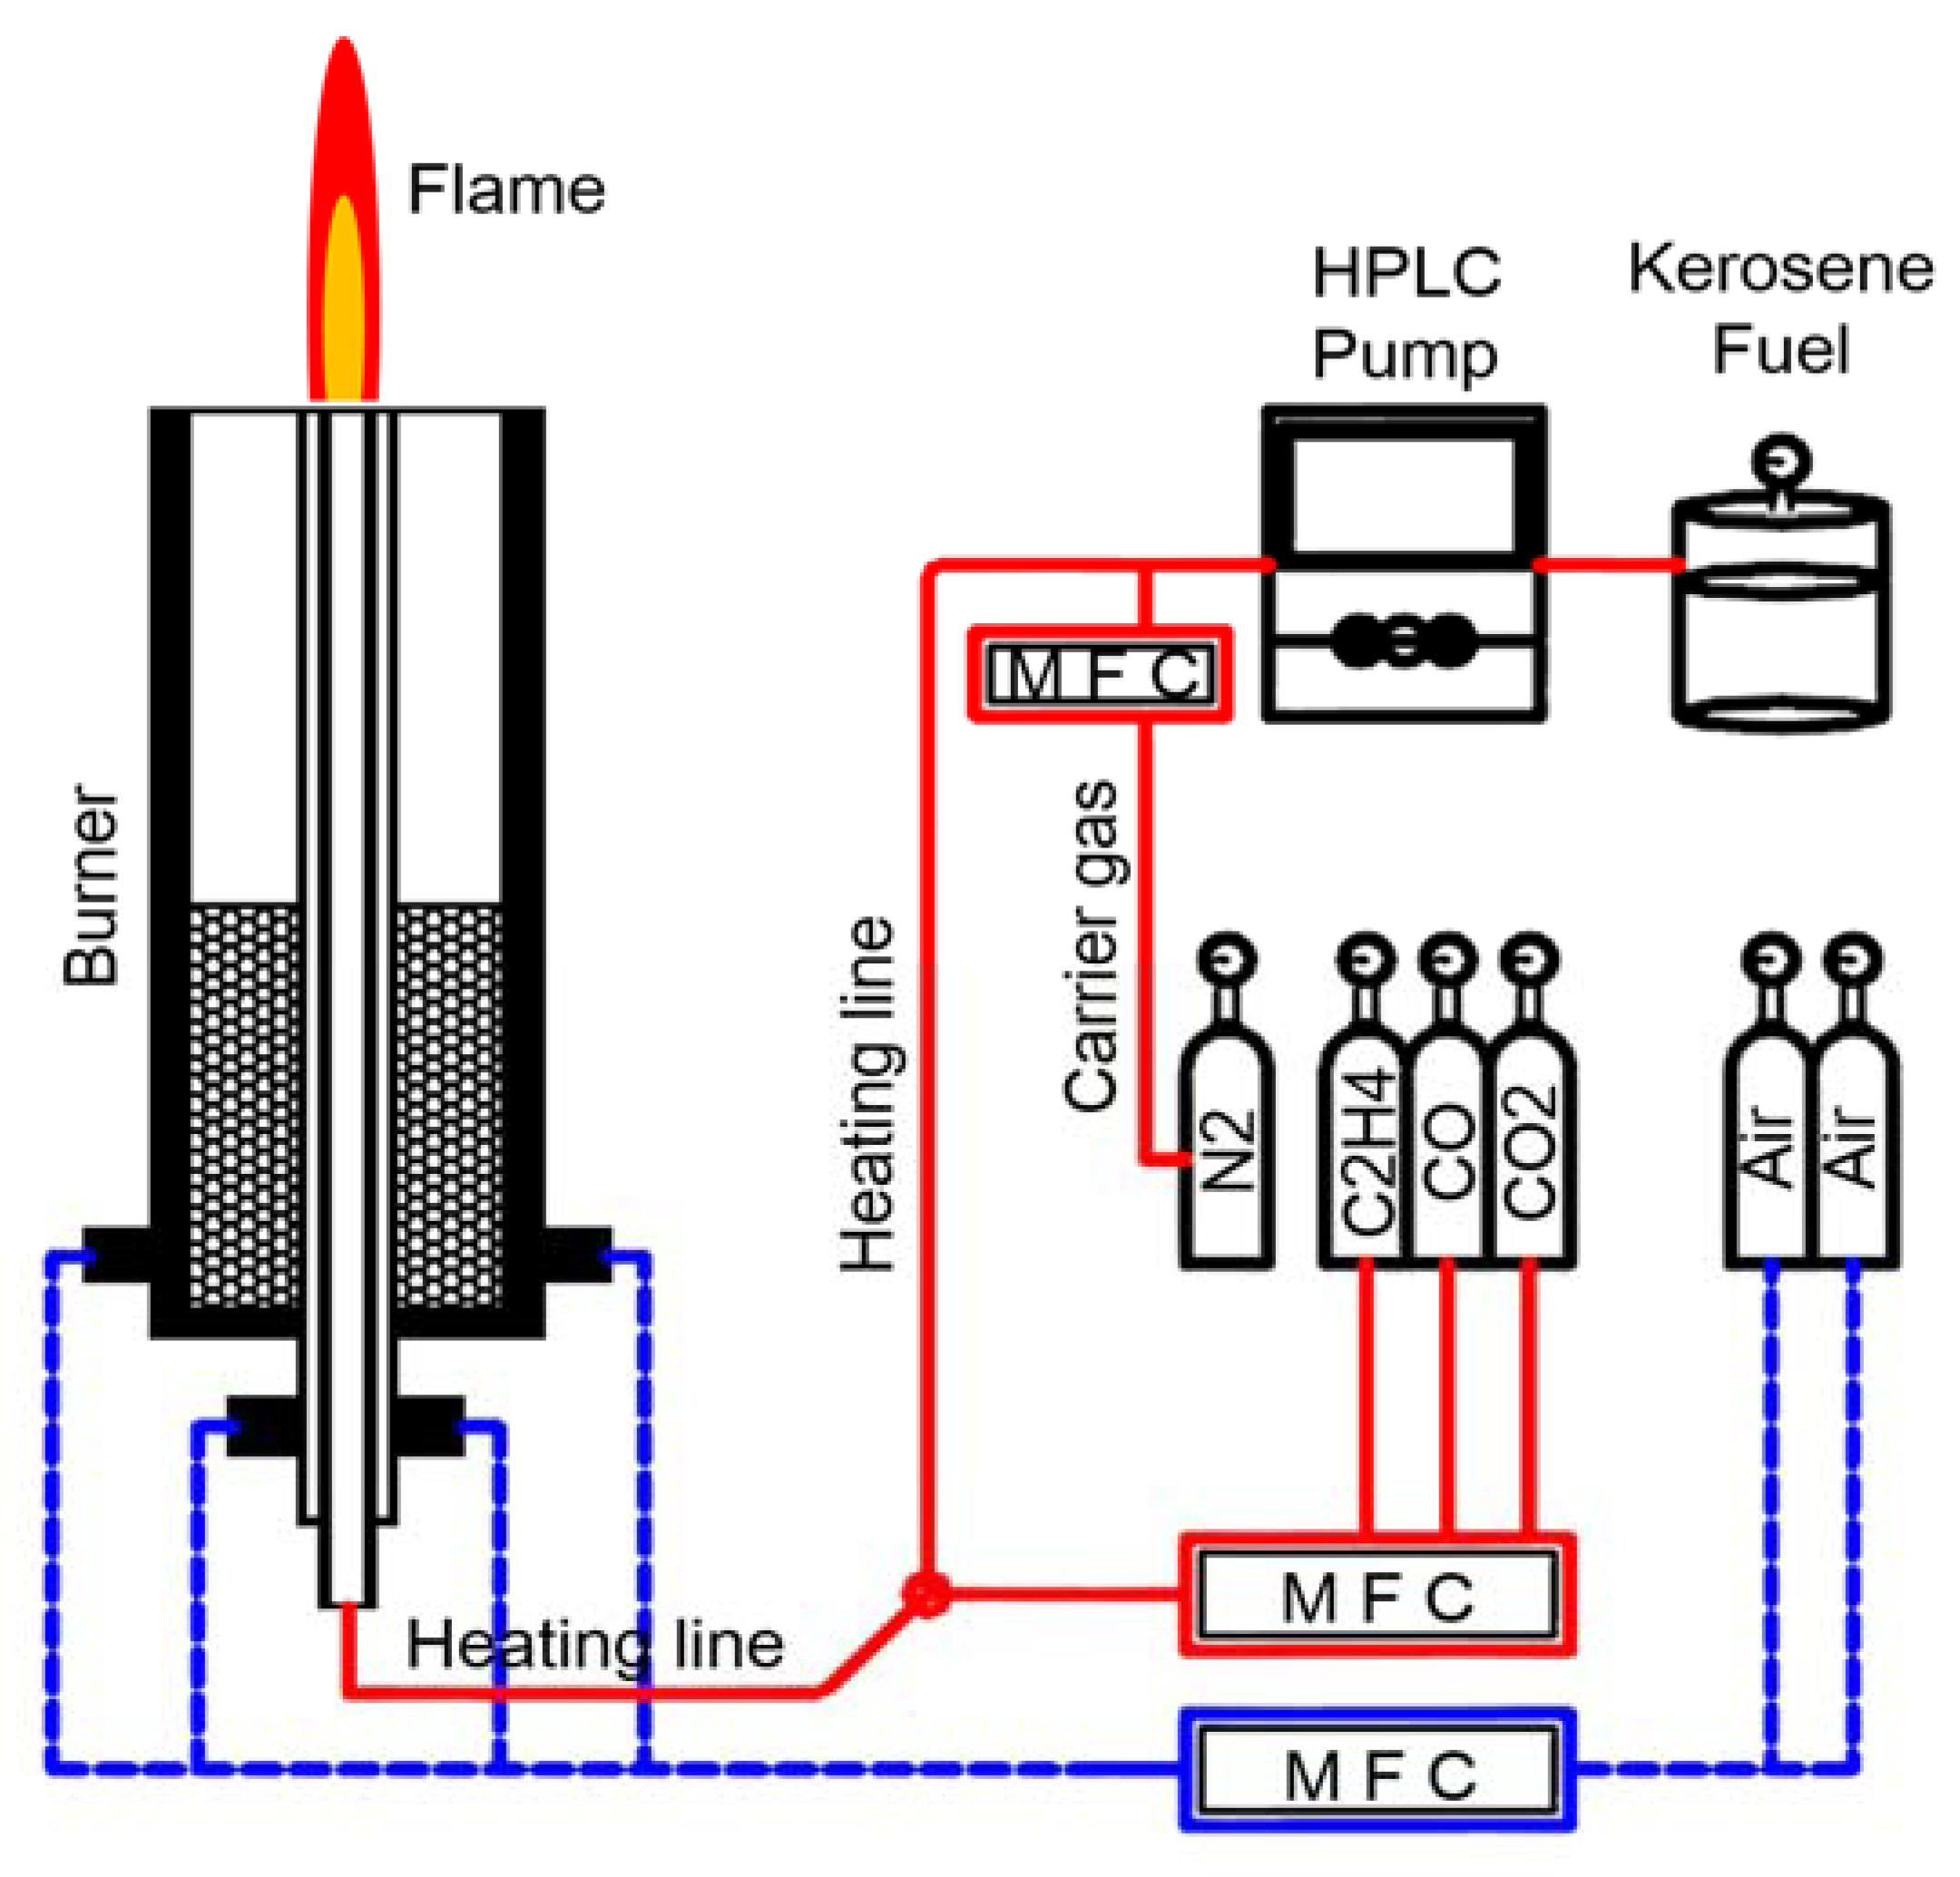
2.1. Reburning Burner and Vaporizer

In this study, a reburning burner system for combustion products was developed to examine the effect of fuel composition on the soot formation and radiation mechanism. Figure 1 presents a schematic of the coaxial diffusion burner and vaporizer apparatus used in this study. The burner was composed of three concentric tubes. The fuel was supplied through the innermost tube, whereas the primary and secondary air were respectively supplied through the second and third tubes. The inner diameter of innermost tube was 7 mm. The diameter of second and third tubes were 18 and 70 mm, respectively. In the latter tubes, 2-mm-diameter alumina beads were packed to a certain height to ensure a laminar flow condition. The flame was stabilized by adjusting the amount of primary and secondary air. The flow rates of gaseous fuel and air were controlled by the mass flow controller. The flow of kerosene in the liquid phase was controlled by liquid chromatography pump and was vaporized to the gas phase in the stainless-steel tube, which is wrapped with a heating tape. This was a similar liquid fuel vaporization technique to that used by several researchers [5,15,16]. The fuel analysis summarized in Table 1 indicates that the kerosene fuel contained 79% n-paraffins, 10% cyclo-paraffins, and 11% aromatics. This fuel is known as JP 10 and is practically used in gas generators operated in test facilities.

2.2. Burner Conditions

The post combustion gas was simulated by adding carbon monoxide and carbon dioxide to two different base fuels: kerosene vapor and gaseous ethylene. Ethylene was selected as the first base fuel because it produces a large amount of soot, as well as a stable flame condition free of blow-off behavior. In addition to this type of flame, flames diluted with a certain amount of CO and CO2 were compared in the coaxial reburning burner. The flow rate of each component, such as CO and CO2 were determined to provide the same heating value, whereas case 1 of the base fuel, listed in Table 1, was a condition where ethylene flowed at 182 cm3/min. This would result in the composition ratio of the combustion products summarized in Table 1. Among cases 1–3, case 3 contained 35% fuel, 35% CO, and 30% CO2, which was consistent with the theoretical composition of a fuel-rich combustion product estimated by Kim et al. [1]. The CO2 dilution was limited below 30% because a dilution over this amount could produce a blow-off condition for case 3.
For the additional experiment, kerosene vapor replaced ethylene as the base fuel. The flames were diluted with CO and CO2 in the same proportions as in the ethylene flame previously examined. These conditions correspond to cases 4–6 in Table 1. Among all the cases, case 6 of the flame diluted with three components (kerosene vapor, CO, and CO2) would simulate real fuel-rich combustion products to a high extent. The HPLC pump delivered a kerosene liquid at 0.5 cm3/min, which was an amount comparable to that of the gaseous ethylene fuel in the previous experiment. The heated line of the vaporizer from the pump to the burner entrance was maintained at 300 °C to prevent any condensation or cracking of the kerosene vapor. At the entrance of the vaporizer, the carrier gas (N2) was supplied at 200 cm3/min, together with the kerosene fuel. The flow rates of the primary and secondary air were fixed at 500 and 20,000 cm3/min, respectively.

2.3. Soot and Radiation Measurements

The laser extinction technique was used to measure the soot volume fraction at different heights of the flame above the burner. The same system was applied for different flames stabilized and diluted with fuel vapor, CO, and CO2. The soot emission measurement system consisted of a He-Ne laser with a wavelength of 532 nm and two photodiodes to monitor the incident and attenuated light signals [5]. Two bandpass filters were mounted in front of the two photodiodes. In principle, the incident light with a constant intensity (Io) is projected to a soot laden flame. The soot particles could absorb and scatter the incident light so that its intensity (I) is decreased. The ratio of the attenuated signal to the incident signal could represent the volume fraction of the soot present in the flame. For a proper measurement, the intensity of the incident light was adjusted to the optimal value.
A radiometer (Newport model 70,260) was used to measure the axial variation of radiation intensity along each of the different flames. It consisted of a probe and power display meter. Two convex optical lenses were used to detect the radiation intensity emitted at a spatial resolution of 5 mm within the flame. The lens of the fused silica and probe can transmit the radiation signals at wavelengths of 190 nm–6 μm. Both signal of laser and radiation intensity were acquired at the rate of 1 kHz and time averaged value over 60 s was used for experimental result. The experimental errors were analyzed and shown in the results of laser intensity and radiation intensity in next relevant figures. Figure 2 presents the schematic of the laser extinction measurement device for the soot emission and the radiometer device for the radiation intensity.
The temperature within each flame was measured by using the rapid insertion method. In a sooting flame, the effective diameter and emissivity are affected by the soot deposition on the thermocouple junction. Therefore, this effect would reduce temperature readings. To minimize this effect, a thermocouple was rapidly swept at the measuring location, which is a similar technique widely used in other works to measure the temperature in a sooting flame [17]. The temperature reading is further corrected by considering the radiation and convection cooling with the emissivity reported by Bradley et al. [18]. A fine wire R-type thermocouple was used with a 10 μm wire and junction diameter of 50 μm. The test was repeated five times to provide error bar of temperature measurement. The radial temperature variation was recorded at a fixed height of 40 mm, where an extensive amount of soot is formed as shown from the result of the soot volume fraction measurement. All signals from the laser photodiode, radiometer, and thermocouple were displayed and saved as digital values through the National Instruments (NI) data acquisition system. In particular, the temperature signal was acquired at a much faster sampling rate.
The flame structure and length were observed by a natural emission imaging method with a high-resolution camera. The flame length was assumed to be vertical distance between burner exit and visible yellow flame tip. The soot samples were collected from a 40 mm height after the burner on the transmission electron microscopy (TEM) grid (used for TEM imaging) and quartz wire for elemental analysis. The elemental analyzer (EA1110-Fisons, Thermo Scientific, Waltham, MA, USA) was used to analyze samples from the quartz wire. The morphology and microstructure of soot samples on TEM grids were examined with Scanning Transmission Electron Microscope (STEM) at different magnifications ranging from 7000 to 390,000.

3. Results and Discussion

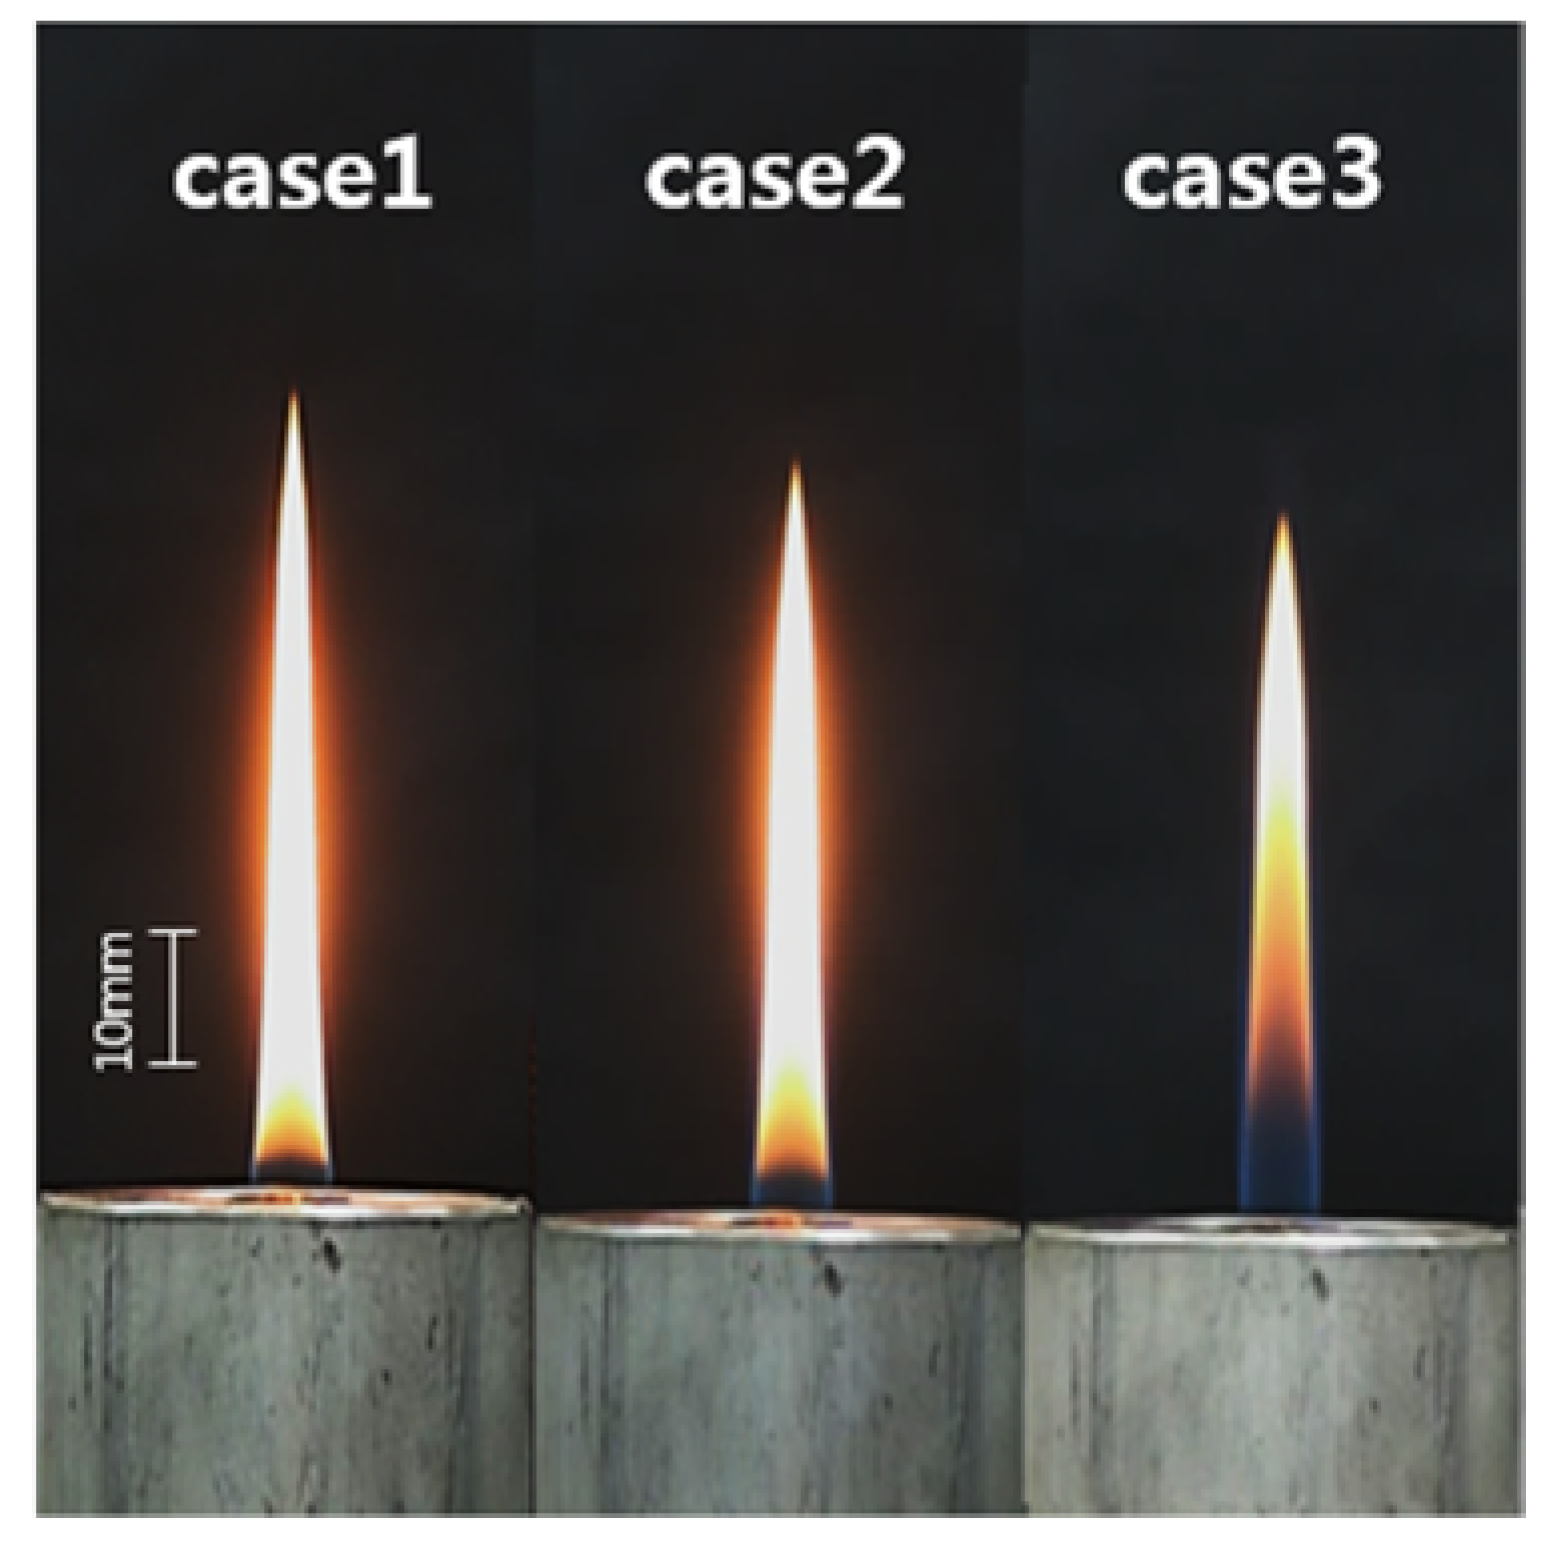
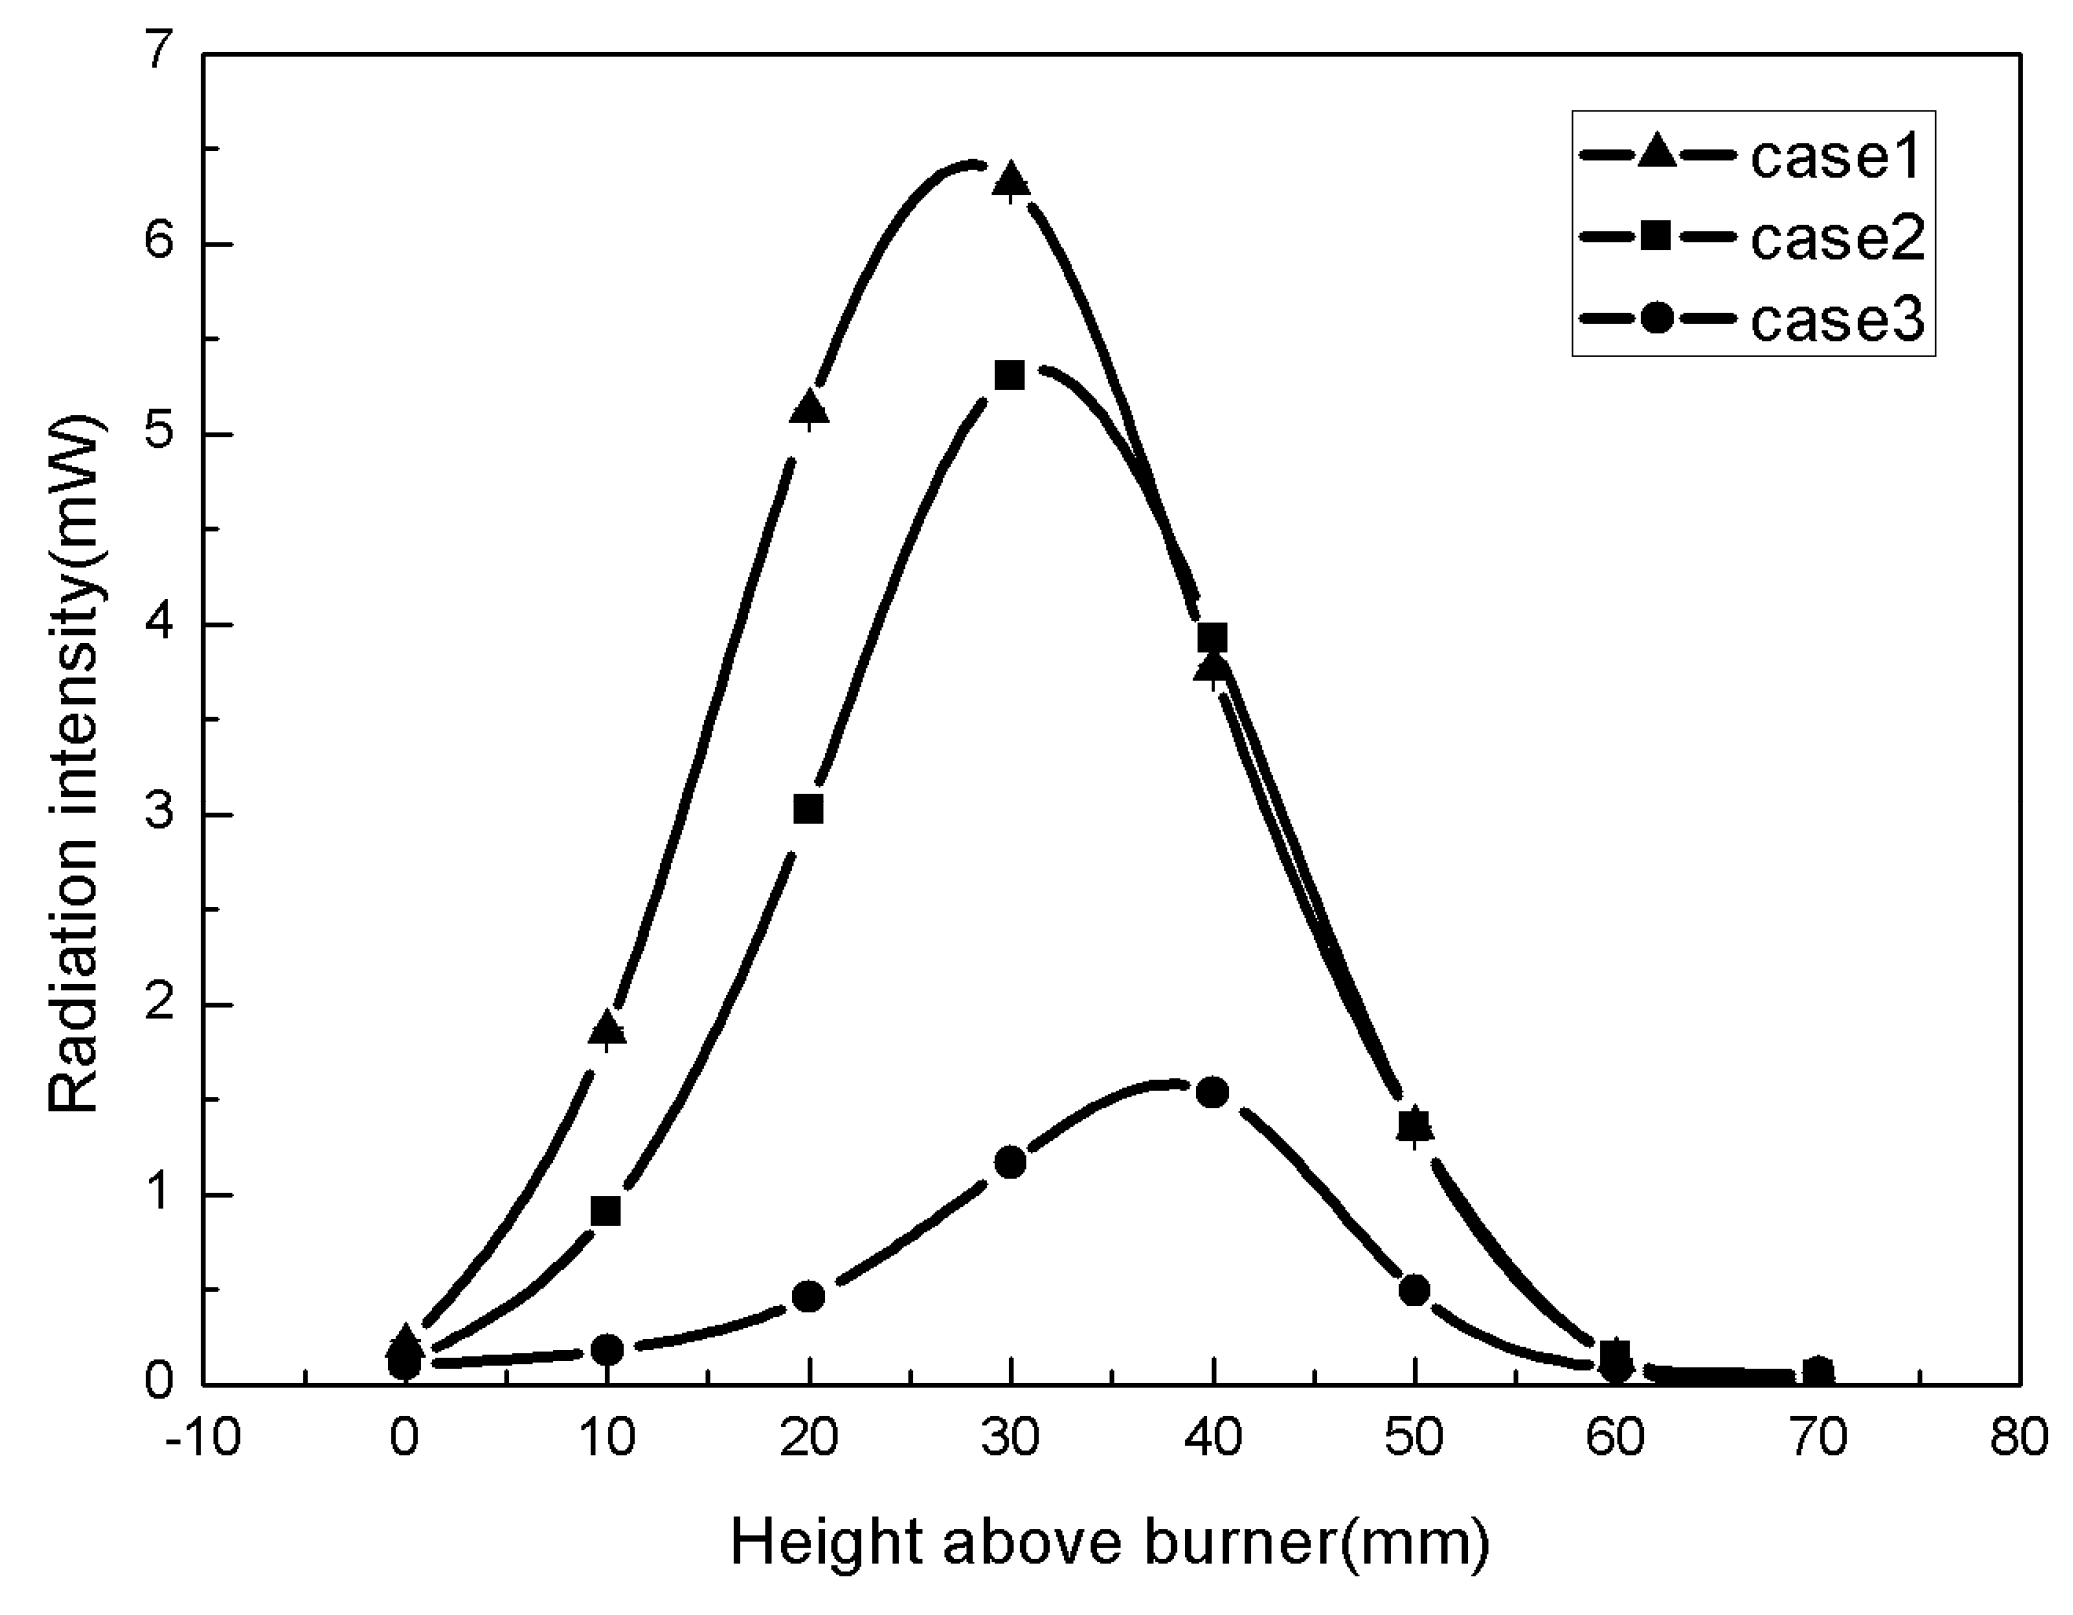
3.1. Combustion Behavior of Post Combustion Simulated Gas Including Gaseous Ethylene Fuel

Ethylene was selected as the first base fuel because it produces a large amount of soot, as well as a stable flame condition free of blow-off behavior. In addition to this flame, flames diluted with a certain amount of CO and CO2 were compared in the coaxial reburning burner. Figure 3 presents flame patterns of post combustion simulated gases, including ethylene, which are observed by the natural emission imaging method. As CO was added to ethylene, the flame length was decreased from 60 to 55 mm. Further reduction of the flame length to 52 mm was observed in flames diluted with CO and CO2 (case 3). The flames were observed to widen or radially spread as CO and CO2 are added. For example, the flame width in cases 2 and 3 was 4 mm, which was 1.15 times wider than that in case 1 (3.5 mm). This behavior was consistent with the flame-spreading behavior in the fuel with CO2 addition, which was observed by Lee et al. [19]. The non-luminous region (blue color) also increased as CO and CO2 were added.
Figure 4 shows a variation of the measured flame temperature with radial distance for the three cases. The error level for three cases was found to be statistically insignificant. The temperature measurement was made at height of 40 mm where the highest amount of soot was produced. Case 1 of the ethylene flame exhibited the lowest temperature of 1240 °C at the center, whereas the peak temperature was observed at the flame front. This profile was similar that was observed in the ethylene flame in Koylu’s experiment [12]. Compared with case 1, CO addition in case 2 increased the flame temperature up to 1450 °C at increments of 200 °C. This was because of the thermal effect of CO addition, which was demonstrated by Law and his coworkers [3]. Carbon dioxide addition in case 3 reduced flame temperature back to 1280 °C at the center of the flame, and further decreased to a lesser magnitude at the peak location. Similar temperature reductions with N2 and CO2 dilution have been reported by Shin et al. [20] and Lee et al. [21]. The radial position where the peak temperature was observed, also shifted outward, which is supported by the radial spreading of the flame front observed in flames with CO2 dilution. A similar increase in the flame width and a decrease in the visible flame height were observed with N2 addition in Gülder’s experiment [5]. The maximum gas temperature locations also shifted to larger radial distances than the former ones because of the dilution [22].
Figure 5 displays the normalized laser intensity related to soot volume fractions on the centerline of three different flames. The results show that CO addition by 50% decreased peak soot emission by half from 0.224 to 0.122. This indicates the dominance of the dilution effect of CO addition, which was consistent with the linear reduction of the soot level with CO fraction in the fuel observed by Law et al. [3]. Specifically, the 50% soot reduction with CO addition by 50% observed in this study was similar to their findings. They found that the reduction in the soot inception limit with CO addition in the ethylene flame was largely due to the fuel dilution. Further addition of CO2 to case 2 decremented soot emission down to 0.025. In case 3, thermal and chemical effects may contribute to the largest reduction in the soot emission in addition to the pure dilution effect [4]. The presence of CO2 in the flame would decrease flame temperature by thermal effect and influence radical pools such as OH and H atoms by chemical effect, both of which could significantly suppress soot formation and growth. In all three cases, the peak soot emission was observed at a height of 40 mm. Figure 6 presents the radiation heat intensity along the centerline of the three different flames. Both CO and CO2 addition decreased radiation intensity probably because of the lesser soot presence in the corresponding flames. The relationship between the radiation intensity and soot emission is discussed in detail in the next section.

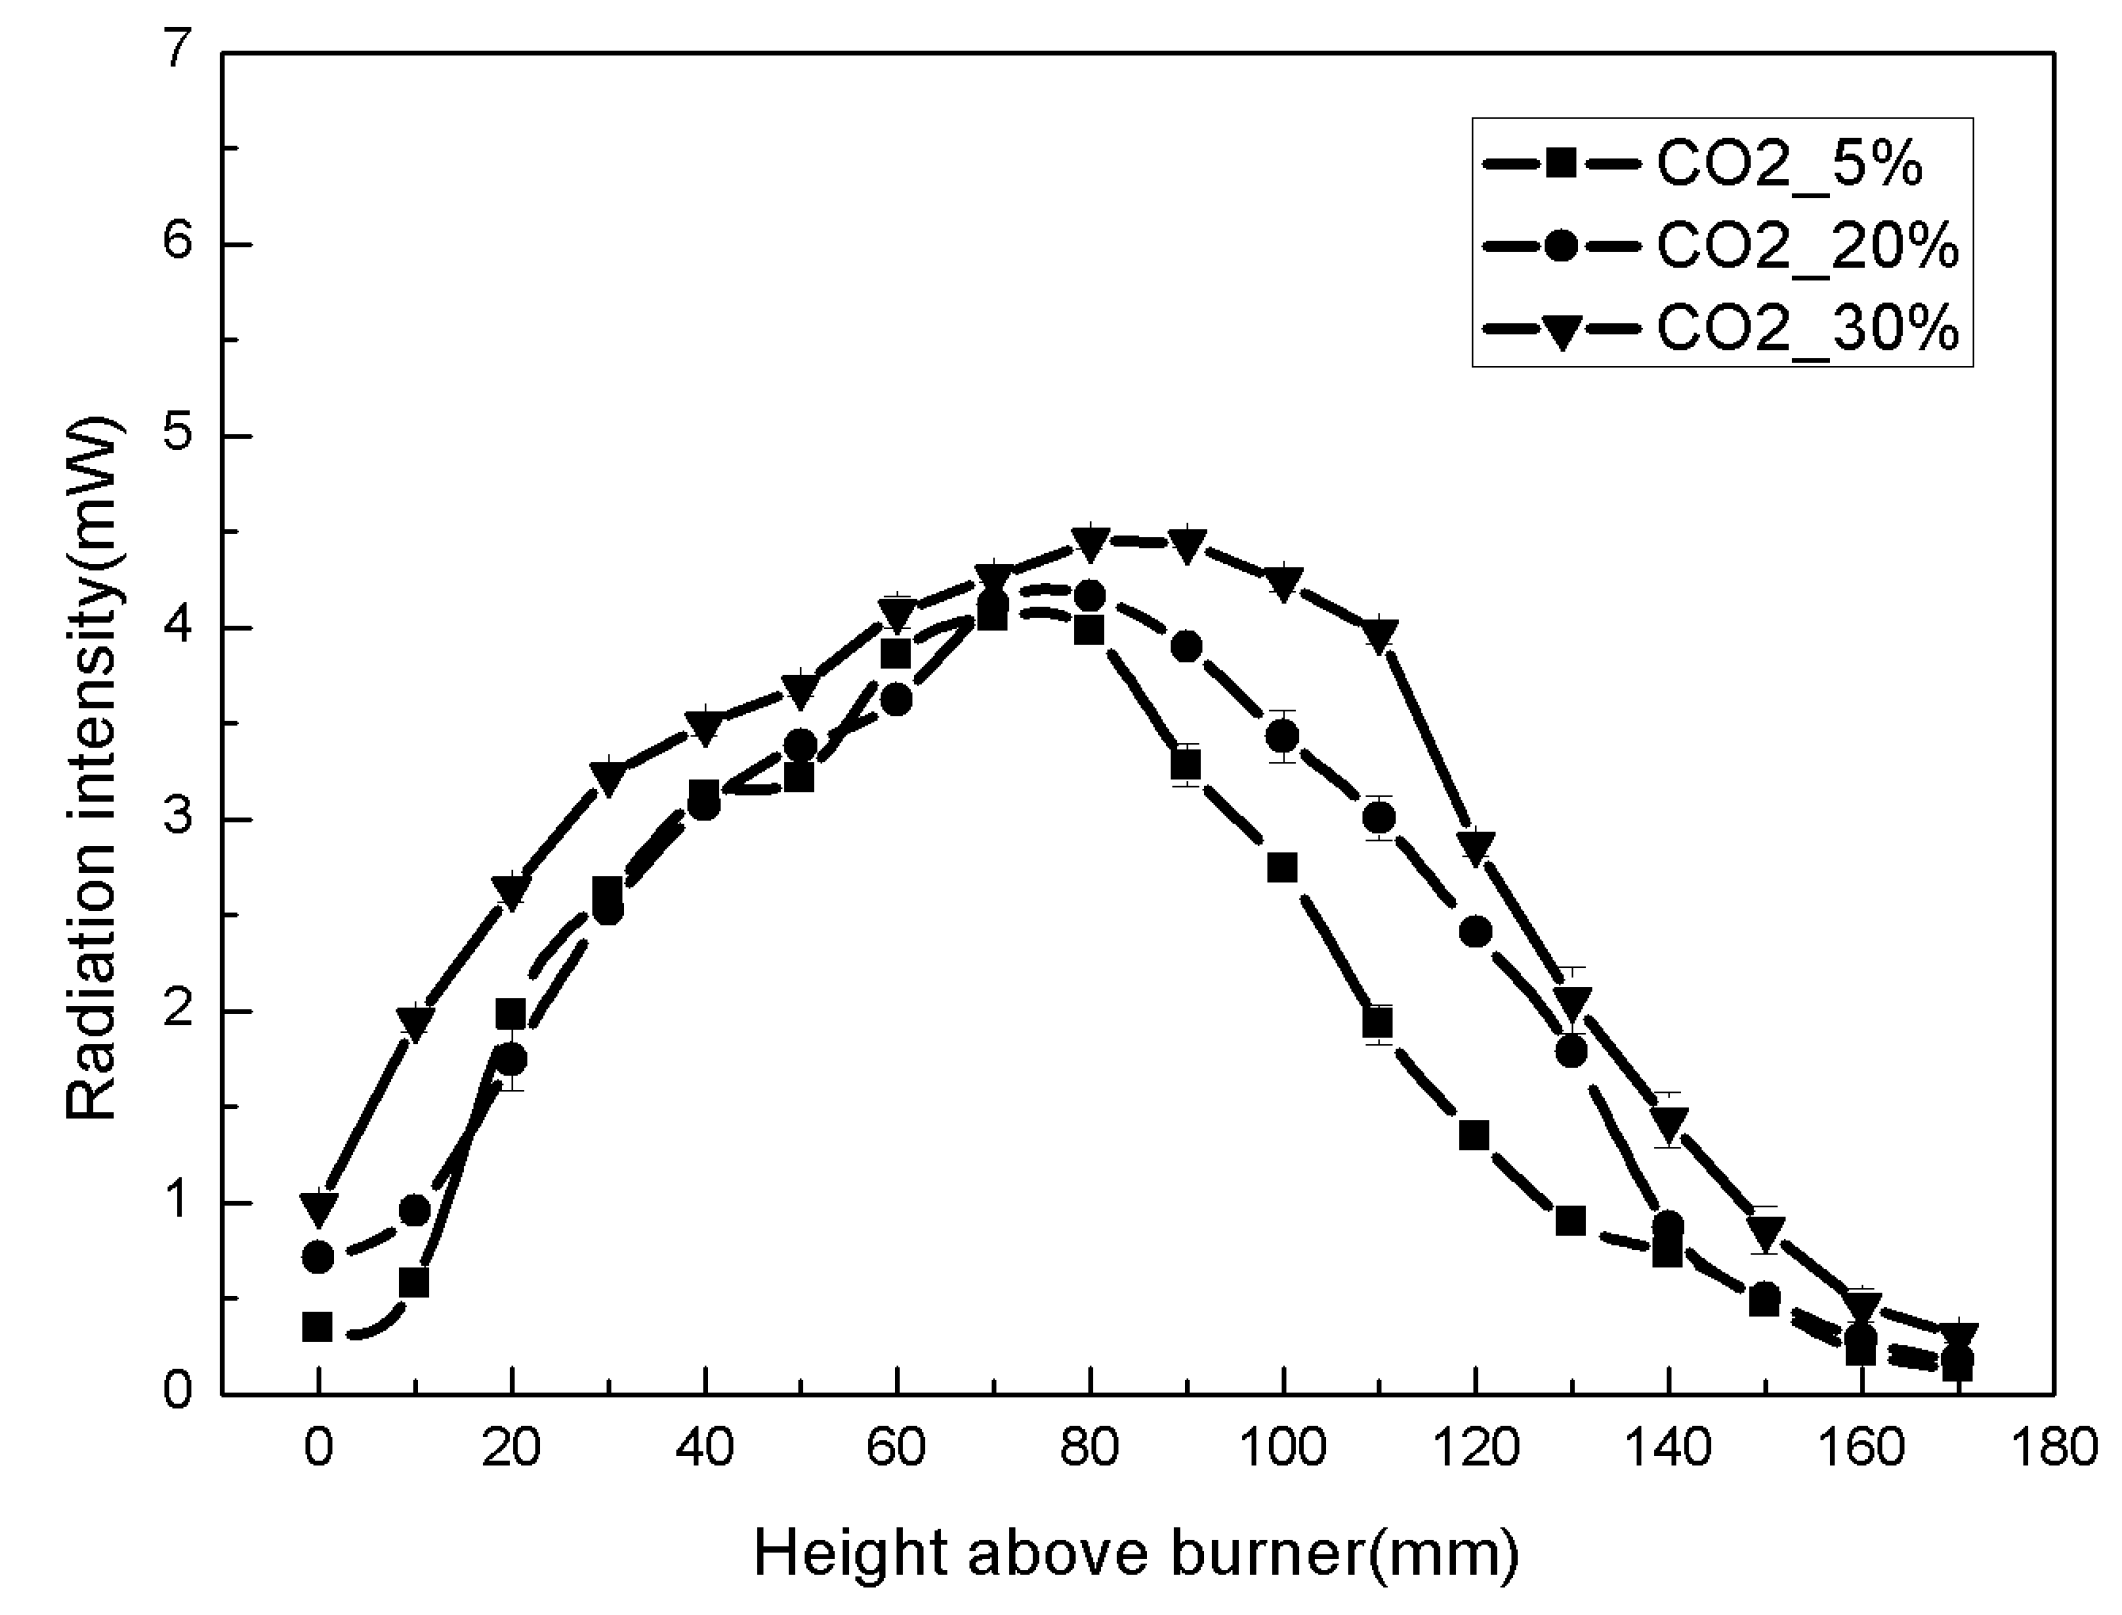
3.2. Combustion Behavior of Post Combustion Simulated Gas Including Liquid Kerosene Fuel

In the second test, kerosene vapor replaced ethylene as the base fuel. The dilutions with CO and CO2 were in the same proportions as those in the ethylene-based fuel. Figure 7 shows the comparison of flame patterns of post combustion simulated gases, including the kerosene vapor with different dilutions, specifically, in cases 4–6. The flame length was observed to increase from 80 to 160 mm when both CO and CO2 were added (case 6). While a comparable flame length was obtained between cases 4 and 5, the flame in case 6 shows a length twice as long as that in case 4. This indicates that CO2 addition strongly affected the flame structure than CO does. It is notable to mention that a broken wing tip was observed in each of the flames where soot is greatly emitted. Figure 8 shows the variation of the measured flame temperature with radial distance for the three cases. The use of kerosene in case 1 (case 4) lowered the temperature from case 1 of ethylene fuel by more than 300 °C. Although peak temperatures are similar at certain radial distances, CO2 addition appeared to significantly reduce the temperature at the center as compared to that in case 4. The radial position, where the peak temperature is observed, was shifted outward. This was similar to the flame spreading effect of CO2 addition to the ethylene fuel [17].
Figure 9 displays normalized laser intensity related to soot volume fractions on the centerline of three different flames of post combustion gases, including kerosene vapor with different dilutions, specifically, cases 4–6. Experimental error of laser intensity is a little high as compared to gaseous fuel cases, indicating possible fluctuation of flame with liquid fuel. Under the combustion of the post gas, including kerosene vapor, CO addition by 50% decreased the peak soot emission by less than 20%, which was a negligible effect when compared with the ethylene-based fuel case. The CO2 addition in case 6 initially produced a low soot emission of up to 80 mm. However, thereafter, the addition suddenly caused the emission of a substantial amount of soot. The final soot emission was 1.5 times higher than that in the kerosene flame (case 4). This indicates a delayed soot formation, where the soot gradually accumulated as CO2 was added with the kerosene vapor. This CO2 effect observed in case 6 was remarkably different from the previous effect observed under the ethylene-based fuel condition (case 3). When CO2 was added to the kerosene vapor in the middle of heated fuel delivery line, the amount of vaporized fuel would increase because of the lower temperature required for the kerosene vaporization with CO2 dilution. This enhanced vaporization led to a shift to a fuel-rich condition (under-ventilated) and momentum-controlled diffusion flame condition [23]. As a result, this could produce a higher soot presence and larger flame length. On the other hand, there would be another mechanism associated with CO2 effect observed in the case 6. In this case, kerosene may not be completely vaporized as CO2 is introduced in the middle of heating line. This could produce some amounts of liquid droplets in the fuel vapor which may alter flame structure and thus soot emission. Because of two contrary mechanisms on the degree of vaporization with CO2 addition, more adequate test is needed to provide supporting data on this controversial issue.
The TEM images in Figure 10 compare soot samples between the kerosene and CO2-diluted kerosene flames at two different magnifications. These images were obtained at the same height of 40 mm after the burner. This observation supported the aforementioned delayed soot growth with CO2 dilution, where the degree of aggregation was smaller than that of the pure kerosene flame. This behavior was similar to the soot growth behavior with ethanol addition, as reported in the work of D’Anna et al. [24]. They found that ethanol could diminish not only the surface growth but also the aromatization process of soot formation. A greater reduction in the population of aggregates was observed with N2 dilution in the inverse ethylene diffusion flame [20]. They attributed this behavior to the lower fuel concentration as N2 was diluted. The result of the composition analysis of the three soot samples collected at a 40-mm height above the burner is summarized in Table 2. A similar value of the H/C ratio was observed in all samples. This indicates the comparable aromatization of all tested samples, which is consistent with the structural similarity observed in the high resolution TEM images (not shown here).
Figure 11 presents the radiation intensity along the centerline of three different flames. It can be observed that CO addition had a negligible influence on the radiation intensity. On the other hand, CO2 addition had a different impact on the radiation intensity. There was no radiation above 80 mm in the kerosene and CO-diluted kerosene flames. However, strong radiations occurred from 80 to 160 mm with a slight loss in the peak intensity of CO2-diluted kerosene flame. This behavior is as expected because of the increase in the luminous flame region in the natural emission image in Figure 7 and the higher soot presence in Figure 9. A similar increase in radiative heat fluxes was observed in flames with large dimensions [25]. The flame dimension was varied by the fuel flow rate and Reynolds number because of the reduced effect of buoyancy. Overall, based on the integration of the radiation curve, CO2 addition to the kerosene vapor could significantly increase the total radiation, which is discussed in more detail in the next section. This has a valuable industrial implication considering that the decreased percentage of CO2 in the kerosene vapor of combustion products could prevent fire accidents as a result of the reduced radiation around the gas generator test facility.

3.3. Relationship between Radiation Intensity and Soot Emission

This section discusses the amount of soot emission that contributes to radiation intensity. In this final test, CO2 gas was varied at 5, 10, 20, and 30% in addition to the CO-diluted kerosene flame to change the soot emission and radiation intensity. This test was separately designed to confirm the findings of CO2 addition to the kerosene vapor as observed in the previous section. Figure 12 shows the effect of CO2 addition on radiation intensity. The increase of CO2 in the fuel clearly tended to proportionally increase radiation, which correlates well with the increase in soot emission. This correlation between soot and radiation was typically expected, but was not observed in the experiments of some researchers [8,9]. Figure 13 presents the relationship between the radiation intensity and soot emission over all previous data measured from kerosene vapor and ethylene-based flames. The raw data of the radiation curve was integrated to obtain the total radiation intensity. This integrated intensity was found to be more appropriate for the correlation with soot emission than with peak intensity. The raw data of the measured peak soot emission was used for the correlation, and a linear relationship was observed for the curve fit over the data. This indicates that the soot surface emission contributes to radiation more strongly compared to gaseous emissions such as CO2 and H2O. A numerical or experimental study on the relation between soot emission and radiation were extensively performed for flames with gaseous fuels [26]. However, we tried here to extend this relationship to the liquid fuel (kerosene) flame condition. The result still showed a linear relation between them, which is quite instructive for fire hazard and explosion application.

4. Conclusions

In this study, the presence of the fuel vapor, partially burned products, and inert gas in post combustion gas was simulated by adding carbon monoxide and carbon dioxide to two different base fuels: kerosene vapor and ethylene. The effect of such combustion products on the soot formation and radiation was presented in the reburning burner. The soot formation and radiation are two important parameters closely related to the environmental and fire hazards around the test facility of the gas generator.
The results show that when the post combustion simulated gas, including gaseous ethylene fuel, is combusted, a flame length was decreased with CO and CO2 addition. Moreover, the flame temperature increased with CO and decreased with CO2 addition. As CO and CO2 were added, the radiation intensity was significantly decreased, accompanied by the drastic reduction in the soot emission. Under the combustion of the post combustion gas, including liquid kerosene, CO2 addition produced larger flame lengths and higher soot emissions. This was remarkably different from soot suppressive effect of CO2 typically observed with gaseous fuel (ethylene) in other studies and in this study. This may be attributed to the shift to a fuel-rich condition (under-ventilated) because of the lower temperature required for the kerosene vaporization with CO2 dilution. Because of the high soot emission, CO2 addition could significantly increase the total radiation, and it becomes a potential source of fire hazard. Finally, a linear relationship between the soot emission and radiation intensity was observed in all experimental data, which indicates that the surface emission from soot is more responsible for radiation than from CO2 and H2O vapor gaseous emissions. This relationship also supports the explosion behavior of various fuel blends occurring at higher equivalence ratio, which is controlled by soot emission and radiation loss.

Author Contributions

Experiment and formal analysis, H.K.; Writing-Review & Editing, J.S.

Funding

This research received no external funding.

Acknowledgments

The authors thank the Korean Government (MEST) for the financial support through the National Research Foundation of Korea (NRF) grant (NRF-2017R1D1A1B03029138). This work was also supported by the Human Resources Development program (No. 20184030202060) of the Korea Institute of Energy Technology Evaluation and Planning (KETEP) grant funded by the Korea government Ministry of Trade, Industry and Energy.

Conflicts of Interest

The authors declare no conflicts of interest.

References

  1. Kim, S.K.; Choi, H.S.; Kim, Y.M. Thermodynamic modeling based on a generalized cubic equation of state for kerosene/Lox rocket combustion. Combust. Flame 2012, 159, 1351–1365. [Google Scholar] [CrossRef]
  2. Kim, C.H.; Lee, G.J.; Yoo, B.I.; Kim, S.R.; Hwang, C.H.; Han, Y.M. Combustion test result of after-burner facility for gas generator. In Proceedings of the KSAS Fall Conference, Jeju, Korea, 19–22 August 2015; pp. 1117–1120. [Google Scholar]
  3. Du, D.X.; Axelbaum, R.L.; Law, C.K. Soot formation in strained diffusion flames with gaseous additives. Combust. Flame 1995, 102, 11–20. [Google Scholar] [CrossRef]
  4. Du, D.X.; Axelbaum, R.L.; Law, C.K. The influence of carbon dioxide and oxygen as additives on soot formation in diffusion flames. Symp. Int. Combus. 1990, 23, 1501–1507. [Google Scholar] [CrossRef]
  5. Gülder, O.L.; Snelling, D.R. Influence of nitrogen dilution and flame temperature on soot formation in diffusion flames. Combust. Flame 1993, 92, 115–124. [Google Scholar] [CrossRef]
  6. Liu, F.; Guo, H.S.; Smallwood, G.J.; Gülder, O.L. The chemical effects of carbon dioxide as an additive in an ethylene diffusion flame: Implications for soot and NOx formation. Combust. Flame 2001, 125, 778–787. [Google Scholar] [CrossRef]
  7. Kailasanathan, R.K.A.; Yelverton, T.L.B.; Fang, T.; Roberts, W.L. Effect of diluents on soot precursor formation and temperature in ethylene laminar diffusion flames. Combust. Flame 2013, 160, 656–670. [Google Scholar] [CrossRef]
  8. McLintock, I.S. The effect of various diluents on soot production in laminar ethylene diffusion flames. Combust. Flame 1968, 12, 217–225. [Google Scholar] [CrossRef]
  9. Saffaripour, M.; Zabeti, P.; Kholghy, M.; Thomson, M.J. An experimental comparison of the sooting behavior of synthetic jet fuels. Energy Fuels 2011, 25, 5584–5593. [Google Scholar] [CrossRef]
  10. Gore, J.P.; Faeth, G.M. Structure and special radiation properties of turbulent ethylene/air diffusion flames. Symp. Int. Combus 1986, 21, 1521–1531. [Google Scholar] [CrossRef]
  11. Grosshandler, W.L.; Sawyer, R.F. Radiation from a methanol furnace. J. Heat Transf. 1978, 100, 247–252. [Google Scholar] [CrossRef]
  12. Grabarczyk, M.; Teodorczyk, A.; di Sarli, V.; di Benedetto, A. Effect of initial temperature on the explosion pressure of various liquid fuels and their blends. J. Loss Prev. Process Ind. 2016, 44, 775–779. [Google Scholar] [CrossRef]
  13. Caetano, N.R. Influence of the fuel dilution with combustion products on the energy use. In Proceedings of the Aerospace Technology Congress, Solna, Sweden, 11–12 October 2016. [Google Scholar]
  14. Xie, Y.L.; Wang, J.H.; Zhang, M.; Gong, J.; Jin, W.; Huang, Z.H. Experimental and numerical study on laminar flame characteristics of methane oxy-fuel mixtures highly diluted with CO2. Energy Fuels 2013, 27, 6231–6237. [Google Scholar] [CrossRef]
  15. Zhang, Y.; Boehman, A.L. Oxidation behavior of soot generated from the combustion of methyl 2-butenoate in a co-flow diffusion flame. Combust. Flame 2013, 160, 112–119. [Google Scholar] [CrossRef]
  16. Young, K.J.; Stewart, C.D.; Moss, J.B. Soot formation in turbulent nonpremixed kerosene-air flame burning at elevated pressure: Experimental measurement. Symp. Int. Combus. 1994, 25, 609–617. [Google Scholar] [CrossRef]
  17. McEnally, C.S.; Koylu, U.O.; Pfefferle, L.D.; Rosner, D.E. Soot volume fraction and temperature measurements in laminar nonpremixed flames using thermocouples. Combust. Flame 1997, 109, 701–720. [Google Scholar] [CrossRef]
  18. Bradley, D.; Entwistle, A.G. Determination of the emissivity, for total radiation, of small diameter platinum-10% rhodium wires in the temperature range 600–1450 °C. Br. J. Appl. Phys. 1961, 12, 708–711. [Google Scholar] [CrossRef]
  19. Hwang, C.H.; Oh, C.B.; Lee, C.E. Effects of CO2 dilution on the interactions of a CH4—Air nonpremixed jet flame with a single vortex. Int. J. Therm. Sci. 2009, 48, 1423–1431. [Google Scholar] [CrossRef]
  20. Lee, E.J.; Oh, K.C.; Shin, H.D. Soot formation in inverse diffusion flames of diluted ethane. Fuel 2004, 34, 1–8. [Google Scholar]
  21. Ji, J.H.; Lee, E.J. The effects of carbon dioxide as additives on soot formation in jet diffusion flames. J. Korean Inst. Fire Sci. Eng. 2010, 24, 170–175. [Google Scholar]
  22. Boedeker, L.; Dobbs, G.M. Cars temperature measurements in sooting, laminar diffusion flames. J. Combust. Sci. Technol. 1986, 46, 301–323. [Google Scholar] [CrossRef]
  23. Annamalai, K.; Puri, I.K. Combustion Science and Engineering; CRC Press: New York, NY, USA, 2007. [Google Scholar]
  24. Sirignano, M.; Ciajolo, A.; D’Anna, A.; Russo, C. Chemical features of particles generated in an ethylene/ethanol premixed flame. Energy Fuels 2017, 31, 2370–2377. [Google Scholar] [CrossRef]
  25. Jeng, S.M.; Faeth, G.M. Radiative heat fluxes near turbulent buoyant methane diffusion flames. J. Heat Transf. 1984, 106, 886–888. [Google Scholar] [CrossRef]
  26. International Sooting Flame Workshop. Baseline Radiation Model. Available online: https://www.adelaide.edu.au/cet/isfworkshop/docs/isf-baseline-radiation-model.pdf (accessed on 28 June 2018).
Figure 1. Schematic of coflow burner and vaporizer apparatus.
Energies 11 01731 g001
Figure 2. Schematic of laser extinction measurement and radiometer device.
Energies 11 01731 g002
Figure 3. Flame patterns of post combustion simulated gases, including ethylene with different dilutions observed by the natural emission imaging method.
Energies 11 01731 g003
Figure 4. Variation of measured flame temperature with radial distance for three flames.
Energies 11 01731 g004
Figure 5. Axial variation of soot volume fractions at the centerline of three different flames.
Energies 11 01731 g005
Figure 6. Radiation intensity at the centerline of three different flames.
Energies 11 01731 g006
Figure 7. Flame patterns of post combustion simulated gases, including kerosene vapor with different dilutions observed by natural emission imaging method.
Energies 11 01731 g007
Figure 8. Variation of measured flame temperature with radial distance for three flames.
Energies 11 01731 g008
Figure 9. Axial variation of soot volume fractions at the centerline of three different flames.
Energies 11 01731 g009
Figure 10. TEM images of soot sampled at a 40 mm height after the burner (a) kerosene flame soot (case 4); (b) CO2-diluted kerosene flame soot (case 6) at magnification of 7000; (c) kerosene flame soot; (d) CO2-diluted kerosene flame soot at higher magnification of 74,000.
Energies 11 01731 g010
Figure 11. Radiation intensity at the centerline of three different flames.
Energies 11 01731 g011
Figure 12. Effect of CO2 addition on radiation intensity.
Energies 11 01731 g012
Figure 13. Relationship between radiation intensity and soot emission over all previous data measured from both kerosene and ethylene based-flames.
Energies 11 01731 g013
Table 1. Post combustion simulated gas composition.
CompositionKerosene Vapor (%)C2H4 (%)CO (%)CO2 (%)
case 1 100
case 2 5050
case 3 353530
case 4100
case 550 50
case 635 3530
Table 2. Composition analysis of soot samples collected at a 40-mm height above the burner.
SamplesCHOH/C
Case4 (kerosene soot)92%0.6%3.4%0.0065
Case5 (kerosene/CO soot)91.9%0.6%3.7%0.0065
Case6 (kerosene/CO/CO2 soot)92%0.6%3.3%0.0065

