Article

Experimental Study on Trap Characteristics of Nano-Montmorillonite Composite Pressboards

1
Key Laboratory of Engineering Dielectrics and Its Application, Ministry of Education, Harbin University of Science and Technology, 52 Xuefu Road, Harbin 150080, China
2
The School of Electrical and Electronics Engineering, Harbin University of Science and Technology, 52 Xuefu Road, Harbin 150080, China
*
Authors to whom correspondence should be addressed.
Energies 2018, 11(7), 1732; https://doi.org/10.3390/en11071732
Submission received: 24 May 2018 / Revised: 28 June 2018 / Accepted: 28 June 2018 / Published: 2 July 2018
(This article belongs to the Section F: Electrical Engineering)

Abstract

:
To improve space charge properties and the breakdown strength of insulation pressboard, nano-modifications with nano-montmorillonite fillers are developed using nanocomposite techniques in this study. Employing trap theory, charge carrier trapping characteristics are analyzed to interpret the space charge distribution modification from nano-montmorillonite (MMT) filling and explore the correlated mechanism of direct current (DC) breakdown strength enhancement. The trap energy level distribution is measured by a thermally stimulated current test and space charge distribution is tested with pulsed electro-acoustics. A DC power system is used to perform DC the breakdown experiment. The nano-MMT filler composite pressboard demonstrates increased trap density as filling concentration increases, which dominates the total trap charge quantity. Shielding layers formed from the trapped charges localized at the interface of the nano-MMT fillers with pressboard matrix reduce the injection of charge carriers from the electrodes and thus inhibit the internal space charge accumulation prophase and then charge carriers move to the interior of the pressboard. Space charge quantity increases with increasing trap density. However, the trapping of charges into the trap levels releases significant energy to destroy the primitive molecular chain of pressboard cellulose, resulting in reduced DC breakdown strength. The trap mechanism accounts for the modified space charge distribution and the enhanced DC breakdown strength deriving from nano-MMT fillers.

1. Introduction

The converter transformer is essential equipment for high voltage direct current transmission systems that transform alternating current (AC) electric energy into direct current (DC) electric energy and its dependability directly influences the stable operation of an energy system. As a key material for insulation, oil-paper insulation is widely used in converter transformers. Once this insulation loses efficacy, the transformer may malfunction irreversibly. Therefore, the insulating lifetime of oil-paper insulation approximately equals the practical functional lifetime of the transformer. Insulating structures withstand AC-superimposed DC voltage style and polarity reversal voltage, which concentrate the electrical field more than in a single electrical system [1,2,3,4]. Furthermore, space charge distribution results in the distortion of the electric field causing the insulating system to lose efficacy. As a consequence, the malfunction analysis of oil-paper insulation is a complicated process [5].
In order to study the effect of trap characteristics on electric field strength and space charge distribution, considerable research effort has focused on this subject. Ref. [6] built a model to calculate the trap depth of the space charge in a dielectric polymer with molecular dynamics theory and density functional theory. The aging oil demonstrated increased space charge quantity, trap density, and electric field distortion [7]. Ref. [8] introduced a theoretical foundation for optimizing the electric field distribution of the insulation system or inhibiting the space charge accumulation. A trap theory model showed the decrease in the space charge quantity in a complex medium [9]. The oxide layer broke down when the trap density neared the critical density [10]. The aging process of oil was proven to increase the trap levels and trap density [11]. Ref. [12] improved the dielectrical property and space charge characteristics by adding montmorillonite (MMT) into epoxy resin and polyethylene.
Montmorillonite (MMT) is an inorganic layered silicate with a natural nano-structure with a large specific surface area and high surface activity [13]. In this paper, a novel modified pressboard filled with nano-MMT is developed using the nanocomposite technique to improve the dielectric properties of pressboard. Trap characteristics analyses are performed according to trap theory to examine the reasons for and explore the enhancement mechanism of the breakdown strength and space charge property.

2. Materials and Experiment

2.1. Sample Preparation

The nano doping method in laboratory refers to industrial procreative processes. Raw materials included coniferous kraft pulp, distilled water, and MMT nanoparticles. The process of creating the nano-modified pressboards was divided into six steps: beating, mingle, molding, compressing, desiccation, and immersion oil. The main equipment used for this process are a beater, electronic scales, a pattern forming machine, a curing press, and a vacuum drying oven. The process is described detailed in Figure 1 [14].
The finished modified pressboards had a diameter of 200 mm, thickness of 0.40–0.50 mm, and a moisture content lower than 0.3%. The microstructure and nanofiller-MMT dispersity of the pressboard nanocomposites was characterized using scanning electron microscopy (SEM) (HITACHI, Tokyo, Japan), and the representative images for neat pressboard and nano-MMT/pressboard composites are shown in Figure 2. The four compared images illustrate MMT nanofillers in 1, 2.5, and 5 wt % filling rates all uniformly dispersed in and composite with the interleaving fiber background without appreciable structural change in the pressboard matrix.

2.2. Measurement System

Conforming to standard ASTM-D149, DC breakdown field strength was measured with cylindrical electrodes. The DC voltage was increased by jogging voltage with a step-up of 2 kV. The quantitative value was calculated from the average of the data to avoid the effect of dispersibility and random error from the equipment and environment.
The measurement system of the thermally stimulated current (TSC) included a Keithley 6517A (America), heating and cooling system vacuum apparatus and a high voltage DC power source. The system and measurement condition are shown in Figure 3 and Figure 4, respectively.
The pulsed electro-acoustic (PEA) measurement system included a high voltage DC source, a signal acquisition system, and a signal recovery system. Two processes occurred during measurement: the reference measurement process and constant voltage measurement process. The electric field stress was 3 kV/mm in the first process, lasting 15 s. The electric field stress was 10 kV/mm and it lasted 3600 s. The measurement system and measurement conditions are shown in Figure 5 and Figure 6, respectively [15].

3. Results

3.1. Effect of Nano Doping on Thermally Stimulated Current

The TSC spectra of the neat and nanocomposite pressboards were tested and the results are shown in Figure 7 for samples with different MMT filling rates. The TSC spectra for different filling rates depict evident discrepancies in peak current values in the increasing order of I1.0% < I5% < I0% < I2.5% < I7.5% and peak temperature positions of T0% < T2.5% < T7.5% < T5% < T1.0%. The peak value was 102 pA at 7.5 wt %, 77.6% higher than pure pressboard, which has a value of 57 pA, and 16.52% lower at 1.0 wt % than in the pure sample.

3.2. Effect of Trap Characteristics on Electric Breakdown Strength

The DC breakdown electric strength of MMT/pressboard nano-composites with different filling rates are plotted in Figure 8. The electric breakdown fields of the nanocomposite pressboards were remarkably enhanced for mild MMT nanofiller concentrations (representative 1.0 wt % filling rate); nevertheless, when the nano-MMT filling rate increased to higher than 2.5 wt %, the breakdown strength decreased, resulting in an inferior product compared to neat pressboard.

3.3. Space Charge Characteristics

The space charge characteristics were measured by PEA and the distribution of the samples with different contents are shown in Figure 9 under an electric field stress of 10 kV/mm. As shown in Figure 9, the black straight line on the left is the negative electrode and the right light is the positive electrode. Three different nano-modified pressboard contents are displayed including the pure sample, 1 wt % sample, and the 7.5 wt % sample. The 2.5 wt % and 5 wt % samples displayed the similar electric strength and TSC curves as the others. Therefore, the three contents listed above were chosen as objects of our study.

4. Discussion

4.1. Calculation of Trap Parameters

The trap energy levels and density were calculated using Equations (1)–(3) and analyzing the TSC curve in Figure 7.
E t = k T ln ( v t ) ,
v = k T h ,
N t = 2 I t q S k l T f 0 ,
where Et is tap energy level, k is the Boltzmann constant and k = 1.38 × 10 23   J / K , T is temperature, t is time of the rising temperature, v is the vibration frequency calculated with Equation (2), h is Plank constant and h = 6.6 × 10 34   J s , Nt is the trap density, I is the thermally stimulated current, q is the charge quantity and q = 1 eV, l is the insulated thickness, and f0 is the probability that the trap is occupied by electrons and f0 = 1/2. Figure 10 is a coordinate axis on which the abscissa is the trap energy level and the ordinate is trap density [16,17,18,19].
According to the calculation result, the order of magnitude of the trap density is 1021 and the relationship of the maximum value of the trap density with different nanoparticle components is Ntm5.0% < Ntm1.0% < Ntm0% < Ntm2.5% < Ntm7.5%. The maximum value was 5.81 × 10²¹ (1/eV·m3) and the minimum value was 3.06 × 10²¹ (1/eV·m3) at 7.5 wt % and 5 wt %, respectively. The trap density was 3.59 × 10²¹ (1/eV·m3) in pure pressboard. The relationship of trap energy level with peak value is Et0% < Et7.5% < Et2.5% < Et5.0% < Et1.0%.

4.2. Effect of Trap Parameters on Electric Breakdown Strength

The averaged results of the multiple breakdown tests completed for individual different fill rates were calculated and are listed in Table 1. The DC electric breakdown strength of 1.0 wt % MMT/pressboard nano-composite was 218 kV/mm, 16.6% higher than the 187 kV/mm of neat pressboard. However, the breakdown strength distinctly decreased to 158 and 155 kV/mm for 2.5 wt % and 5.0 wt % filling rates, respectively, as the filling rate increased higher than 1.0 wt %, about 17.1% lower than neat pressboard.
The charge carriers are in a partially bound state energy level in the energy band gap of the matrix materials. This energy level is capable of capturing charge carriers. The movement of untrammeled charge is directed under the action of the electric field force. These carriers scatter with trap across the trap energy level and they change to a bound state with a certain probability causing the trapping of carriers. Many of these carriers jump into the conduction band creating detrapping carriers. Trapping and detrapping processes are in dynamic equilibrium when the charges release energy during the trapping process and absorb energy in the detrapping process. The process increases trap density and a shallow trap in the 7.5 wt % sample, leading to the higher capacity of catching charges than other samples. The energy of trapping carriers released as ray and heat are transmitted to other trapping carriers. Under the effect of the electric field, many the charge carriers acquire sufficient energy and bonding valence electrons to move to the conduction band of the molecular chain in cellulose, which destroys the chain structure causing electric breakdown. The trap density of pure pressboard was less than that of the 7.5 wt % sample, as the pure pressboard caught fewer charges and released lower energy, resulting in a higher electric breakdown strength. In the 1 wt % sample, the trap had lower density and deeper energy level so it had a higher electric breakdown strength.

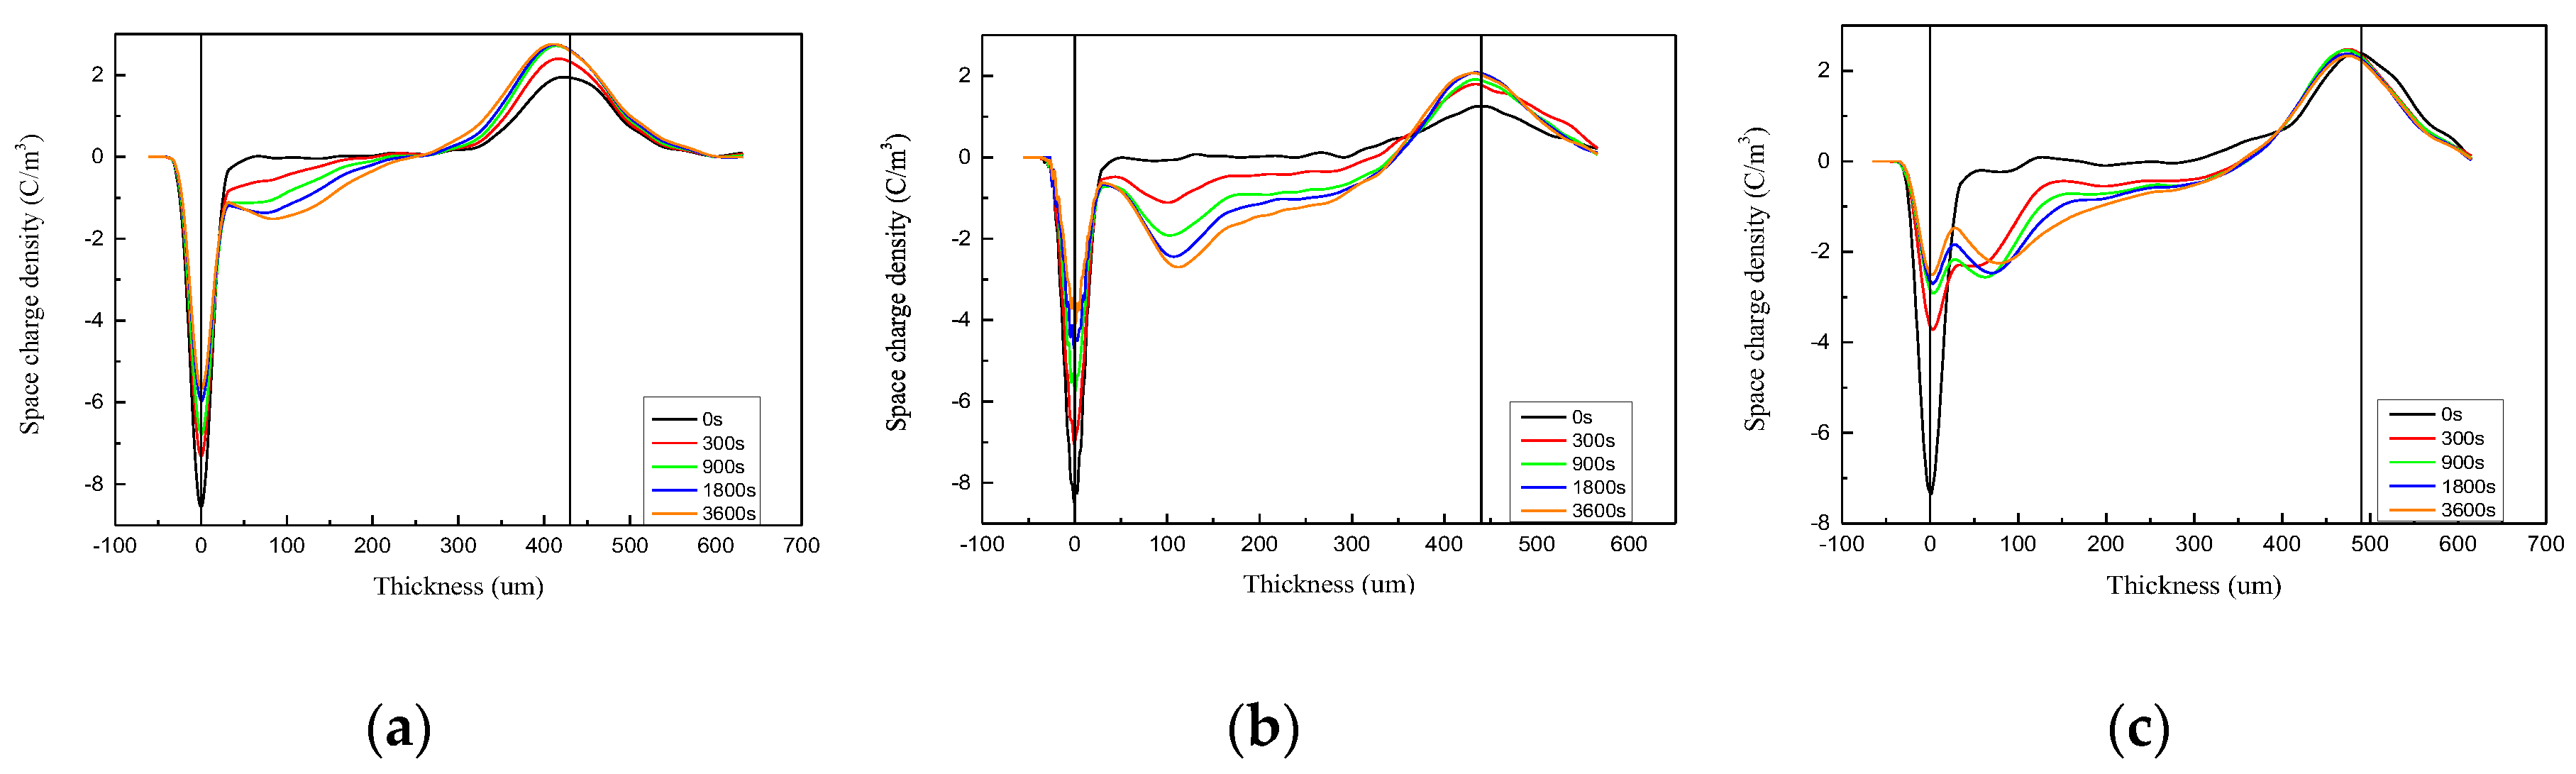
4.3. Effect of Trap Parameters on Space Charge

When the voltage is first applied, a cathode injects a huge amount of electricity and charge packets with different contents are formed. The charge packet grows on the anode occupying the vast majority of the pressboard over time. The quantity of electric charge is the lowest and the charge packet is smallest in pure pressboards. Compared with the 7.5 wt % sample, the charge packet is longer than with the 1 wt % sample. A large amount of electron holes accumulated at the anodes of the pure and 1 wt % samples, whereas this phenomenon was not obvious in the other samples.
Figure 9 shows the different depths of injecting charges and quantity of electric charge with different nano-modified pressboards. Two sources of space charge are found in dielectric mediums: ionization of impurities and injection of electrode. The former forms a heteropolarity space charge whereas the latter creates a same polarity space charge [20]. The distribution curve graphs reveal that the accumulation of heteropolarity charges near the electrode was not obvious, because the concentration of injection was higher than that from ionization. Few charges were injected into specimens and the curves remained constant.
With higher trap density in the 7.5 wt % pressboard, more charges were accumulated because charge curriers are caught by the trap on the surface of the sample, forming a trapping space charge. According to the research [9], charges on the surface establish the trapping charge layer with an electrode, creating a shielding effect on charge injection causing the velocity in the 7.5 wt % sample to be lower than in the 1 wt % sample. According to the TSC measurement and computation of trap energy level, the 1 wt % sample had a low energy level and trap density, and as a result, traps catch charges with difficulty and the trap density of the charge layer decreases, causing the strength shield to decrease. There are more charges in the 1 wt % sample. During the later measurement process, the charge carriers gradually move to the interior of the sample and the charge packet develops on the positive electrode, which reduces the strength of the shield. The effect of trap on catching charges was the main reason for charge accumulation.

5. Conclusions

Based on our experimental study and analysis of electric strength and space charge characteristics of nano-modified pressboards, we drew the following conclusions:
(1)
Nano-particles in dielectric mediums remain the base material and have benign dispersibility.
(2)
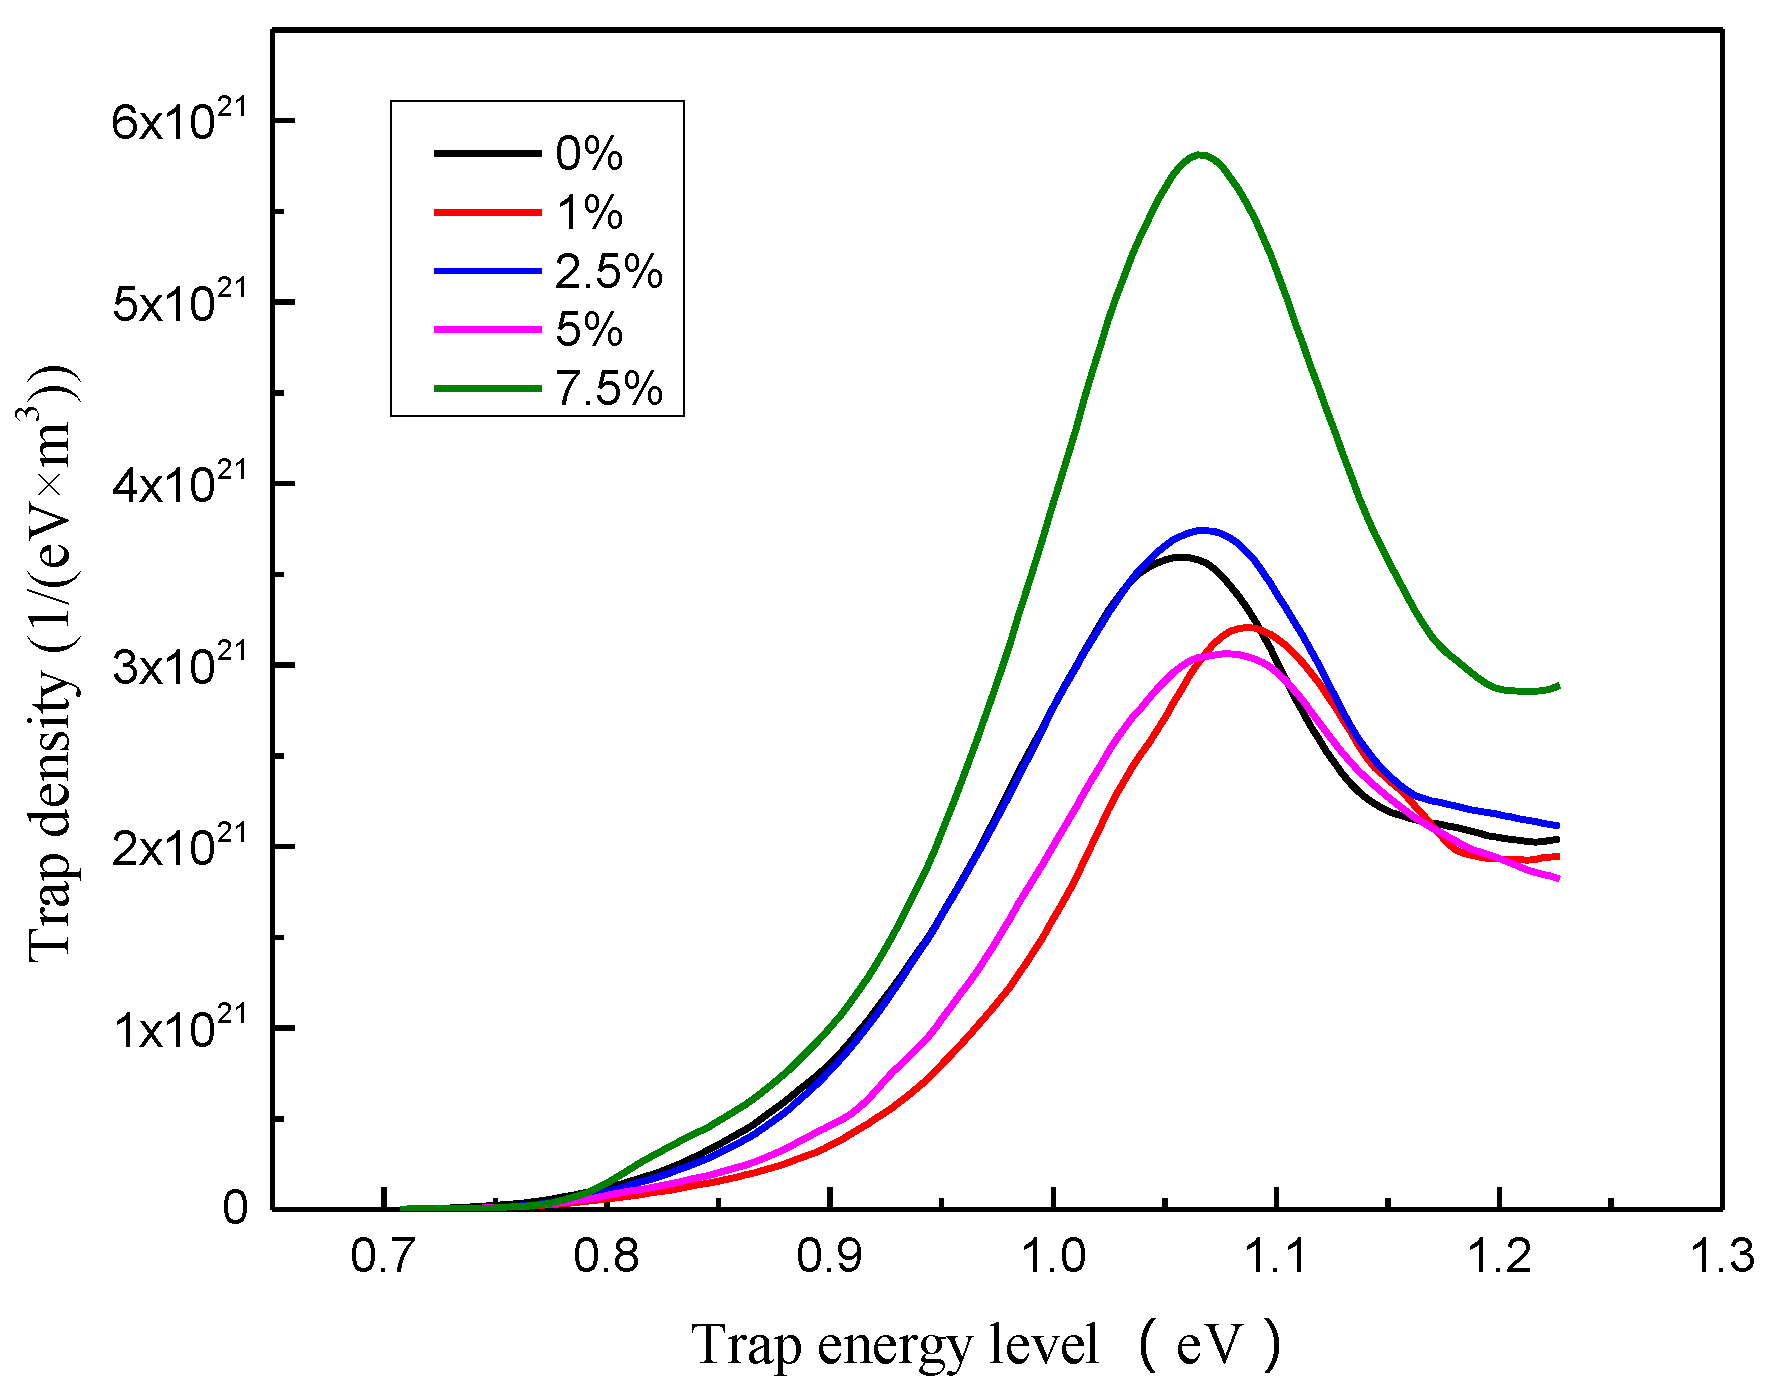
The appropriate nano-particle content reduces the trap density and increases the trap energy level.
(3)
DC electric breakdown strength initially increases and then decreases as the nano-composite content increases. High nano-composite content increases trap density and trapping charges release more energy to destroy fibrous structures, so electric breakdown strength is reduced.
(4)
Traps are the main reason for space charge accumulation. Trap parameters change with different doping content, which cause a variety of space charge accumulations as proven by the second conclusion listed above.

Author Contributions

Q.C. and J.S. conceived and designed the experiments; J.Z. and P.T. performed the experiments; J.S. and M.C. analyzed the data; J.S. wrote the paper.

Funding

This research was funded by the Project Supported by the National Key Research and Development Program of China (No. 2017YFB0902704), the National Natural Science Foundation of China (No. 51677046) and the University Nursing Program for Young Scholars with Creative Talents in Heilongjiang Province (No. UNPYSCT-2016159).

Acknowledgments

The authors thank the Project Supported by the National Key Research and Development Program of China (No. 2017YFB0902704), the National Natural Science Foundation of China (No. 51677046) and the University Nursing Program for Young Scholars with Creative Talents in Heilongjiang Province (No. UNPYSCT-2016159).

Conflicts of Interest

The authors declare no conflict of interest.

References

  1. Deng, Y. Analysis on insulation structure of converter transformer. High Volt. Appar. 2011, 47, 53–59. [Google Scholar] [CrossRef]
  2. Liu, G.; Li, L.; Li, W.; Li, B.; Sun, Y.; Li, J. Analysis of nonlinear electric field of converter transformer under polarity reversal voltage. High Volt. Eng. 2012, 38, 451–456. [Google Scholar] [CrossRef]
  3. Zeng, L.; Wu, Z. The finite analysis of the large-scale converter transformer valve side of the electric field. Appl. Mech. Mater. 2013, 325–326, 476–479. [Google Scholar] [CrossRef]
  4. Liu, K.; Li, X.; Feng, Z. Analysis and treatment of short circuit ring of interleaved winding in converter transformer. Transformer 2016, 53, 68–71. [Google Scholar] [CrossRef]
  5. Zhang, X.; Guo, N.; Gao, J. Phase morphology of exfoliated epoxy/MMT nanocomposite. High Volt. Eng. 2009, 35, 282–289. [Google Scholar] [CrossRef]
  6. Liao, R.; Lu, Y.; Yang, L.; Li, J.; Sun, C. Numerical calculation of the trap depth for space charge in polymer insulators. Insul. Mater. 2006, 39, 51–54. [Google Scholar] [CrossRef]
  7. Liao, R.; Zhou, T.; George, C.; Yang, L. A space charge trapping model and its parameters in polymeric material. Acta Phys. Sin. 2012, 61, 017201. [Google Scholar] [CrossRef]
  8. Hao, J.; Huang, B.; Chen, G.; Fu, J.; Wu, G.; Wang, Q. Space charge accumulation behavior of multilayer structure oil-paper insulation and its effect on electric field distribution. High. Volt. Eng. 2017, 43, 1973–1979. [Google Scholar] [CrossRef]
  9. Tian, F.; Bu, W.; Shi, L.; Yang, C.; Wang, Y.; Lei, Q. Theory of modified thermally stimulated current and direct determination of trap level distribution. J. Electrostat. 2010, 68, 243–248. [Google Scholar] [CrossRef]
  10. Lin, L.; Zhang, M. The breakdown character of thin oxide film and critical trap density. Acta. Electron. Sin. 2000, 28, 59–62. [Google Scholar] [CrossRef]
  11. Zhou, T.; Chen, G.; Liao, R. Charge trapping and detrapping in polymeric materials: Trapping parameters. J. Appl. Phys. 2009, 106, 637–644. [Google Scholar] [CrossRef]
  12. Zhang, X.; Gao, J.; Guo, N.; Zhang, J.; Liu, Y.; Hu, H. Influences of nano-montmorillonite on breakdown and electrical conductivity of polyethylene. High Volt. Eng. 2009, 35, 129–134. [Google Scholar] [CrossRef]
  13. Zhang, M.; Sun, T.; Zhang, X.; Hu, C.; Hu, Q.; Wang, Z. Study of preparation and properties of organo-mantmorillonite modified epoxy nanocomposite. Trans. China Electrotech. Soc. 2006, 21, 29–34. [Google Scholar] [CrossRef]
  14. Chen, Q.; Liu, H.; Zhuge, X.; Zhuge, X.; Wei, X. Analysis of dielectric properties and electric field homogenization of modified insulation pressboard based on nano SiC. Proc. CSEE 2014, 18, 79–84. [Google Scholar] [CrossRef]
  15. Chen, Q.; Liu, H.; Chi, M.; Wang, Y.; Wei, X. Experimental study on influence of trap parameters on dielectric characteristics of nano-modified insulation pressboard. Materials 2017, 10, 90. [Google Scholar] [CrossRef] [PubMed]
  16. Wang, Y.; Zhou, Y.; Li, G.; Wang, N.; Liu, Y.; Sun, Q.; Li, B.; Li, P.; Cheng, H. Space charge phenomena in oil-paper insulation materials under high voltage direct current. High Volt. Eng. 2008, 34, 873–877. [Google Scholar] [CrossRef]
  17. Zhou, K.; Wu, G.; Deng, T.; Wu, J.; Tong, L. The measurement of TSC in nano composite insulation. Proc. CSEE 2007, 27, 76–82. [Google Scholar] [CrossRef]
  18. Tian, F.; Bu, W.; Yang, C.; Han, B.; Wang, Y.; Lei, Q. Investigation of existing problems in thermally stimulated current measurement technique. Trans. China Electrotech. Soc. 2010, 25, 21–28. [Google Scholar] [CrossRef]
  19. Cai, J.; Chen, H. Aging diagnosis of oil-paper insulation based on trap density spectrum. High Volt. Eng. 2017, 43, 2574–2581. [Google Scholar] [CrossRef]
  20. Hao, J.; Liao, R.; Chen, G.; Yan, J. Influence of oil aging on the formation and migration behavior of space charge in oil-paper insulation dielectrics. Proc. CSEE 2012, 32, 173–181. [Google Scholar]
Figure 1. The flow diagram follow for creating nano-modified insulating pressboard.
Energies 11 01732 g001
Figure 2. Representative scanning electron microscopy (SEM) images of (a) neat pressboard and montmorillonite (MMT)/pressboard nanocomposites filled with (b) 1 wt %, (c) 2.5 wt %, and (d) 5.0 wt % nano-MMT.
Energies 11 01732 g002
Figure 3. Thermally stimulated current measurement system.
Energies 11 01732 g003
Figure 4. The temperature and electric field stress of pressboards varying with time on thermally stimulated current (TSC).
Energies 11 01732 g004
Figure 5. The space charge distribution measurement system.
Energies 11 01732 g005
Figure 6. The temperature and electric field stress of pressboards varying with time on the pulsed electro-acoustic (PEA) system.
Energies 11 01732 g006
Figure 7. Thermally simulated current (TSC) spectra of nanocomposite pressboards.
Energies 11 01732 g007
Figure 8. The electric breakdown strength of nano-composite pressboards varying with filling rate.
Energies 11 01732 g008
Figure 9. The charge density distribution of neat pressboard and nano-MMT/pressboard nanocomposites with different filling rates: (a) neat pressboard, (b) 1.0 wt % MMT, and (c) 7.5 wt % MMT.
Energies 11 01732 g009
Figure 10. Trap density changing with trap energy level of nano-composite pressboards.
Energies 11 01732 g010
Table 1. The electric breakdown strength of montmorillonite (MMT) pressboard nanocomposites.
Filling rate of MMT (%)0%1.0%2.5%5%7.5%
Eb (kV/mm)187218158155156

