Abstract
Distributed generation (DG) can be integrated into any radial distribution network (RDN) to meet the increasing demand for electric power. Instead of integrating a single large size DG, two or more than two small DGs (multi DGs) are usually placed. These DGs must be placed in appropriate buses/nodes with suitable size to ensure better performance of the system. The purpose of this paper is to implement an established hybrid optimization algorithm to place multi DGs with suitable size at each site. The proposed hybrid ABC-CS optimization algorithm combines the behaviour of the artificial bee colony (ABC) and cuckoo search (CS) algorithms. The multi DGs are optimally placed by considering objectives like power loss, penalty function (PE) and voltage profile (VP). The outcomes of two different types of radial distribution networks obtained by the suggested method for placement of multi DGs have been correlated to that obtained by using genetic algorithm (GA), particle swarm optimization (PSO) and GA-PSO. The proposed method has also been correlated with the other published methods to indicate its strength.
1. Introduction
Society today is totally dependent on electric power for day to day life and the expected electrical power must be available [1]. Complex power distribution systems provide the required electricity to the customers [2]. These highly complex distribution systems require suitable design of new effective and reliable devices in the deregulated electric power industry for flexible power flow control and also uninterrupted power supply [3]. Since the restructuring concept has already been introduced into existing power systems, Distributed generations (DGs) have attracted attention for their potential usage. DG is defined as small generators supplying the electric power required by customers and these are scattered in a power system [4,5]. The DG technologies are developed from the distribution systems where conventional as well as non-conventional energy sources are used for generating power. Hence DGs are gaining popular momentum as an alternative option in the planning of distribution systems [6].
In earlier days the designed distribution system used to convey power from the (high voltage) transmission networks and most of the electrical generation sources was connected to the customers [7]. Electricity generation constraints such as centralized power plants deliver the electricity to the end-user via transmission systems [8]. In distribution system, the voltage levels are low, but current levels are high compared to the transmission system. Therefore, the losses in the distribution system are greater than in transmission systems [9]. There is increasing interest in studies of renewable sources of energy, which are solar, wind, hydro, biomass, geothermal and ocean energy, etc. Hence integration of distributed resources to the grid have been rapidly increasing [10]. Any DG is composed of distributed resources, which serves as an electric power generation within distribution networks or on the customer site of the network [11]. When a DG is being installed at a customer site, it increases utility. DG sources are obtained from conventional and non-conventional energy sources [12].
Recently the cost of DG has been reduced drastically due to the advanced technology available [13]. Optimization techniques can be used for deregulation of the power industry, by using the best allotment of multiple DG units [14]. The advancement in technology and the demand of the customers for cheap and reliable electric power has led to an increasing interest in DG [15], however, issues related to reliability and maintenance have impeded the penetration of DG resources in distribution grids [16]. DG placement critically impacts the operation of the distribution network.
If the DG is being placed optimally, it will improve the system’s voltage profile and reduce system losses [17]. Researchers have paid a lot of attention to DG placement in the last fifteen years [18].
The rest of the paper is organized as follows—some recent research work related to the optimal DG placement in distribution networks is presented in Section 2. The problem formation for the proposed method is described in Section 3. The proposed hybrid ABC-CS (artificial bee colony and cuckoo search)-based multi DGs placement with an innovative objective function is described in Section 4. Implementation results and performance analysis are shown in Section 5. Subsequently the conclusions of the research work and are shown in Section 6.
2. Related Work
Some of the recently published works related to the optimal DG placement for power quality improvement are listed beneath.
Li et al. [19] used game theory to optimize the multi-objective function to get the exact location and sizing of DG. They discussed the advantages of game theory for optimization i.e., “game optimization theory”. They tested the proposed method on an 8-bus network.
Hung and Mithulananthan [20] proposed a method for multiple DG placement using an improved analytical method for loss reduction in distributed systems. They used the loss of the system as the objective function. They compared the optimal size of four different types of DG. They showed the effectiveness of improved analytical (IA) method compared to loss sensitivity factor (LSF) and effective load-flow methods using 16-node, 33-node and 69-node RDNs.
Ameli et al. [21] presented a multi-objective particle swarm optimization (PSO) algorithm to optimize sizing, and siting of DGs, as well as the contract price of their generated power. The proposed method improved the voltage profile and stability, reduced power losses, and enhanced the supply reliability. They had used a 33-node radial distribution network (RDN).
Devi and Geethanjali [22] used a modified bacterial foraging optimization algorithm (BFOA) for loss reduction as well as improvement of the voltage profile integrating multiple DGs in 12-node, 34-node, and 69-node RDNs.
Kaur et al. [23] presented a mixed integer non-linear programming (MINLP) -based technique to place multiple DG units (a maximum of three) in RDNs using two examples. They compared their method with an improved analytical and PSO-based methods to prove its superiority.
Kabalci [24] evolved a system with a view to perceive how the distribution system affected the parameters averse to drops, failures and utilization instantaneously. The recommended programming logic controller (PLC) framework eradicated concerns such as unreliability, intervention, shading as well as fading of wireless systems.
Cataliotti et al. [25] devised a contemporary arrangement for remote supervision and regulation of DG’s and energy storage systems associated with low voltage distribution networks by virtue of interface protection systems. The assembly was tested in an island to point out its outstanding communication strategies as well as restraints.
Kansal et al. [26] proposed a hybrid approach, which is a combination of and analytical method and a heuristic approach, to place optimally multiple DGs. They computed the size of each DG by and analytical search and the optimal locations were found by the PSO technique. They used 33-node and 69-node RDNs and the performances obtained by the proposed method were also compared with the PSO and the method proposed in [20]. In their method, loss reduction obtained by PSO was better than that obtained by their proposed hybrid method for one DG, two DG and three DG in both examples for Type-I DG, but their proposed hybrid method failed to give better loss reduction for one DG, two DG and three DG than that of [20] for a 69-node RDN.
Vita [27] described an established and an accurate arrangement based on decision making algorithms for better placement as well as sizing of DG and used an extended Newton-Raphson load flow method. The proposed method was tested on a 33 node RDN with a single DG system.
3. Problem Formulation
Appropriate placement of DG reduces the losses of any distribution grid and hence reduces the operating cost. The real power loss of any system is expressed by Equation (1):
where .
The appropriate placement of DG with rated size not only reduces the net real power loss, but also enhances the node voltage. The following two functions represented by Equations (2) and (3) are integrated in Equation (19) to get fitness function:
PE can be computed from Equation (4):
where:
where:
where:
provided the following constraints are satisfied:
where .
4. Proposed Multi DGs Placement and Sizing Using Hybrid ABC-CS
In this paper a structure has been suggested for placement of multi DGs and their sizing based on multi-objective criteria so that the system’s performance is increased. The suggested structure utilizes a hybrid artificial bee colony and cuckoo search (ABC-CS) algorithm. The objectives considered in this proposed framework are to maximize voltage profile and minimize power loss. Based on the multi objective function the ABC-CS algorithm is employed for optimal location of multi DG with suitable size. The architecture of the suggested structure is shown in Figure 1.
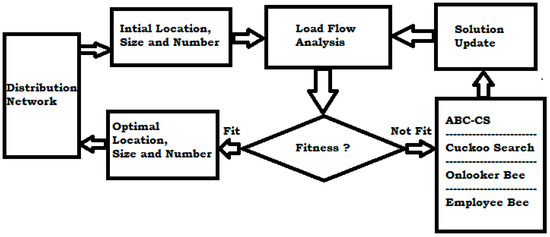
Figure 1.
Architecture of the suggested structure.
In the suggested structure, an artificial intelligence-based technique is applied for the placement of multi DGs to enhance the functioning of any distribution grid. The hybrid ABC-CS algorithm is utilized in the proposed work. The detail description of the proposed technique is as follows.
4.1. Initialization
In this phase the random initialization of distribution grids’ bus data (food sources) is done. The random initial data contain the location, size and number of DGs. The format of initial data is shown in Figure 2. The initial location is randomly initialized as for ‘’ bus system, size of each DG is randomly initialized in the range of 0–2 MW, and DG number is randomly initialized between for placing ‘’ of DG (s).
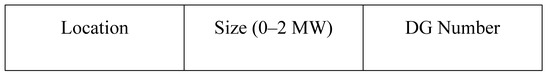
Figure 2.
Format of the initial data.
4.2. Worker Bee Phase
In this phase for the corresponding initial data (arbitrary food sources) fitness value is computed and the formula to compute the fitness is shown in Equation (19). The fitness function ‘F’ is formed by combining Equations (2) and (3):
After finding the fitness of the initial data, the iteration count is established as 1.
4.3. Onlooker Bee Phase
This phase is to select the best food origins of the obliged optimal location of DG and increases the food origins. The onlooker bee step comes under the optimal solution of the suitable location at low power loss and high voltage profile, which enhances the velocity of the populations as expressed in Equation (20):
where Xnb is the candidate solution (m ≠ n) that has been selected randomly, represents a random number in the range [–1, 1]. A greedy selection is used only after the generation of new candidate solution (Vm).
4.4. Selection
The optimal fitness of the modified solution can be realized with the help of selection in addition to determine this chance. The probability function is expressed in Equation (21):
4.5. CS-Based Scout Bee Phase
When the onlooker bee step does not provide better options, the algorithm departs from the particular options and creates a random number of scout bee solutions while using the cuckoo search optimization.
4.5.1. Initialization
At first the CS parameters are set. These parameters consist of the “number of nests ()”, “the step size parameter ()”, “discovering probability ()” and the termination criteria, which is the maximum number of generations.
4.5.2. Generate Initial Nests or Eggs of Host Birds
The initial positions of the nests are specified by the set of random values allocated to each variable presented by Equation (22):
where ‘’ is the beginning value of the n-th variable for the m-th nest; and are the lower and the upper permitted values for the n-th variable; ‘’ is “a random number in the interval [0, 1]”. Since the problem has discrete nature, the round function is achieved.
4.5.3. Step Size Evaluation
In this step, the step sizes for individual parent weights obtained in step 3 are evaluated. The following expressions presented in Equation (23) are used to find out the step size:
where ‘’ is the step size, ‘’ is step size parameter (), ‘’ is the current parent weight, ‘’ is the foremost result so far, ‘r’ is a “random number from a standard normal distribution [0, 1]” and ‘S’ is step. The step ‘S’ is found out by using Mantegna’s algorithm, shown in Equation (24):
In Equation (24) ‘’ is a parameter arising in the interval [1, 2], which is taken as 1.5 and ‘u’ and ‘v’ are normal distributions, which are estimated as Equations (25) and (26):
4.5.4. Generation of a New Solution
In this step the new optimized solutions or weights are generated for the corresponding parent weights based on the CS algorithm (Levy Flight). The new weights are generated by using the step size values obtained in Step 3. The new weights are generated by using the expression given in Equation (27):
where ‘’ is the new weight, ‘Sz’ is step size and ‘’ is the current parent weight. From this step another set of optimized weights are obtained.
4.5.5. Ending of CS Process
The termination criteria is tested in this phase. If the process meets the termination criterion, it is terminated or else, Step 3 is started for the next iteration.
4.6. Termination Criteria
The process is repeated till the maximum number of iterations is attained. If the iteration number is maximum, the process is stopped and the current best solution is retained. Then the DG is placed at that appropriate location. The process flow of the suggested technique is shown in Figure 3.
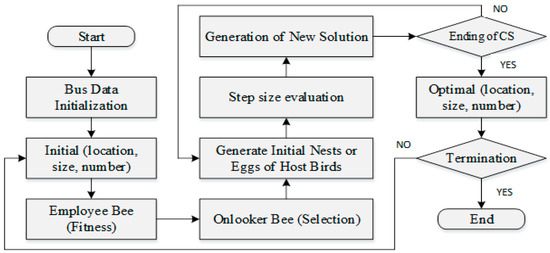
Figure 3.
Process flow of proposed technique.
The proposed scheme for the optimal placement of multiple DGs in RDNs using ABC-CS is described so far and the process flow diagram is presented in Figure 3. Initially the bus data or the distribution grid data are initialized, then the random DG location, DG size and DG number are initialized for the ABC-CS. The fitness value for the corresponding initial value is computed in the worker bee phase and based on this some solutions for further processing are selected. Then the scout bee phase based on CS is processed to get the optimal DG location, DG size and DG number. The colony size and food number are taken as 20 and 10, respectively. The implementation and performance validation is done in the next section. The details of ABC and CS algorithms are available in [28,29], respectively. The details of GA and PSO are available in [30].
5. Implementation of Results and Discussion
The suggested technique for the optimal multi-DGs placement using ABC-CS is implemented in the MATLAB platform (MathWords, Natick, MA, USA). The proposed technique is tested in the standard two different types of radial distribution networks (30-node and 141-node RDNs). The formulae of the cost of energy loss per annum and DG cost are available in [31]. The load-flow proposed by Bhullar and Ghosh [32] is used in this present work.
5.1. 30-Node RDN
The first distribution network is a 30-node RDN shown in Figure 4 and its system data are available in [33] having 100 MVA and 11 kV as base values. The net load on the system is 8.70 + j 5.37 MVA. The voltage stability index “VSI” formula available in [33] has been used to detect the most sensitive node. The node having the minimum value of VSI is called the most sensitive node.
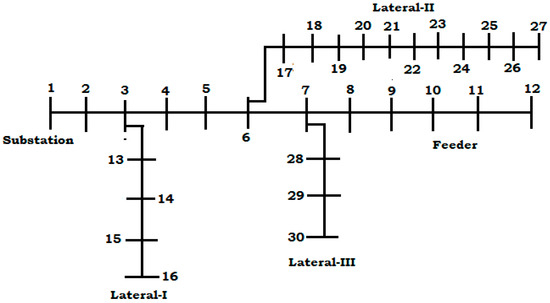
Figure 4.
30-node RDN.
Before placing DG, the values of minimum voltage and total real power loss were 0.8830 p.u. at node 27 and 0.874 MW, respectively. The energy cost ($) was 459,374.4. The minimum value of VSI is 0.6071. The stability of the system has been enhanced when the number of DGs is five.
In Table 1 the performance measures obtained by the proposed ABC-CS technique for the placement of various numbers of DG have been shown. The minimum voltage has been improved and power loss has been reduced for placing multiple DGs as compared to single DG placement. The energy cost has been reduced. Moreover, the loss reduction percentage is also high due to the placement of multiple DGs. Therefore, the multiple DGs placement enhances the performance of this system. Figure 5 shows the outcomes in terms of voltage magnitude (p.u.), VSI and loss of the system (MW) for five cases. Table 1 and Figure 5 show that the placement of DG not only increases the voltage profile and VSI but also reduces the loss of the system.

Table 1.
Performance obtained by proposed technique for 30-node RDN.
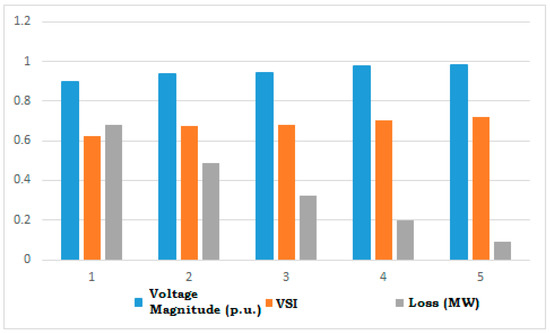
Figure 5.
Outcomes obtained by the proposed method.
Table 2 shows the outcomes obtained by the game optimization theory using the proposed objective function. Figure 6 shows a comparison of voltage magnitude (p.u.), VSI and loss of the system (MW) for five cases obtained by the proposed method with that obtained by game optimization theory. The proposed method gives better results compared to that obtained by game optimization theory. Therefore, the appropriate placement and proper optimal sizing of DG can only ensure better loss reduction and improvement of voltage profile and VSI.
Table 2.
Performance obtained by game optimization theory for 30-node RDN.
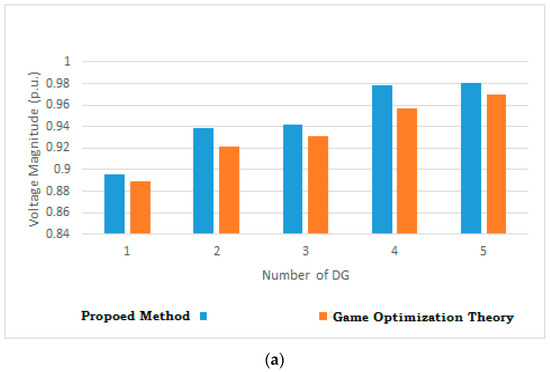
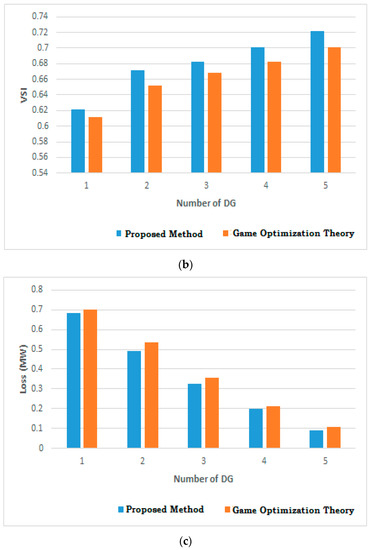
Figure 6.
Comparison of proposed method with game optimization theory. (a) Voltage magnitude (p.u.). (b) VSI. (c) Loss of the system (MW).
5.2. 141-Node RDN
The second distribution network is a 141-node RDN as shown in Figure 7 and its system data are available in [34]. The base kV is 12.47 and base MVA is 100 MVA. The net load of the system is (12.19 + j∙6.289) MVA.
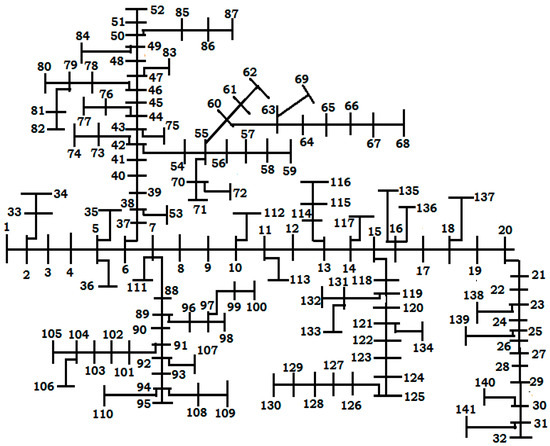
Figure 7.
141-node RDN.
Before placing DG, the values of minimum voltage and total real power loss were 0.7752 p.u. at node 124 and 0.116 MW respectively. The energy cost ($) was 60,969.6. In Table 3 the performance measures obtained by the proposed ABC-CS technique for the placement of various numbers of DG have been shown. The minimum voltage has been improved and power loss has been reduced for placing multiple DGs as compared to single DG placement. The energy cost has been reduced. Moreover, the loss reduction percentage is high due to placement of multiple DGs. Therefore, the placement of the multiple DGs enhances the performance of this distribution grid.
Table 3.
Performance obtained by proposed technique for 141-node RDN.
5.3. Performance Comparison
The performance measures of the proposed method are juxtaposed with the existing GA-PSO, PSO and GA for the placement of three DG as shown in Table 4 for the above two distribution grids using the same objective function. The overall performance of PSO is comparatively better than that of GA-based placement of DGs. The overall performance of GA-PSO is comparatively better than that of PSO-based placement of DGs, but the performance of the suggested method is better than the GA-PSO. Hence the proposed ABC-CS method to place DGs is better than these three techniques.
Table 4.
Performance comparison of the proposed method with GA, PSO and GA-PSO for three DG placements.
The real power loss reduction by the suggested method is higher than that obtained by GA-PSO, PSO and GA for the examples considered. The minimum voltage for each case have been improved by the suggested method as compared to GA-PSO, PSO and GA. The DG cost and energy cost achieved by the suggested method are lower than that achieved by GA-PSO, PSO and GA. The performance analysis clearly shows that the proposed method (ABC-CS) has better performance in all aspects of the placement of single or multiple DGs placement in RDNs.
5.4. Performance on Different Loads
In order to check the performance of the suggested method practical voltage dependent load models, i.e., residential, industrial, and commercial, have been considered [35]. The exponent values of the real power (α) and reactive power (β) for industrial, residential, and commercial loads are 0.18 and 6, 0.92 and 4.04, and 1.51 and 3.4, respectively.
Here a 30-node RDN is considered for load modelling. The size and location of DG for this 30-node RDN are shown in Table 5.
Table 5.
Results of 30-node RDN under different types of load.
5.5. Comparison with Other Methods
The outcomes of 30-node RDN obtained by the suggested method have been correlated with the other existing methods [20,23,26] in terms of loss reduction, DG size, DG cost and energy cost as shown in Table 6. The proposed method gives lesser losses and less DG size compared to the methods described in [20,23,26].
Table 6.
Comparison of proposed method with other methods for a 30-node RDN.
6. Conclusions
Placement of multiple DGs is encouraged in RDNs to reduce power losses and improve voltage magnitude. Interconnecting a single large size DG in any RDN cannot give the expected loss reduction. Hence, multiple small sized DGs are placed in the distribution system to achieve the maximum loss reduction. In this work, a hybrid optimization technique is used based on the ABC and CS algorithms to place multiple DGs in distribution grids. The suggested method provides better performance in all aspects than that obtained by using GA-PSO, PSO and GA in terms of minimum voltage, power loss, percentage loss reduction, DG cost and energy cost. The suggested method also reduces the loss to a minimum level when placing five DGs. The suggested method has been juxtaposed with other available methods [20,23,26] to show its effectiveness for a 30-node RDN. The DG placement in future can be done with the help of fuzzy based hybrid algorithm.
Acknowledgments
Authors are thankful to the Director of Thapar Institute of Engineering and Technology, Patiala, Punjab, India for providing the environment to carry out this work. There are sources of funding neither from this University nor from any outside agency.
Author Contributions
The Problem formulation, code development, implementation of code and manuscript preparation had been carried out by the Suman Bhullar under supervision of Smarajit Ghosh.
Conflicts of Interest
The authors declare no conflict of interest.
Abbreviations
| Vk | Magnitude of voltage at k-th bus |
| δk | Angle of Vk |
| and | Minimum and maximum value of Vk |
| rkl and xkl | Resistance and reactance of the segment between k-th and l-th bus |
| Pk and Qk | Active and quadrature power injection at bus ‘k’ |
| PGk and PDk | Active power generation and demand at bus ‘k’ |
| QGk and QDk | Wattless power generation and demand at bus ‘k’ |
| and | Lower and upper value of active power generation at bus ‘k’ |
| and | Lower and upper value of quadrature power generation at bus ‘k’ |
| and | Lower and upper value of apparent power at bus ‘k’ |
| PL | Real power loss of the system |
| PE | Penalty function |
| VP | Voltage profile |
| N | Number of buses |
| NG | Number of generator |
| NL | Number of lines/transformers |
| ISC,DG | Short circuit current with DG |
| ISC,no DG | Short circuit current without DG |
| Isc, rated | Short circuit interrupting capacity |
| ICk | Percentage short circuit interrupting capacity at the k-th bus |
| Percentage short circuit interrupting capacity limit at the k-th bus | |
| PCC | Point of common coupling |
| IPCCk | Percentage short circuit at the k-th PCC |
| Percentage short circuit limit at the k-th PCC | |
| KV | Constant of PE of voltage |
| KL | Constant of PE of line/transformers loading |
| KIC | Constant of PE of short circuit interrupting capacity |
| KIPCC | Constant of PE of the short circuit at PCC |
| h (V) | PE of voltage |
| h (S) | PE of line/transformer loading |
| h (IC) | PE of short circuit interrupting capacity |
| h (IPCC) | PE of short circuit at PCC |
| VSI | Voltage Stability Index |
References
- Gheorghe, V.A.; Masera, M.; Weijnen, M.; De Vries, L.J. Critical Infrastructures at Risk: Securing the European Electric Power System; Topics in Safety, Risk, Reliability and Quality; Springer: Berlin, Germany, 2006; Volume 9. [Google Scholar] [CrossRef]
- Kanchev, H.; Lu, D.; Colas, F.; Lazarov, V.; Francois, B. Energy management and operational planning of a micro grid with a PV-based active generator for smart grid applications. IEEE Trans. Ind. Electron. 2011, 58, 4583–4592. [Google Scholar] [CrossRef]
- Divya, K.C.; Ostergaard, J. Battery energy storage technology for power systems—An overview. Int. J. Electr. Power Syst. Res. 2009, 79, 511–520. [Google Scholar] [CrossRef]
- Soroudi, A.R.; Ehsan, M. Multi objective planning model for integration of distributed generations in deregulated power systems. Iran. J. Sci. Technol. 2010, 34, 307–324. [Google Scholar] [CrossRef]
- Olivares, D.E.; Canizares, C.A.; Kazerani, M. A Centralized Optimal Energy Management System for Micro Grids. In Proceedings of the IEEE Power and Energy Society General Meeting, Detroit, MI, USA, 24–28 July 2011; pp. 1–6. [Google Scholar]
- Kumar, V.; Kumar, H.C.R.; Gupta, I.; Gupta, H.O. DG integrated approach for service restoration under cold load pickup. IEEE Trans. Power Deliv. 2010, 25, 398–406. [Google Scholar] [CrossRef]
- Holttinen, H.; Meibom, P.; Orths, A.; Lange, B.; O’Malley, M.; Tande, J.O.; Estanqueiro, A.; Gomez, E.; Söder, L.; Strbac, G.; et al. Impacts of large amounts of wind power on design and operation of power systems, results of IEA collaboration. Wind Energy 2011, 14, 179–192. [Google Scholar] [CrossRef]
- Walling, R.; Saint, R.; Dugan, R.; Burke, J.; Kojovic, L. Summary of distributed resources impact on power delivery systems. IEEE Trans. Power Deliv. 2008, 23, 1636–1644. [Google Scholar] [CrossRef]
- Carpinelli, G.; Mottola, F.; Proto, D.; Russo, A. Optimal Allocation of Dispersed Generators, Capacitors and Distributed Energy Storage Systems in Distribution Networks. In Proceedings of the IEEE International Symposium on Modern Electric Power Systems (MEPS), Wrocaw, Poland, 20–22 September 2010; pp. 1–6. [Google Scholar]
- Kumar, A.; Kumar, K.; Kaushik, N.; Sharma, S.; Mishra, S. Renewable energy in India: Current status and future potentials. Renew. Sustain. Energy Rev. 2010, 14, 2434–2442. [Google Scholar] [CrossRef]
- Safari, A.; Jahani, R.; Shayanfar, H.A.; Olamaei, J. Optimal DG allocation in distribution network. World Acad. Sci. Eng. Technol. 2010, 4, 696–699. [Google Scholar]
- Banerjee, R. Comparison of options for distributed generation in India. Energy Policy 2006, 34, 101–111. [Google Scholar] [CrossRef]
- Rashtchi, V.; Darabian, M. A new BFA-based approach for optimal sitting and sizing of distributed generation in distribution system. Int. J. Autom. Control Eng. 2012, 1, 9–18. [Google Scholar]
- Heydari, M.; Hosseini, S.M.; Gholamian, S.A. Optimal placement and sizing of capacitor and distributed generation with harmonic and resonance considerations using discrete particle swarm optimization. Int. J. Intell. Syst. Technol. Appl. 2013, 5, 42–49. [Google Scholar] [CrossRef]
- Venkata, S.S.; Pahwa, A.; Brown, R.E.; Christie, R.D. What future distribution engineers need to learn. IEEE Trans. Power Syst. 2004, 19, 17–23. [Google Scholar] [CrossRef]
- Mishra, A.; Bhandakkar, A. Power quality improvement of distribution system by optimal location and size of DGs using particle swarm optimization. Int. J. Sci. Res. Eng. Technol. 2014, 3, 72–78. [Google Scholar]
- Georgilakis, P.S.; Hatziargyriou, N.D. Optimal distributed generation placement in power distribution networks: Models, methods, and future research. IEEE Trans. Power Syst. 2013, 28, 3420–3428. [Google Scholar] [CrossRef]
- Adefarati, T.; Bansal, R.C. Integration of renewable distributed generators into the distribution system: A review. IET Renew. Power Gener. 2016, 10, 873–884. [Google Scholar] [CrossRef]
- Li, R.; Ma, H.; Wang, F.; Wang, Y.; Liu, Y.; Li, Z. Game Optimization Theory and Application in Distribution System Expansion Planning, Including Distributed Generation. Energies 2013, 6, 1101–1124. [Google Scholar] [CrossRef]
- Hung, D.Q.; Mithulananthan, N. Multiple distributed generator placement in primary distribution networks for loss reduction. IEEE Trans. Ind. Electron. 2013, 60, 1700–1708. [Google Scholar] [CrossRef]
- Ameli, A.; Bahrami, S.; Khazaeli, F.; Haghifam, M.R. A multi-objective particle swarm optimization for sizing and placement of DGs from DG owner’s and distribution company’s viewpoints. IEEE Trans. Power Syst. 2014, 29, 1831–1840. [Google Scholar] [CrossRef]
- Devi, S.; Geethanjali, M. Application of modified bacterial foraging optimization algorithm for optimal placement and sizing of distributed generation. Exp. Syst. Appl. 2014, 41, 2772–2781. [Google Scholar] [CrossRef]
- Kaur, S.; Kumbhar, G.; Sharma, J. A MINLP technique for optimal placement of multiple DG units in distributed systems. Int. J. Electr. Power Energy Syst. 2014, 63, 609–617. [Google Scholar] [CrossRef]
- Kabalci, E. A smart monitoring infrastructure design for distributed renewable energy systems. Energy Convers. Manag. 2015, 90, 336–346. [Google Scholar] [CrossRef]
- Cataliotti, A.; Cosentino, V.; Cara, D.; Guaiana, S.; Panzavecchia, N.; Tine, G. A new system solution for low voltage distribution generation interface protection systems. IEEE Trans. Instrum. Meas. 2015, 64, 2086–2095. [Google Scholar] [CrossRef]
- Kansal, S.; Kumar, V.; Tyagi, B. Hybrid approach for optimal placement of multiple DGs of multiple types in distribution networks. Int. J. Electr. Power Energy Syst. 2016, 25, 226–235. [Google Scholar] [CrossRef]
- Vita, V. Development of a decision-making algorithm for the optimum size and placement of distributed generation units in distribution networks. Energies 2017, 10, 1433. [Google Scholar] [CrossRef]
- Koraboga, D.; Basturk, B. On the performance of artificial bee colony (ABC) algorithm. App. Soft Comput. 2008, 8, 687–697. [Google Scholar] [CrossRef]
- Mohamad, A.B.; Zain, A.M.; Bazin, N.E.N. Cuckoo search algorithm for optimization problems—A literature review and its applications. Appl. Artif. Intell. 2014, 28, 419–448. [Google Scholar] [CrossRef]
- Salma, M.M.; Elgazar, M.M.; Abdelmaksoud, S.M.; Henry, H.A. Short term optimal generation scheduling of fixed head hydrothermal system using genetic algorithm and constriction factor based particle swarm optimization technique. Int. J. Sci. Res. Publ. 2013, 3, 1–9. [Google Scholar]
- Murty, V.V.S.N.; Kumar, A. Comparison of optimal placement of DG allocation methods in radial distribution systems based on sensitivity approach. Int. J. Electr. Power Energy Syst. 2013, 53, 450–467. [Google Scholar] [CrossRef]
- Bhullar, S.; Ghosh, S. A Novel Search Technique to Solve Load Flow of Distribution Networks. J. Eng. Res. 2017, 5, 59–75. [Google Scholar]
- Eminoglu, U.; Hocaoglu, M.H. A Voltage Stability Index for Radial Distribution Networks. In Proceedings of the 42nd International Universities Power Engineering Conference, UPEC 2007, Brighton, UK, 4–6 September 2007; Volume 76, pp. 408–413. [Google Scholar]
- Khodr, H.M.; Olsina, F.G.; De Jesus, P.M.D.O.; Yusta, J.M. Maximum savings approach for location and sizing of capacitors in distribution systems. Elect. Power Syst. Res. 2008, 78, 1192–1203. [Google Scholar] [CrossRef]
- El-Zonkoly, A.M. Optimal placement of multi-distributed generation units including different load models using particle swarm optimization. IET (GTD) 2011, 5, 760–771. [Google Scholar] [CrossRef]


© 2018 by the authors. Licensee MDPI, Basel, Switzerland. This article is an open access article distributed under the terms and conditions of the Creative Commons Attribution (CC BY) license (http://creativecommons.org/licenses/by/4.0/).