Abstract
Dairy cattle farms are continuously developing more intensive systems of management, which require higher utilization of durable and non-durable inputs. These inputs are responsible for significant direct and indirect fossil energy requirements, which are related to remarkable emissions of CO2. This study focused on investigating the indirect energy requirements of 285 conventional dairy farms and the related carbon footprint. A detailed analysis of the indirect energy inputs related to farm buildings, machinery and agricultural inputs was carried out. A partial life cycle assessment approach was carried out to evaluate indirect energy inputs and the carbon footprint of farms over a period of one harvest year. The investigation highlights the importance and the weight related to the use of agricultural inputs, which represent more than 80% of the total indirect energy requirements. Moreover, the analyses carried out underline that the assumption of similarity in terms of requirements of indirect energy and related carbon emissions among dairy farms is incorrect especially when observing different farm sizes and milk production levels. Moreover, a mathematical model to estimate the indirect energy requirements of dairy farms has been developed in order to provide an instrument allowing researchers to assess the energy incorporated into farm machinery, agricultural inputs and buildings. Combining the results of this two-part series, the total energy demand (expressed in GJ per farm) results in being mostly due to agricultural inputs and fuel consumption, which have the largest share of the annual requirements for each milk yield class. Direct and indirect energy requirements increased, going from small sized farms to larger ones, from 1302–5109 GJ·y−1, respectively. However, the related carbon dioxide emissions expressed per 100 kg of milk showed a negative trend going from class <5000 to >9000 kg of milk yield, where larger farms were able to emit 48% less carbon dioxide than small herd size farm (43 vs. 82 kg CO2-eq per 100 kg Fat- and Protein-Corrected Milk (FPCM)). Decreasing direct and indirect energy requirements allowed reducing the anthropogenic gas emissions to the environment, reducing the energy costs for dairy farms and improving the efficient utilization of natural resources.
1. Introduction
The European member states are constantly increasing their efforts in policy actions oriented toward reducing Green House Gas (GHG) emissions into the environment. One of the most significant anthropogenic substances contributing to climate change is carbon dioxide (CO2), the global average concentration of which had risen over 400 ppm in 2016 [1].
The dairy cattle farms are continuously developing more intensive mechanization systems of management, which require higher utilization of durable and non-durable inputs. These inputs are responsible for the significant direct and indirect energy requirements, which are related to the remarkable emissions of CO2. As defined by Lockeretz (1977) [2], the direct energy refers to the use of diesel fuel and gasoline fuels, electricity and gas, while indirect energy is structured into two categories: ancillary energy refers to the production of agricultural inputs, which are depleted in one production period (seeds, fertilizers, feed, etc.); embodied energy refers to the manufacture of durable inputs utilized for several years (buildings, machinery, etc.).
One of the most adopted techniques used to estimate the input requirements and the related emissions of GHG in the cattle dairy sector is represented by the Life Cycle Assessment (LCA) methodology [3,4]. The LCA approach allows identifying environmental impacts throughout the life cycle of a product from the extraction of raw materials through the production process, use and final disposal [5,6]. However, several studies focusing on environmental impacts of dairy cattle farms did not included the indirect energy inputs in the analysis. There are several point of view about why indirect energy is not considered in LCA milk studies, such as the slight impact on the final results [7,8] and the lack of literature data about ancillary and embodied energy inputs in agriculture. Moreover, as underlined by Baldini et al. (2017) [9], capital goods, such as infrastructure and machinery, are rarely included in milk LCA, both due to the lack of data and the assumption of similarities among farms. The complexity and the level of detail required to carry out inventory analyses on building, machinery and production inputs [10] lead to the avoidance of the inclusion of these data in the LCA studies. Moreover, there is a lack of information about the influence of animal housing systems and machinery used in livestock farms, which are mainly neglected in LCA studies [11].
Considering the housing sector, the interest in comparing energy and consequential carbon embodied in buildings has been growing rapidly in the last few years, due to the interest in using alternative materials and construction methods, which can reduce their environmental impact [12]. The extraction of raw materials, needed for the production of building components, requires large quantities of energy resources that release pollutant into the environment [13]. The embodied energy analysis of buildings and facilities may be done following the principles of “top-down” or “bottom-up” methods. The “top-down” calculation breaks down large components into smaller parts, while the “bottom-up” method builds up each individual part of the building [14]. The bottom-up approach represents one of the most common methodologies adopted in housing LCA studies [12]. Koesling et al. (2015) [14] found in their study that embodied energy in barns contributes about 10–30% of the total primary energy used in dairy farms.
Another important durable input largely used in modern agricultural processes is represented by farm machinery (tractors, self-propelled machines and equipment). The use of farm machinery allows increasing the amount of farm operations accomplished with less human labor, but at the same time, this leads to increased depletion of natural resources and the emission of greenhouse gases into the environment [15]. There are several studies that have focused on direct and indirect energy requirements of farm machinery in crop cultivation [16,17,18]; hence, they should also be extended in the LCA studies of dairy products.
Energy represents an important production factor in agricultural systems and thus should be managed along with the other main production resources [19]. A study carried out by Roer et al. (2013) [20], with the aim to assess the environmental impact of combined milk and meat production, shows that excluding the production of building, machinery and materials reduced the Global Warning Potential (GWP) impact approximately by 8% per kg of carcass and 9% per kg of milk.
The major aims of this study were: (a) to investigate the indirect energy requirements of conventional dairy farms, especially the embodied energy in farm buildings and machinery and the ancillary energy incorporated in agricultural inputs; (b) to estimate the carbon footprint due to indirect energy usages; (c) to develop a model to estimate the indirect energy requirements of dairy farms.
2. Material and Methods
The study involved 285 conventional dairy farms located in the south of Italy. Specifically, 83 dairy farms were selected on the island of Sardegna, 70 in Sicilia, 88 in Basilicata and Puglia and 44 farms in Calabria. A partial life cycle assessment [5,6] approach was carried out to assess indirect energy inputs and the carbon footprint of farms over a period of one harvest year. The LCA methodology applied refers to ISO 14040-44 and ISO 14064-67. As shown in Table 1, the average herd size was 127 heads and 40 hectares of cultivated land extent. The average milk yield was 7698 kg of milk per lactating cow per year, which corresponded to an average yearly farm production of 497 tonnes. About 50% of cultivated land extent was irrigated to produce grass hay and grass silage in the spring season and corn silage in late summer. Farms were mostly located in valleys and hills, while only a few were situated on mountains. The Mediterranean weather offers, in these regions, mild winters (around 6–12 °C) and warm summers (around 22–28 °C), with annual precipitation from 300–800 mm. Further characteristics and management of the investigated farms have been described in a previous study by Todde et al. (2016) [21].

Table 1.
Farms characteristics (N = 285). FPCM, Fat- and Protein-Corrected Milk; LC, Lactating Cow.
The goal and scope of this work were to define the on-farm indirect energy usages in the milk production system and to assess the related emission of carbon dioxide. The system boundary was set at the farm level, from cradle to farm gate, and included the overall energy embodied in buildings, facilities and machinery and the ancillary energy incorporated in the agricultural inputs utilized through the on-farm milk production process. The functional unit was 1 kg of Fat- and Protein-Corrected Milk (FPCM), which considered the mass and composition of the milk. Therefore, the equation used to assess the FPCM considers the annual mass of milk produced (expressed in kg), the percentage of fat content and the percentage of protein [22]. Furthermore, additional functional units were used in order to express the results per raised head, per lactating cow and per cultivated hectare. No allocation among milk, culled cows and calves was considered since the investigated farms were specialized in milk production.
2.1. Data Inventory Analysis
The data collection was completed by means of a questionnaire, which included the overall farm’s information and a comprehensive report of farm structures, crop management, materials, fleet equipment and machinery. The inquiry form was organized into 3 sections in order to collect all the information related to: (i) dimensions and materials used in buildings and facilities; (ii) power and characteristics of tractors, equipment and milking systems; (iii) agricultural inputs used in farm processes (feed, fertilizers, seeds, plastics, etc.). Accordingly, the analysis was divided into 3 main categories named “buildings and facilities”, “machinery and equipment” and “agricultural Inputs”.
2.1.1. Buildings and Facilities
A comprehensive auditing was performed to estimate the embodied energy, expressed in MJ per year, among buildings, constructions and facilities at the farm level. A bottom-up approach has been used to determine the primary energy and the related CO2 emissions through the entire life cycle of each facility. This analytical technique considers the composition of each construction element and its content of embodied energy [14,23]. The final values were divided into the life span of buildings and facilities (30 years) in order to obtain the yearly amount of the indirect energy and the related carbon emissions. During the audit inspections in farms, we collected the dimensions and typologies of the constructions in order to define the amount and the type of materials embodied in each building (cowshed, hay barn, storehouse, milking center, silos, auxiliary facilities). The information was completed with project maps, photos and on-site sketches. The energy results were divided into the corresponding life span of each structure to obtain the respective yearly value.
The following parts of farm buildings and facilities have been detailed:
- basement, type and dimensions of the building’s foundation, as well as the overall platforms surrounding the farm’s structures and facilities;
- walls and partitions, the overall materials used and the total surface area of the building’s walls, dividers and partitions;
- main frame, representing the principal structure that supports and shapes the building, such as steel frame, timber frame or reinforced concrete frame; type and dimensions were used to assess the global weight of the materials utilized;
- roof, the coverage surface and the kind of rooftop;
- openings, overall dimensions and materials of windows, doors and gates.
The amount of each construction material has been used to calculate the embodied energy and the related indirect emissions due to the entire life cycle of each product. The energy equivalents and the CO2 emissions of the different construction materials are detailed in Table 2. The energy and emission factors adopted in the impact assessment have been firstly calculated or adapted by the authors; alternatively, the sources of the data used came from international databases and from several international scientific publications. However, the values adopted have been carefully selected based on the characteristics that match the existent conditions and materials observed in the Italian dairy farms. The results obtained for each structure have been summed together to obtain the total energy embodied and total carbon dioxide emissions per farm.
Table 2.
Embodied energy and emission factors used in the impact assessment.
2.1.2. Machinery and Equipment
In order to estimate the energy embodied in the farm machines and equipment, the following characteristics were collected:
- tractors and self-propelled machines, the number, operational power (kW) and type (2WD and 4WD) of tractors and self-propelled machinery; the mass of each machinery was multiplied to the energy equivalent of 108 MJ·kg−1 [11] to assess the total embodied energy, then reported as the annual value using a 15-year life span;
- equipment, type and dimensions of each farm tool (plow, cultivator, sprayer, harrow, seeder, trailers, etc.); their estimate mass was then multiplied to the equivalent of 69 MJ·kg−1 [30] to calculate the embodied energy; the yearly incidence of the farm equipment was obtained considering a life span of 10 years;
- feeding fleet; this refers to feeding preparation and distribution by means of self-propelled mixers; the related embodied energy was assessed as previously described in self-propelled machinery;
- irrigation, including the overall tools used for irrigation, such as pumping stations, underground systems (life span of 20 years), pivot and mobile equipment (life span of 10 years); the related energy requirement was estimated as equal to 50,745 MJ·ha−1 for underground irrigation systems (our calculation based on irrigation characteristic), 46,800 MJ·ha−1 for pivot systems [31] and 89,184 MJ·ha−1 for mobile irrigation systems (our calculation, based on irrigation features);
- milking equipment; embodied energy related to milking equipment has been estimated based on the number of stalls and clusters of milking parlors, using factors of 2161 MJ·stall−1 and 188 MJ·cluster−1, respectively [11]; additionally the results were increased by 12% to account for maintenance; the life span applied corresponded to 12 years; moreover, the indirect energy of cooling tanks was included in this group using the energy content of several cooling tanks and their capacity (adapted from Kraatz, 2012 [11]): EC = 0.012·tc2 − 0.214·tc + 2.036 where “EC” represents the annual indirect energy embodied in the cooling tank referring to per tonne of capacity, and “tc” represents the capacity of cooling tanks expressed in tonnes.
2.1.3. Agricultural Inputs
All the materials used in on-farm production processes, considered when calculating the indirect energy and carbon emissions (Table 2), were:
- mineral fertilizers, type (N, P2O5, K2O) and amount of nutrients incorporated into the soil for crop production were assessed using the factors obtained from Ecoinvent V3.3 [27,32];
- feed; the feed derived from on-farm production or purchased from outside of the farm; on-farm was accounted for considering the overall operations carried out for crop production (see Part 1), while extra-feed was accounted for, in MJ embodied energy, according to feed type purchased quantity;
- seeds, used for crop production, have been included in the overall assessment;
- plastics, usually used to wrap and cover silage feed products, were assessed per kg of plastic utilized, using factors obtained from Monahan et al. (2011) [12] and Kraatz (2012) [11];
- other; in this group, the pesticides and detergents were grouped together and analyzed using factors from Ecoinvent V3.3 [27] and Wells (2001) [26]; pesticides are used for crop protection, while detergents are used to clean the milking parlor equipment.
2.2. Indirect Energy and Carbon Footprint Indicators
The indices considered to express the embodied energy were related to the herd dimension (MJ·head−1; MJ·Lactating Cow−1 (LC)), to the land extent (MJ·hectare−1) and per unit of milk produced (MJ·kg FPCM−1). Similarly, the carbon indicators related to the emissions of CO2-eq were expressed as: kg CO2-eq·LC−1, kg CO2-eq·hectare−1, kg CO2-eq·head−1 and kg CO2-eq per kg FPCM−1.
2.3. Modelling Indirect Energy Requirements
Total indirect energy represents the overall yearly estimated embodied energy assessed at the farm level, which includes the categories related to buildings and facilities, fleet equipment and agricultural inputs. A linear regression model was developed in R Studio (Version 3.0.2, Boston, MA, USA) using total Embodied Energy (EE, MJ·year−1) as the response and total number of lactating cows, total number of heads, land area (hectares) and milk production (kg FPCM) as primary independent variables.
Due to the high correlation among the independent variables, a stepwise method has not been carried out. However, a correlation matrix was performed in order to avoid multicollinearity among variables and to identify the correlations among independent and dependent variables.
Second and third order polynomial terms of the total number of heads were tested through the Variance Inflation Factor (VIF) and Akaike Information Criterion (AIC) in order to measure the quality of a set of models. AIC values represent the information lost through the modelling process, which means that lower values of AIC were related to models that has less information loss.
Observing residuals, a significant heteroscedasticity was identified. For this reason, the dependent variable (EE) was power transformed (EET) as proposed by the Breusch and Pagan test [33]. The best power transformation was suggested, for the dependent variable, using the “SpreadLevelPlot” function.
Leave one out cross-validation [34] was select for the model evaluation. This method estimates the overall error on model prediction in terms of Mean Square Prediction Error (MSPE). The analysis of the MSPE was able to identify the systemic error comprising Mean Bias (MB), Slope Bias (SB) and unexplained Residual Bias (RB). The Root MSPE was then expressed as a percentage (RMSPE %) of the average observed embodied energy requirements.
3. Results and Discussion
3.1. Farm’s Indirect Energy
The results obtained from the indirect energy analyses at the farm level show, on average (Table 3), a yearly incidence of 125 GJ embodied in buildings and facilities, 283 GJ in machinery and 2051 GJ incorporated in agricultural inputs, expressed as an average per farm. As shown in Figure 1A, all the agricultural inputs represent 83% of the total indirect energy found at the farm level, whereas buildings and machinery contribute only 5% and 12%, respectively. Expressing the overall indirect energy as indicators, about 20,066 MJ·head−1 and 6130 MJ·t FPCM−1 are annually required on average.
Table 3.
Indirect energy data summary on a yearly basis, averages and standard deviation (N = 285).
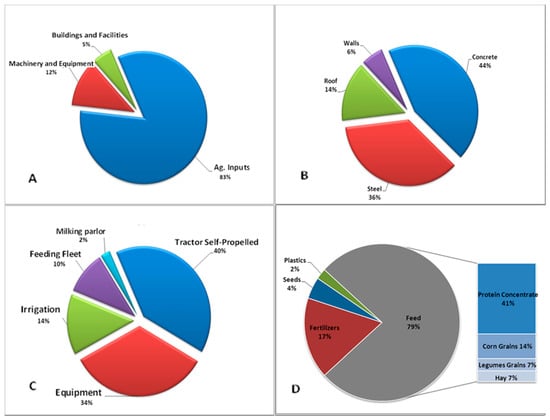
Figure 1.
The indirect energy results have been obtained for each category (A) and then distributed for each of them such as for building and facilities (B), machinery and equipment (C) and agricultural inputs (D).
Going deeply into the diverse uses of indirect energy in dairy farms, the analysis of each category shows the repartition of the principal components and the related weight.
Farm’s structures are mainly outlined with a reinforced concrete basement where the main structural frame, generally in steel or concrete, held the roof and the surrounding walls.
Figure 1B illustrates the incidence of the embodied energy of concrete (44%) and steel (36%), which represent the major construction materials in the building and facilities group, followed by roof (14%) and wall (6%) components. Steel and concrete contribute together 80% of the total embodied energy in buildings. Walls were mainly built with bricks or stones and rarely surrounded the total perimeter of the structures; thus, their influence in the related category in terms of embodied energy was only 6%. The analysis carried out on building and facilities involved 1670 structures, for which the average built area (m2), the related occupancy rate (m2·head−1) and the yearly embodied energy per square meter are outlined in Table 4. The most common structure found in farms was the cowshed (N = 754 facilities), with the largest average built area per cow being 11.2 m2·head−1. The yearly average embodied energy in farm buildings ranged from 22 MJ per m2 for silage silo to 55 MJ per m2 for cowshed and milking barns. The results found for the embodied energy in building and facilities were in the range of the results of other studies. In a German case study dairy farm (180 dairy cows), [11] reported a value of the energy embodied in livestock buildings between 380 and 670 MJ per animal place a year. William et al. (2006) [35], who focused on a representative set of farm buildings of different agricultural systems, found a range per year from 26–62 MJ per m2 of agricultural and dairy cattle buildings.
Table 4.
Building and facilities’ average areas expressed in square meters, occupancy rate expressed per cow raised and yearly indirect energy per unit of area.
The results obtained from machinery and equipment analysis (Figure 1C) underline the rank of self-propelled machinery (40%) and equipment (34%) used for crop cultivation and to carry out the overall on-farm operations. Nevertheless, irrigation systems (14%) occupied a worthy amount of embodied energy principally due to the large areas of irrigated land for maize silage and alfalfa hay production. Feeding fleets were characterized by the presence of mixer wagons and wheel loaders used for preparation and distribution of feed to cows, which represented about 10% of the total embodied energy of machinery. Contrary to expectations, milking parlor equipment and cooling tanks held a slight amount of embodied energy, participating only in about 2% to the total category’s portion. The yearly requirements of embodied energy in machinery accounted for 3080 MJ per head, a value that underlines the high level of mechanization of the investigated farms. A study conducted by Sefeedpari (2012) [19] on Iranian dairy farms reported about 1641 MJ per cow as the total energy inputs related to machinery. The indirect energy incorporated in the farm machinery and equipment reported as MJ per cultivated land indicates a yearly request of 9270 MJ per hectare, which is in the range of other studies. Similarly, Uzla (2012) [36] identified the annual average indirect energy for machines in specialized dairy farms ranging from 8405–11,680 MJ·ha−1.
Agricultural inputs represent the largest amount of indirect energy found at the farm level (Tables S1 and S2). As shown in Figure 1D, the consumption of feed covers almost 80% of the total indirect energy incidence of the category, followed by fertilizers (15%), while seeds and plastics affect 4% and 2%, respectively. One of the most purchased feeds was protein concentrate (41%) and corn grains (14%); other feed products such as beet pulp, nutritional supplements and vitamins were negligible and thus avoided in Figure 1D. The use of pesticides does not appear in the chart due to the relative low use of these products. Feed requirements have a high influence on the energetic cost of milk production as found also in a comparative study carried out in fifteen dairy farms located in Missouri (USA) and Emilia Romagna (Italy) by Pagani et al. (2016) [37].
3.2. Farm’s Indirect Energy Carbon Emissions
The environmental load of dairy farms has been generally expressed in terms of pollutant emitted through the production chain considering the direct emissions (related to the on-farm emissions), rather than emissions occurring during the production of components and materials used in the farm’s structure, machinery and materials. This work focused on assessing the emissions of carbon dioxide equivalent “embodied” in the materials and components used in the farm’s processes. As shown in Table 5, the yearly average per farm accounted for 175,557 kg CO2-eq corresponding to 381 kg CO2-eq per tonne of FPCM. Observing the results per category, materials embodied the main part of the emissions (86%) corresponding to 151,626 kg CO2-eq expressed as an average per farm per year. Buildings and machinery categories accounted respectively for 12,793 and 11,137 kg CO2-eq per farm corresponding to 32 and 43 kg of CO2-eq per tonne of FPCM, respectively.
Table 5.
Carbon dioxide emission data summary on a yearly basis, averages and standard deviation (N = 285).
To observe the indirect energy and emission trends among the investigated farms, energy and carbon dioxide records were elaborated according to four classes of milk yield production.
As shown in Table 6, the lowest number of farms (40) was located in the class of less than 5000 kg·LC−1, while most farms (88 and 85) were in the classes from 7000–9000 (kg·LC−1) and greater than 9000 (kg·LC−1), respectively. Observing the number of heads per class, a positive trend was found among classes, proving that large milk yield production was related to large herd size.
Table 6.
Indirect energy consumption and carbon dioxide emissions on a yearly basis, averages and standard deviation for milk yield classes (N = 285).
The largest farms were also linked to larger levels of indirect energy, 2848 GJ of cumulative indirect energy (class of > 9000) against 840 GJ (class of < 5000) and related CO2 emissions. However, when comparing total embodied energy and total emissions expressed as MJ and kg·CO2-eq per 100 kg of milk produced, a negative trend was found in larger farms, which held less requirements of indirect energy and emitted less carbon dioxide into the environment (from 57–33 kg·CO2-eq per 100 kg of FPCM).
3.3. Modeling Indirect Energy Requirements
The observed outcomes from embodied energy were significantly (p < 0.001) associated with the total number of heads and total number of heads cubed. Hence, these two variables were incorporated in the final model:
where EET is the average MJ of embodied energy per year per farm; Total heads denotes the total number of heads. The R2 of the model was 0.80, which specifies that the model can explain 80% of the variation in the embodied energy requirements in dairy farms.
EET = 90.42 + 0.52·Total heads − 8.47 × 10⁻⁷·Total heads3
Cross-validation results of the prediction error analysis showed a mean bias and slope bias equal to zero and a root mean square prediction error (RMSPE) of 13.29% of the average observed value, while the non-systematic bias (RB) was 100%. Hence, the regression model is capable of predicting the embodied energy requirements in dairy farms with a relatively slight error.
Figure 2A shows the regression line of the observed values against predicted values, which overlaps the line of unity (slope = 1). This result shows that the model might predict the indirect energy requirements without under- or over-prediction error. Figure 2B shows the regression line of the standardized residuals against predicted values, which overlays the line crossing zero residuals. The standardized residuals did not display any evident outline, attesting to the homoscedasticity of the residuals (random distribution).
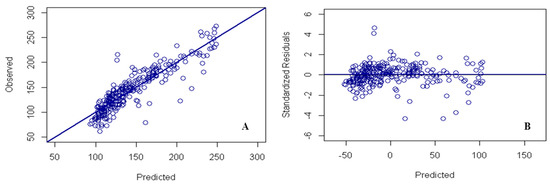
Figure 2.
Prediction accuracy evaluation plot (A) and standardized residual evaluation plot (B) of indirect energy requirements.
The model developed represents an important tool for estimating the indirect energy requirements of dairy cattle farms, which could help researchers to include indirect energy inputs in advanced milk life cycle assessment studies.
Modelling of direct energy data has been previously performed by the author (Todde et al., 2017) [38] using linear models to predict diesel and electricity consumption in dairy farms and to develop the Dairy Energy Prediction (DEP) tool to estimate direct energy inputs and carbon emissions from dairy cattle farms. The direct energy requirements of dairy farms have been modelled also by Upton et al. (2014) [39] with a mechanistic model and by Sefeedpari et al. (2014) [40], who modelled electricity and fuel using an adaptive neural-fuzzy inference system technique.
4. Overall Direct and Indirect Energy Requirements and Related Carbon Footprint
In this two-part series, a comprehensive analysis of direct [41] and indirect energy requirements in conventional dairy farms has been carried out. The overall results (Part 1 and Part 2) are reported in Figure 3. The total energy demand, expressed in GJ per farm, shows that the largest quota of the annual requirements, for each milk yield class, is due to agricultural inputs (from 626–3225 GJ·y−1) and diesel fuel consumption (from 363–940 GJ·y−1). Direct and indirect energy requirements increased as the farm’s size and milk yield increased, going from 1302–5109 GJ·y−1. However, the associated carbon dioxide emissions expressed per 100 kg of milk produced showed a negative trend going from the class of <5000–>9000 kg of milk, indicating that larger farms were able to emit 48% less carbon dioxide than small herd size farms (43 vs. 82 kg CO2-eq per 100 kg FPCM).
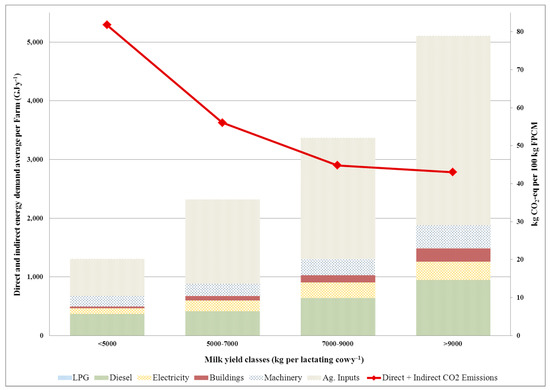
Figure 3.
Direct and indirect energy requirements expressed as the average per dairy farm (GJ·y−1) and related direct and indirect carbon emissions per 100 kg of milk produced.
Annual direct and indirect energy requirements have been summed together and expressed per functional units obtaining about 27.7 and 97.6 GJ per raised head and per hectare, respectively; while total energy demand per tonne of FPCM accounted for 8.65 GJ·y−1. The related yearly direct and indirect emissions of carbon dioxide amounted to 1790 kg CO2-eq per head and 6313 kg CO2-eq per cultivated hectare, while 537 kg CO2-eq·y−1 were emitted to produce one tonne of FPCM.
5. Conclusions
One of the most adopted procedures to address the environmental impact of dairy cattle farms is represented by the life cycle assessment methodology. A multitude of studies has been carried out in the last few years using different approaches, which may lead to discordant results. As defined by several authors, the indirect energy inputs, referring to capital goods, are usually excluded from the LCA of dairy farms due to the lack of information in the literature and erroneously assuming similarity among farms. The results obtained in this study and the results reported in Part 1 outline the incidence of the direct and indirect energy requirements in dairy cattle farms. Hence, the indirect energy, expressed as MJ per tonne of milk produced, was 2.4-times greater than the direct energy consumptions.
The current study aimed to enlarge the knowledge about the indirect energy requirements of dairy cattle farms and related carbon footprint referring to machinery, buildings and agricultural inputs. The investigation highlights the importance of and the weight related to the use of agricultural inputs, which represent more than the 80% of the total indirect energy requirements. Moreover, the analyses carried out underline that the assumption of similarity in terms of requirements of indirect energy and related carbon emissions among dairy farms is incorrect especially when observing different farm sizes and milk production levels. Finally, the requirements of indirect energy of dairy farms have been modelled in order to provide an instrument to allow researchers to estimate and assess the energy incorporated into farm machinery, agricultural inputs and buildings. This will help to include this kind of information in future milk LCA studies primarily referring to Mediterranean dairy systems.
Supplementary Materials
The following are available online at http://www.mdpi.com/1996-1073/11/2/463/s1, Table S1: Type and quantity (tonnes of wet basis) of purchased feed expressed as the average ± standard deviation per farm, Table S2: Type and quantity (kg) of purchased seeds, pesticides and fertilizers expressed as the average ± standard deviation per farm.
Acknowledgments
The present work is part of the “Dairy Carbon Footprint Project” funded by the “Filiera AQ s.r.l”. The authors are grateful to the 3A, ProgettoNatura, Granlatte and Assolac dairy plant co-operative and their technician, who kindly collected and provided the farm data.
Author Contributions
G.T., L.M., M.C. and A.P. conceived and designed the experiments; G.T., L.M. and M.C. did data collection; G.T., L.M. and M.C. analyzed the data and wrote the paper; G.T., L.M., M.C. and A.P. revisioned the article for the final approval of the version to be published.
Conflicts of Interest
The authors declare no conflict of interest.
References
- Jones, N. How the World Passed a Carbon Threshold and Why It Matters. Published at the Yale School of Forestry & Environmental Studies. 2017. Available online: http://e360.yale.edu/features/how-the-world-passed-a-carbon-threshold-400ppm-and-why-it-matters (accessed on 28 May 2017).
- Lockeretz, W. Agriculture and Energy; Washington University through Academic Press: New York, NY, USA, 1977. [Google Scholar]
- International Organization for Standardization (ISO). Greenhouse Gases–Part 1: Specification with Guidance at the Organization Level for Quantification and Reporting of Greenhouse Gas Emissions and Removals; European Standard, ISO 14064-1; ISO: Geneva, Switzerland, 2012. [Google Scholar]
- International Organization for Standardization (ISO). Technical Specification. Greenhouse Gases–Carbon Footprint of Products–Requirements and Guidelines for Quantification and Communication; European Standard, ISO/TS 14067; ISO/TS: Geneva, Switzerland, 2013. [Google Scholar]
- International Organization for Standardization (ISO). Environmental Management-Life Cycle Assessment–Principles and Framework; European Standard, ISO 14040; ISO: Geneva, Switzerland, 2006. [Google Scholar]
- International Organization for Standardization (ISO). Environmental Management-Life Cycle Assessment–Requirements and Guidelines; European Standard, ISO 14044; ISO: Geneva, Switzerland, 2006. [Google Scholar]
- Meul, M.; Van Middelaar, C.E.; de Boer, I.J.M.; Van Passel, S.; Fremaut, D.; Haesaert, G. Potential of life cycle assessment to support environmental decision making at commercial dairy farms. Agric. Syst. 2014, 131, 105–115. [Google Scholar] [CrossRef]
- O’Brien, D.; Shalloo, L.; Patton, J.; Buckley, F.; Grainger, C.; Wallace, M. A life cycle assessment of seasonal grass-based and confinement dairy farms. Agric. Syst. 2012, 107, 33–46. [Google Scholar] [CrossRef]
- Baldini, C.; Gardoni, D.; Guarino, M. A critical review of the recent evolution of Life Cycle Assessment applied to milk production. J. Clean. Prod. 2017, 140, 421–435. [Google Scholar] [CrossRef]
- Schramski, J.R.; Jacobsen, K.L.; Smith, T.W.; Williams, M.A.; Thompson, T.M. Energy as a potential systems-level indicator of sustainability in organic agriculture: Case study model of a diversified, organic vegetable production system. Ecol. Model. 2013, 267, 102–114. [Google Scholar] [CrossRef]
- Kraatz, S. Energy intensity in livestock operations–Modeling of dairy farming systems in Germany. Agric. Syst. 2012, 110, 90–106. [Google Scholar] [CrossRef]
- Monahan, J.; Powell, J.C. An embodied carbon and energy analysis of modern methods of construction in housing: A case study using a lifecycle assessment framework. Energy Build. 2011, 43, 179–188. [Google Scholar] [CrossRef]
- Hammond, G.P.; Jones, C.I. Embodied energy and carbon in construction materials. Proc. Inst. Civ. Eng.-Energy 2008, 161, 87–98. [Google Scholar] [CrossRef]
- Koesling, M.; Ruge, G.; Fystro, G.; Torp, T.; Hansen, S. Embodied and operational energy in buildings on 20 Norwegian dairy farms–Introducing the building construction approach to agriculture. Energy Build. 2015, 108, 330–345. [Google Scholar] [CrossRef]
- Murgia, L.; Todde, G.; Caria, M.; Pazzona, A. A partial life cycle assessment approach to evaluate the energy intensity and related greenhouse gas emission in dairy farms. J. Agric. Eng. 2013, 44. [Google Scholar] [CrossRef]
- Sørensen, C.G.; Halberg, N.; Oudshoorn, F.W.; Petersen, B.M.; Dalgaard, R. Energy inputs and GHG emissions of tillage systems. Biosyst. Eng. 2014, 120, 2–14. [Google Scholar] [CrossRef]
- Nassiri, S.M.; Singh, S. Study on energy use efficiency for paddy crop using data envelopment analysis (DEA) technique. Appl. Energy 2009, 86, 1320–1325. [Google Scholar] [CrossRef]
- Hülsbergen, K.J.; Feil, B.; Biermann, S.; Rathke, G.W.; Kalk, W.D.; Diepenbrock, W. A method of energy balancing in crop production and its application in a long-term fertilizer trial. Agric. Ecosyst. Environ. 2014, 86, 303–321. [Google Scholar] [CrossRef]
- Sefeedpari, P. Assessment and optimization of energy consumption in dairy farms: Energy efficiency. Iran. J. Energy Environ. 2012, 3, 213–224. [Google Scholar] [CrossRef]
- Roer, A.G.; Johansen, A.; Kjersti Bakken, A.; Daugstad, K.; Fystro, G.; Hammer Strømman, A. Environmental impacts of combined milk and meat production in Norway according to a life cycle assessment with expanded system boundaries. Livest. Sci. 2013, 155, 384–396. [Google Scholar] [CrossRef]
- Todde, G.; Murgia, L.; Caria, M.; Pazzona, A. A multivariate statistical analysis approach to characterize mechanization, structural and energy profile in Italian dairy farms. Energy Rep. 2016, 2, 129–134. [Google Scholar] [CrossRef]
- International Dairy Federation (IDF). A Common Carbon Footprint Approach for Dairy, The IDF Guide to Standard Lifecycle Assessment Methodology for the Dairy Sector; Bulletin of International Dairy Federation: Brussels, Belgium, 2010; Volume 445, ISSN 0250-5118. [Google Scholar]
- Gustavsson, L.; Joelsson, A.; Sathre, R. Life cycle primary energy use and carbon emission of an eight-storey wood-framed apartment building. Energy Build. 2010, 42, 230–242. [Google Scholar] [CrossRef]
- Venkatarama Reddy, B.V.; Jagadish, K.S. Embodied energy of common and alternative building materials and technologies. Energy Build. 2003, 35, 129–137. [Google Scholar] [CrossRef]
- Dalgaard, T.; Halberg, N.; Porter, J.R. A model for fossil energy use in Danish agriculture used to compare organic and conventional farming. Agric. Ecosyst. Environ. 2001, 87, 51–65. [Google Scholar] [CrossRef]
- Wells, C. Total Energy Indicators of Agricultural Sustainability: Dairy Farming Case Study; Technical Paper 2001/3; Ministry of Agriculture and Forestry: Wellington, New Zeland, 2011; ISBN 0-478-07968-0. ISSN 1171-4662. [Google Scholar]
- Wernet, G.; Bauer, C.; Steubing, B.; Reinhard, J.; Moreno-Ruiz, E.; Weidema, B. The ecoinvent database version 3 (part I): Overview and methodology. Int. J. Life Cycle Assess. 2016, 21, 1218–1230. [Google Scholar] [CrossRef]
- Deike, S.; Pallutt, B.; Christen, O. Investigations on the energy efficiency of organic and integrated farming with specific emphasis on pesticide use intensity. Eur. J. Agron. 2008, 28, 461–470. [Google Scholar] [CrossRef]
- Rotz, C.A.; Montes, F.; Chianese, D.S. The carbon footprint of dairy production systems through partial life cycle assessment. J. Dairy Sci. 2010, 93, 1266–1282. [Google Scholar] [CrossRef] [PubMed]
- Romanelli, T.; Milan, M. Energy performance of a production system of eucalyptus. Rev. Bras. Eng. Agric. Ambient. 2010, 14, 896–903. [Google Scholar] [CrossRef]
- Diotto, A.V.; Folegatti, M.V.; Duarte, S.N.; Romanelli, T.L. Embodied energy associated with the materials used in irrigation systems: Drip and centre pivot. Biosyst. Eng. 2014, 121, 38–45. [Google Scholar] [CrossRef]
- Sartori, L.; Basso, B.; Bertocco, M.; Oliviero, G. Energy Use and Economic Evaluation of a Three Year Crop Rotation for Conservation and Organic Farming in NE Italy. Biosyst. Eng. 2005, 91, 245–256. [Google Scholar] [CrossRef]
- Breusch, T.S.; Pagan, A.R. A simple test for heteroscedasticity and random coefficient variation. Econom. J. Econom. Soc. 1979, 47, 1287–1294. [Google Scholar] [CrossRef]
- Kohavi, R. A Study of Cross-Validation and Bootstrap for Accuracy Estimation and Model Selection. In Proceedings of the 14th International Joint Conference on Artificial Intelligence, Montreal, QC, Canada, 20–25 August 1995; pp. 1137–1143. [Google Scholar]
- Williams, A.G.; Audsley, E.; Sandars, D.L. Determining the Environmental Burdens and Resource Use in the Production of Agricultural and Horticultural Commodities; Main Report; Defra Research Project IS0205; Cranfield University and Defra: Bedford, UK, 2006. [Google Scholar]
- Uzal, S. Comparison of the Energy Efficiency of Dairy Production Farms Using Different Housing Systems. Environ. Prog. Sustain. Energy 2012, 32, 1202–1208. [Google Scholar] [CrossRef]
- Pagani, M.; Vittuari, M.; Johnson, T.G.; De Menna, F. An assessment of the energy footprint of dairy farms in Missouri and Emilia-Romagna. Agric. Syst. 2016, 145, 116–126. [Google Scholar] [CrossRef]
- Todde, G.; Murgia, L.; Caria, M.; Pazzona, A. Dairy Energy Prediction (DEP) model: A tool for predicting energy use and related emissions and costs in dairy farms. Comput. Electron. Agric. 2017, 135, 216–221. [Google Scholar] [CrossRef]
- Upton, J.; Murphy, M.; Shalloo, L.; Groot Koerkamp, P.W.G.; De Boer, I.J.M. A mechanistic model for electricity consumption on dairy farms: Definition, validation, and demonstration. J. Dairy Sci. 2014, 97, 4973–4984. [Google Scholar] [CrossRef] [PubMed]
- Sefeedpari, P.; Rafiee, S.; Akram, A.; Pishgar Komleh, S.H. Modeling output energy based on fossil fuels and electricity energy consumption on dairy farms of Iran: Application of adaptive neural-fuzzy inference system technique. Comput. Electron. Agric. 2014, 109, 80–85. [Google Scholar] [CrossRef]
- Todde, G.; Murgia, L.; Caria, M.; Pazzona, A. A Comprehensive Energy Analysis and Related Carbon Footprint of Dairy Farms, Part 1: Direct Energy Requirements. Energies 2018, 11, 451. [Google Scholar] [CrossRef]
© 2018 by the authors. Licensee MDPI, Basel, Switzerland. This article is an open access article distributed under the terms and conditions of the Creative Commons Attribution (CC BY) license (http://creativecommons.org/licenses/by/4.0/).