Article

Effect of Surface Thermal Resistance on the Simulation Accuracy of the Condensation Risk Assessment for a High-Performance Window

Department of Architectural Engineering, Ewha Womans University, 52 Ewhayeodae-gil, Seodaemun-gu, Seoul 03760, Korea
*
Author to whom correspondence should be addressed.
Energies 2018, 11(2), 382; https://doi.org/10.3390/en11020382
Submission received: 27 December 2017 / Revised: 21 January 2018 / Accepted: 2 February 2018 / Published: 7 February 2018

Abstract

:
The accuracy of condensation risk assessment depends on the accuracy of the measured or calculated temperatures. The existing 2D simulation method provides sufficiently accurate results for evaluating average performance values, such as U-values. However, the accuracy of predicting the temperatures in the local areas such as the edge-of-glazing and the frame has been questioned. This study analyzes the effect of the surface thermal resistance on the accuracy of the condensation risk assessment for high-performance windows. Experiments and three-dimensional simulations were performed for a triple-glazed window. The differences in results between the basic experimental test and the simulations with several different applied boundary conditions were analyzed. The results show that, in the simulations, a small change in the surface thermal resistance has no significant effect on the accuracy of the condensation risk assessment of the center-of-glazing or the frame. However, for the edge-of-glazing, the accuracy of predicting the condensation risk was significantly improved by using the increased local surface thermal resistance with the simulation. By employing the reduced radiation and convection at the edges or junctions between two surfaces, the error between the measured and calculated temperature factors can be reduced to less than 3%.

1. Introduction

Recent progress in window technology has enabled the development of advanced windows with a U-value of approximately 0.7–1.0 W/m2K [1]. However, improvements in insulation performance have not completely solved the problem of condensation on the internal surface of windows in cold climates. When the indoor humidity is not adequately controlled, even a high-performance window is likely to form condensation on its surface. One of the main considerations in the selection of a window is minimizing condensation on the internal surface.
There are several different indicators for a condensation risk assessment of a window in different countries. The international organization for standardization (ISO) uses temperature factor (fRsi) for a condensation risk assessment [2]. Many European countries, such as France, Germany, the Netherlands, Austria, and the UK use the temperature factor as an indicator for their building design criteria to prevent inside surface condensation [3,4,5,6,7]. Korea uses the temperature difference ratio (TDR) obtained from a similar equation with the temperature factor [8]. The National Fenestration Rating Council (NFRC) has developed condensation resistance (CR). The condensation resistance scale is 1 to 100, with a lower number representing a greater condensation risk [9]. The temperature factor was selected as the indicator to perform a condensation risk assessment in this paper. The temperature factor is a construction specific value, which is independent of any temperature difference between interior and exterior environmental conditions. The internal surface temperature is used as an input to calculate the temperature factor.
Triple-glazed windows are widely used in cold climate countries, like Sweden and Norway. The Passive House standard, which is a building standard for low energy use, requires a window U-value of no more than 0.80 W/m2K in the cool temperate climate zone [10]. A fenestration energy efficiency rating system has been adopted in Korean building codes since 2012. It requires window U-value of no more than 1.00 W/m2K for the highest rated window, which implies that double glazed windows are no more enough to meet the standards.
Spacer bars for windows have traditionally been made of aluminum or galvanized steel. These metal spacer bars have high thermal conductivity and, thus, create a thermal bridge on the interior glazing surface in the edge-of-glazing area. Insulating spacers have been introduced to reduce heat loss caused by the thermal bridge in the edge-of-glazing. Previous research has shown that improving spacers could significantly reduce the energy lost through multi-pane windows [11,12,13]. In high-performance windows, such as triple-glazed windows, insulating spacers can reduce window U-value by 12% compared to the U-value with aluminum spacers [11]. Insulating spacers offer stronger thermal performance, but they still represent a thermal bridge that influences the thermal performance of a window [14].
Although the thermal performance of windows is still evaluated by traditional experimental methods, recent advancements in computer tools allow the use of more efficient simulation methods. Window evaluations are typically undertaken using two-dimensional heat transfer tools, such as THERM. Various algorithms have been developed to perform more realistic simulations, and many studies have been performed to evaluate the accuracy of computer-simulated results.
Shin et al. [12] showed that a two-box model could be useful for the two-dimensional thermal simulations to investigate the impact of the spacers on the window thermal performance. Arasteh et al. [15] used five different laboratories and six different simulators to evaluate the thermal transmittance (Uw) of 16 windows. The agreement among the simulations was more than three times higher than the agreement among the experimental results, and the agreement between the tests and the simulations was reasonable. Gustavsen et al. [16] compared test and simulation data of the total window thermal transmittance (Uw) and glazing temperature of double-glazed argon-filled windows. The windows’ thermal transmittance showed a quite good agreement between the test and simulation results. In the case of the glazing surface temperature, however, poor agreement was found for the interior edge-of-glass region. In particular, the windows with an insulating spacer showed a larger difference between the measured and simulated temperatures than those with a conventional aluminum spacer. Gustavsen et al. [17] noted that although the algorithms defined in ISO 15099 [18] and ISO 10077-2 [19] are relatively accurate for windows with U-values of approximately 2.0 W/m2K, they are not adequate for accurately evaluating the heat transfer through the low-conductance frames. Gustavsen et al. [20] used a two-dimensional heat transfer analysis tool based on the algorithm in ISO 15099 to calculate the thermal transmittance of the high-performance frames. In every case, the measured value of thermal transmittance was higher than the calculated value. In particular, the PVC frame had more than twice the error percentage for the measurement relative to the aluminum frame. When calculating window temperatures using THERM, Kohler et al. [21] showed that the heat transfer coefficient and the convective heat transfer inside the glazing cavity have a strong effect on the accuracy of the calculated temperatures.
Generally, the experimental method for a condensation risk assessment requires the use of standardized environmental conditions such as interior temperature, exterior temperature, relative humidity, and wind speed. For example, the condensation resistance (CR) of NFRC is determined based on the outside conditions of −18 °C with a 5.5 m/s wind and inside conditions of 21 °C with indoor relative humidity of 30%, 50%, and 70% [9]. The thermal surface resistances are not specified in the environmental conditions for the experiment. For the simulation method, the surface thermal resistances are referenced as a fixed combined coefficient or calculated using a detailed algorithm. Thus, the surface thermal resistance is one of the important factors affecting the accuracy of simulated results.
From the literature review, it is clear that the existing simulation method of using two-dimensional thermal analysis tools, such as THERM, can be expected to achieve a satisfactory level of accuracy in predicting the total window thermal transmittance or the temperature of the center-of-glazing. However, the accuracy of the simulated results is relatively low for the edge-of-glazing area, which is most vulnerable to condensation, particularly for high-performance windows.
The two-dimensional heat transfer model was used in previous studies. Since the thermal bridging area is characterized by multi-dimensional heat transfer, two-dimensional heat transfer model might limit the accuracy of the calculation. Also, the effect of the surface thermal resistance of the thermal bridging area was not considered in previous studies. The warm side surface thermal resistance depends on the product tested and laboratory hot box setup [22]. However, in the simulation, the conventional coefficient was used in the previous method.
The aim of our study was to investigate the effect of surface thermal resistances on the simulation accuracy for the condensation risk assessment of the thermal bridging area. The study was particularly focused on high performance triple glazed windows. The experiment was performed according to the Korean national standard for the test method of dew condensation for windows. The simulations were performed to find the surface thermal resistances reflecting the experimental conditions in a satisfactory way. Several different surface thermal resistances were applied to the simulation to calculate the internal surface temperatures of a window and analyze the condensation risk. Three-dimensional (3D) simulations were performed, and the simulated results were compared with the experimental measurements.

2. Methods

2.1. Assessment of Condensation Risk

A triple-glazed window with a polyvinyl chloride (PVC) frame was evaluated to determine the condensation risk. A thermoplastic spacer (TPS) was applied to the window, which was the organic polyisobutylene spacer without metal insert, desiccant filling and butyl coating [23]. Figure 1 shows the spacer bar assemblies of a conventional aluminum spacer and a thermoplastic spacer. The glazing unit consisted of three 5-mm thick glass panes separated by a 12 mm wide gap filled with 90% argon and 10% air. The outermost and innermost glass had a low-emissivity coating (emissivity = 0.03) facing the glazing cavity. The window thermal transmittance was 0.98 W/m2K from the calculation according to ISO 15099 using WINDOW/THERM 6.3 [24,25,26]. As shown in Figure 2, the window measured 2 m × 2 m (W × H) and consisted of a tilt-and-turn window combined with a fixed window.
The risk of possible surface condensation was assessed using the temperature factor fRsi, as defined in ISO 10211 [2]. The temperature factor expresses the surface temperature in dimensionless form in accordance with Equation (1). The closer the factor is to one, the better the thermal performance.
f R s i ( x ,   y ,   z ) =   θ s i ( x , y , z ) θ e θ i θ e
where fRsi(x, y, z) is the temperature factor at the internal surface at point (x, y, z), θsi(x, y, z) is the temperature at the internal surface at point (x, y, z), θi is the internal temperature, and θe is the external temperature.
To compare the experimental and simulation results, five assessment points were selected from the fixed window because it is less affected by variables, such as air leakage or operating hardware, that were omitted from the simulation. The assessment points were selected from the center-of-glazing, frame, and the bottom edge of the glazing, which tends to be more vulnerable to condensation than the top edge due to temperature stratification. The edge-of-glazing was defined as the area of glazing where multi-dimensional heat transfer effects dominate [9]. Generally, it is defined as the region of the view area less than 63.5 mm from the sight line [27]. In this study, the assessment points of the edge portion were determined to be 2 cm from the sight line according to the Korean national standard [28], as described in Figure 2.

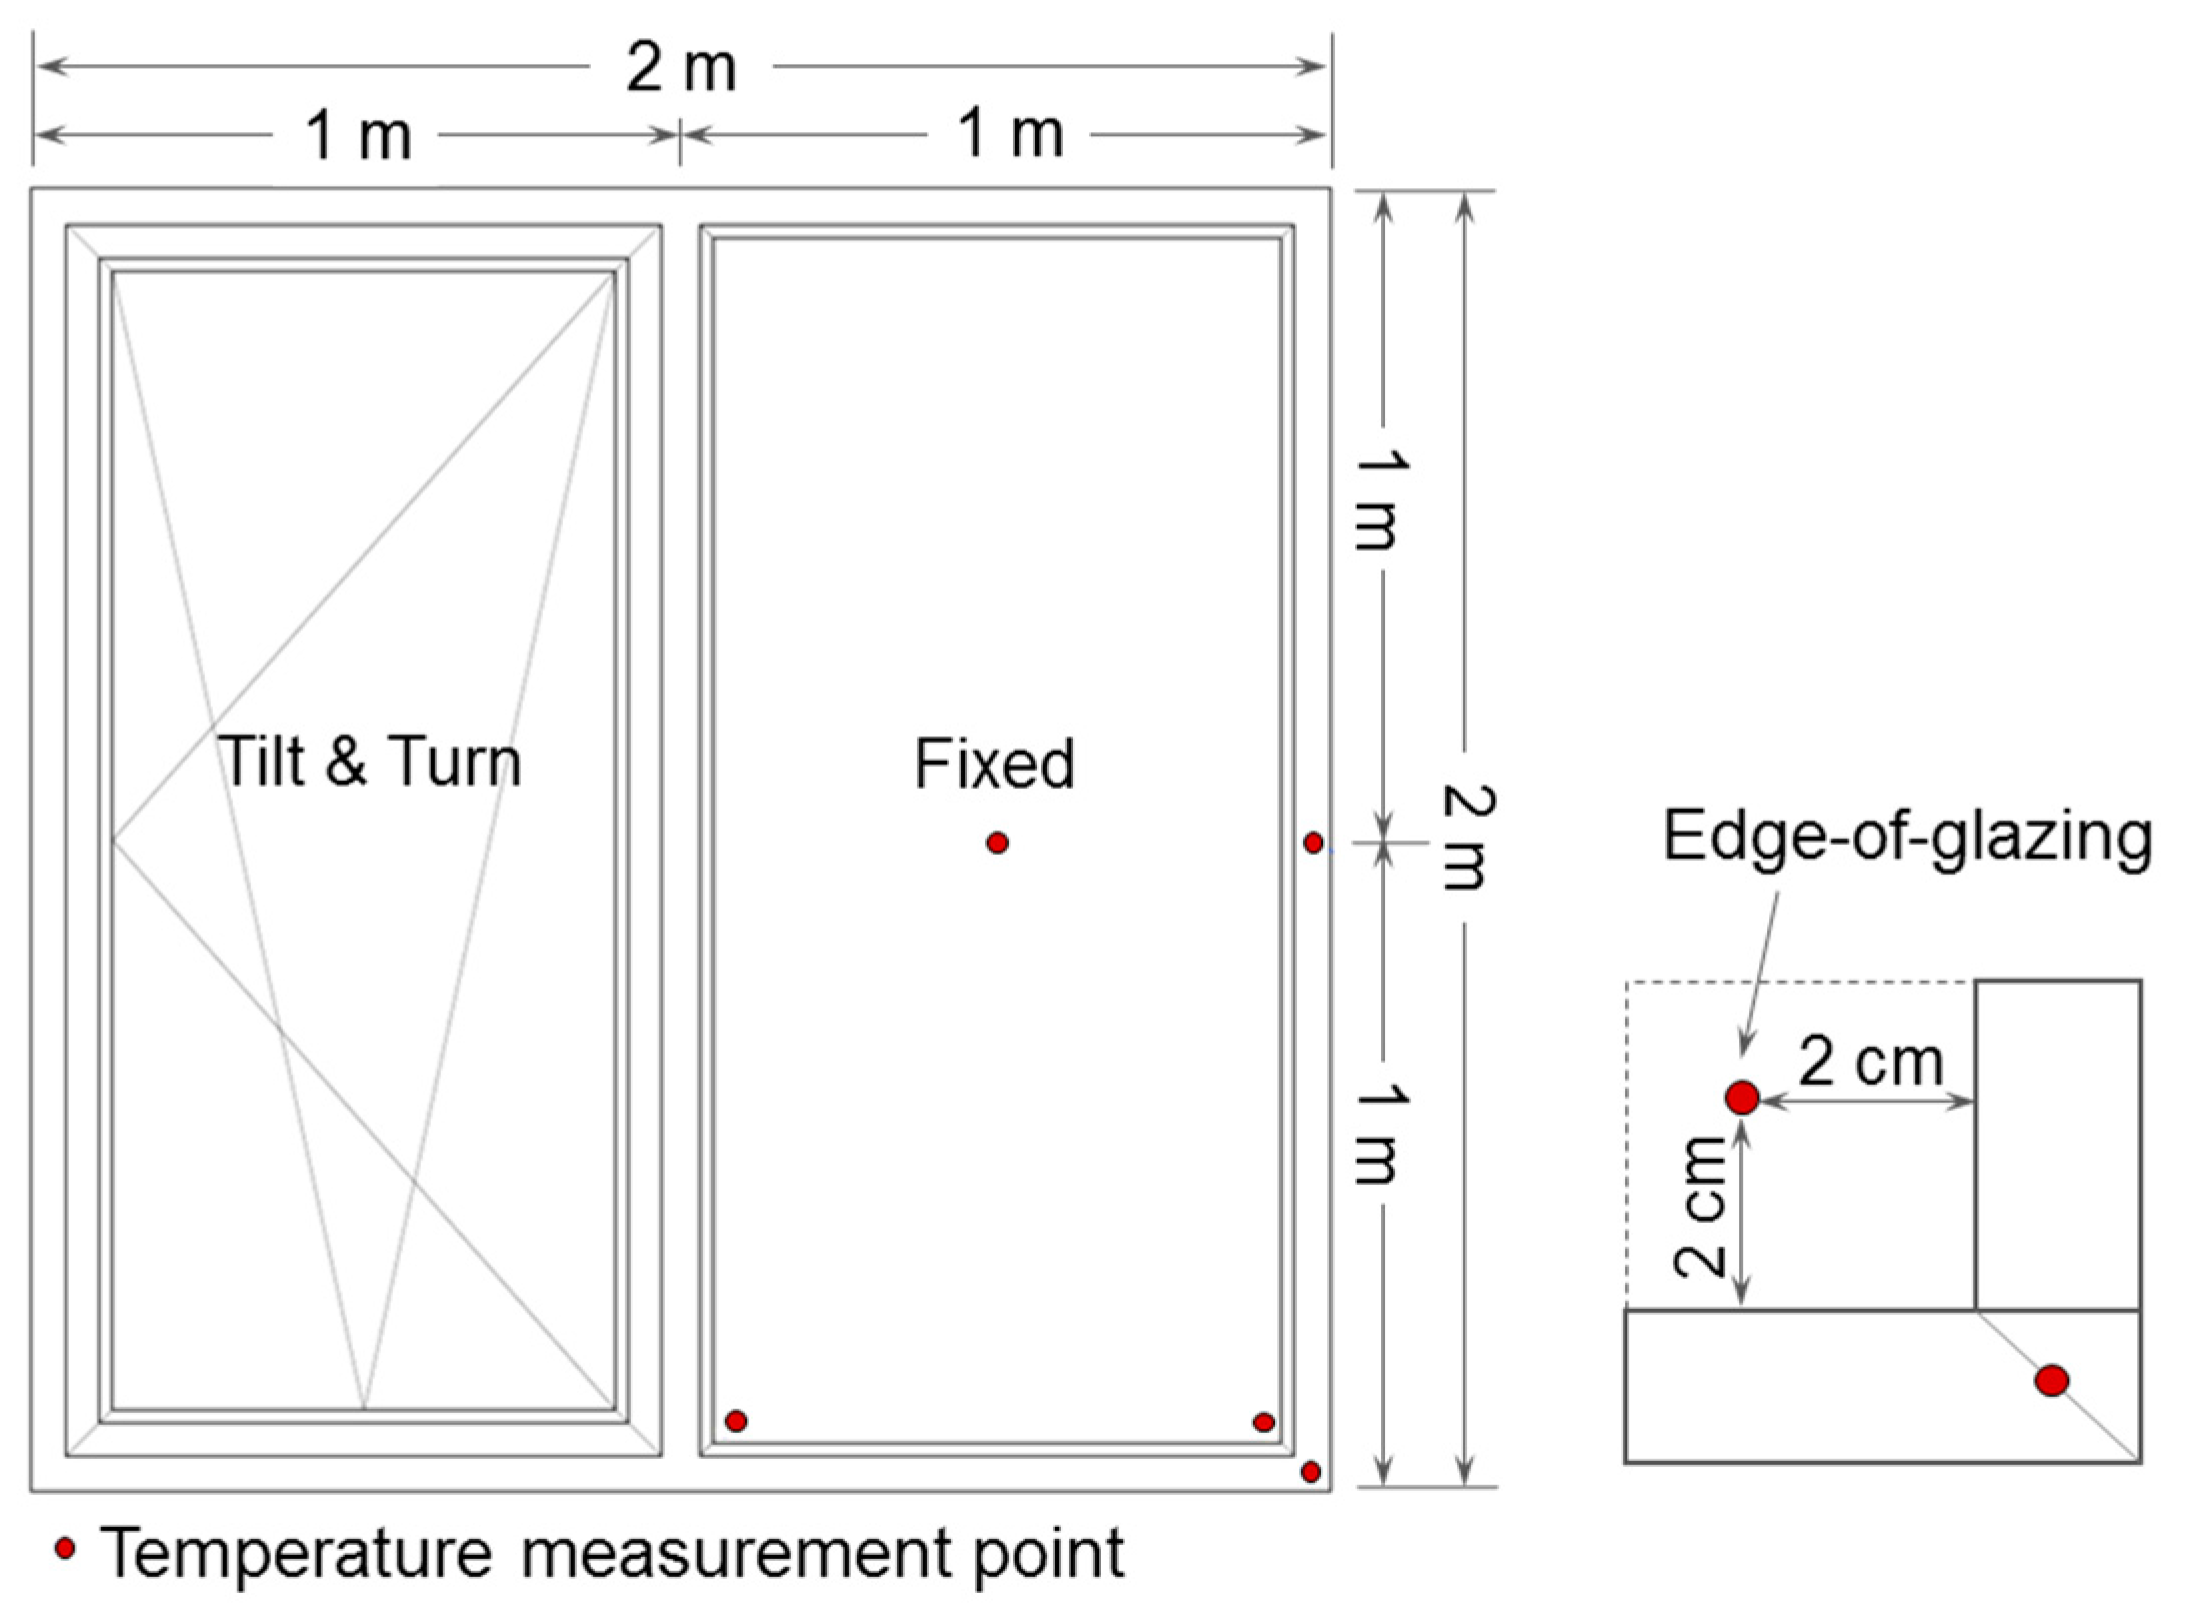
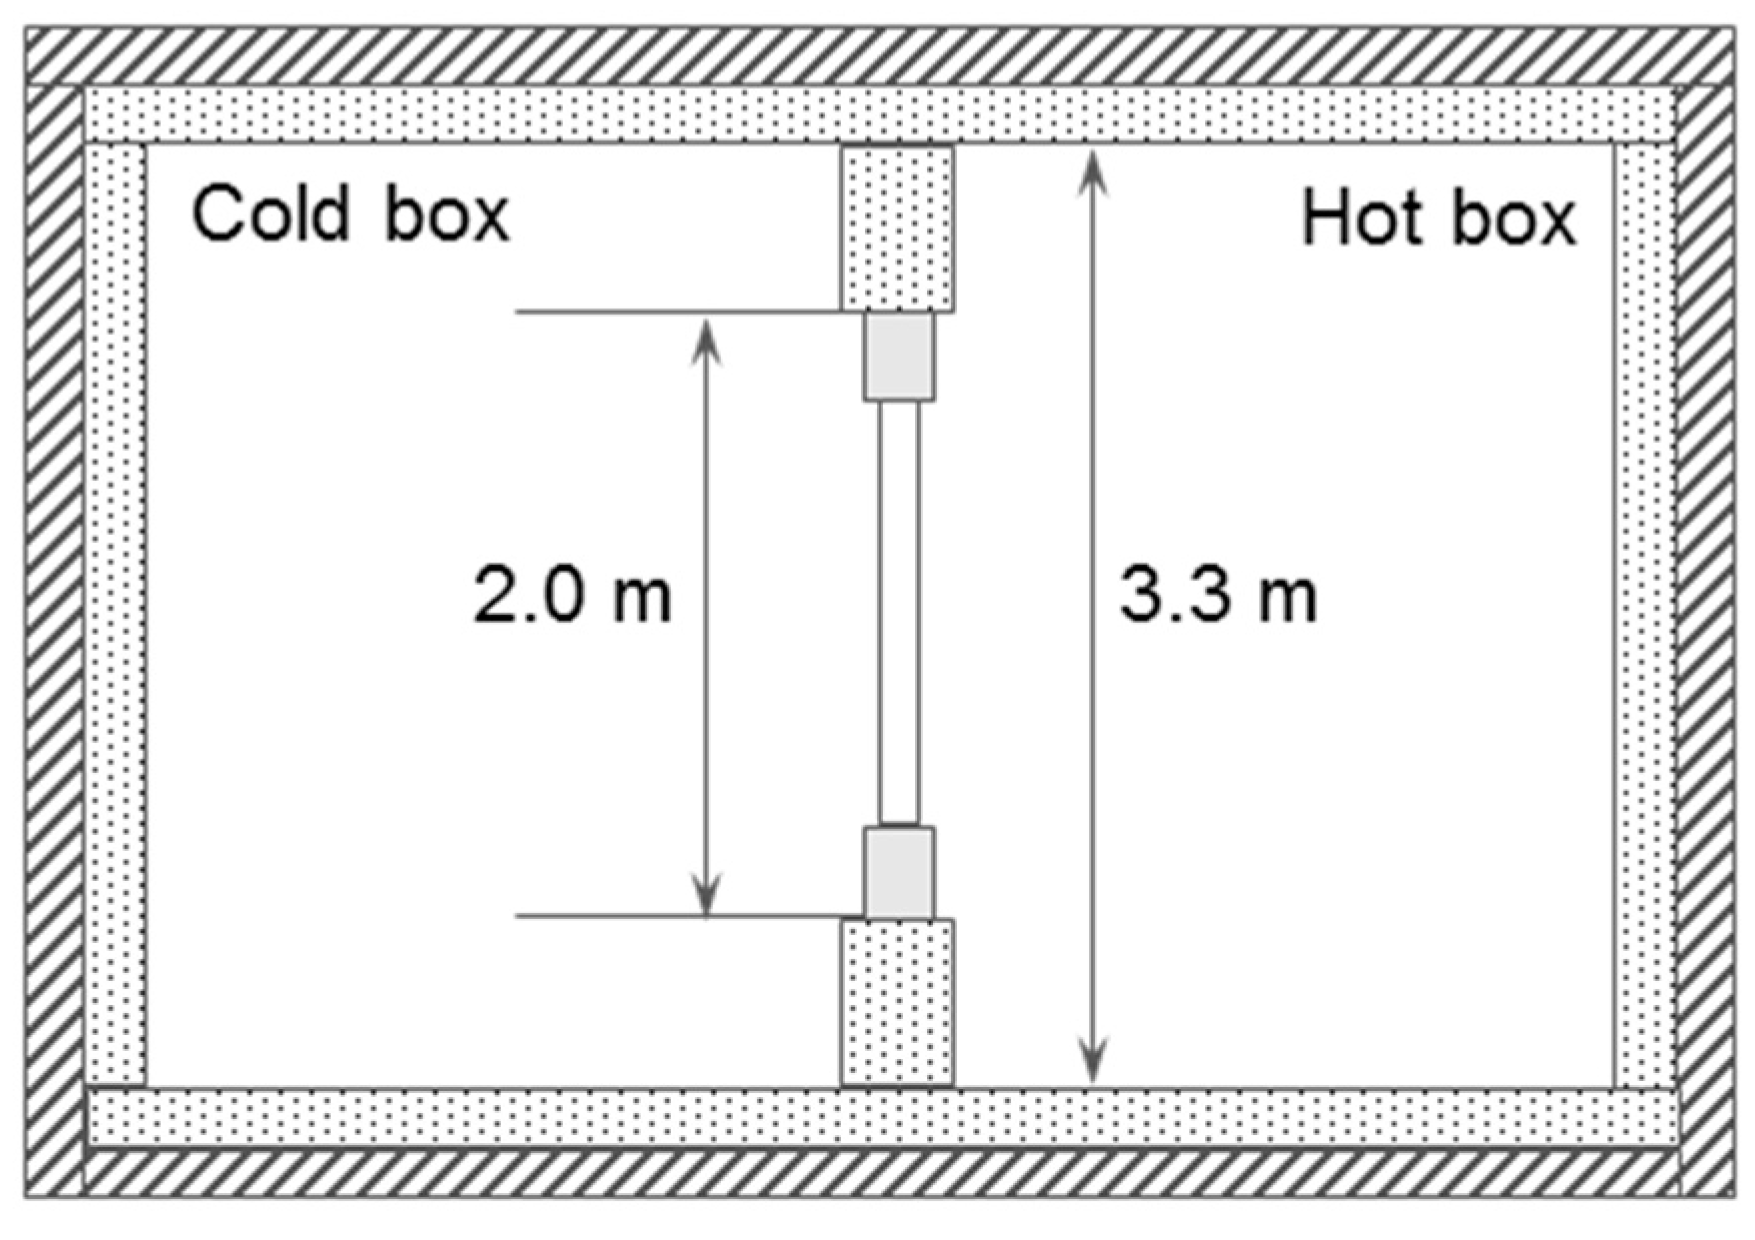
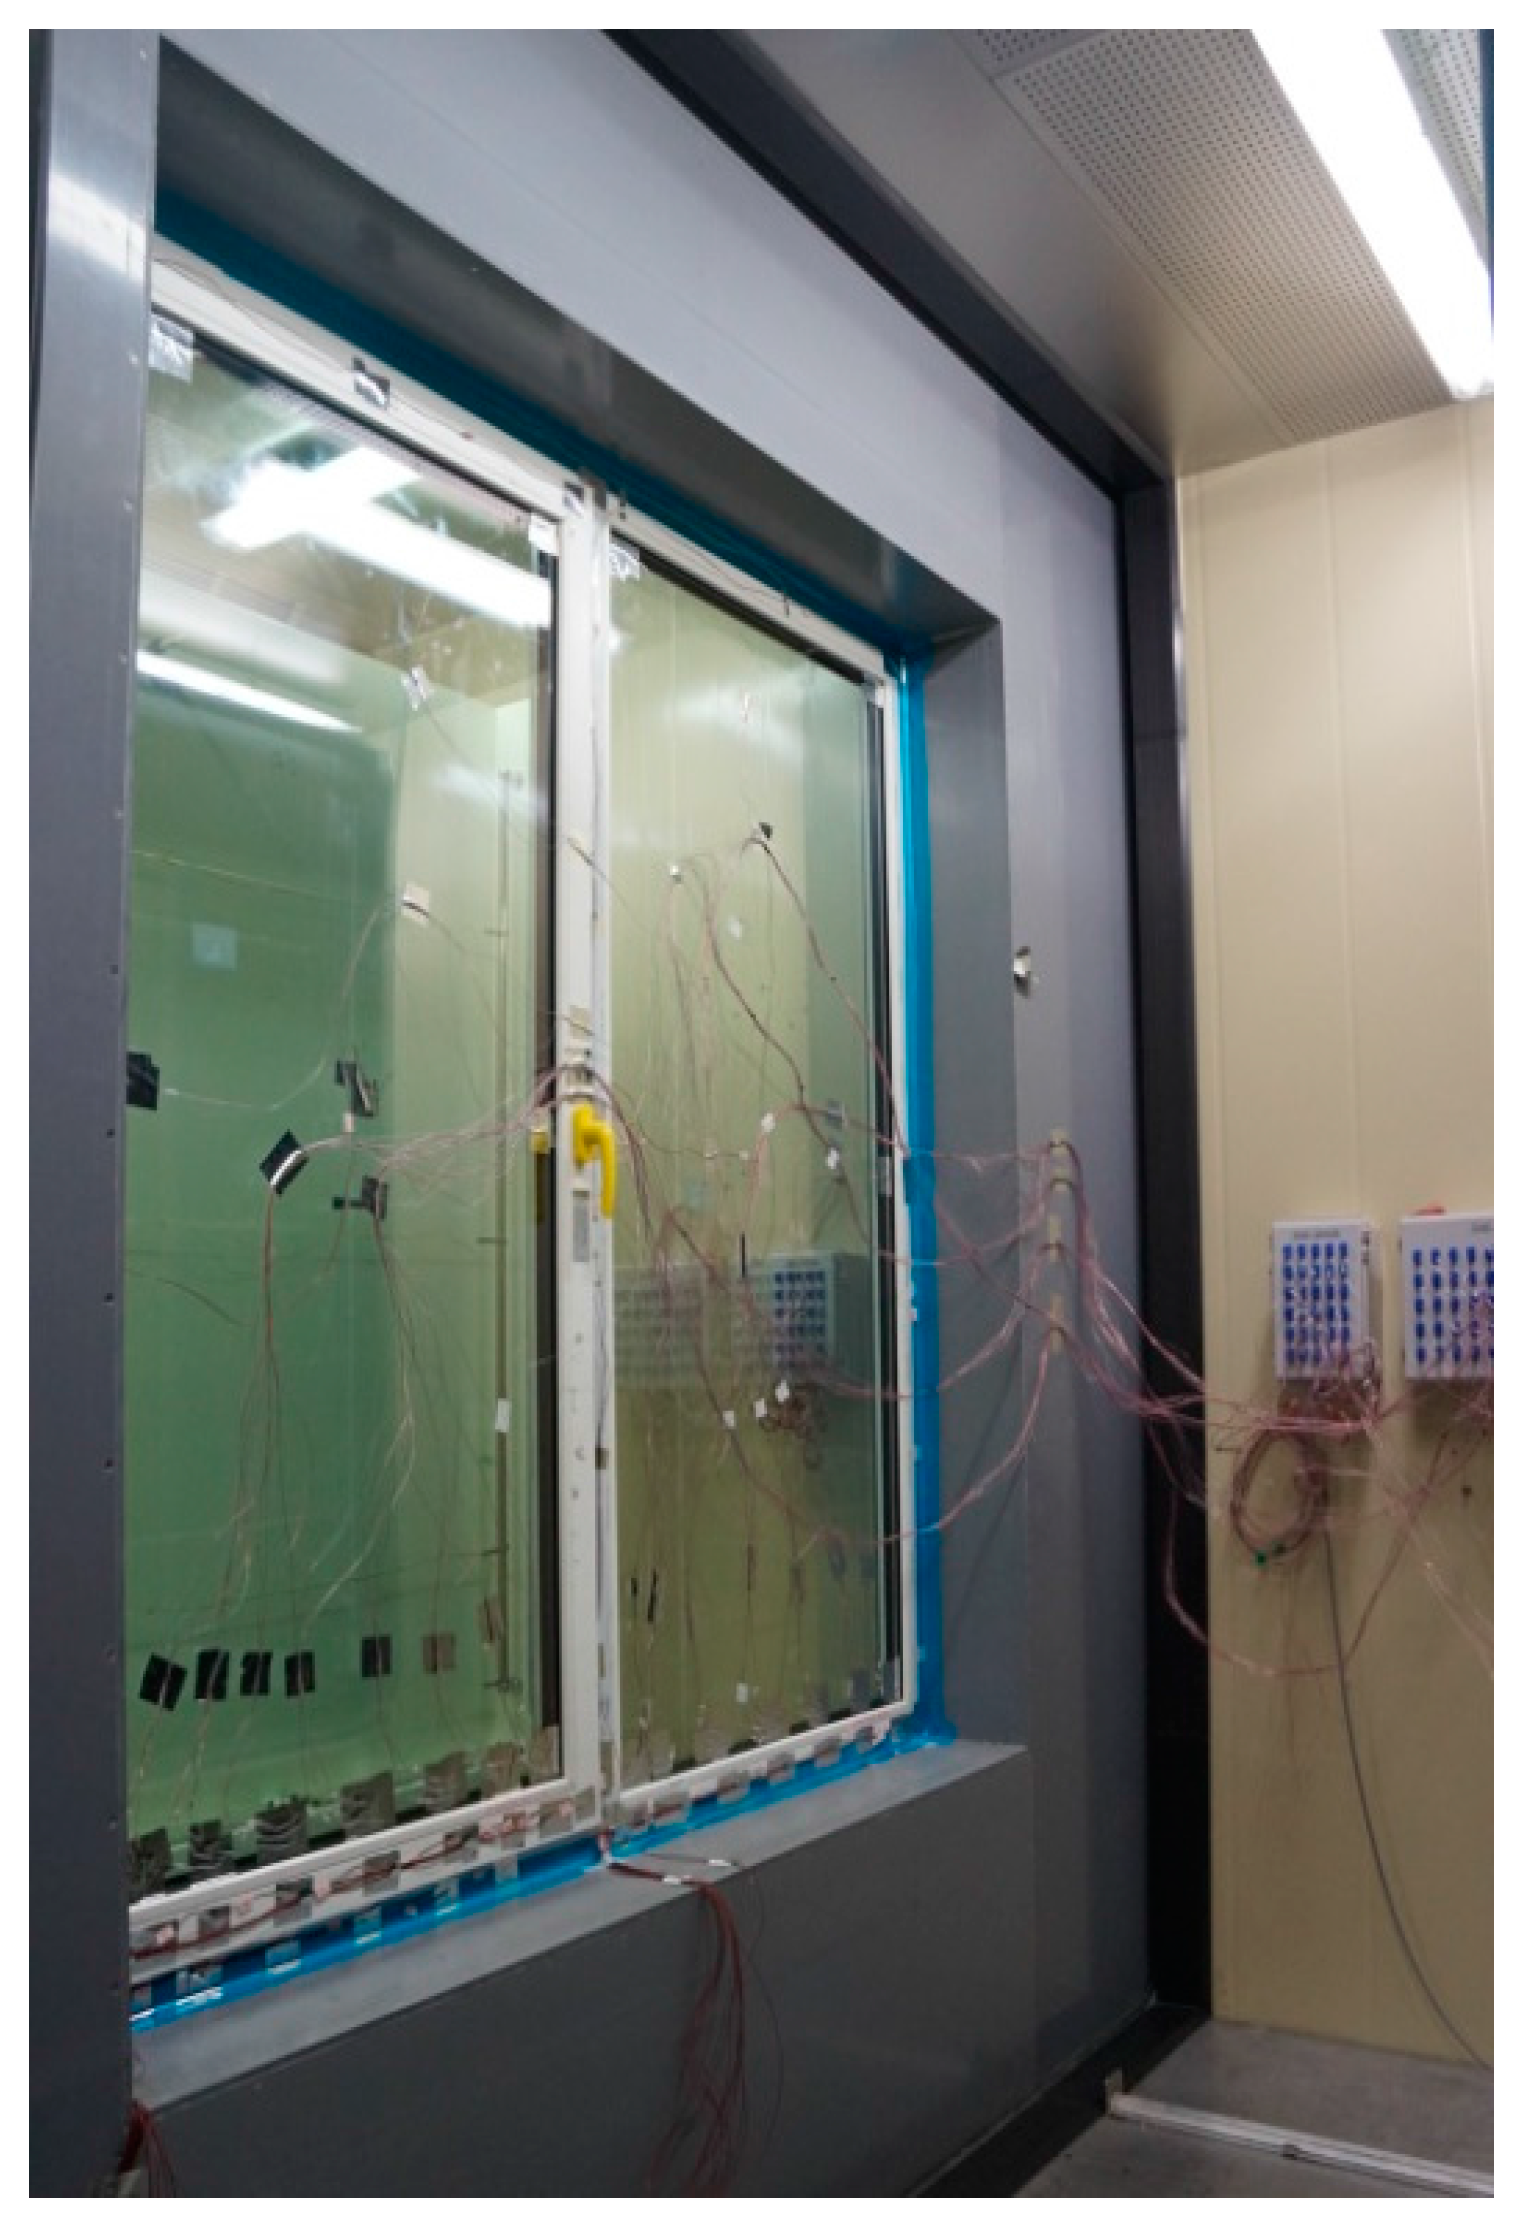
2.2. Experimental Investigations

The test method was based on the methodology of the calibrated hot box in accordance with KS F 2295 [29]. KS F 2295 is the Korean national standard for the test method of dew condensation for windows, which specifies the test window size, the details of a surround panel, and the conditions of chambers, among other parameters. This standard follows KS F 2278 for the airflow conditions of the chambers and the surface thermal resistance of a test window [30]. KS F 2278 is the Korean national standard describing the method used to test window thermal resistance (U-value). Both standards use the same hot box method while using different environmental conditions.
During the hot-box experiment, the test window was enclosed between warm and cold climate chambers. The window was mounted in a 350 mm thick surrounding panel with a thermal resistance of 4.3 m2K/W. Figure 3 and Figure 4 display the schematic of the experimental configuration and the view of the window in the hot box. The hot box featured natural convection, while the cold box featured forced convection. The airflow was adjusted in accordance with KS F 2278 to produce an average surface thermal resistance of 0.11 ± 0.02 m2K/W and 0.05 ± 0.02 m2K/W on the surface of the hot box and cold box, respectively. The indoor air temperature was set to 25 °C, and the outdoor air temperature to −15 °C, following the Korean design standard for preventing condensation in apartment buildings [28]. In this standard, three climate regions are specified for the condensation risk assessment based on the average daily minimum outdoor air temperature of the coldest month: −20 °C for region I, −15 °C for region II, and −10 °C for region III. Table 1 presents the conditions of the hot and cold boxes. Type T thermocouples were used for measuring the internal surface temperatures of the window. The accuracy of the thermocouple was ±0.5 °C.

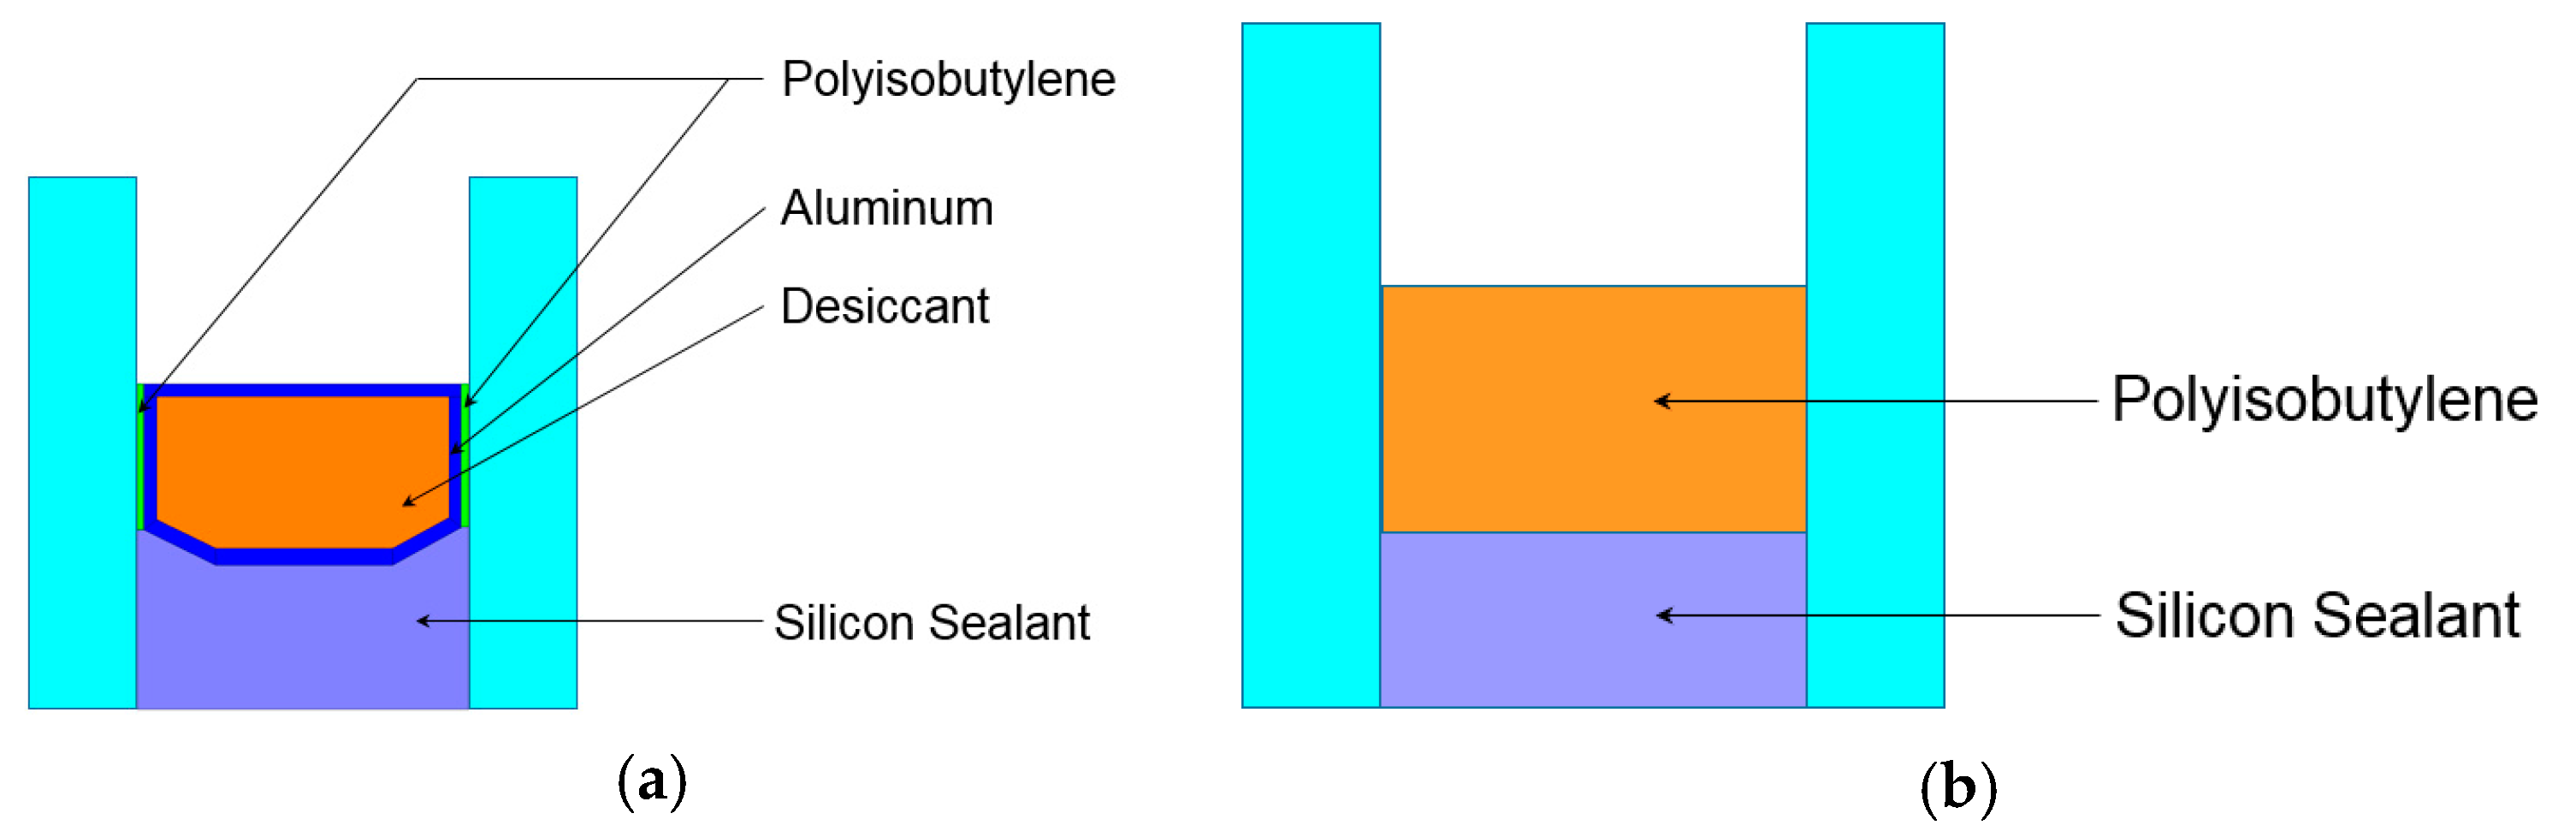
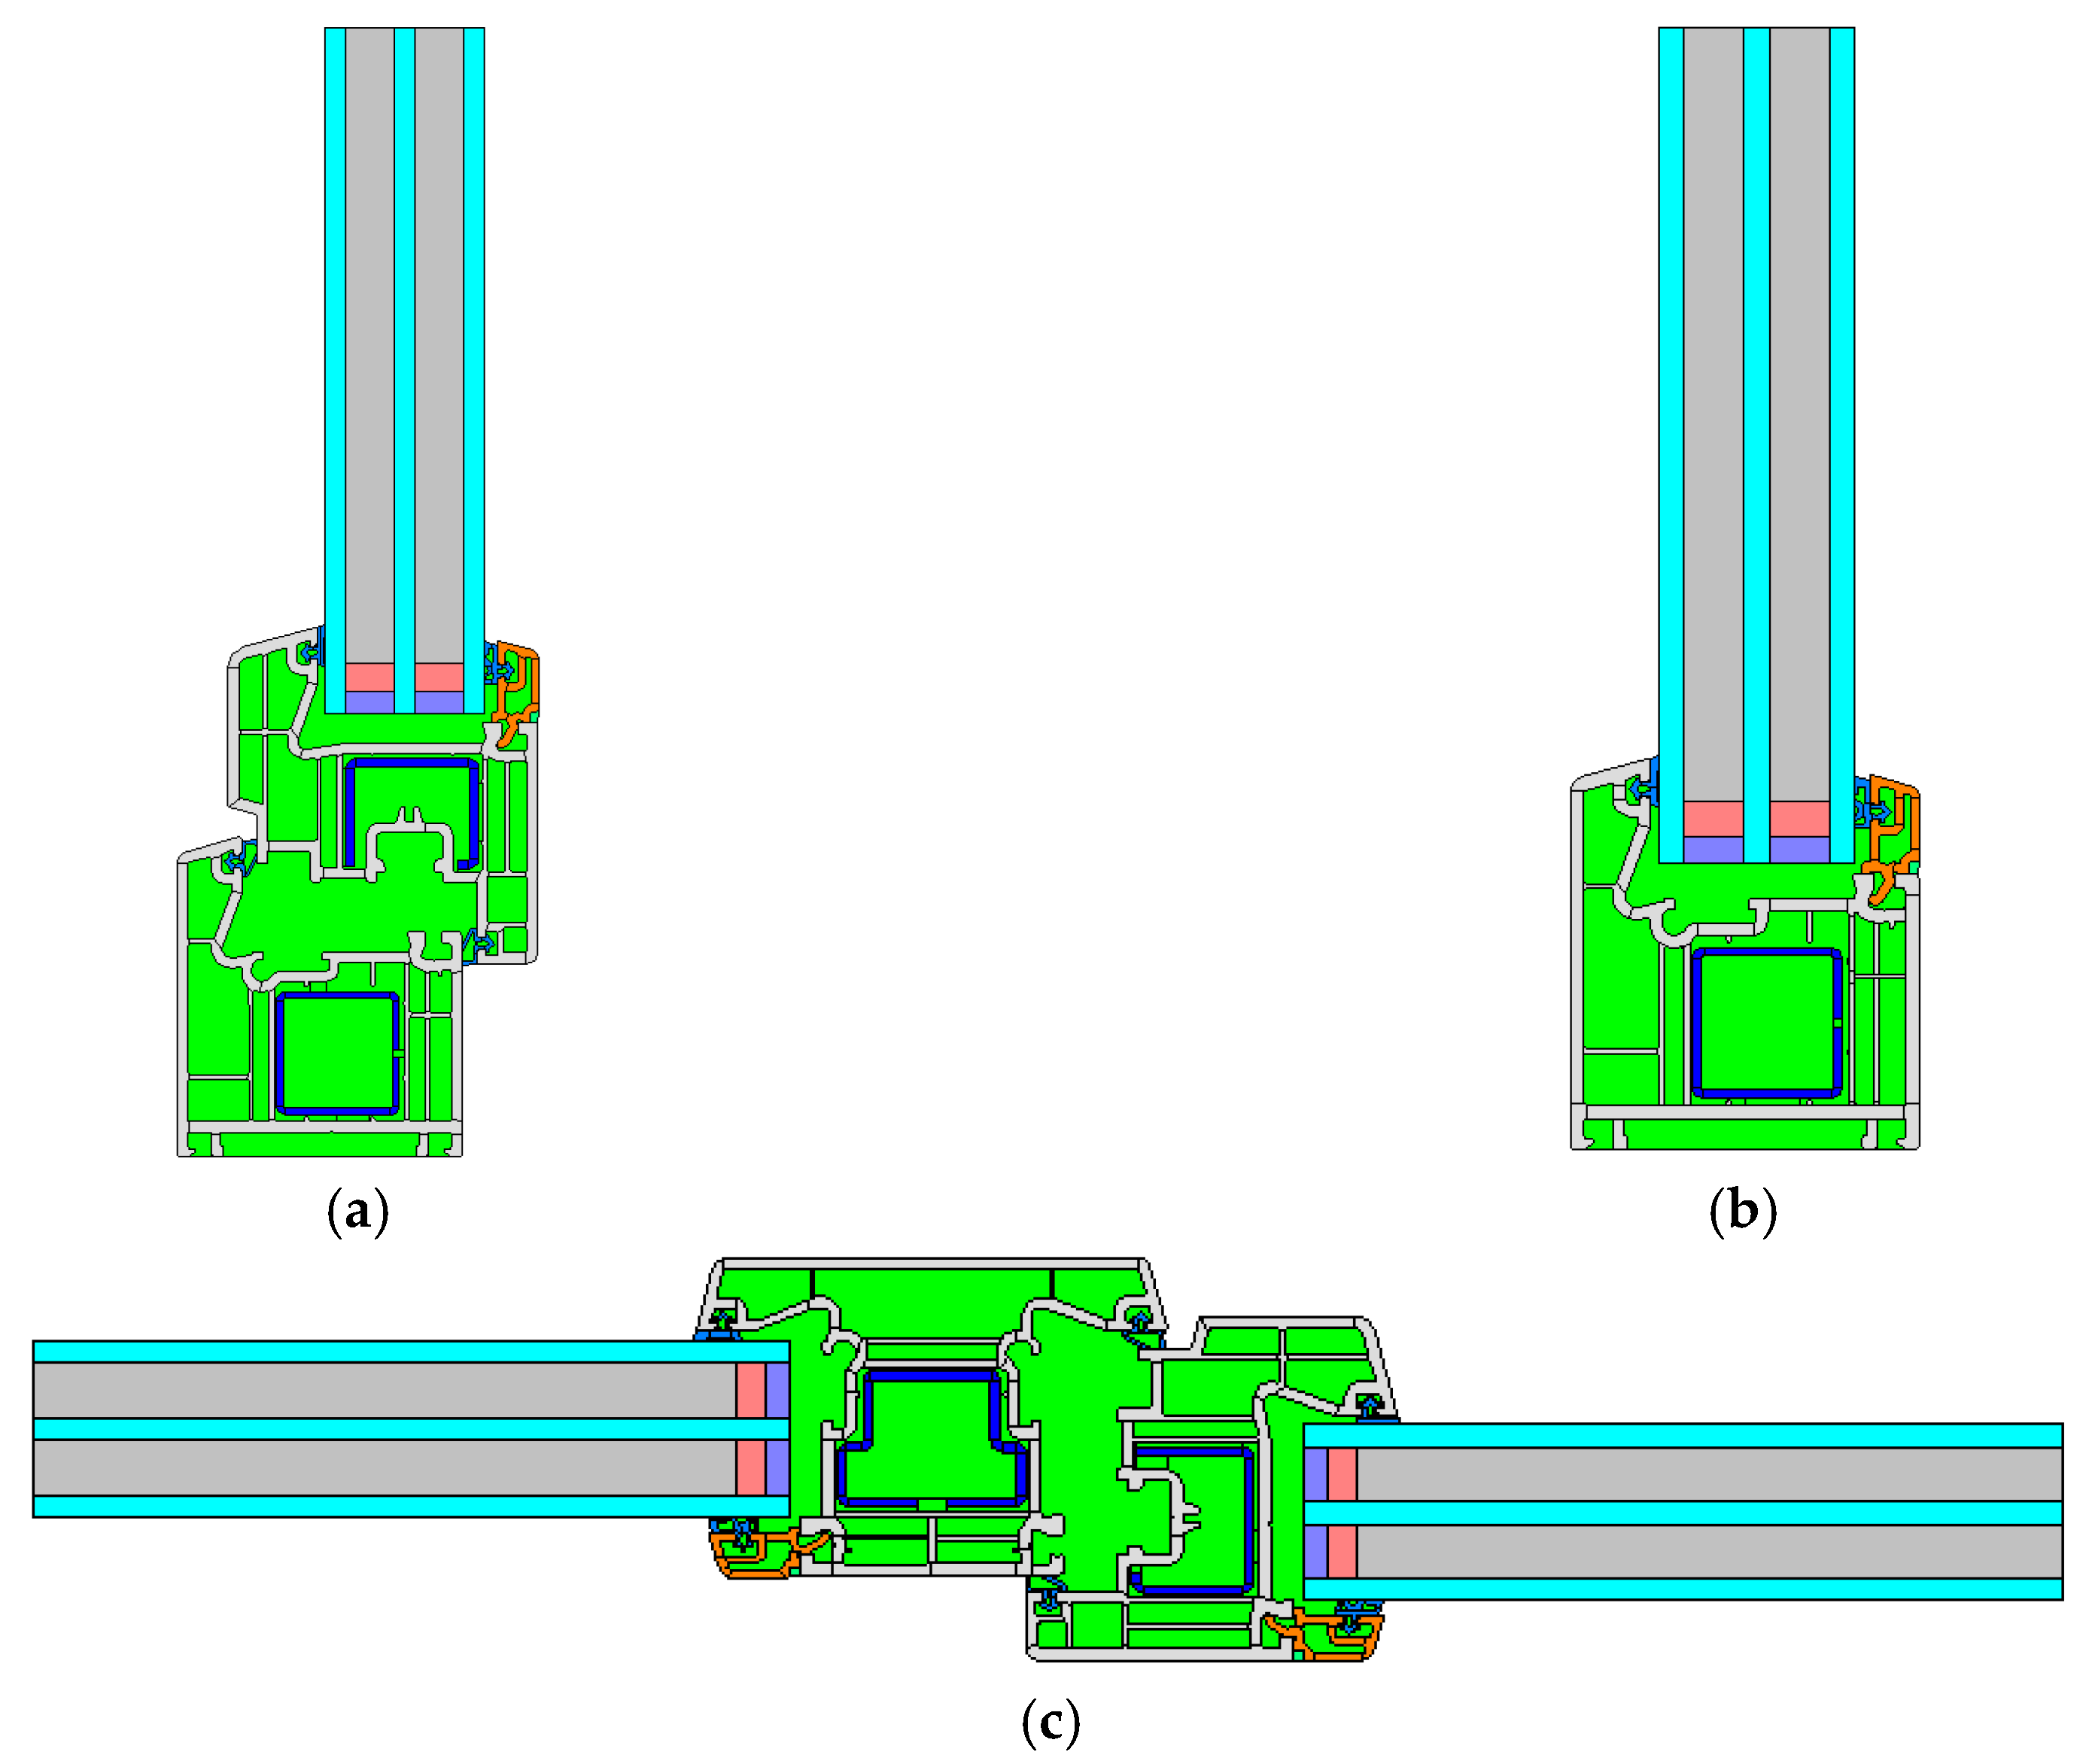
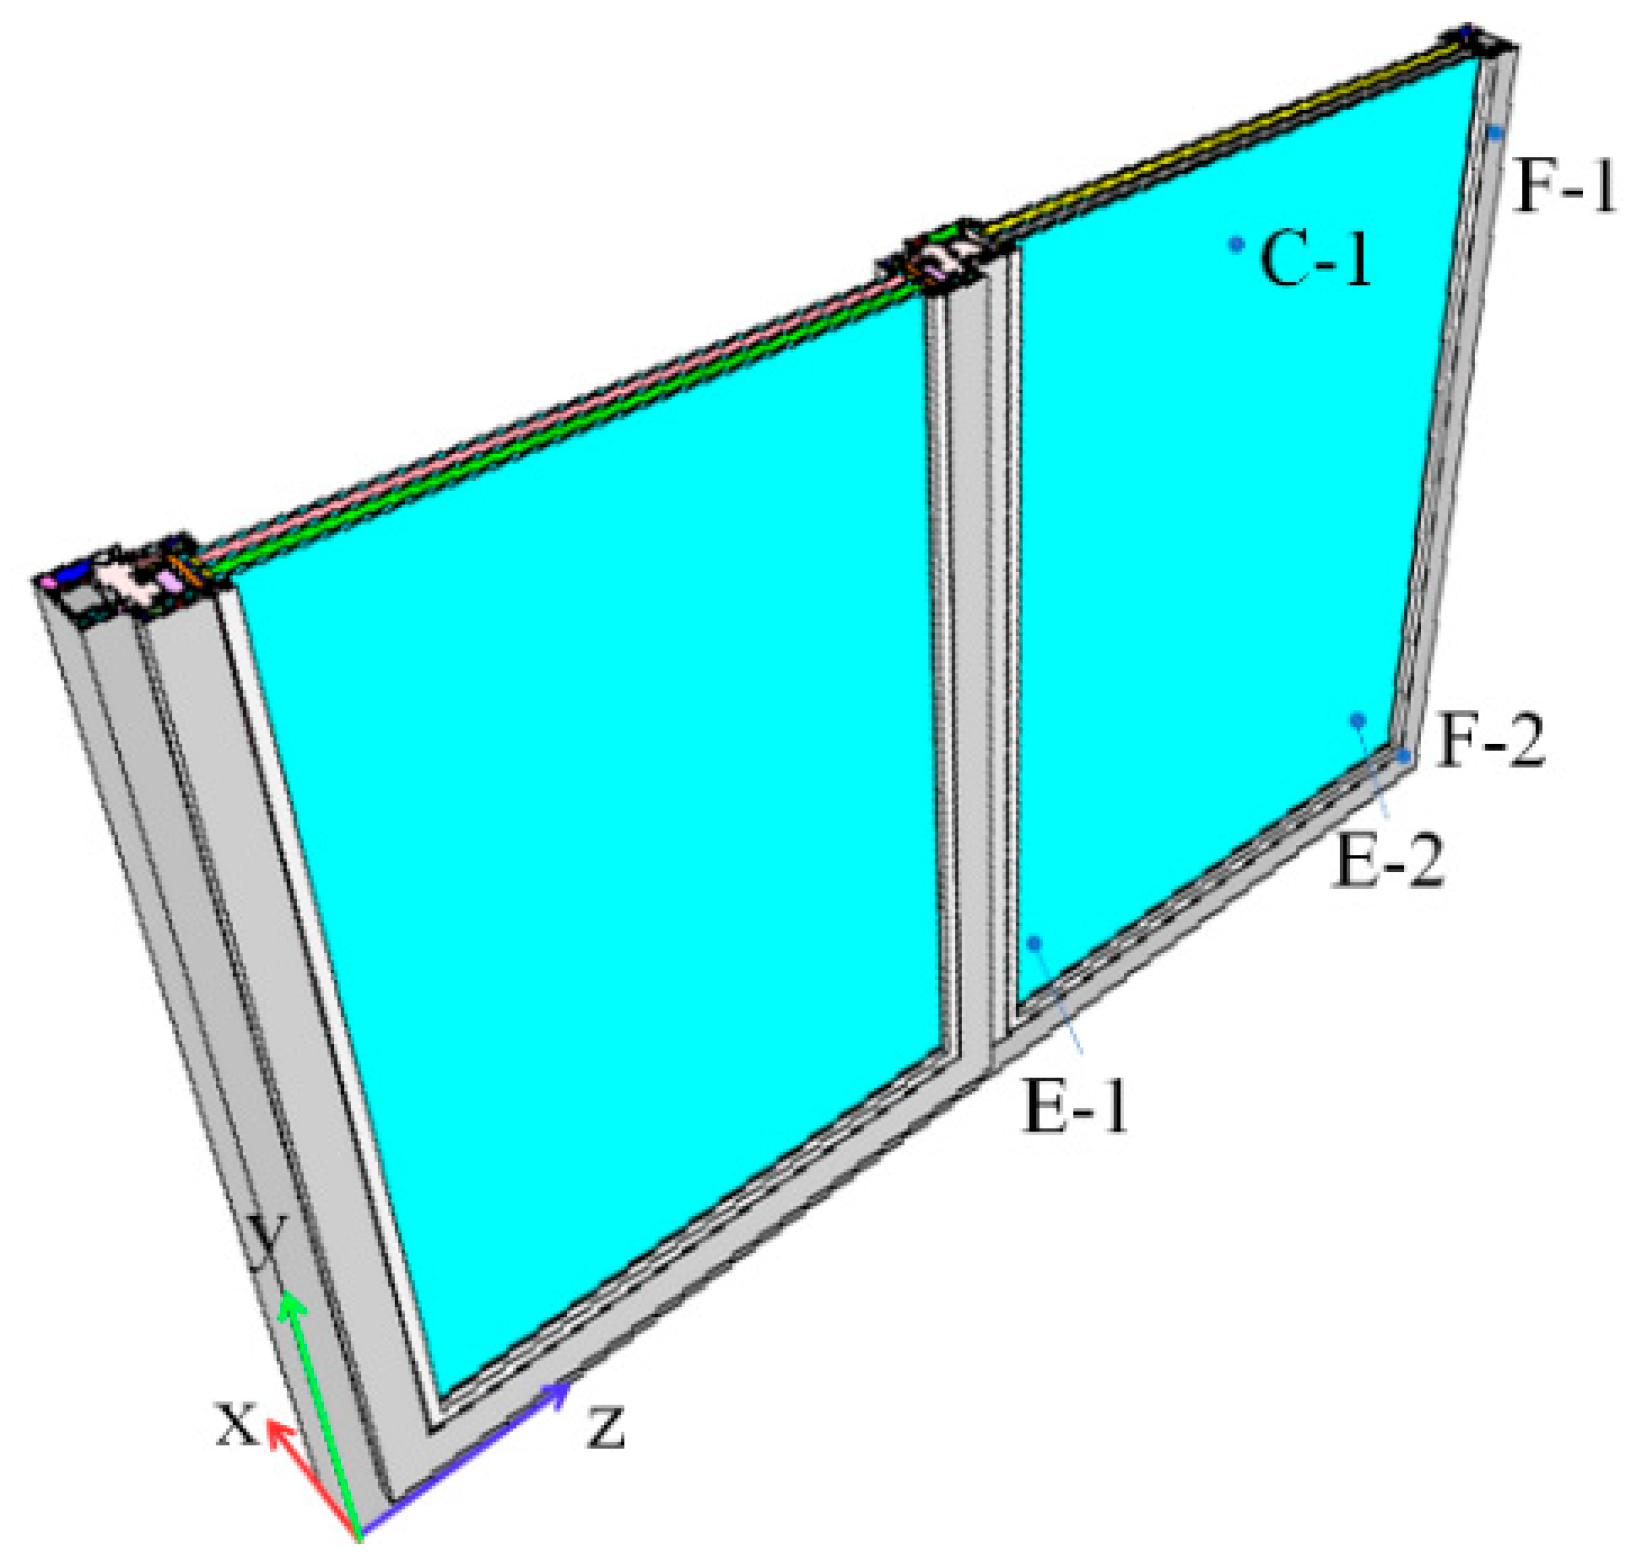
2.3. Numerical Procedure

The numerical simulations were performed using the computer program Physibel Trisco 12.0w (2010) for the 3D heat transfer calculation [31]. This program is a thermal analysis program for steady-state heat transfer calculations; the temperatures are determined using the finite difference method. The 3D program operates in accordance with EN 673 (2011) for glazing cavities and ISO 10077-2 (2012) for cavities in frames [19,32]. The concept of equivalent thermal conductivity was used to calculate the heat transfer in the frame cavities; the heat transfer analysis was simplified by replacing the cavity with an imaginary solid material.
The four simulation cases with different boundary conditions used in this study are shown in Table 2. An indoor air temperature of 25 °C and an outdoor air temperature of −15 °C were applied in all simulation cases to match the experimental conditions. In reality, the surface thermal resistance of the window is dynamic and depends on the indoor and outdoor environmental conditions. However, both the experiment and calculation of the condensation risk are to be performed under static conditions. In other words, the surface thermal resistance should be assumed constant. This study applied four different surface thermal resistances, each constituting a fixed surface resistance using simplified correlations for the convection and radiation heat transfer. The surface thermal resistances that were set as a condition of the simulation were within the margin of error of the surface thermal resistances set by the experiment except for the edge of Case 4 (refer to Figure 5).
The surface thermal resistances of Cases 1 and 2 were referenced from the Korean national standards, Korean design standards for preventing condensation in apartment buildings [8] and KS F 2295 [29] test method of dew condensation for windows and doors. There is a slight difference between the two standards in terms of the external surface thermal resistance. The surface thermal resistance of Cases 3 and 4 were referenced from international standards: ISO 13788, ISO 6946, and ISO 10077-2. ISO 13788 includes the calculation methods for the assessment of the risk of internal surface condensation, providing the surface resistances for the assessment of surface condensation on windows. ISO 6946 provides the conventional surface thermal resistances for surfaces in contact with air. ISO 10077-2 specifies the calculation method for the thermal transmittance of windows, doors, and shutters. The surface thermal resistances for the surface condensation assessment of windows are suggested in Annex B of ISO 10077-2. In the case of the internal surface thermal resistance of a window, the heat transfer coefficients are locally lower, particularly at the glazing near the frame, due to the lower airflow speed and different radiation view factors [16]. The view factor is a dimensionless factor that determines how much of a surface is visible to another surface. The edge-of-glazing closer to the frame surface has a higher view factor between them compared to the center-of-glazing. This implies that the projecting surfaces such as the sill, jamb, and head surfaces can affect radiation heat transfer in the edge-of-glazing [22].
Local variation of the surface thermal resistance is reflected in ISO 10077-2. In Case 4, the internal surface thermal resistance of 0.20 m2K/W was used for edges between two surfaces considering reduced radiation and convection, as described in Figure 5.
This study investigated whether a small change of surface thermal resistance in the numerical simulations can influence the calculated temperatures. In consideration of computational efficiency, the lower area of the window, which included all the measurement points of surface temperature in the experiment (refer to Figure 2), was adopted as the simulation model. Figure 6 and Figure 7 shows the simulation model and the temperature assessment points. The upper boundary of the model was 100 mm from Point C-1. No significant temperature gradient occurred beyond Point C-1 in the y-axis direction. Table 2 presents the simulation cases with the boundary conditions, and Table 3 presents the material properties. The thermoplastic thermal property is from the manufacturer [35]. All other material thermal properties are from the THERM 6.3/WINDOW 6.3 software library and ISO 10077-2 [19,25,26].

3. Results and Discussion

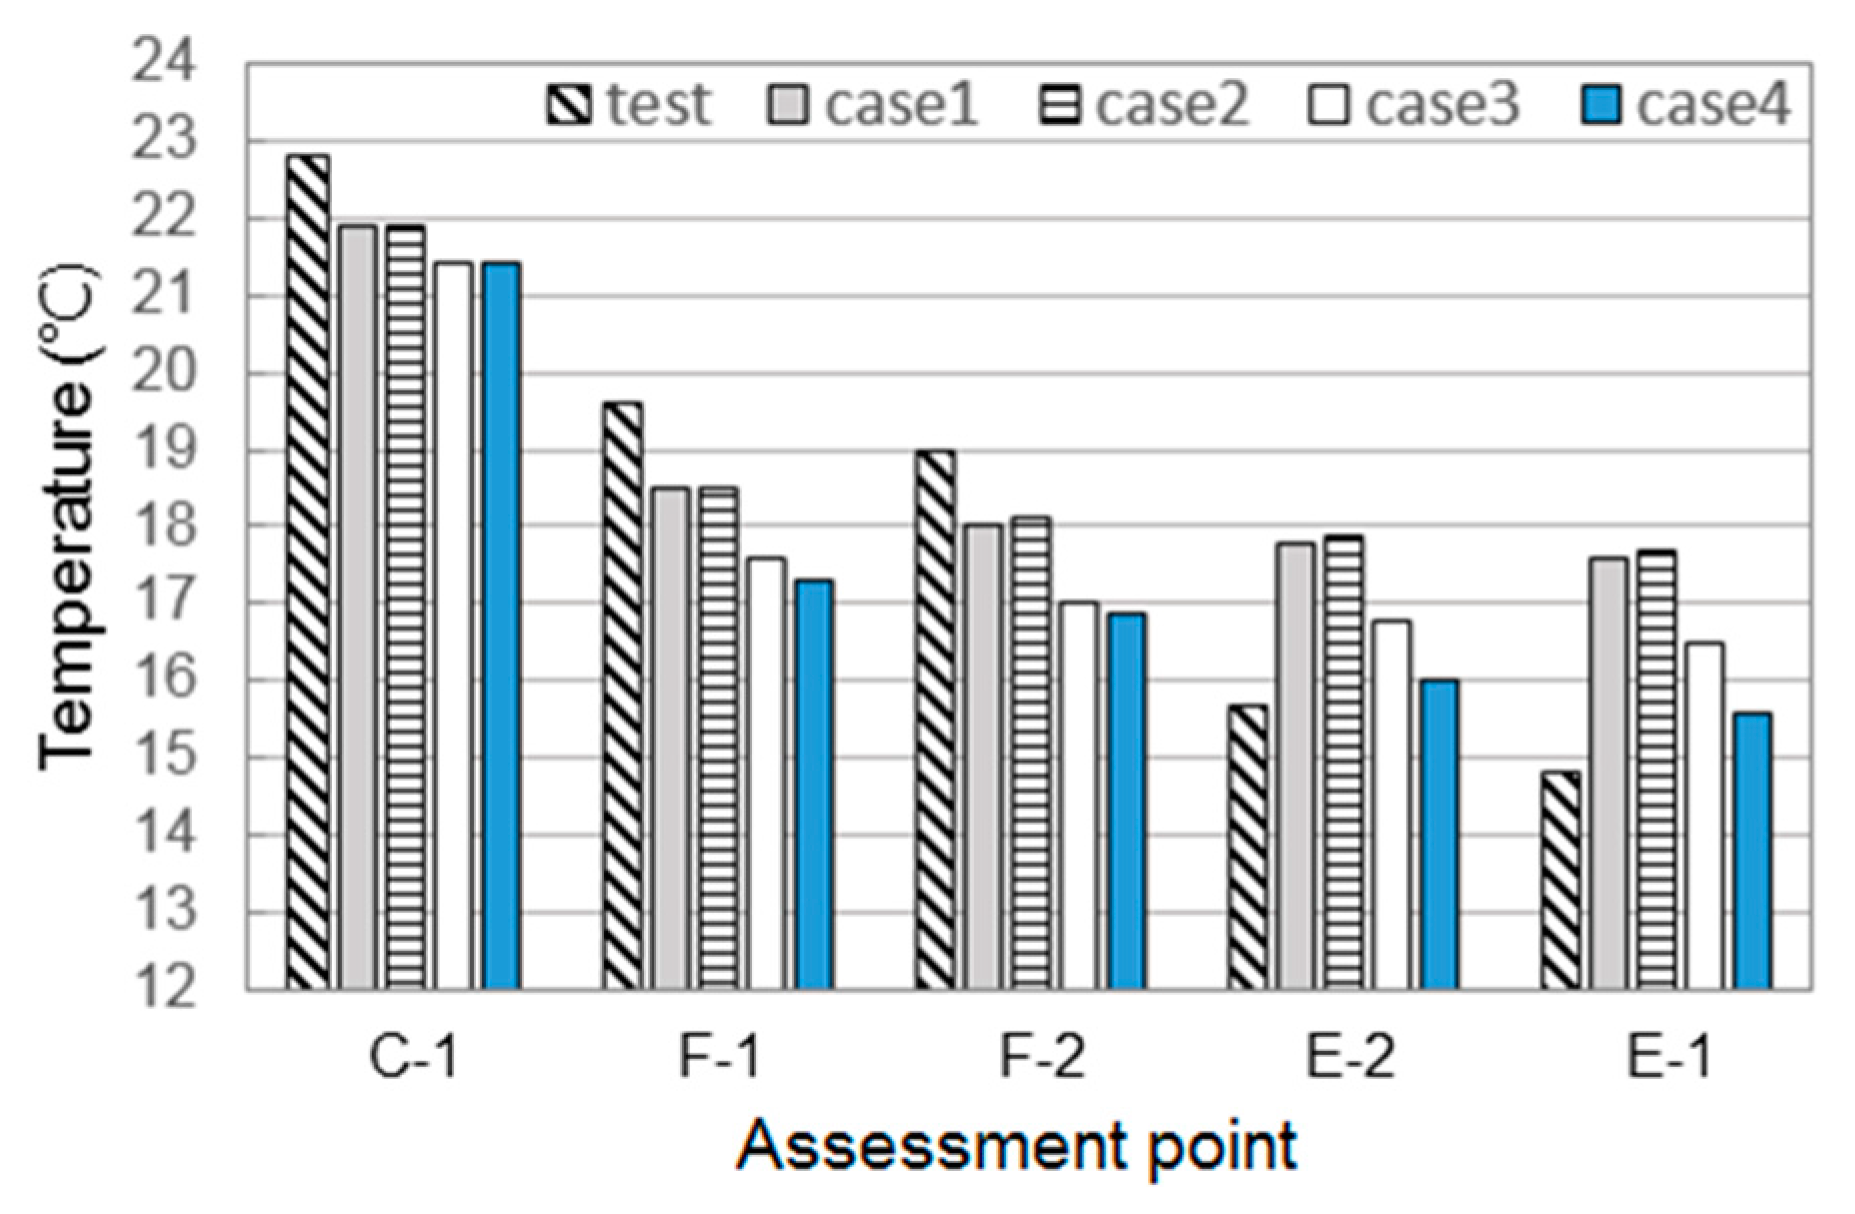
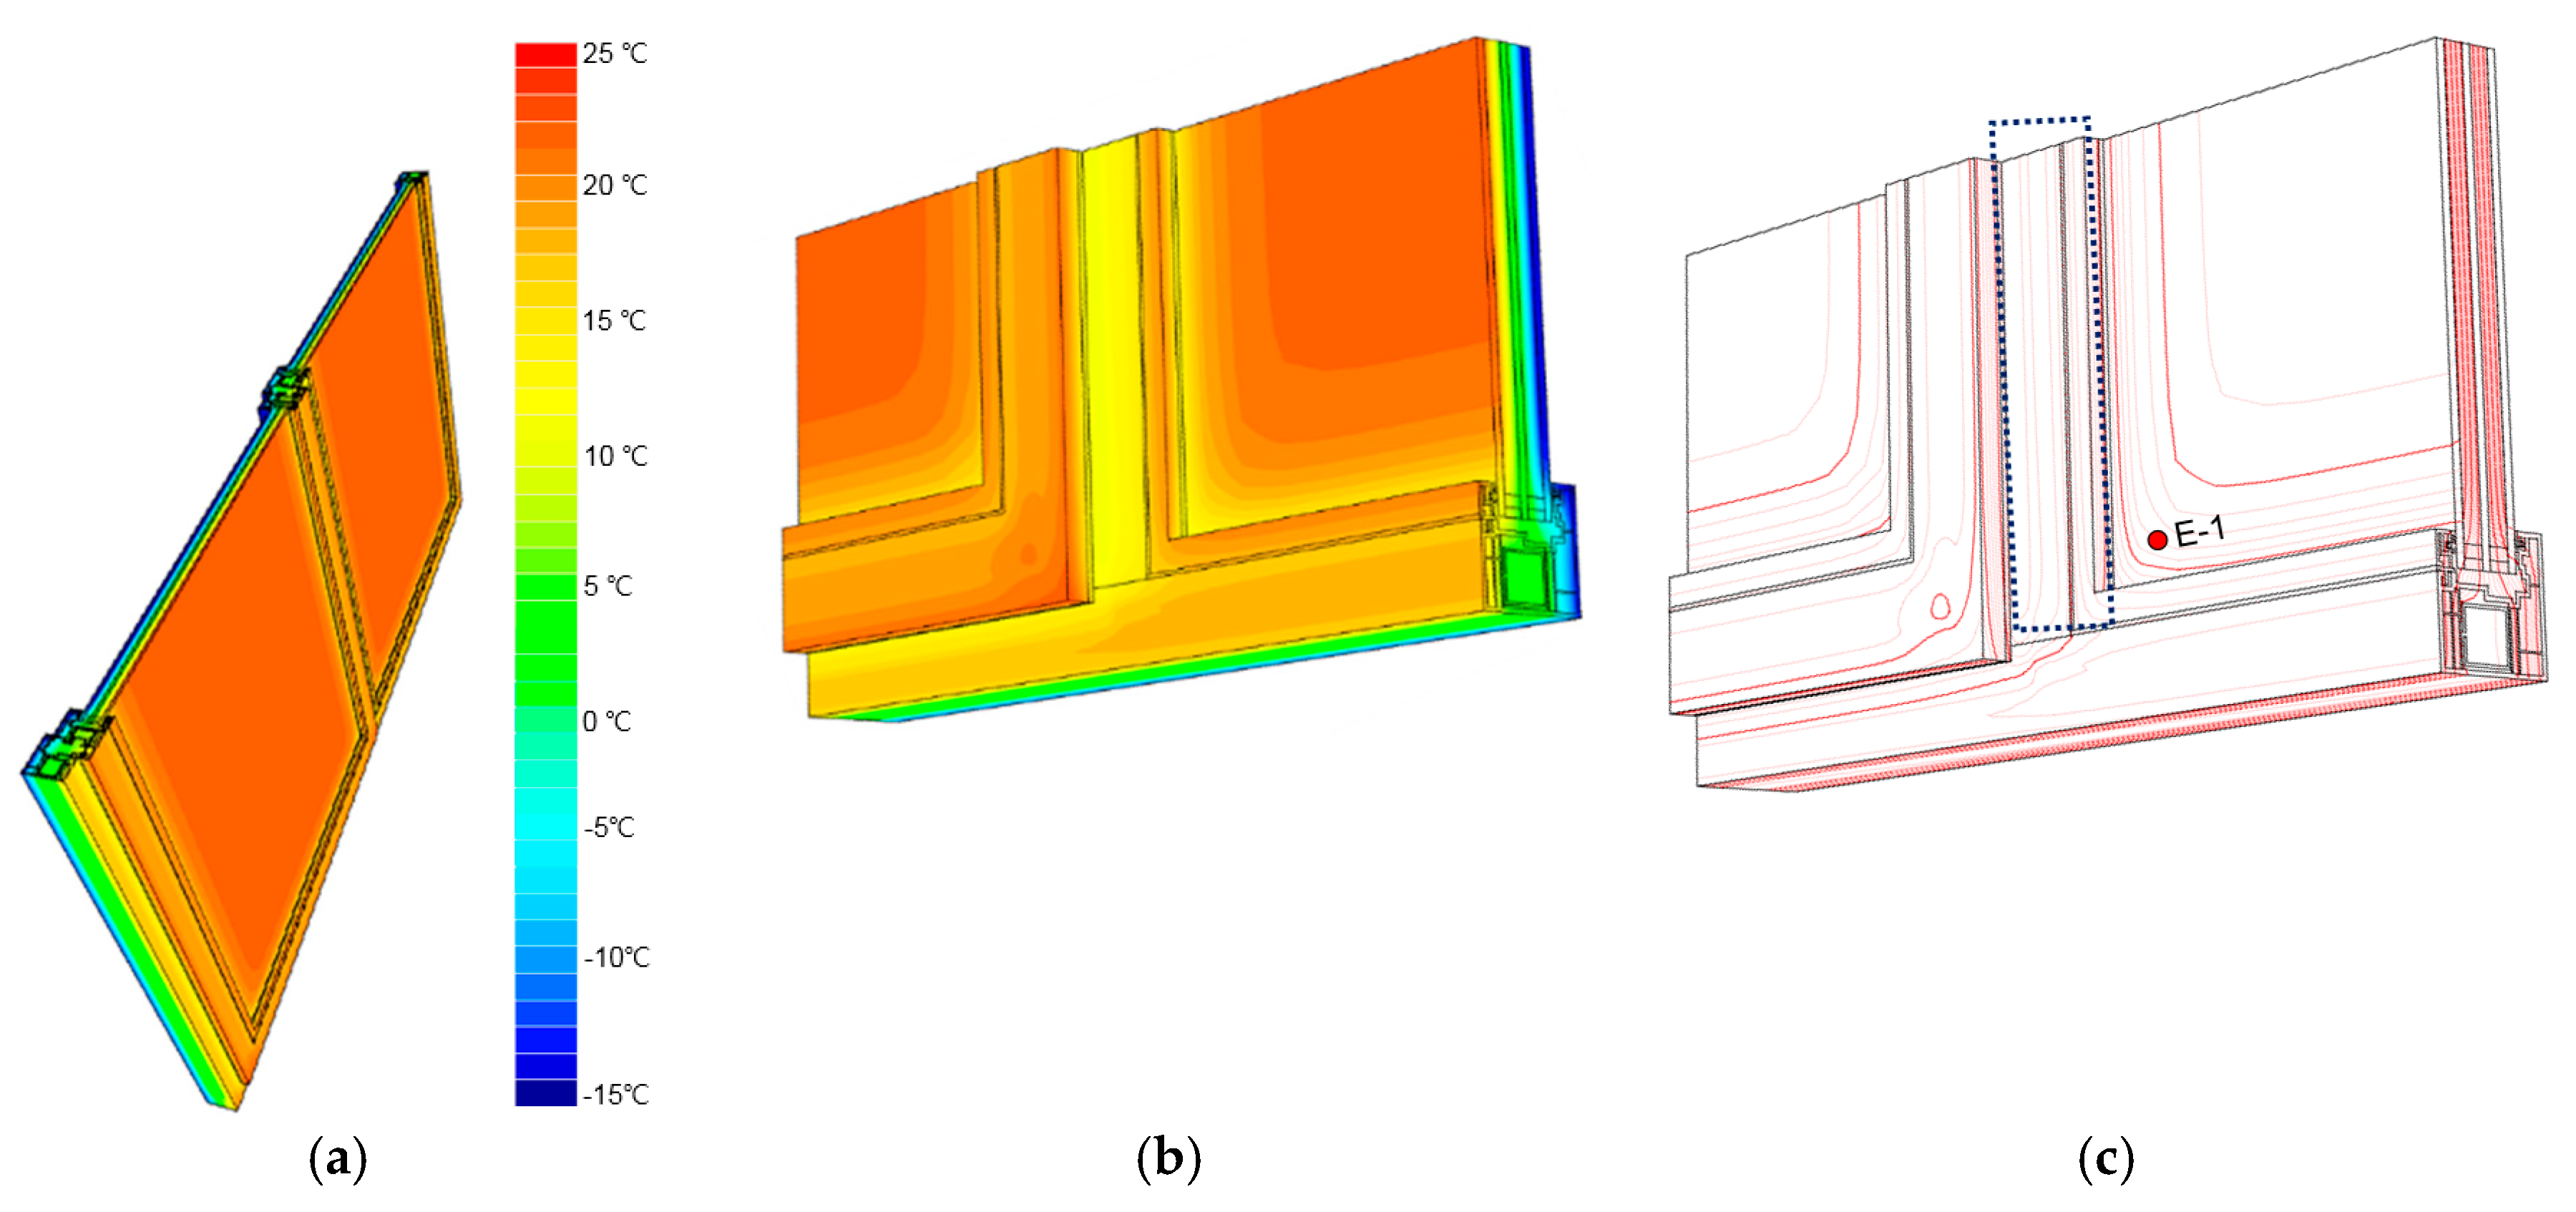
3.1. Comparison of Temperatures

Table 4 presents the results of the experimental tests and numerical simulations. The absolute value of the percent error was calculated for each comparison between the tests and simulations. Figure 8 compares the internal surface temperature between the experimental measurements and the numerical simulation at each point. For the center-of-glazing and frame, the calculated temperatures were generally lower than the measured ones. The edge-of-glazing had a higher calculated temperature than a measured temperature. The measured temperature at the center-of-glazing was 22.8 °C, and the calculated results of the simulation were lower than the measured ones by approximately 1 °C. In the case of the frame, the temperature was measured to be approximately 20 °C at F-1 and 19 °C at F-2. The simulation calculated the temperature of F-2 to be approximately 17–18 °C. For the edge-of-glazing, the measured temperature of E-1 was approximately 15 °C and that of E-2 was approximately 16 °C, indicating a temperature difference of approximately 1 °C. In Case 4, the calculation of E-1 and E-2 was 15.6 °C and 16.0 °C, respectively; in this case, the difference between the measured and calculated temperature was 5.4% and 1.9%, respectively, which was the smallest among all the cases.

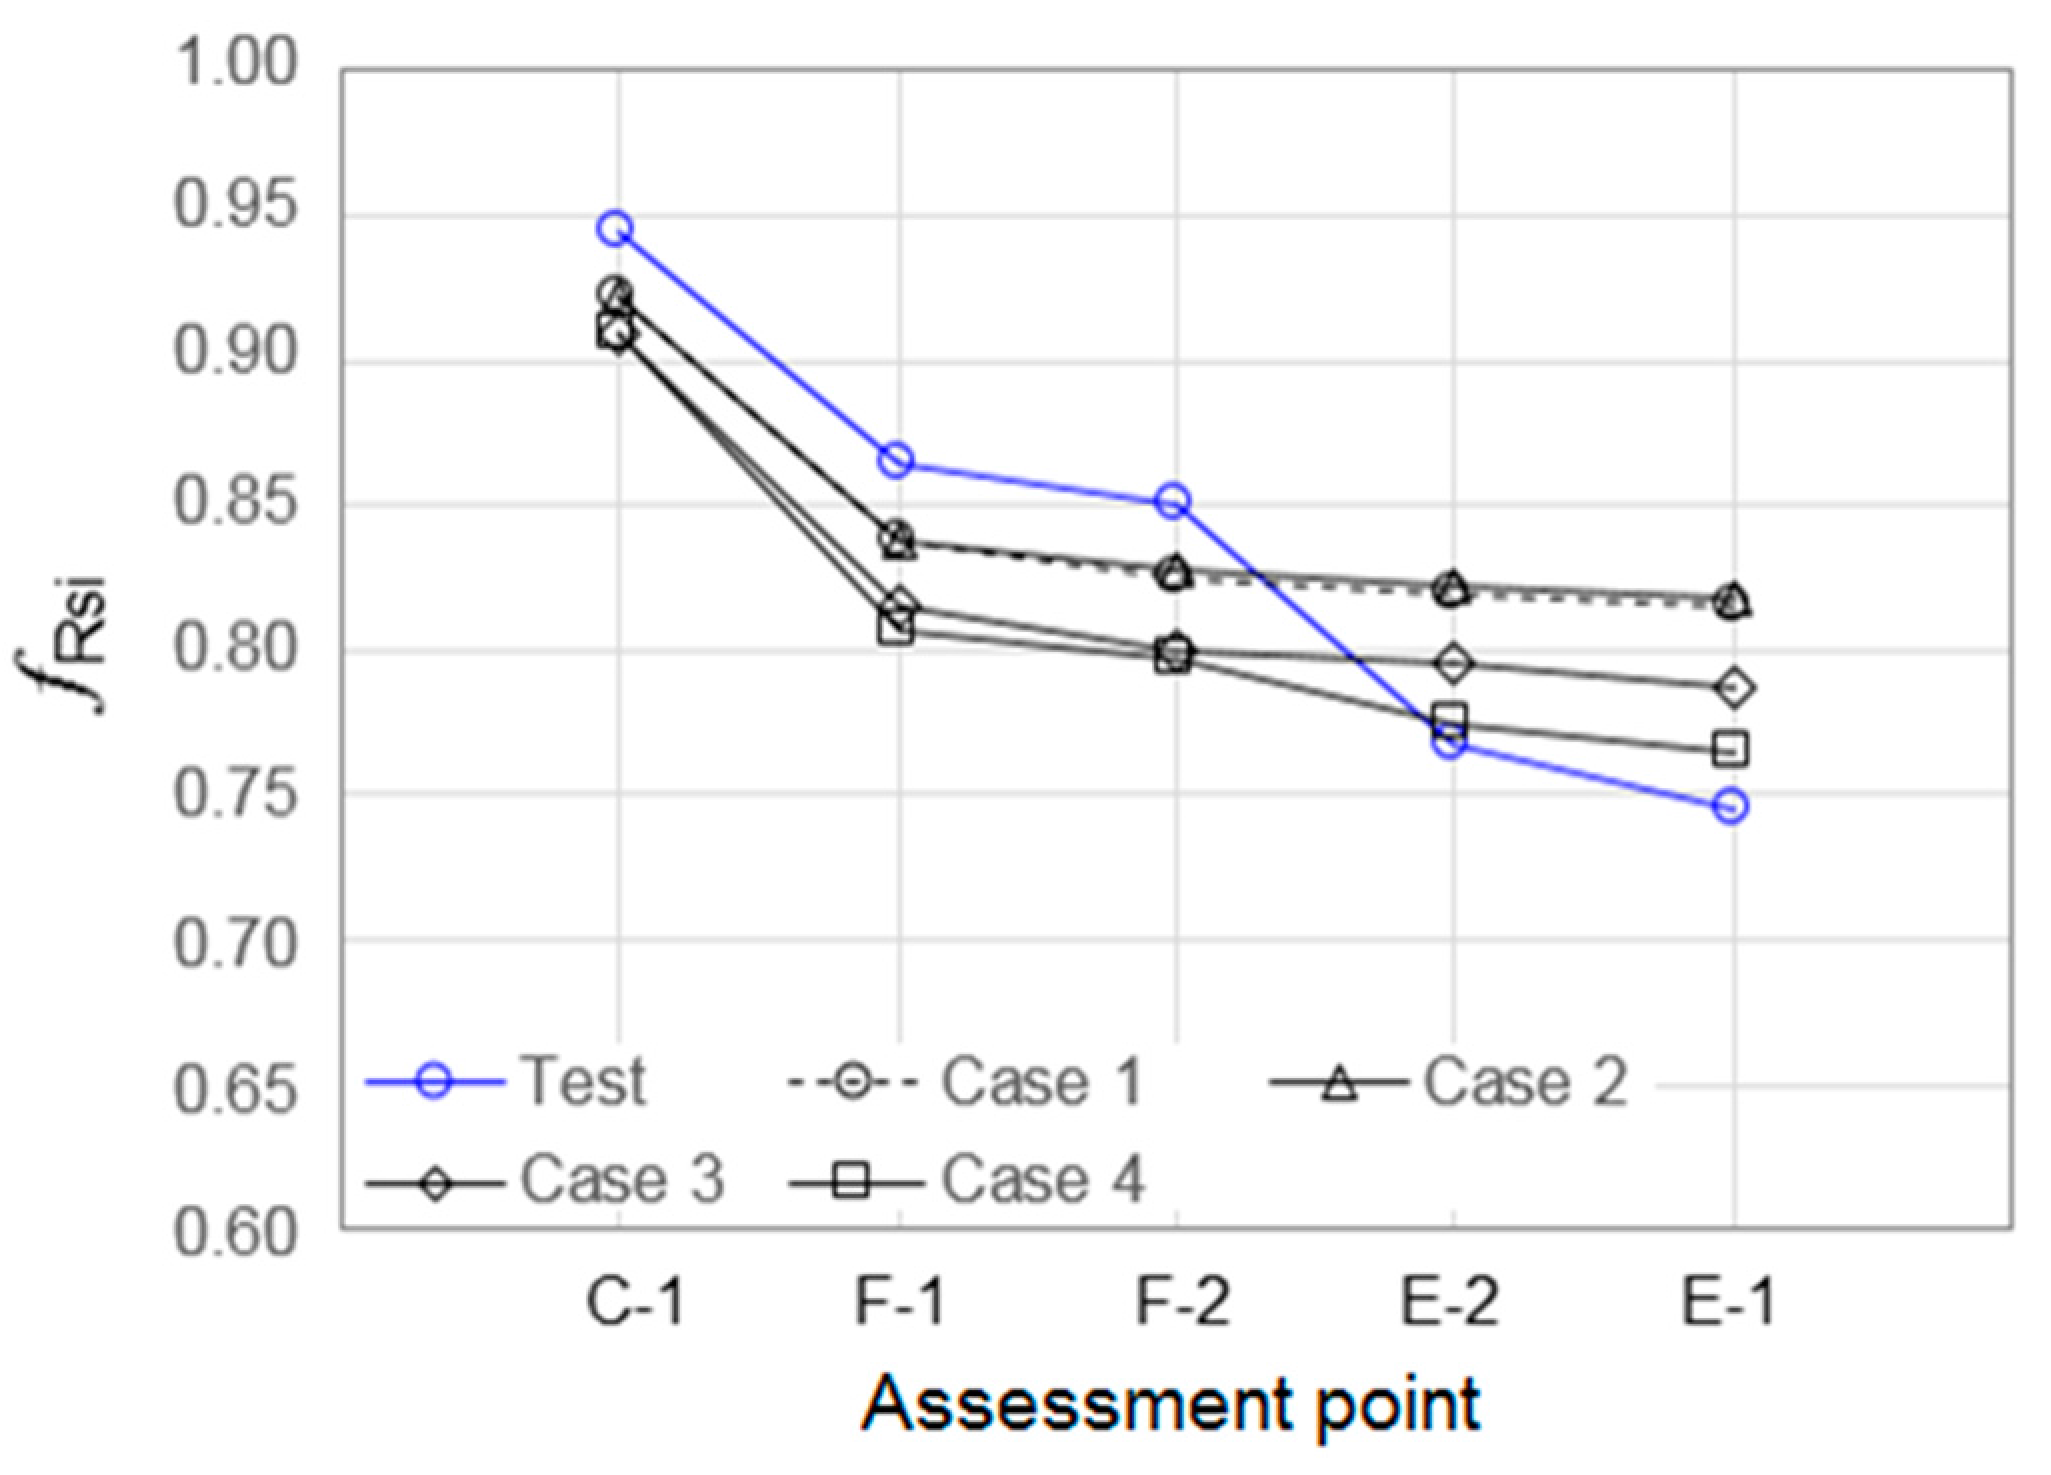
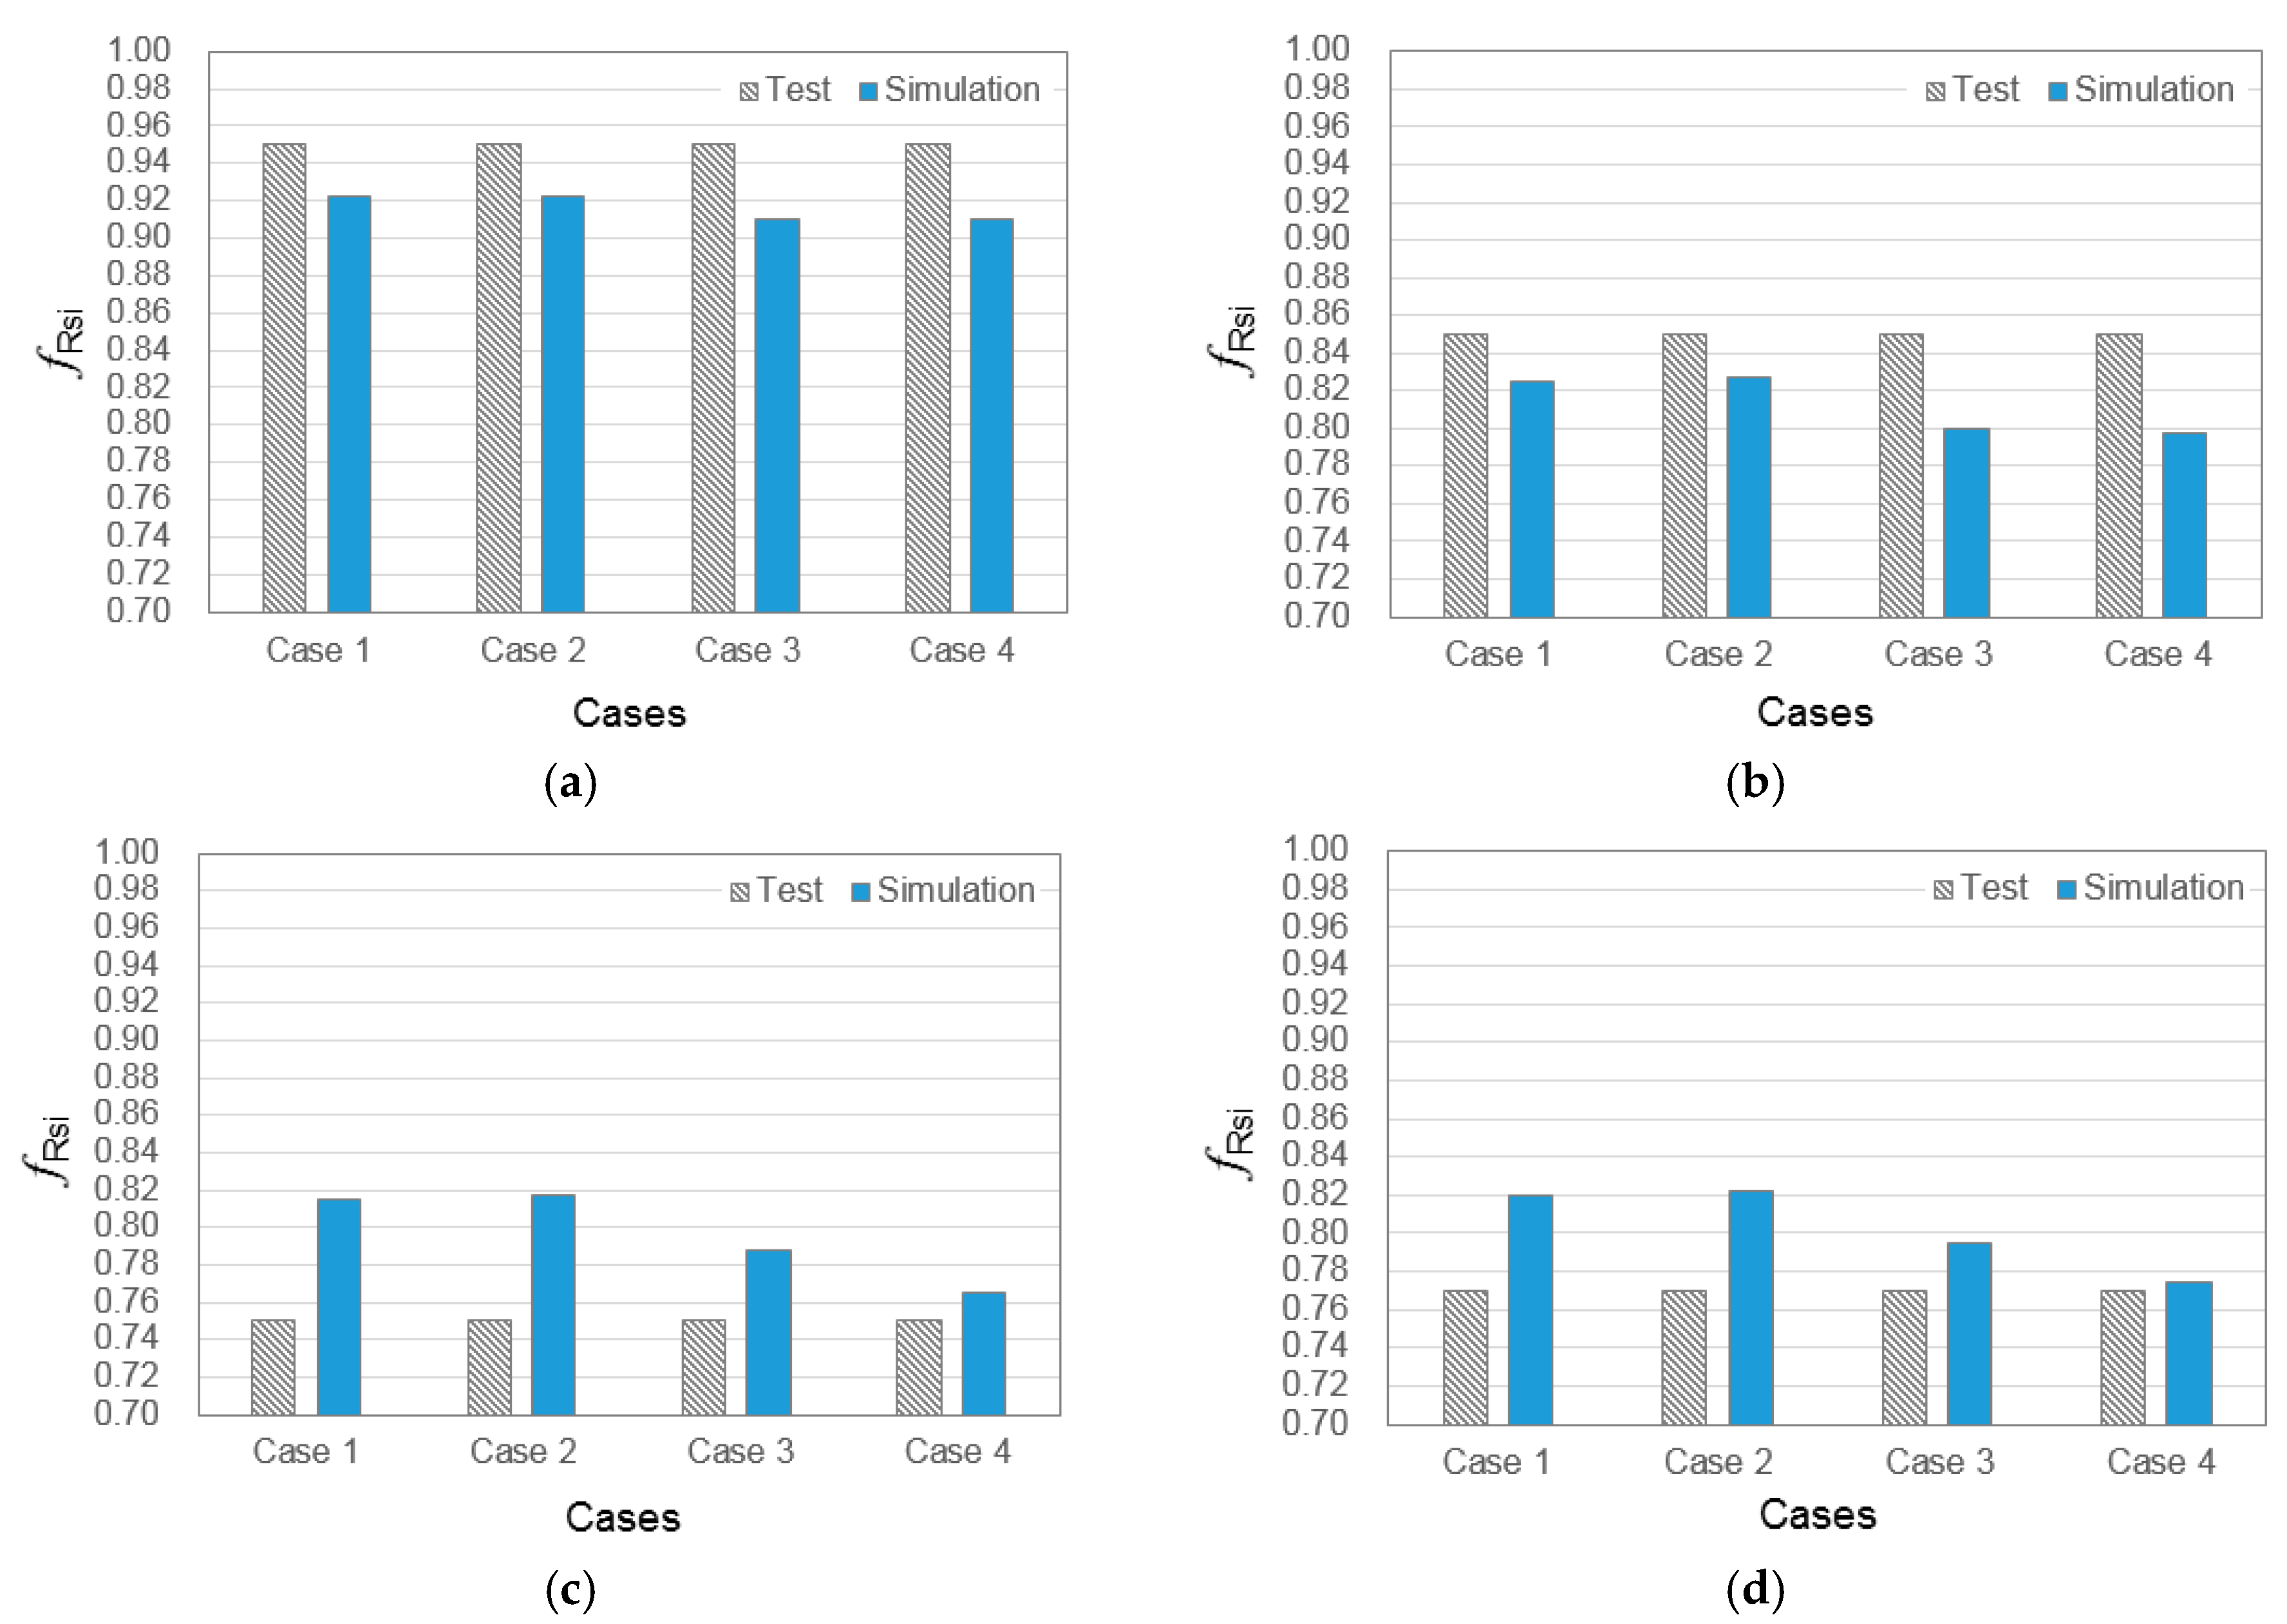
3.2. Comparison of Temperature Factors

Figure 9 shows the comparison between the experimental measurements and the numerical simulations for fRsi derived using the surface temperature of each assessment point. The experimental results show that the center-of-glazing had the best performance in reducing condensation risk, followed by the frame and the edge-of-glazing. The difference in performance of those three window regions was significant, approximately 0.1 fRsi between each region. The simulation results showed a relatively small difference. The simulation agreed with the experimental results in the sense of providing the same ranking of performance at each assessment point. The maximum difference in fRsi between the edge-of-glazing and the frame, for example between E-1 and F-1, was calculated to be 0.04 by simulation. This value corresponds to a temperature difference of approximately 2 °C. The closest jamb to Point E-1, as represented in Figure 10c, affects the temperature of E-1. The yellow color of the jamb in Figure 10b represents lower temperature compared to the orange color of the other surfaces. Radiation exchange occurs between the jamb and Point E-1. Since the temperature of the jamb’s surface perpendicular to the glazing is relatively low, as shown in Figure 10b, the radiation at Point E-1 is reduced. Convection is also reduced because the jamb acts as an obstacle to airflow.
Figure 11 shows the differences in the temperature factor (fRsi) according to the surface thermal resistance. As shown from the comparison of Case 1 and 2 in Figure 11a–d, a small change in the external surface resistance has little effect on the fRsi of the center-of-glazing, the frame, and the edge-of-glazing. A comparison of Cases 1 and 3 indicates that a small change in the internal surface resistance generates a change of approximately 0.03 fRsi in the frame and the edge-of-glazing, which corresponds to a temperature difference of approximately 1 °C.
As shown in Figure 11a, for the center-of-glazing, the experimental measurements produced fRsi values that were always higher than those in the simulations. The agreement between the measurements and the calculations was better for Cases 1 and 2 than for Cases 3 and 4; however, the difference between the two groups of cases was small (approximately 1%). There was no difference in Case 4, which considered the reduced radiation and convection in edges or junctions between two surfaces, and Case 3, which did not consider these factors. This finding indicates that a small difference in the surface thermal resistance has little effect on the simulated fRsi for the center-of-glazing.
As shown in Figure 11b, for the frame, the experimental results were always higher than those in the simulations. The minimum deviation between the measured and calculated results for Point F-2 was 2.6% in Case 2. The frame also showed little difference between Cases 3 and 4. This finding indicates that a local change in the surface thermal resistance of the edge region has no significant effect on the fRsi of the frame.
As shown in Figure 11c,d, in contrast to the center-of-glazing and the frame, the edge-of-glazing consistently had higher fRsi from the simulated results than the experimental results. The differences between the results of the measurement and simulations were less than 10%. The comparison of Cases 3 and 4 in Figure 11c,d shows the effect of the surface thermal resistance considering the reduced radiation and convection in edges. These conditions generated a difference of 0.02 fRsi in the calculation for the edge-of-glazing, corresponding to a temperature difference of approximately 1 °C. As in Case 4, the accuracy of predicting the condensation risk at the edge-of-glazing could be improved most effectively by using the increased local surface thermal resistance at the edges. For example, relative to the measurement of fRsi at Point E-1, the simulation of Case 2 produces an error of approximately 10%, while the simulation of Case 4 reduces the error to less than 3%, as shown in Table 4.

4. Conclusions and Future Work

This study analyzed the effect of surface thermal resistance on the simulation accuracy for the condensation risk assessment of a high-performance window. The 3D simulations were performed under several surface thermal resistance conditions, and the simulated results were compared with experimental results. For the center-of-glazing and the frame, the 3D numerical simulations featured relatively good agreement with the experimental results. A small change in the surface thermal resistance has no significant effect on the accuracy of the condensation risk assessment for the center-of-glazing or the frame. However, relatively poor agreement was found for the edge-of-glazing, which is more vulnerable to condensation. The accuracy of predicting the condensation risk at the edge-of-glazing was significantly improved using the increased local surface thermal resistance with the 3D simulation, reflecting the reduced radiation and convection at the edges or junctions between two surfaces; the error between the measured and calculated temperature factors (fRsi) could be reduced to less than 3%.
However, the simulated prediction of condensation risk for the edge-of-glazing was still not conservative. The simulation tended to underestimate the condensation risk, which might be due to the thermal effects of the operating hardware in high-performance windows [36], which were omitted from the heat transfer calculation in this study. As this study addressed one case of a PVC-framed triple-glazed window, further investigation should be performed for other window types.

Acknowledgments

This research was supported by a grant (18RERP-B082204-05) from the Residential Environment Research Program funded by the Ministry of Land, Infrastructure, and Transport of the Korean government. This research was also supported by a KETEP grant (No. 20132010101910) funded by the Korean Government.

Author Contributions

Seung-Yeong Song and So Young Koo conceived the presented idea; So Young Koo, Sihyun Park and Jin-Hee Song performed the simulations and experiment; So Young Koo wrote the manuscript; Seung-Yeong Song supervised the project.

Conflicts of Interest

The authors declare no conflict of interest.

Nomenclature

fRsiTemperature factor, dimensionless
UwWindow thermal transmittance, W/m2K
WWidth of a window, m
HHeight of a window, m
θiInternal temperature, °C
θeExternal temperature, °C
θsiInternal surface temperature, °C

References

  1. Gustavsen, A.; Grynning, S.; Arasteh, D.K.; Jelle, B.P.; Goudey, H. Key elements of and materials performance targets for highly insulating window frames. Energy Build. 2011, 43, 2583–2594. [Google Scholar] [CrossRef]
  2. ISO 10211. Thermal Bridges in Building Construction—Heat Flows and Surface Temperatures—Detailed Calculations; International Standard Organization: Geneva, Switzerland, 2017. [Google Scholar]
  3. Berthier, J. Diffusion de Vapeur Au-Travers des Parois: Condensation; Sciences du Batiment; CSTB REEF: Nantes, France, 1980; Volume 2. [Google Scholar]
  4. DIN 4108-2:2013-02. Thermal Protection and Energy Economy in Buildings—Part 2: Minimum Requirements to Thermal Insulation; Deutsches Institut für Normung: Berlin, Germany, 2013. [Google Scholar]
  5. Dutch Building Code Online. Available online: http://www.bouwbesluitonline.nl (accessed on 6 November 2017).
  6. ÖNORM B 8110-2: 2002. Wärmeschutz im Hochbau—Wasserdampfdiffusion und Kondensationsschutz (Water Vapor Diffusion and Protection against Condensation); Austrian Standards: Vienna, Austria, 2003. [Google Scholar]
  7. Building Regulations 2000: Approved Document L1A, L1B, L2A, L2B; Ministry of Housing, Communities and Local Government: London, UK, 2010.
  8. Ministry of Land, Infrastructure and Transportation; Korean Design Standard for Preventing Condensation in Apartment Buildings No. 2016-238; Ministry of Land, Infrastructure and Transportation: Seoul, Korea, 2016. (In Korean)
  9. National Fenestration Rating Council (NFRC). Determining Fenestration Product Condensation Resistance Values; NFRC 500-2010; National Fenestration Rating Council (NFRC): Greenbelt, MD, USA, 2010.
  10. Passive House Institute. Criteria and Algorithms for Certified Passive House Components: Transparent Building Components and Opening Elements in the Building Envelope; verion 5.1; Passive House Institute: Darmstadt, Germany, 2017. [Google Scholar]
  11. Bergh, V.D.; Hart, R.; Jelle, B.P.; Gustavsen, A. Window spacers and edge seals in insulating glass units: A state of the art review and future perspectives. Energy Build. 2013, 59, 253–280. [Google Scholar]
  12. Shin, M.S.; Rhee, K.N.; Yu, J.Y.; Jung, G.J. Determination of equivalent thermal conductivity of window spacers in consideration of condensation prevention and energy saving performance. Energies 2017, 10, 717. [Google Scholar] [CrossRef]
  13. Hong, G.; Kim, D.D.; Kim, B.S. Experimental investigation of thermal behaviors in window systems by monitoring of surface condensation using full-scale measurements and simulation tools. Energies 2016, 9, 979. [Google Scholar] [CrossRef]
  14. Lechowska, A.; Schonotale, J. The window edge-of-glass region temperature profile improvement by inserting a small additional glass pane—A CFD study and measurements. J. Build. Eng. 2015, 4, 41–51. [Google Scholar] [CrossRef]
  15. Arasteh, D.; Dariush, K.; Beck, F.A.; Stone, N.; Dupont, W.; Mathis, R.C.; Koenig, M. PHASE I Results of the NFRC U-value procedure validation project. ASHRAE Trans. 1994, 100, 1724–1731. [Google Scholar]
  16. Gustavsen, A.; Uvslokk, S.; Jelle, B.P. Numerical and experimental studies of the effect of various glazing spacers on the window U-value and the glazing temperature. In Proceedings of the 7th Symposium on Building Physics in the Nordic Countries, Reykjavik, Iceland, 13–15 June 2005; pp. 1003–1010. [Google Scholar]
  17. Gustavsen, A.; Arasteh, D.; Jelle, B.P.; Curcija, D.C.; Kohler, C. Developing low-conductance window frames: Capabilities and limitations of current window heat transfer design tools. J. Build. Phys. 2008, 32, 131–153. [Google Scholar] [CrossRef]
  18. ISO 15099. Thermal Performance of Windows, Doors, and Shading Devices—Detailed Calculations; International Standard Organization: Geneva, Switzerland, 2003. [Google Scholar]
  19. ISO 10077-2. Thermal Performance of Windows, Doors and Shutters—Calculation of Thermal Transmittance—Part 2: Numerical Method for Frames; International Standard Organization: Geneva, Switzerland, 2017. [Google Scholar]
  20. Gustavsen, A.; Goudey, H.; Arasteh, D.; Uvslokk, S. Experimental and numerical examination of the thermal transmittance of high performance window frames. In Proceedings of the Thermal Performance of the Exterior Envelopes of Whole Buildings XI International Conference, Clearwater Beach, FL, USA, 5–9 December 2010. [Google Scholar]
  21. Kohler, C.; Arasteh, D.; Mitchell, R. THERM simulations of window indoor surface temperatures for predicting condensation. ASHRAE Trans. 2002, 109, 593–599. [Google Scholar]
  22. Curcija, D.; Arasteh, D.; Huizenga, C.; Kohler, C.; Mitchell, R.; Bhandari, M. Analyzing thermal performance of building envelope components using 2-D heat transfer tool with detailed radiation modeling. In Proceedings of the 7th International IBPSA Conference, Rio de Janeiro, Brazil, 13–15 August 2001; pp. 219–226. [Google Scholar]
  23. Bystronic Glass Homepage. TPS—The Original from the Inventor. Available online: http://www.bystronic-glass.com (accessed on 6 November 2017).
  24. Lawrence Berkeley National Laboratory. WINDOW/THERM 6.3 Manual. 2013. Available online: https://windows.lbl.gov/sites/default/files/Downloads/nfrcsim6-3-2013-07-manual.pdf (accessed on 6 November 2017).
  25. Lawrence Berkeley National Laboratory. THERM Material Library, THERM 6.3. 2012. Available online: https://windows.lbl.gov/software/window (accessed on 6 November 2017).
  26. Lawrence Berkeley National Laboratory. WINDOW Glass and Gas Library, WINDOW 6.3. 2013. Available online: https://windows.lbl.gov/software/therm (accessed on 6 November 2017).
  27. ASHRAE. ASHRAE Handbook of Fundamentals; ASHRAE: Atlanta, GA, USA, 2017. [Google Scholar]
  28. Ministry of Land, Infrastructure and Transportation; Korean Design Standard for Energy-Efficient Building Design, Notification No. 2015-1108; Korean Ministry of Land, Infrastructure and Transportation: Seoul, Korea, 2015. (In Korean)
  29. Korean Standard Association. KS F 2295 Test Method of Dew Condensation for Windows and Doors; Korean Standard Association: Seoul, Korea, 2014. (In Korean) [Google Scholar]
  30. Korean Standard Association. KS F 2278 Standard Test Method for Thermal Resistance for Windows and Doors; Korean Standard Association: Seoul, Korea, 2014. (In Korean) [Google Scholar]
  31. Physibel. TRISCO Manual of Version 12.0w, Maldegem, Belgium, 2010. Available online: http://www.physibel.be (accessed on 6 November 2017).
  32. DIN EN 673. Glass in Building—Determination of Thermal Transmittance (U Value)—Calculation Method; German Institute for Standardization: Berlin, Germany, 2011. [Google Scholar]
  33. ISO 13788. Hygrothermal Performance of Building Components and Building Elements—Internal Surface Temperature to Avoid Critical Surface Humidity and Interstitial Condensation—Calculation Methods; International Standard Organization: Geneva, Switzerland, 2012. [Google Scholar]
  34. ISO 6946. Building Components and Building Elements—Thermal Resistance and Thermal Transmittance—Calculation Method; International Standard Organization: Geneva, Switzerland, 2007. [Google Scholar]
  35. LG Hausys. Accredited Test Report; LG Hausys: Seoul, Korea, 2015. (In Korean) [Google Scholar]
  36. Hart, R.; Misiopecki, C.; Gustavsen, A.; Jelle, B.P.; Arasteh, D. Impacts of operating hardware on window thermal performance. In Proceedings of the Building Enclosure Science & Technology (BEST 3-2012), Atlanta, GA, USA, 2–4 April 2012. [Google Scholar]
Figure 1. Spacer bar assemblies of a conventional aluminum spacer and a thermoplastic spacer (TPS): (a) aluminum spacer; and (b) thermoplastic spacer (TPS).
Energies 11 00382 g001
Figure 2. The tested window scheme and assessment points.
Energies 11 00382 g002
Figure 3. Schematic of the experimental configuration.
Energies 11 00382 g003
Figure 4. View of a test window in the hot box.
Energies 11 00382 g004
Figure 5. The treatment of the boundaries according to ISO 10077-2: (a) schematic of boundaries for Case 4; (b) shown in red are the local regions of increased surface resistance due to reduced radiation and convection.
Energies 11 00382 g005
Figure 6. Cross-sections of a simulation model: (a) sill of a tilt and turn window; (b) sill of a fix window; and (c) meeting rail.
Energies 11 00382 g006
Figure 7. 3D Simulation model and temperature assessment points.
Energies 11 00382 g007
Figure 8. Measured and calculated temperatures at each assessment point.
Energies 11 00382 g008
Figure 9. Measured and calculated temperature factors (fRsi) at each assessment point.
Energies 11 00382 g009
Figure 10. 3D isotherms: (a) isotherms for a whole window; (b) part of a window; and (c) isothermal lines and Point E-1.
Energies 11 00382 g010
Figure 11. Measured and calculated temperature factors (fRsi) according to the surface thermal resistance: (a) center-of-glazing (C-1); (b) frame (F-2); (c) edge-of-glazing (E-1); and (d) edge-of-glazing (E-2).
Energies 11 00382 g011
Table 1. Boundary conditions for the test.
ChamberTemperature (°C)Relative Humidity (%)Surface Resistance (m2K/W)
Hot box25.0 ± 1.050 ± 1.00.11 ± 0.02
Cold box−15.0 ± 1.0-0.05 ± 0.02
Table 2. Simulation cases and boundary conditions.
Temperature (°C)CaseSurface Thermal Resistance (m2K/W)Reference
ExternalInternalExternalInternal
−15.025.010.0430.11[8]
20.050.11[29]
30.040.13[33,34]
40.04Normal0.13[19]
Reduced radiation and convection at edges0.20
Table 3. Material properties for the numerical simulation.
GroupMaterialThermal Conductivity (W/mK)Emissivity Reference
FrameSteel, oxidized 50.00.8[25]
EPDM (gaskets) 0.250.9[25]
PVC 0.170.9[19]
GlazingGlass 1.000.84[26]
Low-e coating 1.000.03[26]
Argon gas 0.017-[26]
SpacerSilicone sealant0.350.9[19]
Thermoplastic 0.250.9[35]
Table 4. Surface temperature and fRsi from tests and simulations.
CaseC-1E-1E-2F-1F-2
Tsi (°C)fRsiTsi (°C)fRsiTsi (°C)fRsiTsi (°C)fRsiTsi (°C)fRsi
Test22.80.9514.80.7515.70.7719.60.8719.00.85
Sim.121.90.9217.60.8217.80.8218.50.8418.00.83
3.9% *2.4%18.9%9.3%13.4%6.8%5.6%3.2%5.3%2.9%
221.90.9217.70.8217.90.8218.50.8418.10.83
3.9%2.4%19.6%9.7%14.0%7.1%5.6%3.2%4.7%2.6%
321.40.9116.50.7916.80.8017.60.8217.00.80
6.1%3.7%11.5%5.7%7.0%3.6%10.2%5.7%10.5%5.9%
421.40.9115.60.7716.00.7817.30.8116.90.80
6.1%3.7%5.4%2.7%1.9%1.0%11.7%6.6%11.1%6.2%
* Percent error of the difference between measured and calculated data.

