Article

Pitch Angle Misalignment Correction Based on Benchmarking and Laser Scanner Measurement in Wind Farms

by
Unai Elosegui
1,*,†,
Igor Egana
1,†,
Alain Ulazia
2,† and
Gabriel Ibarra-Berastegi
3,4,†
1
Maxwind, Portuetxe 83, 3, 20018 Donostia, Spain
2
Department of NE and Fluid Mechanics, University of the Basque Country (UPV/EHU), Otaola 29, 20600 Eibar, Spain
3
Department of NE and Fluid Mechanics, University of the Basque Country (UPV/EHU), Alda, Urkijo, 48013 Bilbao, Spain
4
Joint Research Unit (UPV/EHU-IEO) Plentziako Itsas Estazioa (PIE), University of Basque Country (UPV/EHU), Areatza Hiribidea 47, 48620 Plentzia, Spain
*
Author to whom correspondence should be addressed.
These authors contributed equally to this work.
Energies 2018, 11(12), 3357; https://doi.org/10.3390/en11123357
Submission received: 27 October 2018 / Revised: 14 November 2018 / Accepted: 23 November 2018 / Published: 1 December 2018
(This article belongs to the Special Issue Maintenance Management of Wind Turbines)

Abstract

:
In addition to human error, manufacturing tolerances for blades and hubs cause pitch angle misalignment in wind turbines. As a consequence, a significant number of turbines used by existing wind farms experience power production loss and a reduced turbine lifetime. Existing techniques, such as photometric technology and laser-based methods, have been used in the wind industry for on-field pitch measurements. However, in some cases, regular techniques have difficulty achieving good and accurate measurements of pitch angle settings, resulting in pitch angle errors that require cost-effective correction on wind farms. Here, the authors present a novel patented method based on laser scanner measurements. The authors applied this new method and achieved successful improvements in the Annual Energy Production of various wind farms. This technique is a benchmarking-based approach for pitch angle calibration. Two case studies are introduced to demonstrate the effectiveness of the pitch angle calibration method to yield Annual Energy Production increase.

1. Introduction

Ideally, there are no manufacturing or assembly errors in wind turbines, and the blades are equal in mass, center of gravity location, shape, and structure. As a consequence, the three blade root axes intersect with the rotor axis at the very same point. In addition, in the ideal scenario, the orientation of the three blades is equal, and when substantial demand is placed on them to form a fine pitch angle to maximize power production, the three blades face the wind with the very same angle of attack; this is the angle between the line of the chord at a particular blade section and the relative airflow, as in Figure 1.
However, blade manufacturing is a poorly automated process. Variances in fiber placement, bonding, and curing cause variation not only in the blade mass distribution but also in the blade profile shape. In addition, the blade pitch angle reference that is set up at the very end of the manufacturing process is subject to human error. Furthermore, hub manufacturing tolerances that move the blade axes from the intersection point on the rotor axis cause pitch angle misalignment [1,2,3].
In this context, some consultancy firms offer different solutions, mainly through photometric means. The solutions currently provided by the private sector ([4] or [5]) involve such technology to calculate the pitch angle. There are some slight differences among the technologies used by these firms, but they basically carry out the measurements by placing a camera under the wind turbine or rotating with the blade itself [6], as seen in Figure 2, where the chord line is drawn. The rotation plane is set with the other two blades.
There are different techniques to measure the pitch angle. In some cases, it is calculated based on a comparison of measurements taken at the maximum chord line with the rotor plane. Another methodology is based on setting marks along the blade and establishing the blade section and chord at the given section.
However, this method faces some challenges that compromise the robustness of the results. According to our experience in the field, the authors observe the following:
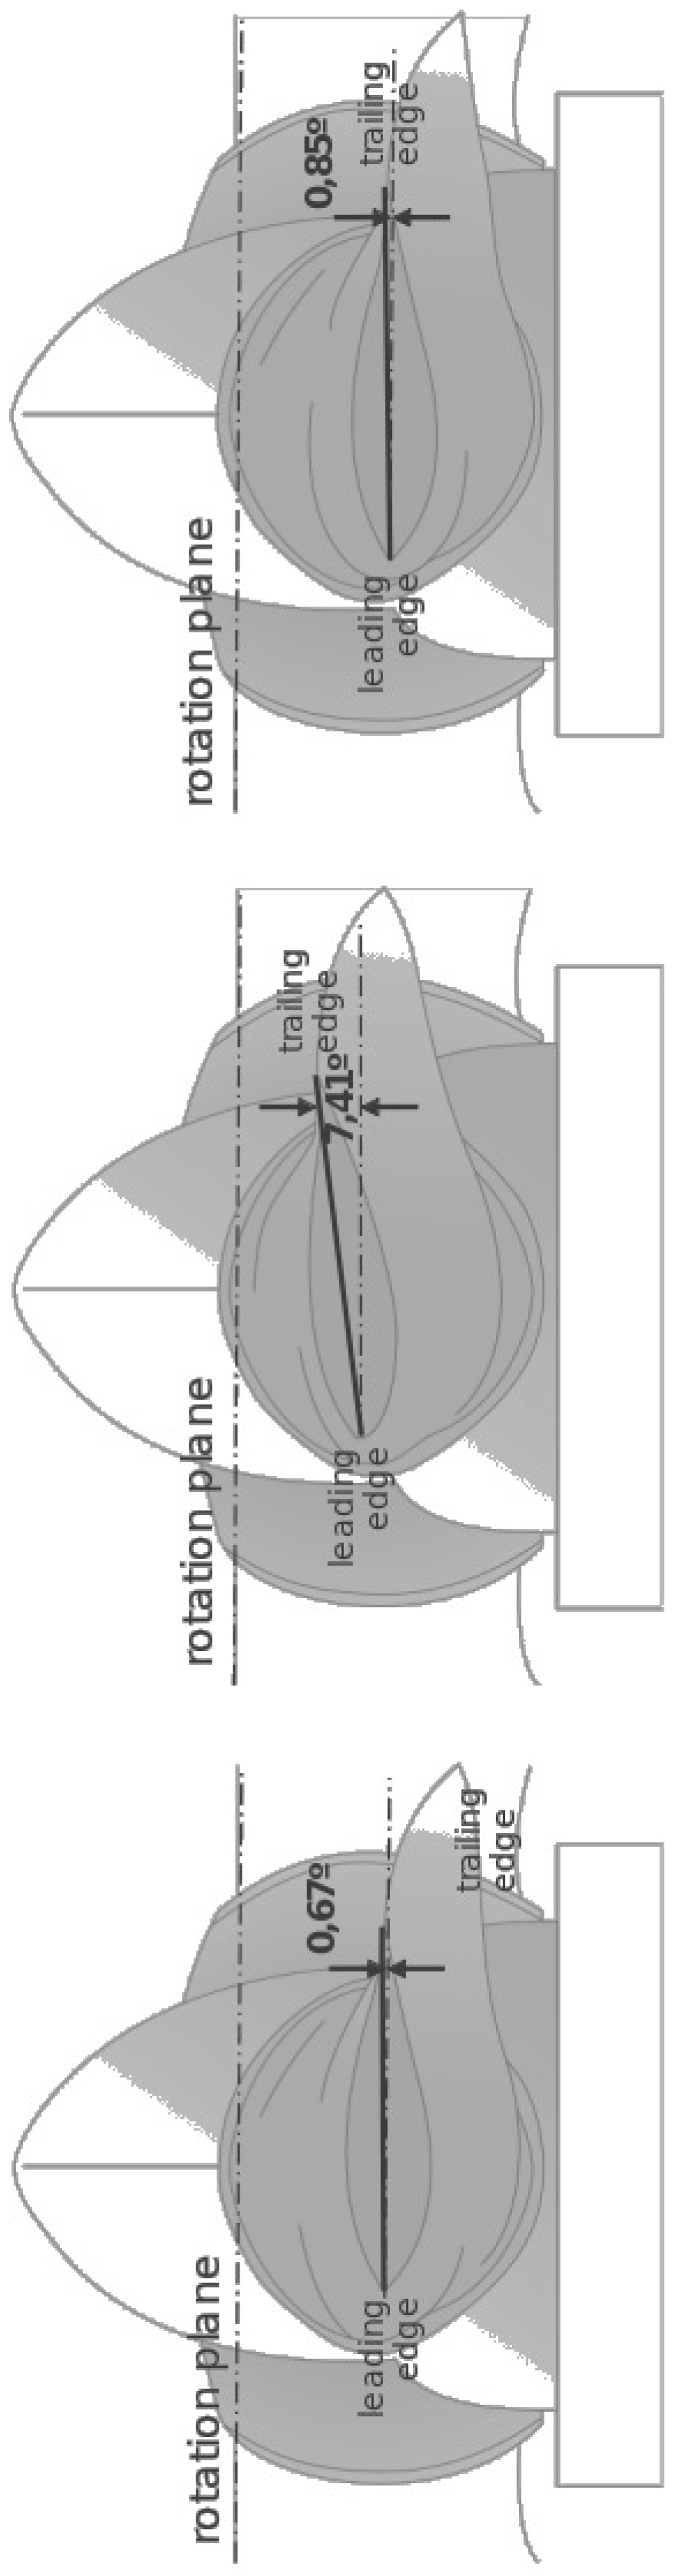
  • According to this technique, pitch angles are obtained based on three different rotation planes: the plane defined by blades 2–3 for blade 1’s pitch angle calculation; the plane defined by blades 3–1 for blade 2’s pitch angle calculation; and the plane defined by blades 1–2 for blade 3’s pitch angle calculation. Since the blade axes are not coplanar due to manufacturing and assembly tolerances, it can lead to variances larger than 0.5 .
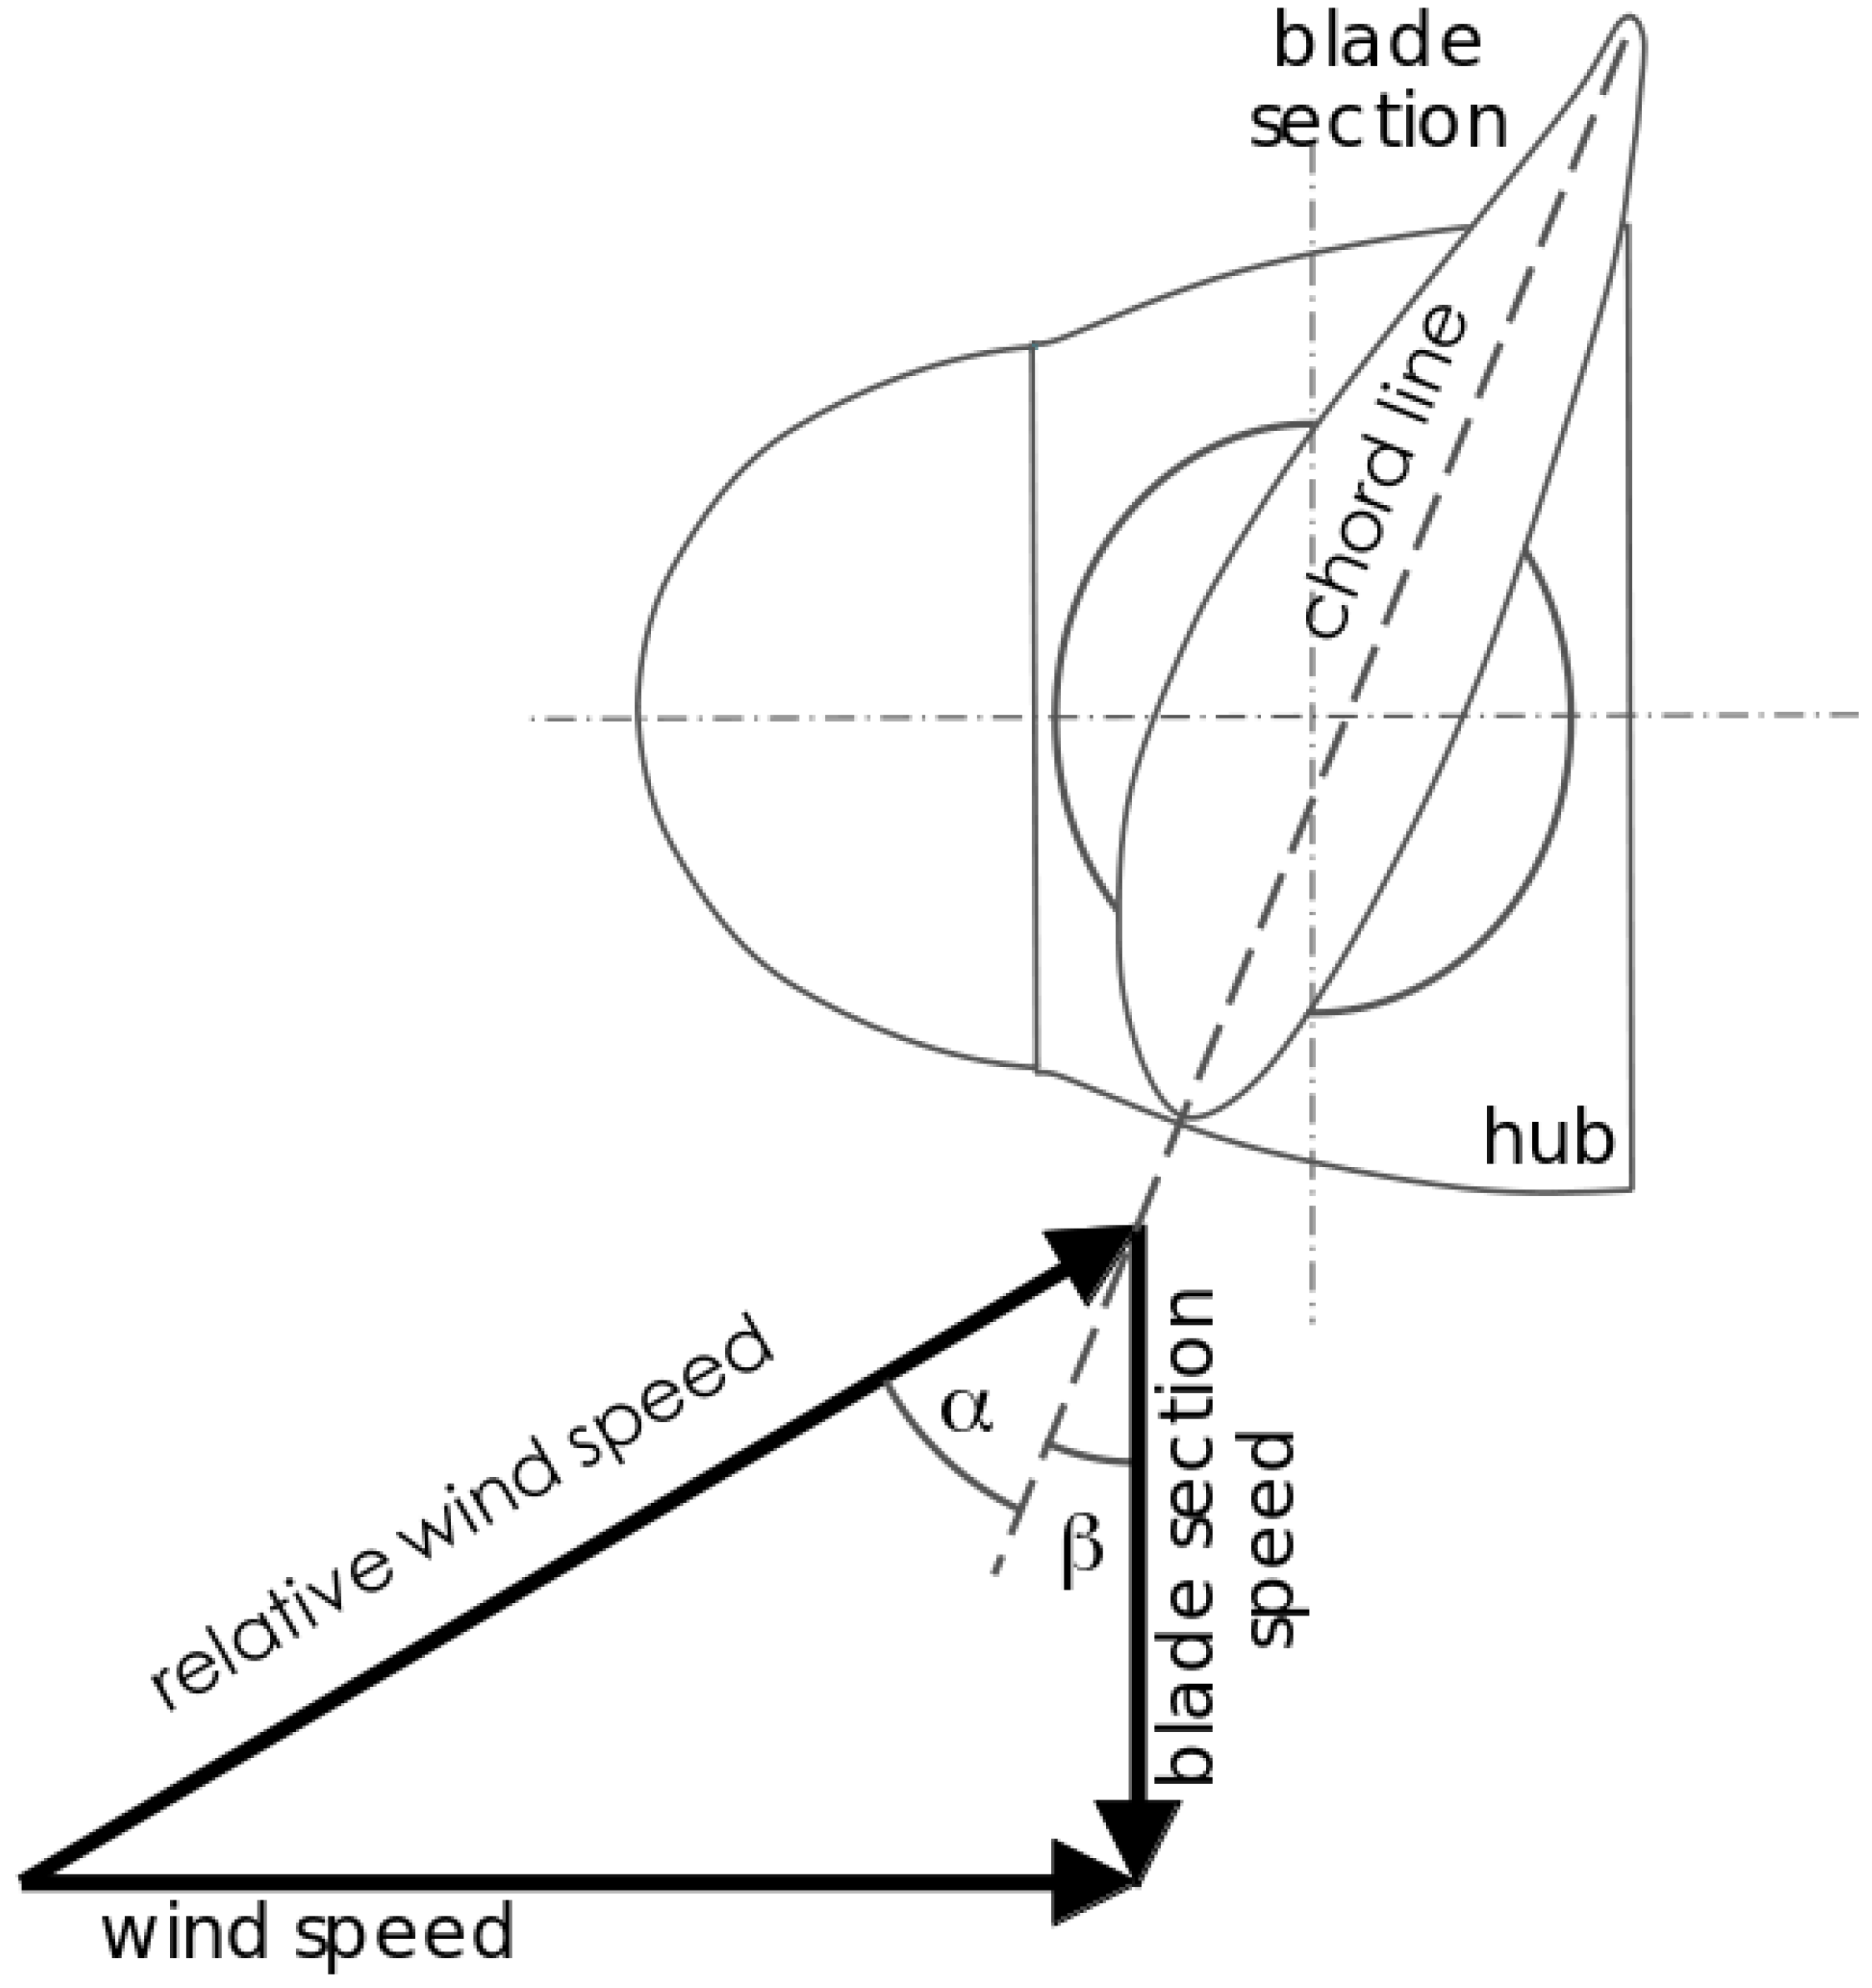
  • To use this technique for calculations based on the same blade section, the blade axis must be placed so that it is pointing downward while being perfectly aligned with the measuring system. However, such an alignment is difficult, as it is done manually and there is no fixed reference against which the three blades of a rotor can be placed in the very same position.
  • Assuming that pitch angle differences within the rotor of a particular turbine are accurately measured, the only way to correctly determine the absolute pitch angles is by either:
    (a)
    obtaining the pitch angle at the maximum chord line from the turbine manufacturer, although it is very rarely available due to the sensitivity of turbine design information; or
    (b)
    placing the measuring system in the very same location with respect to the rotor in every turbine; however, it must be noted that slight errors in this position create variation in the measurement of absolute pitch angles.
Another method used by other companies [7] is based on a laser device that measures the maximum chord of the profile and determines the relative misalignment between the blades. It is performed with turbines used in power production. However, this technique shows a very remarkable drawback: it does not obtain the absolute pitch angle values, which are key to ensuring power production improvement and avoiding decreases in turbine lifetime. Although setting the blades at the same relative pitch angle does remove aerodynamic imbalance, it does not guarantee that the resulting fine pitch is the one defined in the turbine design that was product certified.
Another method is based on laser scans from quite a long distance from the rotor [8]. Due to the trade-off between accuracy and scanning distance, this methodology is time-consuming. In addition, for this technique to address absolute pitch angle correction, the wind turbine’s design information is required, which is seldom available.
Some recent developments in laser technology have made it suitable for long distances and outdoor conditions. However, the leading manufacturers of laser-based measuring systems ([9,10]) do not have experience in this particular application.
In this context [11], the parent company of [12] initiated development of the technique by exploring different laser systems. Field tests began with laser tracker technology [13], but measuring a few key points of a rotor takes an entire workday. Laser scanner technology [14,15] was finally adopted as the better option for getting far more measurements per turbine in a much shorter period of time per turbine without the hassle of accessing blade exteriors up-tower. This method was patented in 2013 with the title ‘METHOD FOR CALCULATING AND CORRECTING THE ANGLE OF ATTACK IN A WIND TURBINE FARM’ (Pub. No.: WO/2014/068162; International Application No.: PCT/ES2013/070752) [16]. The main claim of this patent is the replication of the pitch angle settings of the Best in Class turbine in the Worst in Class turbines, said turbines being identified through a power performance analysis.
Following the publication of this patent, Maxwind is working worldwide applying this method in several wind farms [12]. A preliminary exposition of the results in wind farms was presented last year at the ICAE2017 conference [17]. This paper is a substantial extension of that short paper: this contribution presents the quantitative consequences in power production due to pitch misalignment, describes the general correction method in which the laser scanner is an intermediate step, and, finally, shows the positive results after the correction in the last years at two wind farms.

2. Pitch Angle Misalignment

2.1. State of the Art

Pitch misalignment and its implications for energy production in wind turbines have not received much attention as a specific problem. This applies both to the developments specifically made in the framework of the private sector (usually as patents) and also the apportions from a wider number of actors as gathered in the scientific literature.
In both cases, the general approach has been to address the problem of pitch misalignment in conjunction with other issues like yaw misalignment or mechanical load balancing in the wind turbine. Load reduction method for wind turbine involves adjusting yaw alignment of wind turbine according to favorable yaw orientation, and adjusting pitch of rotor blade [18].
In addition, the analysis of pitch misalignment involves the use of general-purpose laser scanners, but the leading manufacturers of laser scanners ([9,10]) do not have experience in pitch misalignment measurements. Therefore, our method based on laser measurements applied to specifically measuring pitch misalignment in wind turbines is totally novel for this purpose, and difficult to compare with previous results applied in the consultancy sector.
To the best of our knowledge, there is only one study about the use of laser scanners to measure turbine blades, but it is for the determination of deformations of moving rotor blades [19]. They use multiple scanners in 1D mode to record cross sections at different positions along the rotor blades, and, after that, they compare these results with the CAD (Computer Aided Design) model of the blade. The deformations in out-of-plane and torsional direction can be derived. The nacelle is also pre-scanned to establish the coordinate system of the wind turbine as reference. Therefore, this is a dynamic scanning to measure the deviations of the blades due to bending and flapping forces when the turbine is moving under the dynamic pressure of the wind. In our particular case, the authors want to measure the inherent pitch misalignment on the hub, a problem that is not taken into account in the pre-operational tests in large certification laboratories using photometric means [20,21], or during operation via strange gauges [22] or reflective targets observed with stereo camera systems [23]. Furthermore, this inherent pitch misalignment can increase with time due to the stress and fatigue that supports the wind turbine.
As mentioned in the patent document, our correction method is post-operational. In the installation moment when the operators have to move huge blades that are implemented on the hub, there are pre-established marks to align both elements, the root of the blade and the hub. However, a final calibration is not usually performed to ensure that the position is correct. This is the original cause of the presence of an inherent pitch misalignment in wind turbines.
Pitch angle errors have no impact in terms of power production above the rated power, as blades are pitched toward the feathering position in order to limit turbine loads. However, energy production loss can be remarkably high below the rated power conditions. Thus, understanding the sensitivity of power production under pitch angle errors is paramount, as this method entails understanding how turbines are affected by pitch angle misalignment.
Coming to the scientific literature, it is clear that there is a general challenge for optimizing wind energy performance and applies to all type of turbines, including vertical rotors [24]. Again, it is important to highlight that the general approach for dealing with pitch misalignment involves a combined study in conjunction with other parameters related to wind turbine general misalignments and balance.
In fact, the sensitivity analysis of power production in relation to the pitch angle and other parameters needs complex inference strategies, such as ANFIS (Adaptive Neuro-Fuzzy Inference System), as is shown in the recent literature [25,26,27,28]. There are also data-driven approaches to detect or somehow balance pitch angle faults alone [29,30] or in combination with other parameters [31,32].
It is worth mentioning that, in the particular case of floating wind turbines, joint control of both blade pitch and platform pitch is required [33]. Computational experience has improved the power output by optimizing the set points of the blade pitch angle and generator torque [34].
Other works have applied blade design approaches to enhance the power output, both experimentally and numerically. Such methods include the use of active and passive techniques, attempts to reduce the cut-in speed, and the development of new materials [35].
For example, there are improvement techniques based on passive flow control devices, such as vortex generators (VG) or Gurney flaps (GF), that are implemented on the surface of the blade. For the best configuration cases of these devices, simulations have shown 3–10% increases in the power output, depending on the wind speed, with residual increases in the bending moment [36]. Using the case studies described in Section 4, the authors show that pitch misalignment correction can produce improvements of 16% in annual energy production ( A E P ) and much higher percentages for the power output below the rated wind speed.
Therefore, the influence of faults in the pitch angle, as well as active or passive control, has been widely studied in the literature, and methodologies to correctly evaluate improvements after upgrades have been developed [37]. However, these studies have not directly accounted for the possible inherent misalignment of the blade on the hub and the consequent general diminution of the power output. The technique described here offers a direct in situ way, i.e., on the wind farm, to measure this specific deviation.
In addition, pitch angle misalignment reduces the turbine lifetime. This happens when the rotor is aerodynamically imbalanced, but it also occurs with a balanced rotor showing a negative offset with respect to the correct position. The latter is further discussed in Section 2.2. However, it is important to emphasize that it is very hard to quantify this effect for extrapolating results from one turbine to another, given the complexity of the load and transient load calculations. Any assessment of this kind [27] needs to include extreme load calculations and fatigue load analysis under the wind conditions defined per IEC (International Electrotechnical Commission) wind class. Thus, this section does not aim to address every potential effect of pitch angle misalignment on the load envelope but to introduce insights into the effect of pitch angle misalignment on turbine lifetime.

2.2. Impact of Pitch Misalignment on Power Production

In order to discuss the effect of pitch angle misalignment on the power curve, this section establishes the use of the Power Curve Ratio ( P C R ). The P C R is defined as the ratio calculated for each wind speed used for power production by a particular turbine over the potential output power. Whereas the ultimate concern for wind farm owners is the effect on the A E P , P C R facilitates the understanding of the sensitivity of the A E P under pitch deviations; as a consequence, its use is suggested for diagnostic purposes.
For this analysis, static and dynamic simulations are discussed. These simulations were carried out in FAST using the publicly available turbine model WindPACT 1.5 MW Baseline [38]. This turbine is controlled with the standard controller described in [39], which is, to some extent, the most extended concept within the industry. This is a tool customarily used in pitch control studies [40].
Figure 3 depicts a turbine operation in three different ways: on the left-hand side is the trajectory over the power coefficient surface with the pitch angle β and tip-speed ratio ( T S R ); on the upper right-hand side is the torque demand T with respect to the rotor speed Ω , which is a feature that only depends on the control system; the lower right-hand side shows the power curve, which describes the production capability of the turbine with wind speed. These three figures reflect steady-state conditions, disregarding transients. The black thick line depicts rotor speed regulation at low rotor speeds, Ω l o w ; the blue thick line depicts operation at a maximum power coefficient with a constant T S R ; the red thick line shows rotor speed regulation at the nominal rotor speed, Ω N ; and the thick gray line depicts operation at the nominal power with rotor speed regulation by blade pitching.
The black thick lines in Figure 3 show operation at winds slightly over cut-in conditions. T S R rapidly decreases as wind increases. As a consequence, the power coefficient increases with rotor speed regulation around Ω l o w by torque modulation. The blue thick lines in Figure 3 illustrate operating at a constant T S R and reaching the maximum power coefficient. In these conditions, torque demand is controlled proportionally to the second power of the rotor speed Ω . Shown by the thick red lines in Figure 3, as the rotor speed reaches the nominal value Ω N , regulation by torque demand occurs again, diminishing the power coefficient. This occurs slightly below the nominal power. The thick gray lines in Figure 3 depict the rated power operation, where the rotor speed is regulated around Ω N by blade pitching.
In this context, the power curve was simulated for different pitch misalignment conditions. It was normalized by computing the P C R , as explained above in this section, and the A E P loss. Figure 4 shows the P C R and A E P loss for different conditions of pitch misalignment resulting from steady-state simulations.
Dynamic simulations were run under turbulent wind conditions for three different pitch misalignment cases, as shown in Figure 5 and described below:
  • Case 1: One blade is in the correct position, and two blades have similar errors with opposite signs.
  • Case 2: The three blades are affected by the same pitch angle misalignment.
  • Case 3: Two blades are in the correct position, one blade has a pitch angle error.
In both static and dynamic simulations, the pitch misalignment has been introduced in the FAST input file primary.fst to obtain the power output time series in simulations of 600 s with a step of 0.0125 s. The initial pitch angles of the blades (parameters BlPitch) have been deviated from 0 according to the Case 1, 2 and 3, and pitch control has been deactivated to keep these values below the rated wind speed (PCMode: 0).
Before the dynamic simulation, a turbulent input of the wind speed has been created using TurbSim for the same period of simulation. This has been done at each wind speed with a step of 0.5 m/s between the cut-in wind speed and the rated wind speed. In this way, the power curve due to a given misalignment is determined. After that, for the computation of A E P , a typical Weibull distribution of wind speed with the form parameter k = 2 has been implemented on the deviated power curve due to misalignment. An average wind speed U ¯ of 4 m/s has been used, and the subsequent Weibull’s scale parameter [41]:
c = U ¯ Γ ( 1 + 1 / k ) .
On behalf of clarity and due to the approximate results for negative and positive pitch errors with the same absolute value, the average behavior of the two values of errors for each wind speed are shown in the P C R figures on the left in the Case 1, 2, and 3 (Figure 5a–c). On the right, the corresponding A E P losses are shown for each case with respect to a reference without pitch misalignment (0-error), and considering misaligned cases with integer negative and positive values of pitch angle deviation. Although the mean value is used for the P C R curves, the A E P figures do provide evidence of the asymmetry between negative and positive values in favor of higher values of the last ones.
Similar patterns to those of the static results are observed, and they are consistent with [42], although this reference did not suggest using this method for the detection of pitch angle misalignment. For the P C R functions, the curves exhibit a small slope in the quadratic zone caused by wind speed variability around its mean value. In the quadratic zone, the turbine is operating around the maximum power coefficient ( C p ) point, but not just at its maximum. In general terms, from the static and dynamic simulations, it can be stated that:
  • The static results match the dynamic results.
  • The P C R functions exhibit a well-defined shape that is dependent on the operation zone. This will be useful to identify pitch errors in field measurements.
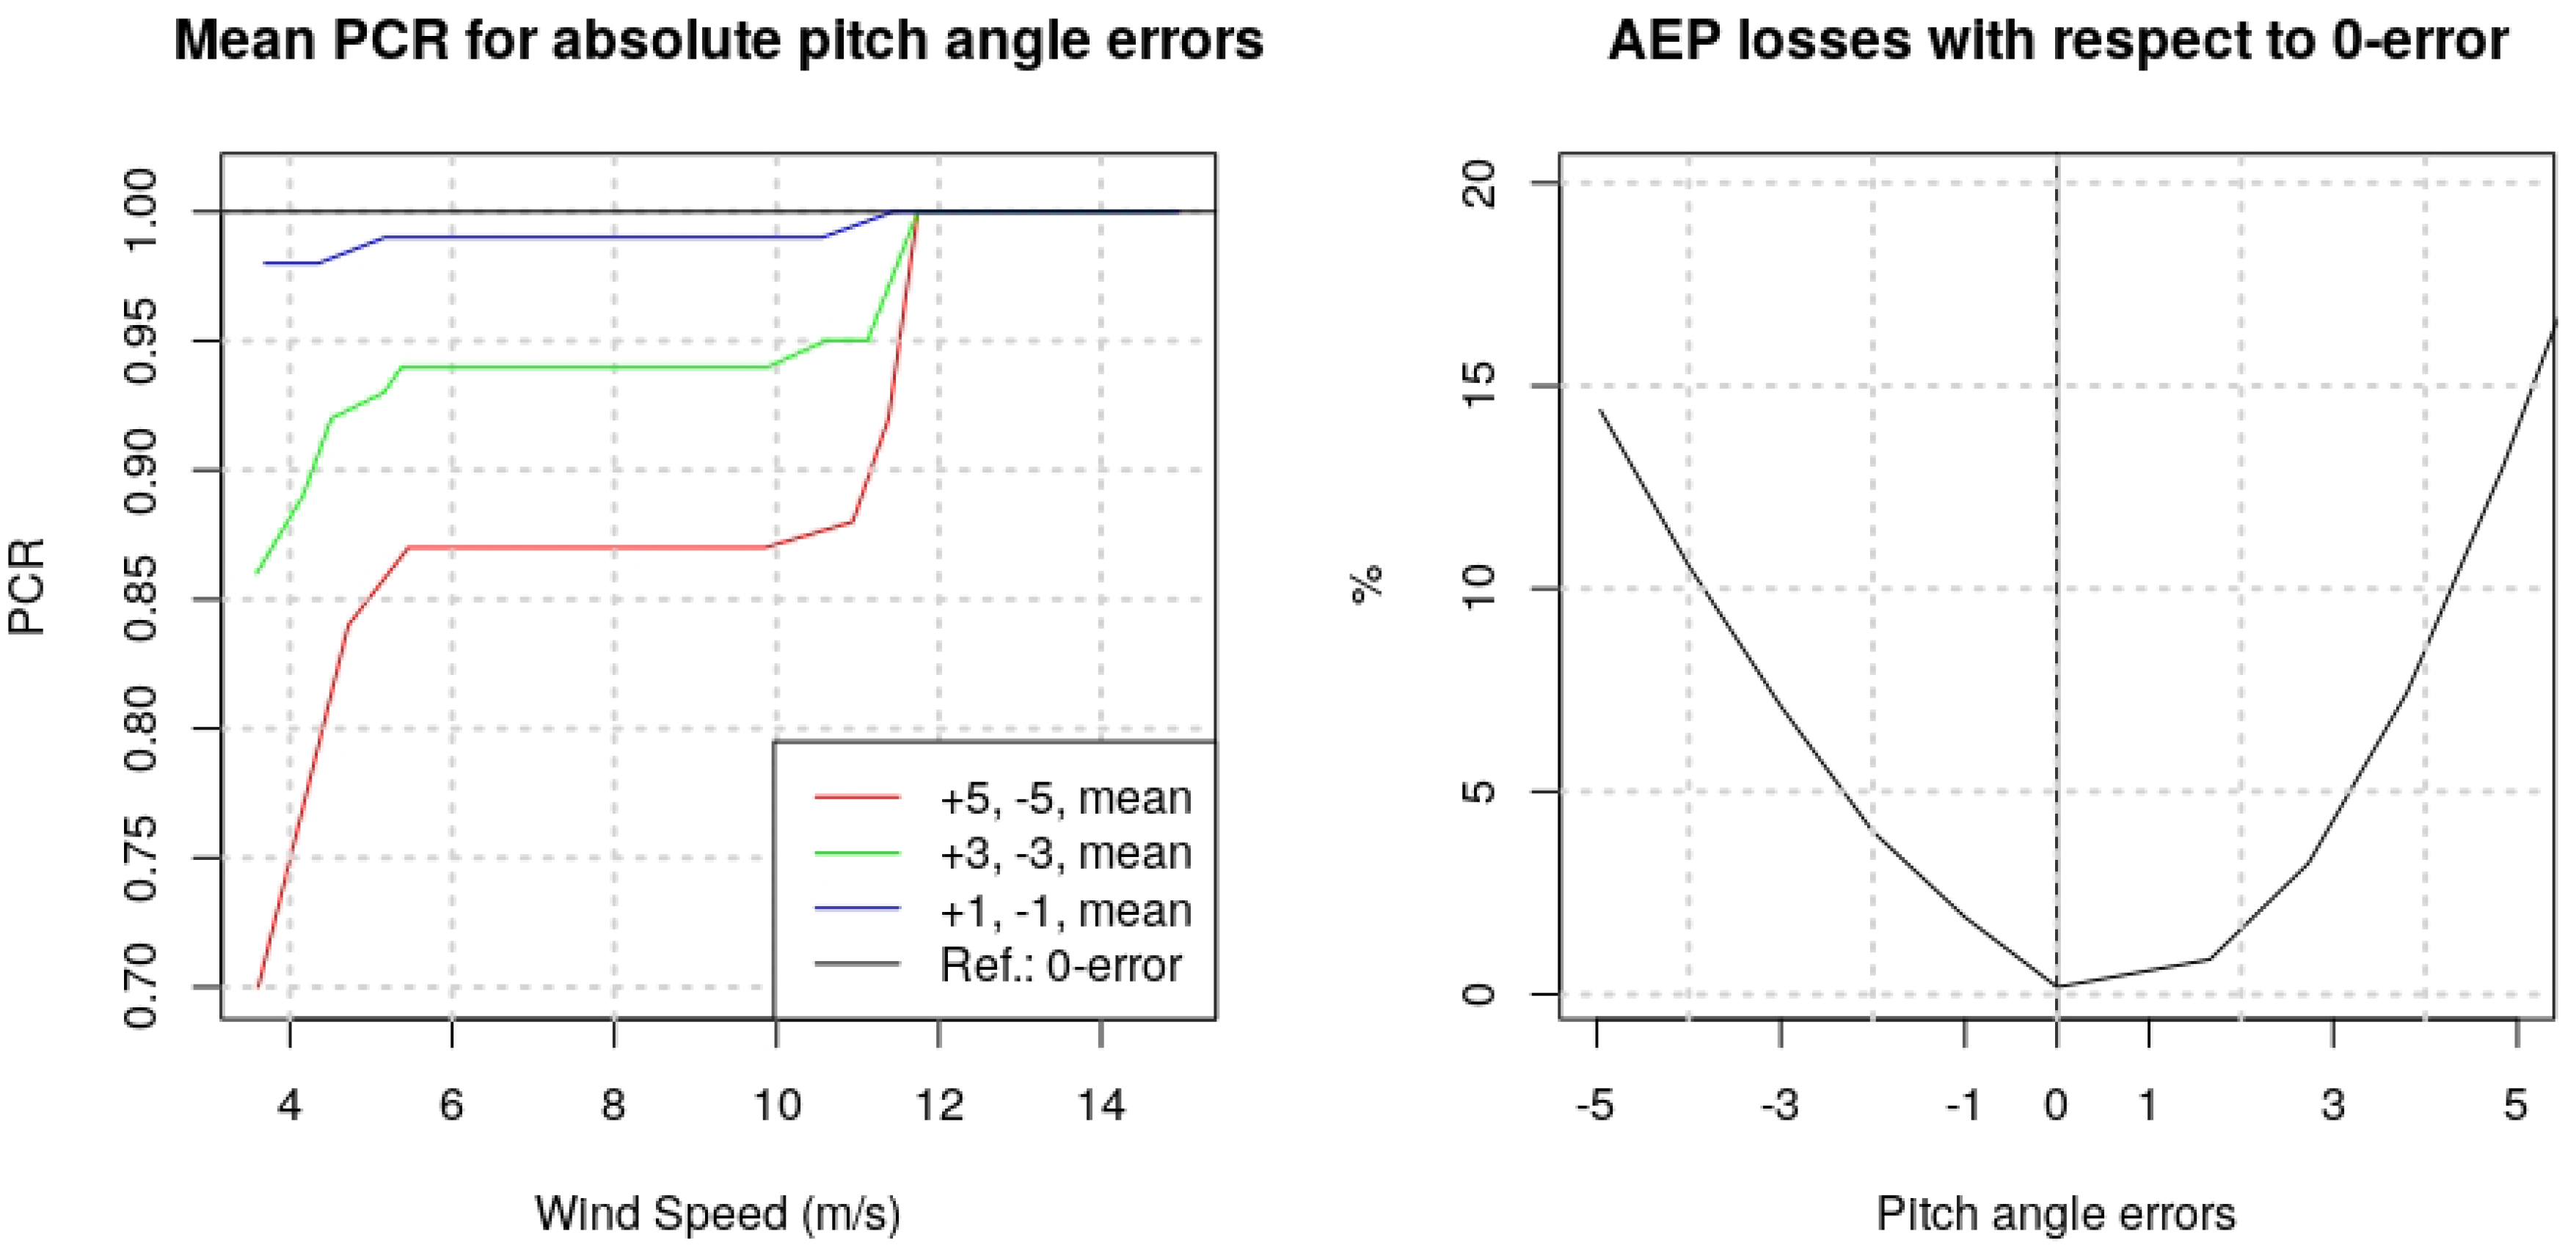
  • The total A E P losses can be approximated by adding the A E P losses on each blade. The total wind turbine A E P is notably sensitive to blade assembly errors. A small pitch discrepancy of 2 in only one blade is able to reduce approximately 1% of the A E P value.
  • An absolute misalignment of 2 in the three blades also causes an A E P loss; in this case, the loss is 3.5%.
  • Because of the nonlinear dependence of the A E P loss on the pitch error, it is better to have small pitch errors in all three blades than it is to have only one blade with a high error.
  • Understanding that power production is proportional to the third power of the wind speed, yaw misalignment yields a completely different pattern that is virtually flat on the low end and middle of the wind speed range.

2.3. Impact of Pitch Misalignment on Turbine Lifetime

Since the consequences of pitch angle misalignment on turbine lifetime depend on the turbine design [43], it is not possible to extrapolate results from one turbine to another. Such an assessment [44] should include not only thorough extreme load calculations, but also thorough fatigue load analysis under the wind conditions defined per IEC wind class.
Thus, this section does not aim to address every potential effect of pitch angle misalignment on the load envelope but at introducing some insights into the effect of pitch angle misalignment on turbine lifetime.

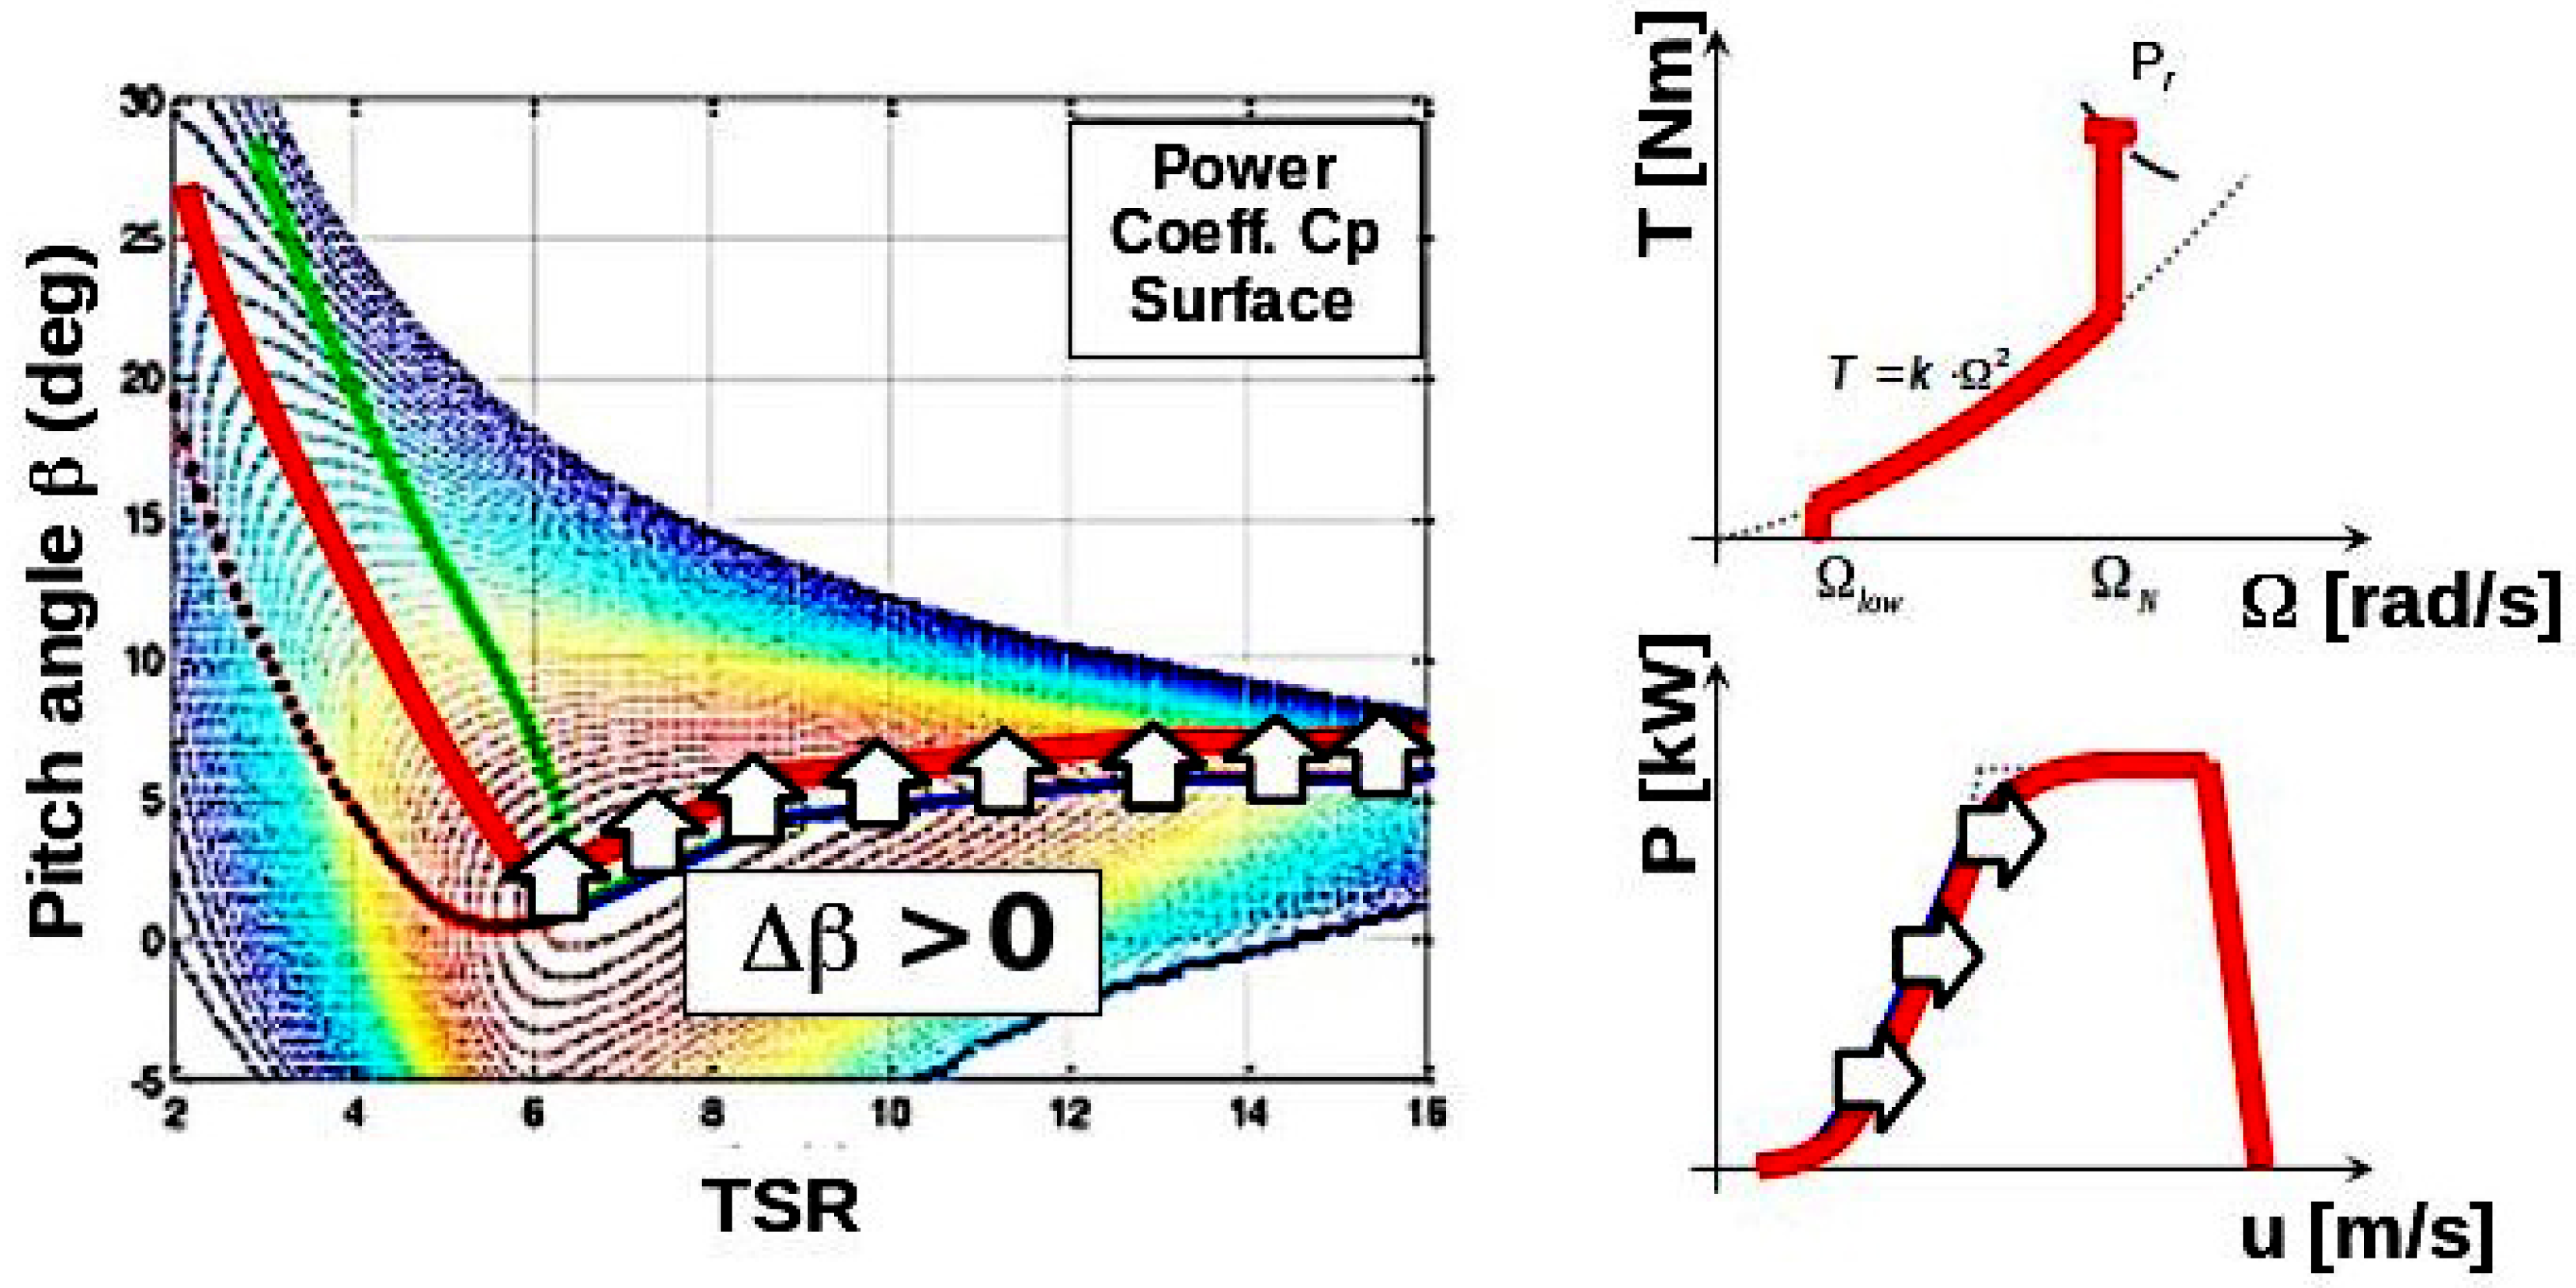
2.3.1. Effect of Even Positive Pitch Angle Offset

This subsection analyzes the effect of the three blades suffering from an offset toward higher pitch angles, as shown in Figure 6.
Should the three blades be equally shifted toward higher pitch angles, then the maximum power coefficient is not reached, as shown by the red trajectory over the power coefficient surface in Figure 6. The immediate consequence is that performance in terms of power production is decreased, as the power curve is shifted toward the right-hand side. Rated power is reached at higher wind speeds, and power curtailment occurs by pitching the blades toward the feathering position, beginning with higher pitch angles. Rotor speed controller robustness should be more than capable of coping with this uncertainty, although it is true that the performance at crossover frequencies would be affected, yielding a higher peak in the sensitivity function.

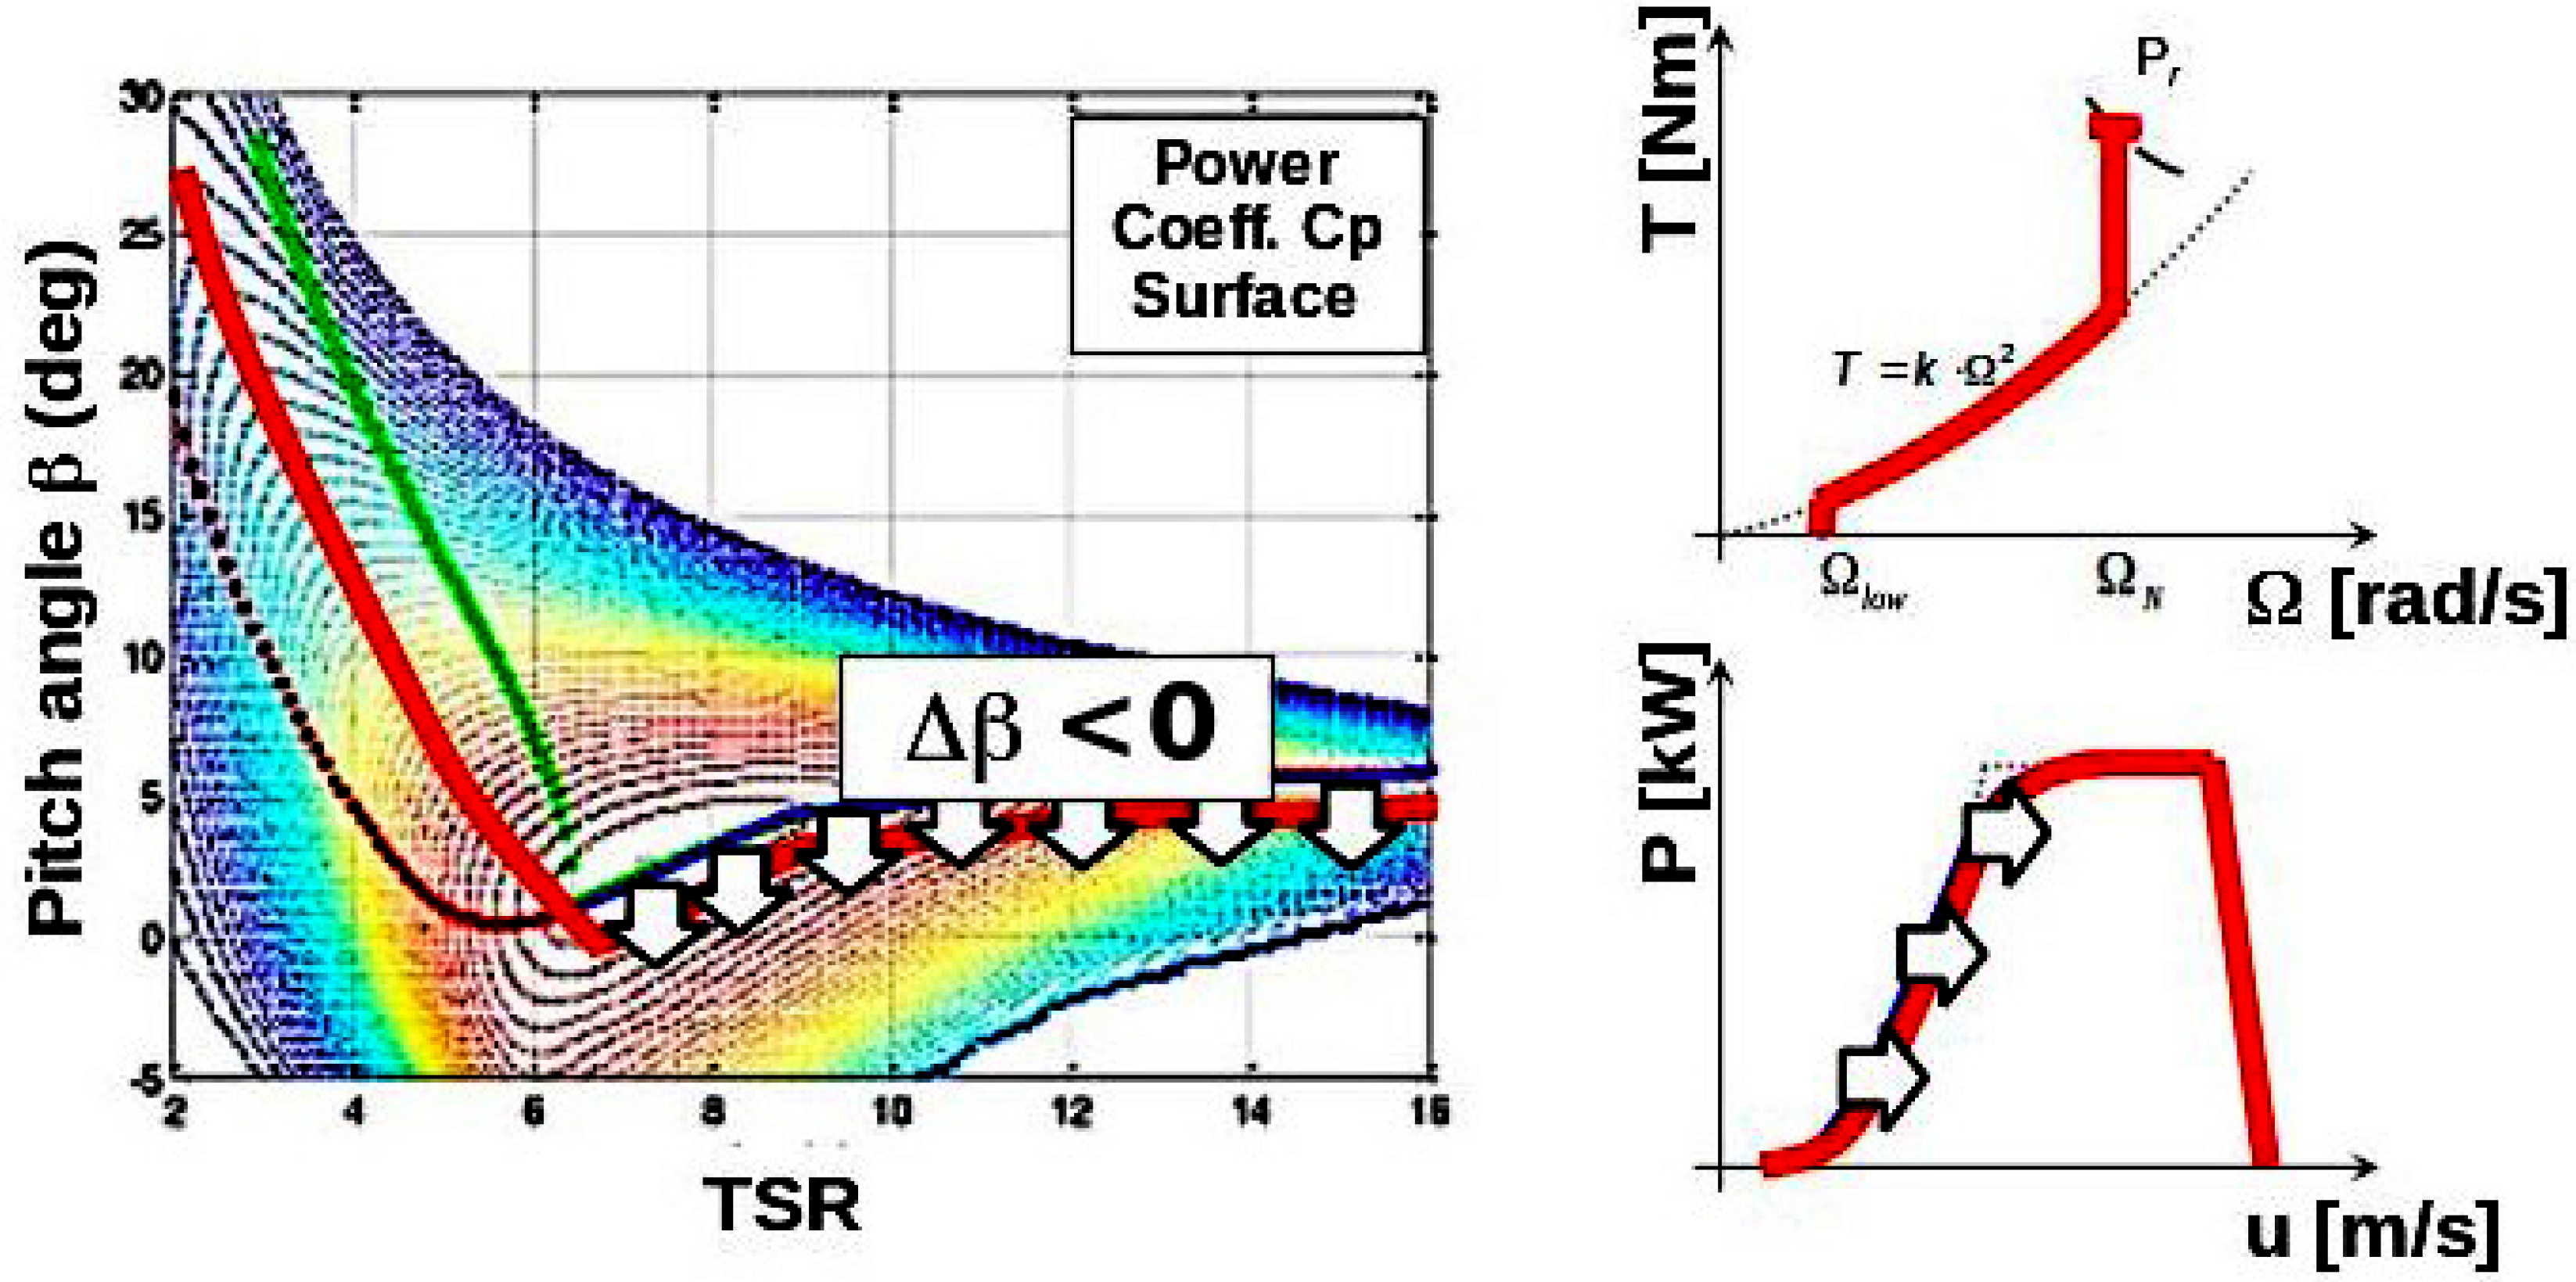
2.3.2. Effect of Even Negative Pitch Angle Offset

This subsection analyzes the effect of the three blades suffering from an offset toward lower pitch angles, as shown in Figure 7.
Should the three blades be equally shifted toward lower pitch angles, then the maximum power coefficient is not reached, as shown by the red trajectory over the power coefficient surface in Figure 7. Thus, power production performance is decreased, as the power curve is shifted toward the right-hand side. Rated power is reached at higher wind speeds, and power curtailment occurs by pitching the blades toward the feathering position, beginning with lower pitch angles. This has a twofold effect:
  • The peak of the steady-state curve of the thrust force over the rotor increases.
  • Performance of the rotor speed controller by blade pitching is diminished due to lower plant gain. As a consequence, the controller bandwidth is reduced, creating much higher dynamic loads.
It is worth mentioning that loads at this particular operational point are extremely important for turbine integrity. As a consequence, those two effects can compromise turbine lifetime for key components, including the blades, hub, mainframe, yaw bearing, tower, and foundation.
Any pitch angle correction that does not ensure absolute pitch angle correction does not guarantee a power production increase and is a potential cause of turbine lifetime decrease.

3. Methodology

3.1. Novel on-Field Method for Pitch Calculation and Compensation

This section describes the methodology used for the detection and correction of pitch angle misalignment. The specific details about the use of the laser scanner and other aspects can be found in the original patent document [16].
Laser scanning is widely used for different technological purposes because it is a contactless 3D measurement method. It enables the measurement of distances and corresponding angles with a frequency of up to 1 MHz for moving objects, but most common applications capture static objects. The acquisition of points usually results from the rotation of the laser around the horizontal and vertical axis (3D). For referencing into a global coordinate system, other sensors such as GPS, INS or cameras are necessary [19,45,46]. Figure 8 shows the workflow of our method in which laser measurement is an intermediate step. First, a production performance assessment is carried out. The primary purpose of this analysis is to determine the turbines affected by pitch angle misalignment, and also to select the best turbine in terms of pitch angle settings: the outperforming turbine is the Best in Class turbine, whereas the Worst in Class turbines are those in which the pattern described in Section 2.1 is found. A secondary goal of such an analysis is to assess the A E P gaps between the Worst in Class turbines and the Best in Class turbine.
Laser measurements are taken on the Best in Class turbine and on the Worst in Class turbines, whereas the rest of the turbines are excluded from further site study activities. The benefit of this approach is that all efforts are focused on turbines where a significant A E P increase is guaranteed. Those measurements are then executed to determine the pitch angles of each blade of said turbines. Pitch correction angles are proposed based on measurements so that the pitch angle settings of the Best in Class turbine are used in the Worst in Class turbines.
Finally, a production performance assessment shows the effect of the pitch angle correction. Success is measured as the reduction in the A E P gaps between the Worst in Class turbines and the Best in Class turbine.

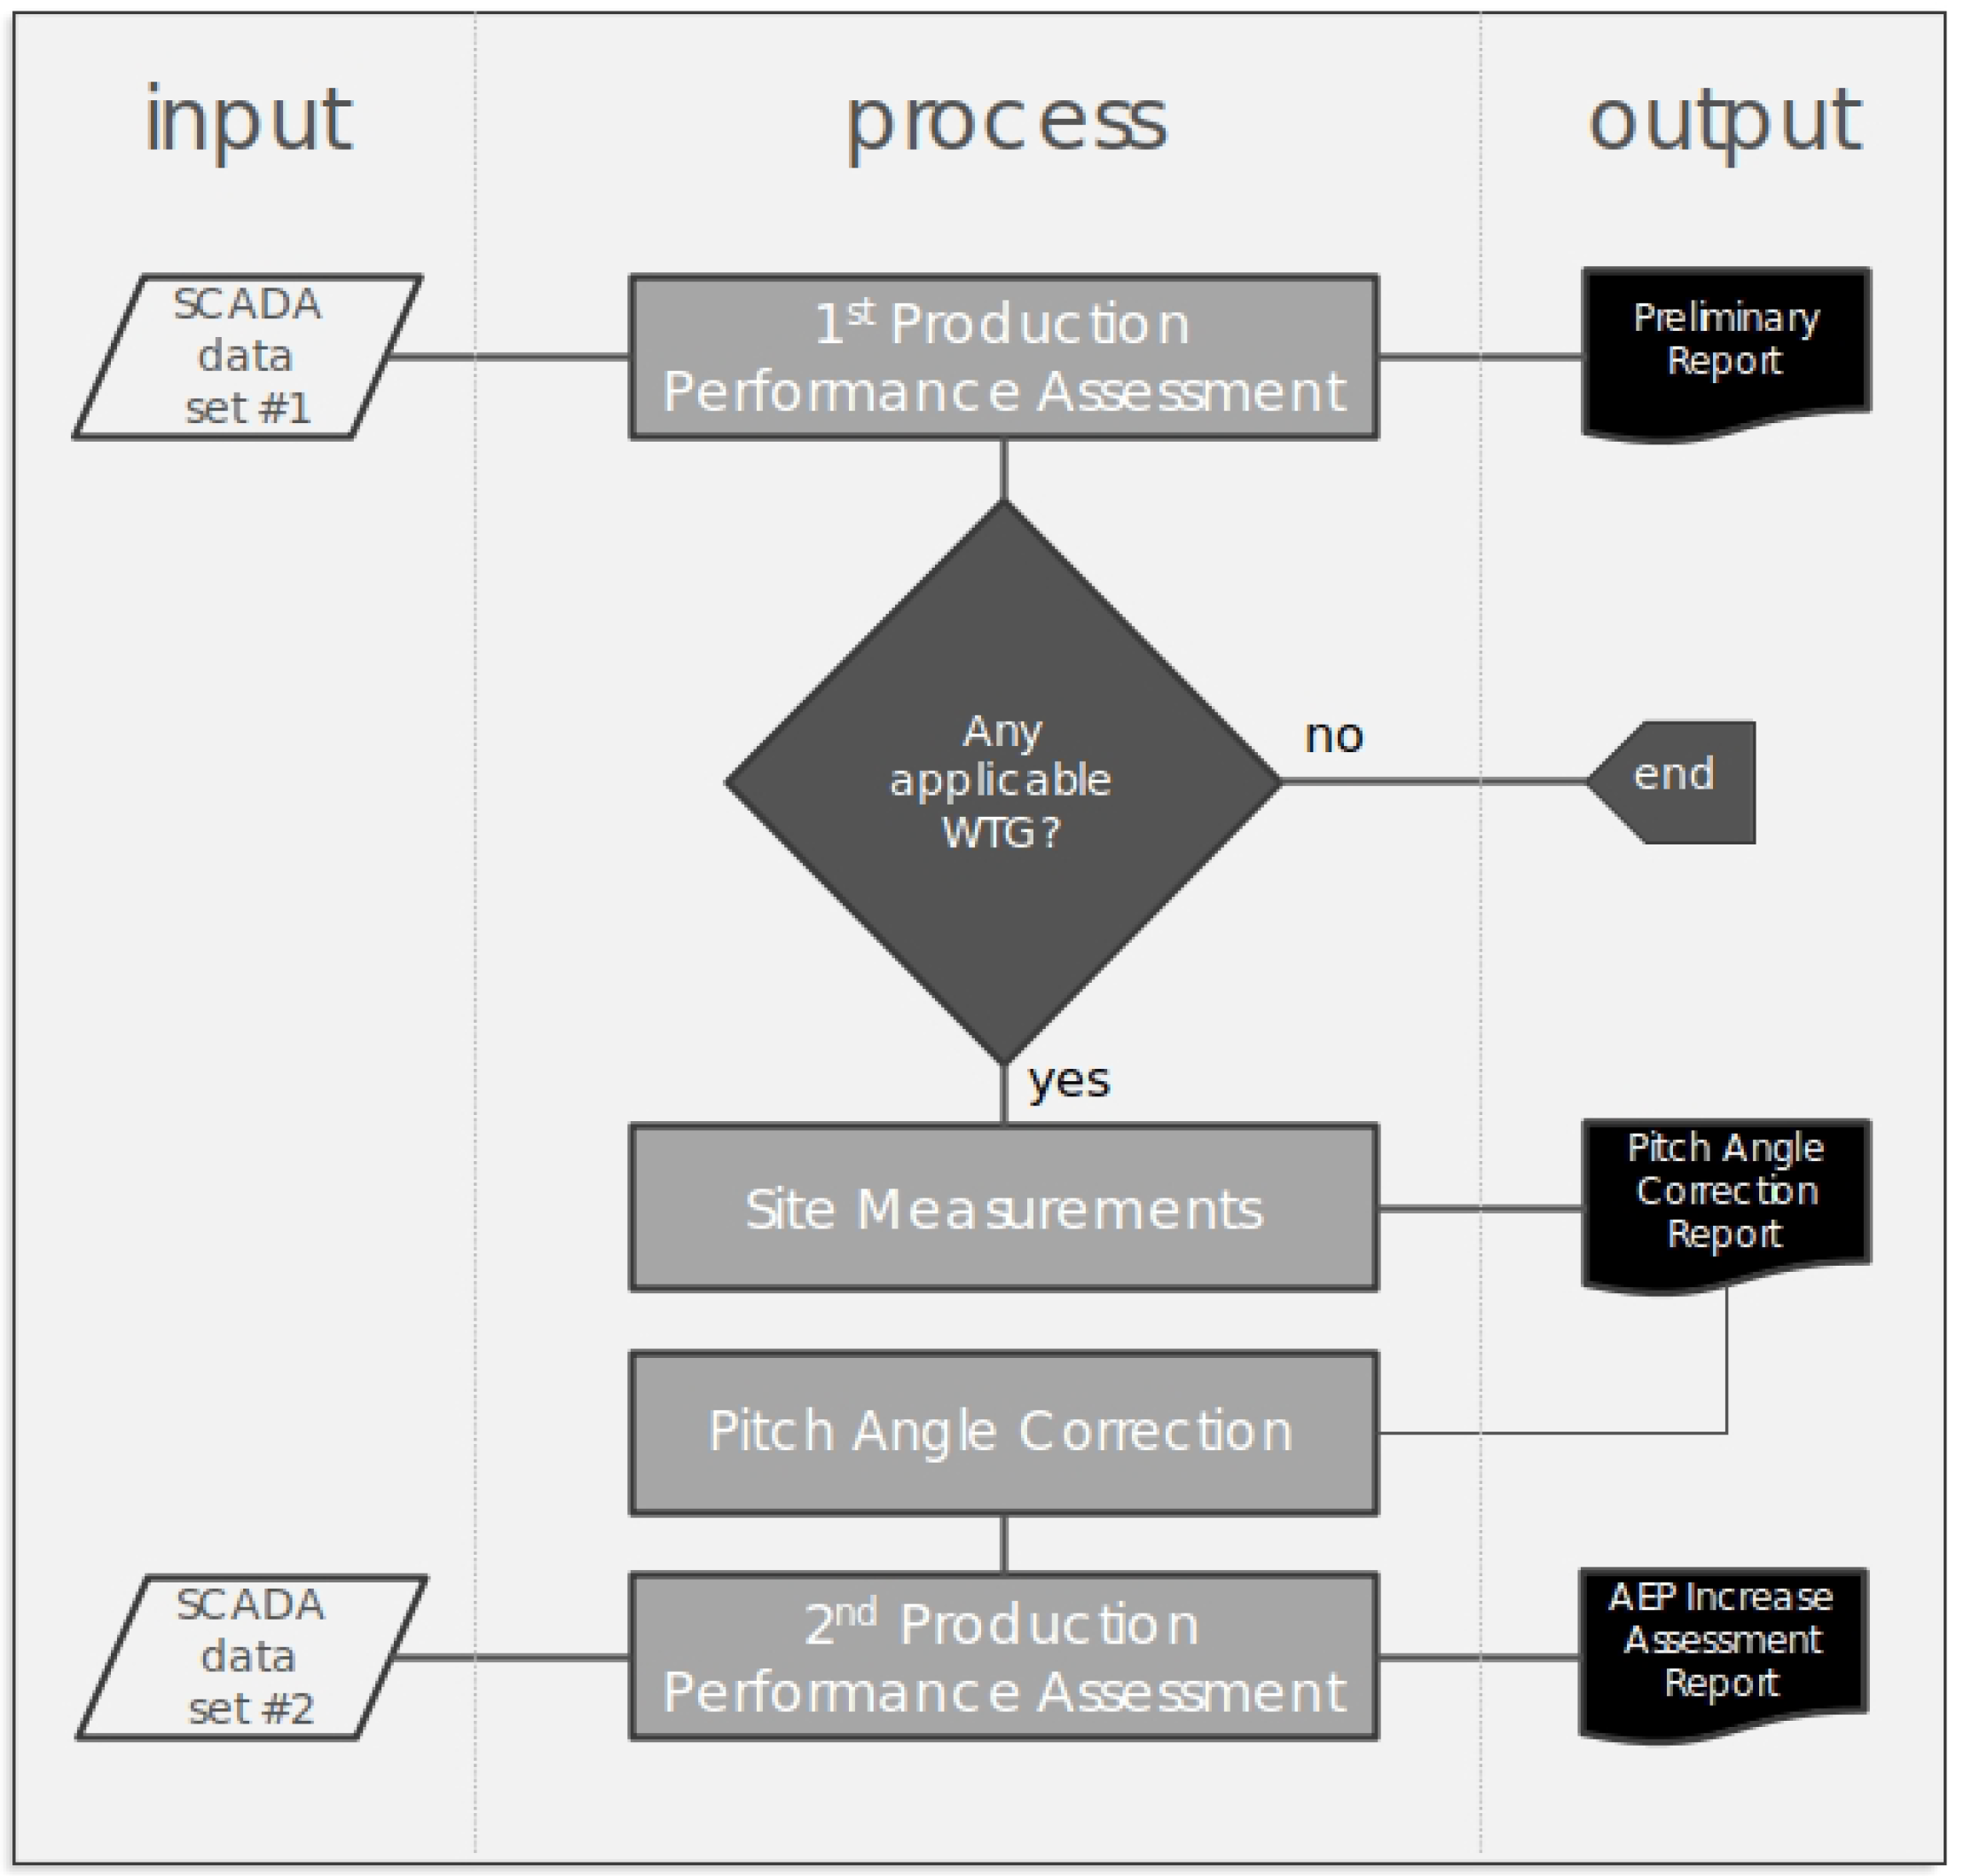
3.2. Production Performance Assessment

As briefly explained earlier, an initial power performance assessment aiming to detect pitch angle misalignment patterns is carried out. For this purpose, the power curve of each turbine on the wind farm is calculated from the 10-minute average data as per industry standards [44], with some remarks:
  • Wind speeds measured above the turbine nacelles are used. Although anemometers are not calibrated or certified, multi-megawatt wind turbines are nowadays equipped with good anemometers that offer reliable measurements. This particularly holds for sonic anemometers, which are only affected by nacelle aerodynamics and the blade passing wake. In any case, this type of disturbance is consistent throughout the entire wind farm, so the comparison between the results obtained from the Best in Class turbine and the Worst in Class turbines will be consistent. Nevertheless, the correlation between wind speed measurements for different wind turbines is also checked.
  • Output power: data in which the power might be compromised by effects not purely related to aerodynamics are ruled out, including:
    (a)
    Turbine and complex terrain disturbances, as described in [47],
    (b)
    Ten-minute periods in which the average power does not show the capability of the turbine to produce energy, e.g., due to starts and stops, maintenance work, power curtailment operation, etc.
After computing the power curves for each turbine, a Best in Class turbine is selected. Such a turbine is the best-performing turbine in terms of pitch angle misalignment. For the rest of the turbines, the Power Curve Ratio ( P C R ) is computed as the ratio of each of their power curves over the power curve of the Best in Class turbine.

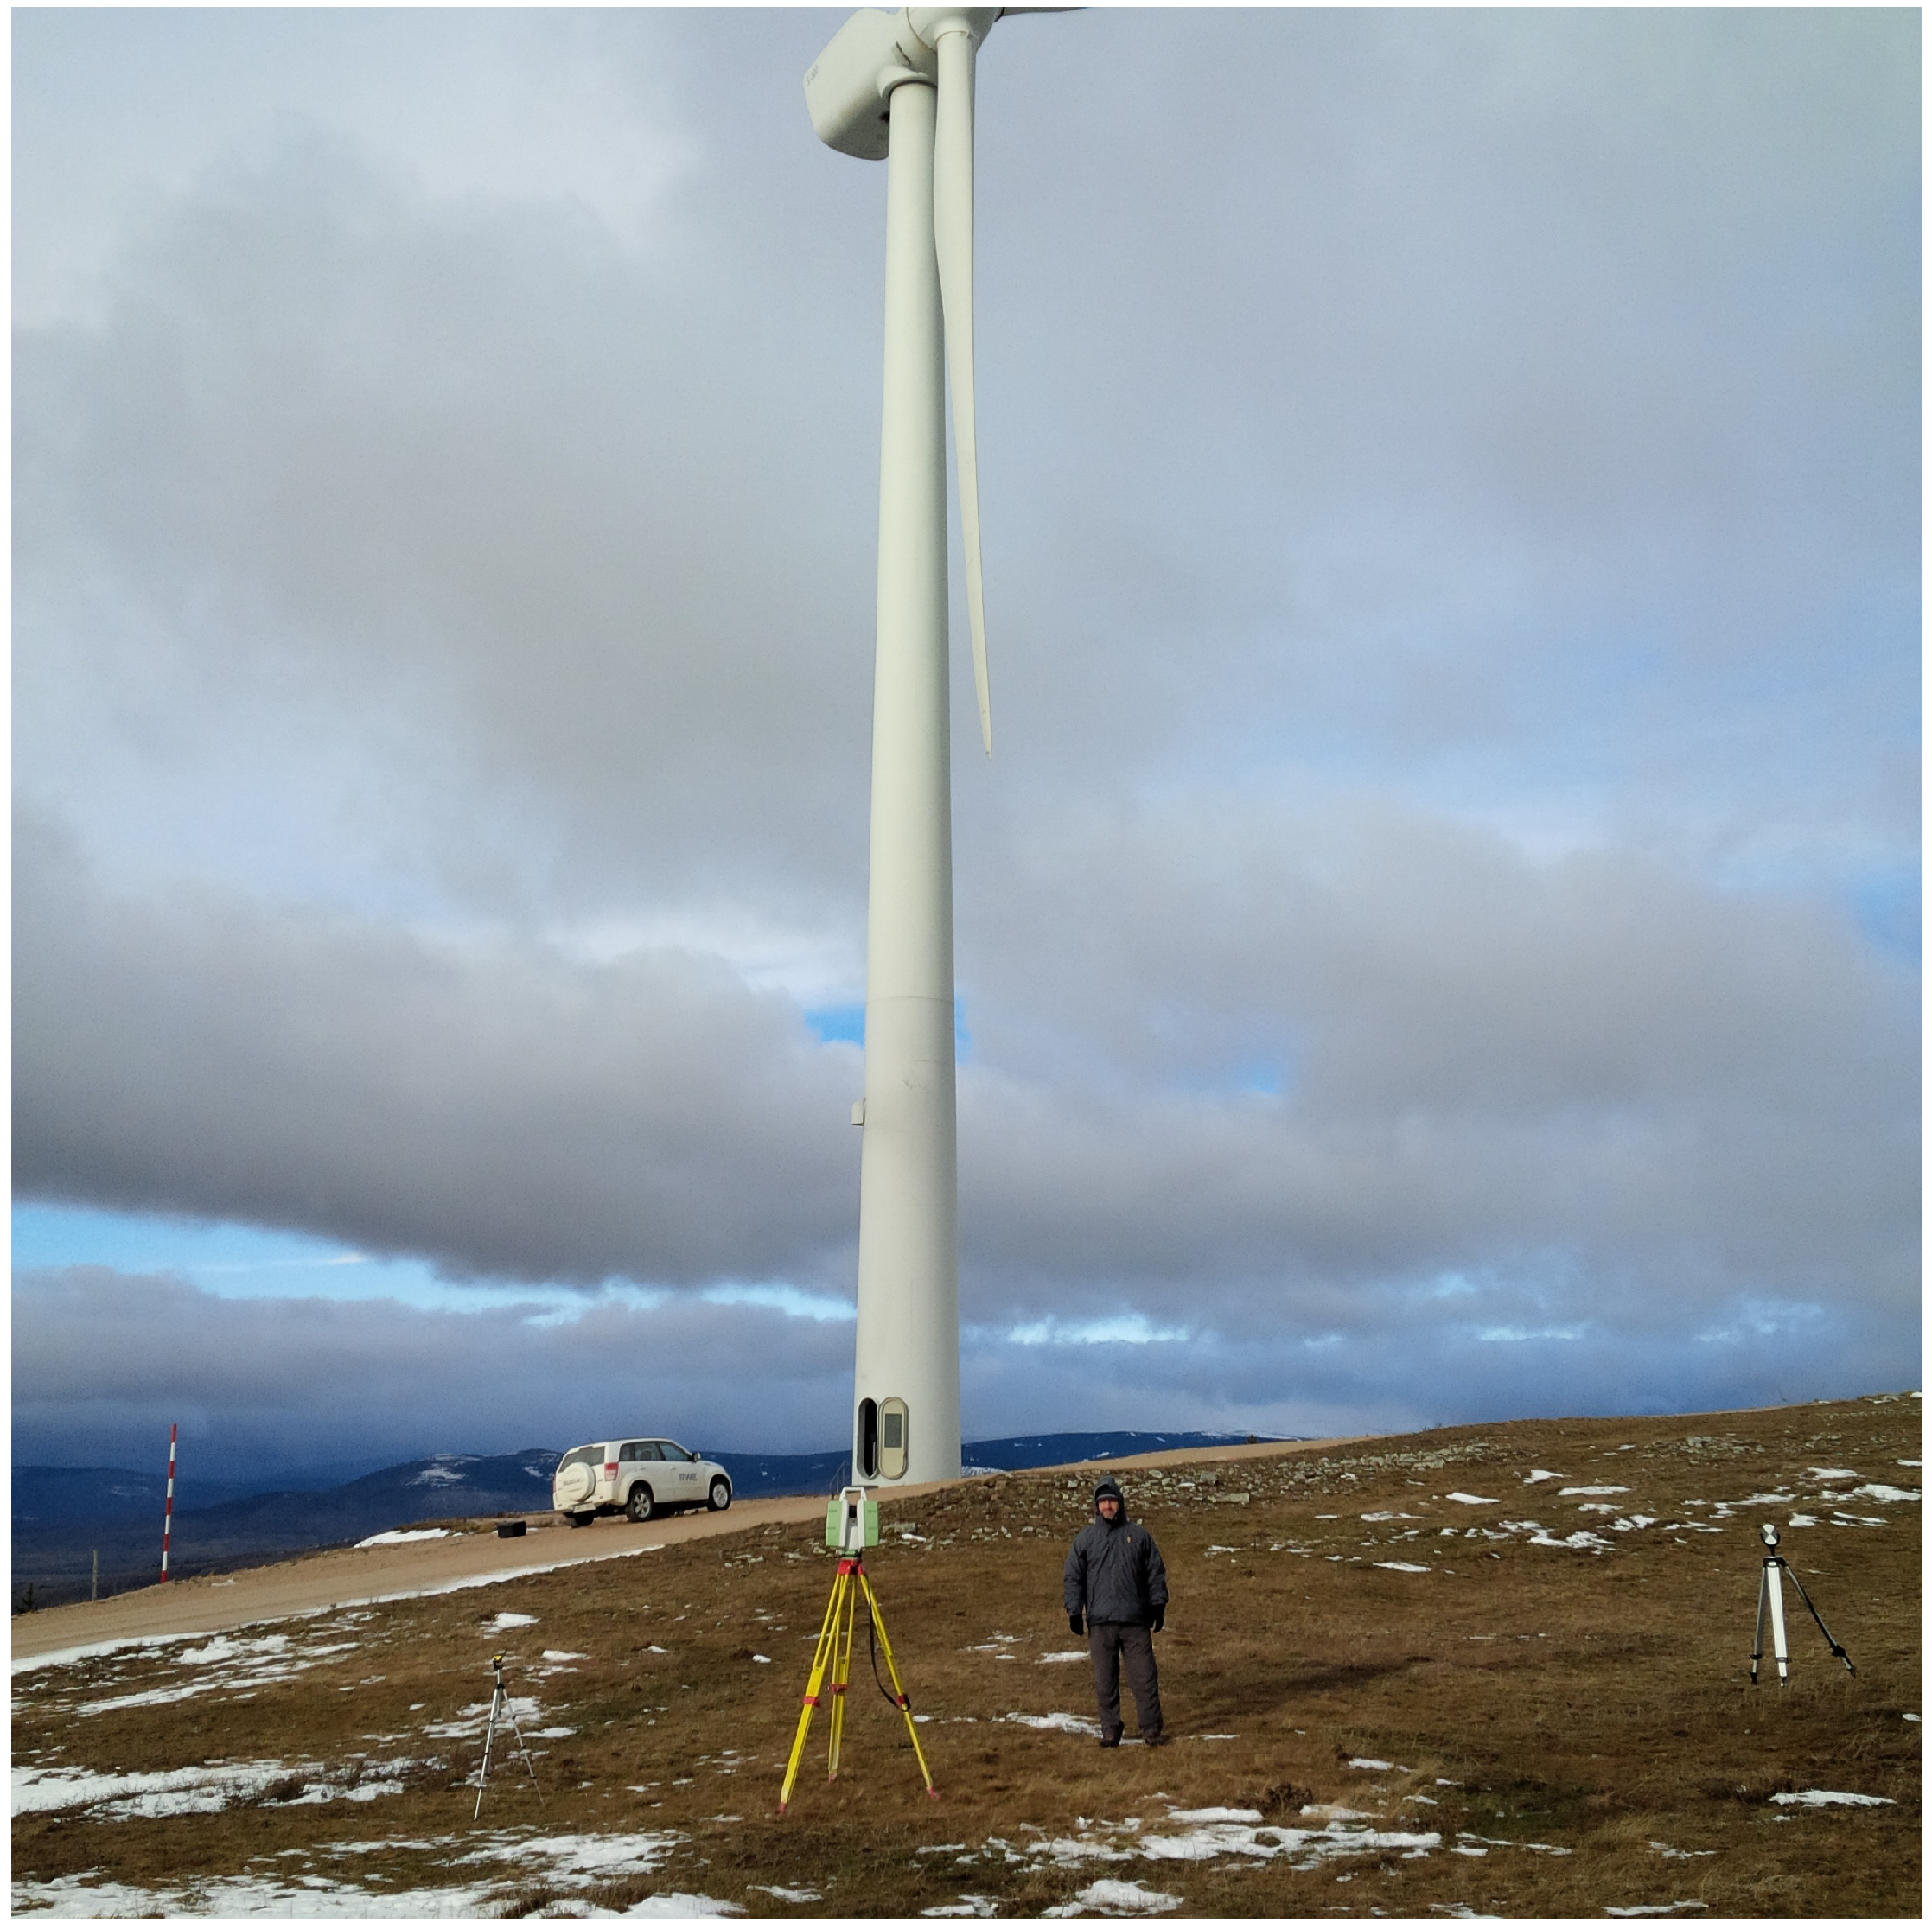
3.3. On-Field Pitch Measurement and Calculation

Every detail of this novel method cannot be presented in this paper due to commercial issues, but, as mentioned, the careful description of the use of laser scanner can be found in the first author’s original PCT/ES2013/070752 international patent [16].
Therefore, a qualitative step-by-step description is presented here to explain the main procedures of the misalignment measurement and correction, after the identification of the Best in Class (BIC) turbine. Furthermore, the academic value of the present contribution is enhanced by the final results, since real energy production improvements on specific wind farms are quantitatively shown. The general method is described below.
Blades are scanned for the Best in Class and Worst in Class turbines. A laser scanner is used in order to capture rotor geometry and measure the pitch angle of each blade. The pitch angle is measured at a particular blade section. Consequently, it is possible not only to measure pitch angle differences within a rotor, but also to make accurate comparisons with other turbines of the blade, a remarkable advantage of this technique.
For example, a characteristic schema of the 3D laser scanning reference system in the patent document is the Figure 9 in the page ([16], p. 25). GXYZ establishes the reference system with the origin (G) and the coordinate axes (XYZ, 1, 2, 3) for the laser measurement. Thirteen is the nacelle, 14 the hub, and 5 is the junction plane between both, which must be captured by the laser. Four is the circular section defined by three points on the junction of the blade and the hub, which are also located by means of the scanner.
This 3D configuration established the reference to measure the position of the airfoil’s chord and consequently the pitch angle. For that, different laser shots are executed from different positions in order to get a complete 3D image of the blade. Figure 10 shows the measurement moment in a wind turbine and several targets used in the procedure. A more detailed description can be found in the ‘Description’ and ‘Claims’ section of the original patent document [16].
Since pitch angle calculation uses a hub-based coordinate system, pitch angles measured in different rotors can be fairly compared. The method concludes by proposing pitch angle corrections for the Worst in Class turbines so that their blades mimic the Best in Class turbine blade settings. It is the authors’ experience that Best in Class turbines always have balanced rotors (relative differences lower than ± 0 . 14 ), so this method corrects both absolute and relative pitch angle misalignments.
It is also worth mentioning that this technique obtains intermediate results in the form of other measurements of rotor quality. Although the three blade axes and the hub rotating axis should be ideally merging to the same point, manufacturing tolerances of the hub, pitch bearings, and blades prevent the actual intersection of the four axes. Intersection points of the three blade axes with the hub axis yield a triangle whose surface can be used to quantify this error. It is also the authors’ experience that all Best in Class turbines detected in power performance assessments always present the best alignment of these four axes, whereas the underperforming turbines often—but not always—show this type of misalignment. Note that, depending on the direction in which the blade axes lean, the effect of misalignment can be described as a decrease in the effective swept area. Should this be the case, little can be done by pitching the blades.

4. Results

This section introduces two case studies: one for a very small wind farm, and another for a wind farm that is significantly larger. The authors show the improvements by means of our correction recommendations below the rated power conditions, for which the power output improvement after implementing these recommendations was remarkable. This improvement was quantified by P C R gap percentage ( P C R g a p ) for the power output of a given turbine T at a wind speed U ( P T ( U ) ), with respect to the power output at that speed of the Best in Class (BIC) turbine on the farm ( P B I C ( U ) ):
P C R g a p = 1 - P T ( U ) P B I C ( U ) × 100 .
Apart from the P C R g a p correction interval at each wind speed of the power curve, the total A E P improvement is also shown in each case study. For that, the A E P gap (percent) is defined analogously.

4.1. Case Study 1

This is a small wind farm located in Catalonia, with two variable-speed 1.5 MW turbines mounting a 77 m diameter rotor. The A E P difference between them was 6.68%. At low wind speeds near the cut-in speed, the P C R g a p defined in Equation (2) was around 5%, and it maintained this value for medium wind speeds (5–7 m/s). There was no improvement at the rated wind speed because, as mentioned above, the effect of pitch misalignment disappears when the rated power of the generator is reached.
Pitch angle correction recommendations for the Worst in Class turbine A2 are shown in Table 1, considering that the Best in Class turbine setting for the chosen blade section was 83.15 .
After the application of the recommendations, important energy production improvements were achieved, reaching a 2.46% increase in A E P with respect to the Best in Class turbine A1. It is worth mentioning that the remaining patter is related to yaw misalignment, not to pitch angle errors. Figure 11 shows the P C R g a p before and after pitch correction.

4.2. Case Study 2

This is a wind farm comprising a larger number of turbines located in Soria, Spain, with 20 variable-speed 800 kW turbines mounting a 56 m diameter rotor. The A E P gap of turbine ES10 was 16.3%, whereas the A E P gap of turbine ES11 was 15%. It should be emphasized that, for low wind speeds near the cut-in speed, ES10 and ES11’s P C R g a p correction was around 25%. At medium wind speeds (around 5–7 m/s), the P C R g a p was 10% for ES10 and around 5% for ES11. Thus, these are significant increases compared to the results obtained for other kinds of aerodynamic improvements that use passive control devices or other techniques [36].
The results and pitch angle correction recommendations are shown in Table 2, and they indicate that the Best in Class turbine setting for the chosen blade section was 100.3 .
After the application of the recommendations, the production gaps for ES10 and ES11 with respect to ES01 were removed, as shown in Figure 12. It is worth mentioning that the reason for turbine ES10 outperforming the Best in Class ES01 is that the latter has some minor yaw misalignment. On the other hand, turbine ES11 falls slightly short of achieving the performance of ES01 due to yaw misalignment.

5. Discussion

In this paper, a new methodology is introduced to detect, measure, and correct pitch angle misalignment in wind turbine rotors. Two case studies are discussed demonstrating the reduction in power production gaps between the Worst in Class turbines and the Best in Class turbines. Since this issue has an impact on a wind project’s A E P and on turbine lifetime, its correction has a significant impact on wind project profitability. To summarize, the features of this technique are:
  • No product design information is needed from the turbine manufacturer, as the Best in Class turbine is used to define the pitch angle settings for the Worst in Class turbines.
  • Mimicking the pitch angle settings of the Best in Class turbine in the Worst in Class turbines ensures that product certification is not compromised.
  • Power performance benchmarking guarantees an increase in power production. This A E P increase can be used to compute the increase in revenue, and thus to calculate Return On Investment of this service.
  • There is no lost revenue for wind farm owners, as laser measurements in the affected turbines are carried out in idling conditions, under very low wind speeds.
  • Although pitch angle corrections cannot address hub manufacturing tolerances, the measurement results of this technique offer valuable information for turbine manufacturers.
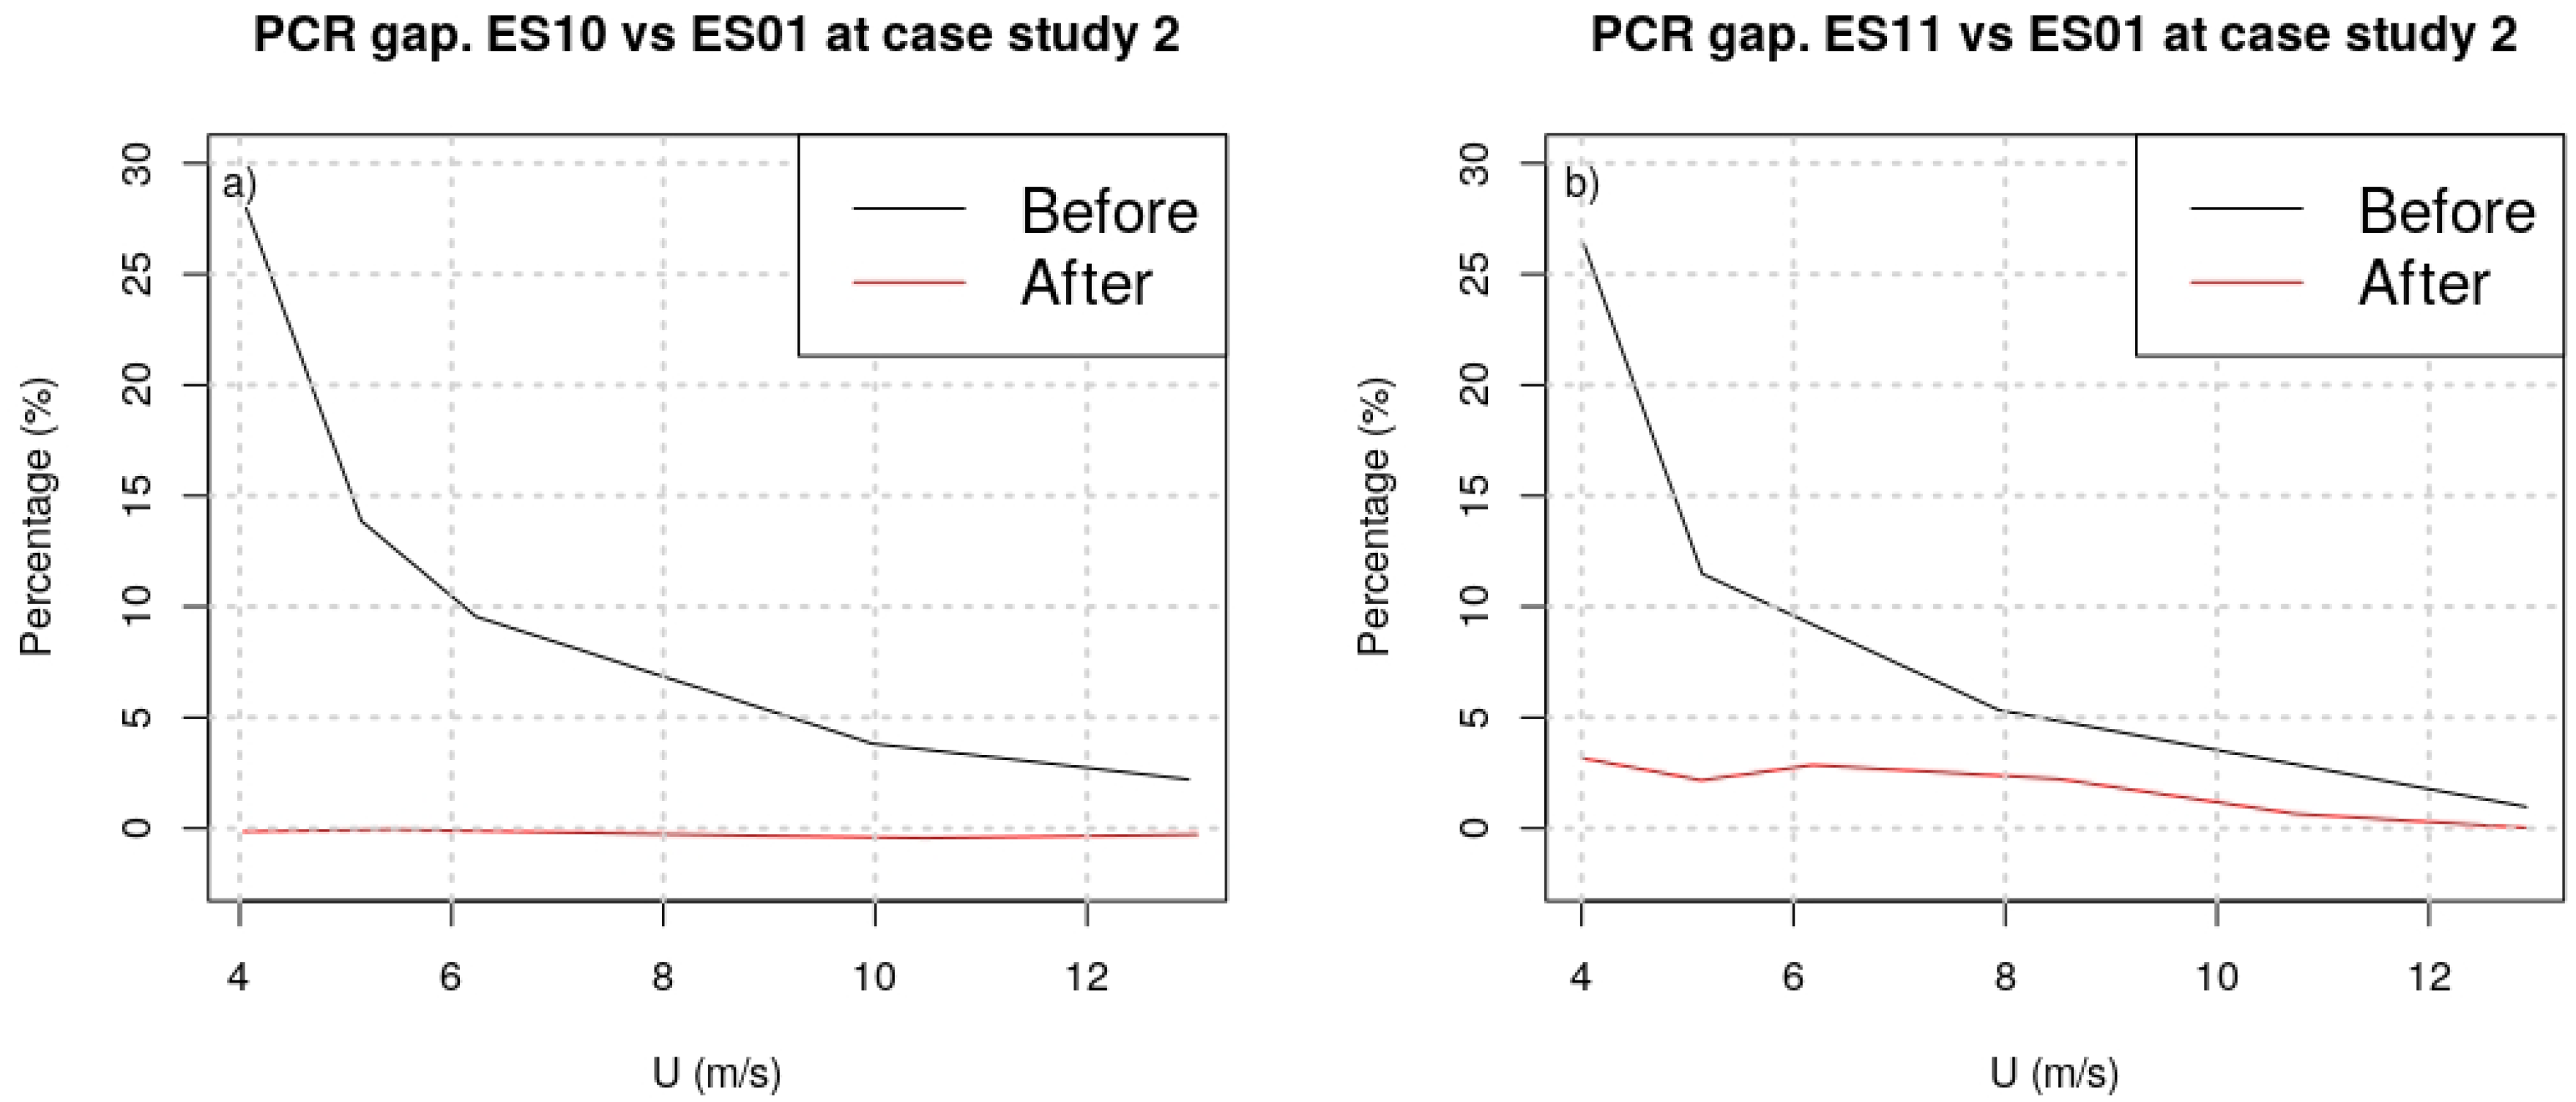
  • At low wind speeds around 5 m/s, a P C R g a p of 25% can be reached in some cases, that is, the power output can be improved by 25% at those wind speeds.
  • These corrections in the power curve can produce general improvement in energy production that reaches even 15% for A E P .
  • For a referential turbine of 1 MW (our turbines are 0.8 and 1.5 MW), this improvement implies 450 MWh more production annually, 3000 being the typical number of full load hours.
  • If the 2018 spot-market price of 1 MWh in Spain is considered (±62 €/MWh according to [48], this increment of energy production supposes ±28,000 € more annually per installed MW of turbines like the studied worst ones.
  • In addition, these empirical percentages of A E P loss are quite coherent with the results obtained in the simulations of the Section 2.2 using FAST for different pitch misalignment combinations of the three blades, which show losses that can reach the 10% in the worst cases.

6. Conclusions and Future Outlook

Although the use of laser scanner and the 3D exploration of the blade on the hub is an important step, the method presented here is generated by other steps, and the most interesting aspect is the comparative procedure that must be established in each wind farm analyzing the SCADA data and identifying the BIC turbine to set a reference for pitch error correction of the other turbines. This benchmarking-based approach is the fundamental perspective. Out of this benchmarking method, the main drawback of other techniques is that they do not obtain absolute pitch angle values which are able to improve the energy production and avoid fatigue. Although aerodynamic imbalance can be removed by establishing same relative pitch angles, the correct implementation of the certified pitch of the manufacturer is not assured. The benchmark approach offers an independent way to establish a new reliable reference in the wind farm.
This new technique was used onshore, but it is also suitable for offshore locations, where the only fixed platform available nearby is located at the tower base. Other techniques require completing laser measurements from distant places orthogonal to the rotor, and the lack of a fixed point in front of the rotor makes other techniques simply not feasible. In general, the method presented here requires less space under the turbine and, therefore, the necessary time and workload can be reduced in complex terrains or in offshore platforms. As mentioned above [8], laser scans from long distances is time-consuming, due to the trade-off between accuracy and distance.
An additional reduction of complexity is also given by the lack of necessity of information from the turbine manufacturer because the BIC turbine of the wind farm is mimicked in the benchmark procedure. Other techniques consider that the blade axes are coplanar, an erroneous supposition due to manufacturing and assembly tolerances, and it adds complexity to these techniques. In our case, the merging of the blade axes and the rotor axis can be studied, and, according to our experience, the best merging has been found in the BIC turbines. This fact simplifies the theoretical background of the method and gives coherence to the benchmarking perspective. In addition, the misalignment is measured in idling conditions gaining also simplicity without energy losses.
Thus, the obtained information is another advantage of this technique. The reference is not the manufacturer’s original configuration, but the real BIC turbine and the rotor plane configuration of the three blades. In this way, the original design and the results of this benchmarking technique can be compared by the manufacturers to improve their future wind turbines and the on-field construction of them, mainly in the final step of the implementation of the blades on the hub.
Future work aims at improving the diagnostic capability of this preliminary performance assessment. For the time being, only turbines affected by pitch angle misalignment are identified, whereas, by understanding turbine dynamics, it is also possible to gain further insight into the conditions of the analyzed turbines before taking the actual laser measurements.
In addition, the identification of defective anemometers in wind turbines is very important for the implementation of this pitch correction technique, since the cause of the low production of the turbine can be the pitch misalignment or a defective measurement by the anemometer, with a consequent deviation in the real power curve. Therefore, pre-evaluation of the SCADA data of the wind farm and a comparative analysis of the anemometers are essential to ensuring that all anemometers are working properly, thus accepting the plausible hypothesis that pitch misalignment explains the bad behavior of a given turbine.
In this way, the objective of future research is to better understand the improper performance of anemometers through the use of statistical methods, including Pearson correlation, R M S E , and standard deviation in Taylor Diagrams to visualize all these parameters in a single plot and to identify the deviating anemometers from the group [49]. The authors are developing a novel method for the identification of defective anemometers based on a Kernel Multidimensional Probability Density Function that improves on classical unidimensional methods, such as the Kolmogorov–Smirnov test [50]. This method will be applied in a bidimensional manner for the zonal and meridional components (U, V) of wind and will identify the Best in Class anemometer of the wind farm, resulting in an initial identification of the defective anemometers.

Author Contributions

Conceptualization, U.E. and I.E.; Methodology, U.E.; Software, U.E. and I.E.; Validation, U.E. and I.E.; Investigation, A.U. and G.I.-B.; Writing—Original Draft Preparation, Unai Elosegui and Igor Egana; Writing—Review and Editing, all authors; Supervision, all authors; Project Administration, U.E., A.U., and G.I.-B.; Funding Acquisition, U.E. and A.U.

Funding

This work is funded by the Council of Gipuzkoa (Gipuzkoako Foru Aldundia, Basque Country, Spain) within the R&D subsidy for the project DIANEMOS on the identification of defective anemometers in wind turbines, and the University of the Basque Country (UPV/EHU, GIU 17/002).

Acknowledgments

The authors would like to show gratitude to Jose Luis Azpeitia from the Centre IK4-Tekniker for his valuable contribution with FAST simulations.

Conflicts of Interest

The authors declare no conflict of interest.

Abbreviations

The following abbreviations are used in this manuscript:
A E P Annual energy production
P C R Power curve ratio of a given turbine with respect to the BIC turbine
BICBest in class turbine
P C R g a p Power curve ratio gap in percent
C p Power coefficient
UWind speed
TAxis torque
Ω Angular velocity of the rotor
Ω l o w Low rotor speed
Ω N Nominal rotor speed
β Pitch angle
T S R Tip speed ratio
FASTAn aeroelastic computer-aided engineering tool for horizontal axis wind turbines
R M S E Root mean square error

References

  1. Schubel, P.; Crossley, R.; Boateng, E.; Hutchinson, J. Review of structural health and cure monitoring techniques for large wind turbine blades. Renew. Energy 2013, 51, 113–123. [Google Scholar] [CrossRef]
  2. Veers, P.S.; Ashwill, T.D.; Sutherland, H.J.; Laird, D.L.; Lobitz, D.W.; Griffin, D.A.; Mandell, J.F.; Musial, W.D.; Jackson, K.; Zuteck, M.; et al. Trends in the design, manufacture and evaluation of wind turbine blades. Wind Energy 2003, 6, 245–259. [Google Scholar] [CrossRef]
  3. McGugan, M.; Pereira, G.; Sørensen, B.F.; Toftegaard, H.; Branner, K. Damage tolerance and structural monitoring for wind turbine blades. Philos. Trans. R. Soc. A 2015, 373, 20140077. [Google Scholar] [CrossRef] [PubMed]
  4. Berlin Wind. Available online: http://www.berlinwind.com/ (accessed on 15 March 2017).
  5. cp.max Rotortechnik. Available online: http://cpmax.com/en/cpmax-rotortechnik.html (accessed on 15 March 2017).
  6. Heilmann, C.; Grunwald, A.; Melsheimer, M. Blade-root based multi-camera system for induced blade twist measurements at wind turbine rotors during operation. In Proceedings of the 13th German Wind Energy Conference, Bremen, Germany, 17–18 October 2017; p. 38. [Google Scholar]
  7. Wohlert, T. Measuring Rotor Blades With Lasers; Technical Report; WindTech International: Groningen, The Netherlands, 2016. [Google Scholar]
  8. Wind-Consult. Available online: https://www.wind-consult.de/cms/ (accessed on 15 October 2018).
  9. FARO. Available online: http://www.faro.com/products/3d-surveying/laser-scanner-faro-focus-3d/overview (accessed on 15 March 2017).
  10. Leica Geosystems. Available online: http://www.leica-geosystems.us/en/HDS-Laser-Scanners-SW_5570.htm (accessed on 15 March 2017).
  11. Hispavista Labs. Available online: https://hispavistalabs.com/ (accessed on 15 March 2017).
  12. MAXWIND. Available online: https://www.maxwindtech.com/ (accessed on 15 March 2017).
  13. Cheng, W.W.L.X.F.; Cichang, C. Wind Rotor Blade Measurement with Laser Tracker. Aerosp. Manuf. Technol. 2009, 6, 008. [Google Scholar]
  14. Yang, S.; Allen, M.S. Output-only modal analysis using continuous-scan laser Doppler vibrometry and application to a 20 kW wind turbine. Mech. Syst. Signal Process. 2012, 31, 228–245. [Google Scholar] [CrossRef]
  15. Ghoshal, A.; Sundaresan, M.J.; Schulz, M.J.; Pai, P.F. Structural health monitoring techniques for wind turbine blades. J. Wind Eng. Ind. Aerodyn. 2000, 85, 309–324. [Google Scholar] [CrossRef]
  16. Elosegui, U.; Elosegui, J. METHOD FOR CALCULATING AND CORRECTING THE ANGLE OF ATTACK IN A WIND TURBINE FARM. PCT/ES/2013/070752. Available online: https://patentscope.wipo.int/search/en/detail.jsf?docId=WO2014068162&redirectedID=true (accessed on 15 November 2018).
  17. Elosegui, U.; Ulazia, A. Novel on-field method for pitch error correction in wind turbines. Energy Procedia 2017, 142, 9–16. [Google Scholar] [CrossRef]
  18. Moroz, E.; Pierce, K. Methods and Apparatus for Reduction of Asymmetric Rotor Loads in Wind Turbines. EP1612413-A2, 30 June 2004. [Google Scholar]
  19. Grosse-Schwiep, M.; Piechel, J.; Luhmann, T. Measurement of rotor blade deformations of wind energy converters with laser scanners. J. Phys. Conf. Ser. 2014, 524, 012067. [Google Scholar] [CrossRef]
  20. IWES. Rotor Blade Testing. Available online: http://www.iwes.fraunhofer.de/en/labore/Rotor_Blade.html (accessed on 15 November 2018).
  21. Márquez, F.P.G.; Tobias, A.M.; Pérez, J.M.P.; Papaelias, M. Condition monitoring of wind turbines: Techniques and methods. Renew. Energy 2012, 46, 169–178. [Google Scholar] [CrossRef]
  22. Papadopoulos, K.; Morfiadakis, E.; Philippidis, T.; Lekou, D. Assessment of the strain gauge technique for measurement of wind turbine blade loads. Wind Energy 2000, 3, 35–65. [Google Scholar] [CrossRef]
  23. Paulsen, U.S.; Erne, O.; Möller, T.; Sanow, G.; Schmidt, T. Wind turbine operational and emergency stop measurements using point tracking videogrammetry. In Proceedings of the SEM Annual Conference and Exposition on Experimental and Applied Mechanics, Albuquerque, NM, USA, 1–4 June 2009. [Google Scholar]
  24. Yang, Y.; Guo, Z.; Song, Q.; Zhang, Y.; Li, Q. Effect of Blade Pitch Angle on the Aerodynamic Characteristics of a Straight-bladed Vertical Axis Wind Turbine Based on Experiments and Simulations. Energies 2018, 11, 1514. [Google Scholar] [CrossRef]
  25. Petković, D.; Ćojbašič, Ž.; Nikolić, V. Adaptive neuro-fuzzy approach for wind turbine power coefficient estimation. Renew. Sustain. Energy Rev. 2013, 28, 191–195. [Google Scholar] [CrossRef]
  26. Petković, D.; Ćojbašić, Ž.; Nikolić, V.; Shamshirband, S.; Kiah, M.L.M.; Anuar, N.B.; Wahab, A.W.A. Adaptive neuro-fuzzy maximal power extraction of wind turbine with continuously variable transmission. Energy 2014, 64, 868–874. [Google Scholar] [CrossRef]
  27. Petković, D.; Pavlović, N.T.; Ćojbašić, Ž. Wind farm efficiency by adaptive neuro-fuzzy strategy. Int. J. Electr. Power Energy Syst. 2016, 81, 215–221. [Google Scholar] [CrossRef]
  28. Nikolić, V.; Mitić, V.V.; Kocić, L.; Petković, D. Wind speed parameters sensitivity analysis based on fractals and neuro-fuzzy selection technique. Knowl. Inf. Syst. 2017, 52, 255–265. [Google Scholar] [CrossRef]
  29. Kusiak, A.; Verma, A. A data-driven approach for monitoring blade pitch faults in wind turbines. IEEE Trans. Sustain. Energy 2011, 2, 87–96. [Google Scholar] [CrossRef]
  30. Yin, S.; Wang, G.; Karimi, H.R. Data-driven design of robust fault detection system for wind turbines. Mechatronics 2014, 24, 298–306. [Google Scholar] [CrossRef]
  31. Yang, X.; Li, J.; Liu, W.; Guo, P. Petri net model and reliability evaluation for wind turbine hydraulic variable pitch systems. Energies 2011, 4, 978–997. [Google Scholar] [CrossRef]
  32. Naik, K.A.; Gupta, C.P. Output Power Smoothing and Voltage Regulation of a Fixed Speed Wind Generator in the Partial Load Region Using STATCOM and a Pitch Angle Controller. Energies 2017, 11, 58. [Google Scholar] [CrossRef]
  33. Olondriz, J.; Elorza, I.; Jugo, J.; Alonso-Quesada, S.; Pujana-Arrese, A. An Advanced Control Technique for Floating Offshore Wind Turbines Based on More Compact Barge Platforms. Energies 2018, 11, 1187. [Google Scholar] [CrossRef]
  34. Kusiak, A.; Zheng, H. Optimization of wind turbine energy and power factor with an evolutionary computation algorithm. Energy 2010, 35, 1324–1332. [Google Scholar] [CrossRef]
  35. Rehman, S.; Alam, M.M.; Alhems, L.M.; Rafique, M.M. Horizontal Axis Wind Turbine Blade Design Methodologies for Efficiency Enhancement—A Review. Energies 2018, 11, 506. [Google Scholar] [CrossRef]
  36. Fernandez-Gamiz, U.; Zulueta, E.; Boyano, A.; Ansoategui, I.; Uriarte, I. Five megawatt wind turbine power output improvements by passive flow control devices. Energies 2017, 10, 742. [Google Scholar] [CrossRef]
  37. Astolfi, D.; Castellani, F.; Terzi, L. Wind Turbine Power Curve Upgrades. Energies 2018, 11, 1300. [Google Scholar] [CrossRef]
  38. Poore, R.; Lettenmaier, T. Alternative Design Study Report: WindPACT Advanced Wind Turbine Drive Train Designs Study; November 1, 2000–February 28, 2002; Technical Report; National Renewable Energy Lab. (NREL): Golden, CO, USA, 2003.
  39. Burton, T.; Jenkins, N.; Sharpe, D.; Bossanyi, E. Wind Energy Handbook; John Wiley & Sons: Hoboken, NJ, USA, 2011. [Google Scholar]
  40. Imran, R.M.; Hussain, D.; Chowdhry, B.S. Parameterized Disturbance Observer Based Controller to Reduce Cyclic Loads of Wind Turbine. Energies 2018, 11, 1296. [Google Scholar] [CrossRef]
  41. Manwell, J.F.; McGowan, J.G.; Rogers, A.L. Wind Energy Explained: Theory, Design and Application; John Wiley & Sons: Hoboken, NJ, USA, 2010. [Google Scholar]
  42. Myrent, N.J.; Bilal, N.; Adams, D.; Griffith, D.T. Aerodynamic sensitivity analysis of rotor imbalance and shear web disbond detection strategies for offshore structural health prognostics management of wind turbine blades. In Proceedings of the 32nd ASME Wind Energy Symposium, National Harbor, MD, USA, 13–17 January 2014; p. 0714. [Google Scholar]
  43. Schubel, P.J.; Crossley, R.J. Wind turbine blade design. Energies 2012, 5, 3425–3449. [Google Scholar] [CrossRef]
  44. Wind Energy Generation Systems. Structural Design; Technical Report, IEC 61400-1-7; International Electrotechnical Commission: Geneva, Switzerland, 2017.
  45. El-Sheimy, N. An overview of mobile mapping systems. In Proceedings of the FIG Working Week 2005, Cairo, Egypt, 16–21 April 2005; pp. 16–21. [Google Scholar]
  46. Boeder, V. HCU-HMSS: A Multi Sensor System in Hydrographic Applications. In Proceedings of the 2nd International Conference on Machine Control & Guidance, Bonn, Germany, 9–11 March 2010; pp. 65–74. [Google Scholar]
  47. Wind Energy Generation Systems. Power Performance Measurements of Electricity Producing Wind Turbines; Technical report, IEC 61400-12-1; International Electrotechnical Commission: Geneva, Switzerland, 2017.
  48. Red Eléctrica de España. Available online: https://www.esios.ree.es/es?locale=es (accessed on 1 October 2018).
  49. Taylor, K.E. Summarizing multiple aspects of model performance in a single diagram. J. Geophys. Res. Atmos. 2001, 106, 7183–7192. [Google Scholar] [CrossRef] [Green Version]
  50. Lopez-Novoa, U.; Sáenz, J.; Mendiburu, A.; Miguel-Alonso, J. An efficient implementation of kernel density estimation for multi-core and many-core architectures. Int. J. High Perform. Comput. Appl. 2015, 29, 331–347. [Google Scholar] [CrossRef]
Figure 1. Angle of attack α and pitch angle β for a given blade section.
Energies 11 03357 g001
Figure 2. Photometry-based pitch angle measurement of a rotor blade set.
Energies 11 03357 g002
Figure 3. Power coefficient surface over the pitch angle β and Tip-Speed Ratio ( T S R ); torque demand T with rotor speed Ω ; and power curve.
Energies 11 03357 g003
Figure 4. Steady-state Power Curve Ratio ( P C R ) and annual energy production ( A E P ) losses.
Energies 11 03357 g004
Figure 5. Dynamic FAST simulation: (a) Case 1; (b) Case 2; (c) Case 3.
Energies 11 03357 g005
Figure 6. Effect of pitch angle offset toward higher angles in the turbine operation.
Energies 11 03357 g006
Figure 7. Effect of pitch angle offset toward lower angles in turbine operation.
Energies 11 03357 g007
Figure 8. Pitch angle detection and correction workflow.
Energies 11 03357 g008
Figure 9. Schema of the reference system for the measuring procedure.
Energies 11 03357 g009
Figure 10. Photo of the measurement moment in a wind farm.
Energies 11 03357 g010
Figure 11. P C R g a p reduction after calibration for turbine A2.
Energies 11 03357 g011
Figure 12. P C R g a p reduction after calibration for turbines ES10 (a) and ES11 (b).
Energies 11 03357 g012
Table 1. Blade angle measurements and consequent recommendations.
BladesMeasurementRecommendation
Blade 183.06 +0.1
Blade 281.64 +1.5
Blade 384.34 −1.2
Table 2. Blade angle measurements and consequent recommendations.
Turbine-BladesMeasurementRecommendation
ES10-Blade 199.68 +0.61
ES10-Blade 2100.30 Leave as is
ES10-Blade 394.4 5.89
ES11-Blade 198.12 +2.17
ES11-Blade 298.08 +2.21
ES11-Blade 397.10 +3.16

