Abstract
Operational activities of gas pipelines are associated with potential hazards and risks that can potentially lead to pipeline failure, including failure of the gas distribution pipeline in existing buildings. Unfortunately, few studies on risk analysis of the gas distribution pipeline in existing buildings have been published. Therefore, this study was conducted to provide a reference for analyzing the risk of pipeline leakage caused by small-scale leakage, large-scale gas release, and gas pipeline rupture in existing buildings in Indonesia not designed for gas installation. The study was performed using the event tree analysis method. The methodology of this study was initiated by identifying the scenario of the case of small-scale leakage, large-scale gas release, or gas pipeline rupture. Then, pivotal events were identified, an event tree diagram was constructed, the event failure of each pivotal event was determined, and the probability value of the outcome risk was calculated. The risk was evaluated in terms of fire, casualties, and gas released. The results of this study showed the highest risk in each scenario which can result in fire, severe casualties, and light poisoning. The highest risk in the small-scale leak scenario had a probability value of 1.5 × 10⁻³. In the large-scale gas release scenario, the highest risk had a probability value to incur a fireball, severe casualties, and light gas poisoning of 6.0 × 10⁻⁴. In the gas pipeline rupture scenario, the highest risk had a probability value of fireball, severe casualties, and light poisoning of 7.0 × 10⁻⁴. The probability value of each risk was reduced by the installation of a gas detector and water sprinkler as a barrier.
1. Introduction
The increasing population in big cities is causing the rate of construction of buildings to increase, and the demand for gas energy is also increasing. To meet the increasing demand, pipeline networks are constructed to deliver gas to the buildings [1]. However, the gas distribution pipeline in a building has high potential hazards and risks [2]. The potential hazards include leaks, fire, and gas poisoning [3,4]. Accidental leaks from a pipeline transporting natural gas may lead to fires and/or explosions adversely impacting the human habitat, property, and the environment [5]. If natural gas is accidentally released and ignited, the hazard distance associated with such pipelines to people and property has been found to range from less than 20 m for a smaller pipeline at lower pressure to more than 300 m for a larger pipeline at higher pressure [6]. In many cases, major environmental damage, severe destruction of property, and several casualties occur [7]. Thus, pipeline rupture or leakage exposes the public and the environment to safety and health hazards [8]. There have been many studies that have examined gas distribution pipeline leaks in open areas. Gas pipelines in open areas have been investigated using methods such as fault tree analysis, even tree analysis, and bow tie analysis. Park et al. (2004) reported an approach to the risk management of city gas pipelines. This research developed a computer program which can assess and manage risk for city gas pipelines in open areas in Korea [9]. Another study is that by Xian et al. (2017), who researched a practical risk assessment method based on the bow-tie model and Bayesian network for the risk analysis of natural gas pipeline leakage [10]. Hao et al. (2017) reported risk analysis of an urban gas pipeline network based on the improved bow-tie model [11]. Yuhua and Datao (2005) reported estimation of the failure probability of oil and gas transmission pipelines by way of fuzzy fault tree analysis [12]. Cheliyan and Bhattacharyya (2018) reported fuzzy event tree analysis for quantified risk assessment of oil and gas leakage in offshore installations [13]. However, we did not find any study on gas pipelines in buildings that were not designed for the installation of the gas pipeline. In this study, gas leakage analysis of the gas distribution pipeline in existing buildings was performed using the event tree analysis (ETA) method to provide a reference for analyzing the risk of pipeline leakage caused by small-scale leakage, large-scale gas release, and gas pipeline rupture in existing buildings in Indonesia that were not designed for gas installation. Mitigation and control of gas leakages in existing buildings were performed using a barrier that could reduce risk and severity. ETA is an analytical technique for identifying and evaluating the sequence of events in a potential accident scenario [14]. The ETA method was selected in this study because the focus of the study was to analyze the risks to building occupants in the case of failure of the distribution pipeline and because the ETA method can analyze the risks arising from an initiating event that could have major consequences on building occupants. The risk factors of gas distribution pipelines in existing buildings are expressed in terms of consequence and probability. The magnitude of the consequences of a natural gas pipeline failure can be envisioned as a combination of three aspects: (1) human impact in terms of number of people injured or killed; (2) property damage caused by the incident; and (3) volume of natural gas released [15]. The consequences of incidents were analyzed for small-scale leakage, large-scale discharge, and gas pipeline rupture scenarios [10]. Consequences were evaluated in terms of death, fire, damage to buildings, and gas release [9]. Based on the potential hazards and risks in natural gas distribution activities in existing buildings not designed for gas installation in Indonesia, which may pose a risk of death, and to research the risk of distribution of natural gas within a building, it is necessary to analyze the risk of the gas distribution pipeline.
2. Methods
The procedures of this research are shown in Figure 1. First of all, problem identification was conducted, followed by literature study and data collection [16]. Subsequently, the risks caused by gas leakage in existing buildings were identified. Gas leakage analysis of the gas distribution pipelines in existing buildings was carried out using the ETA method. The result of the risk analysis, which was conducted to evaluate the risk of gas pipeline leakage, reflected the likely consequences of a gas leakage event [17]. The gas leakage analysis was performed for a gas distribution pipeline network in an existing building for the cases of small-scale leak, large-scale gas release, and pipeline rupture. The gas leakage analysis was done by determining the initiating event and then identifying pivotal or important intermediate events that occurred between the top event and the final state. Then, the event tree diagram was constructed by beginning with the top event, followed by the pivotal event and outcome risk that occurred from each path. The probability value of the failure event was determined for each top event and pivotal event. Then, the risk value was calculated for each outcome risk [14]. The top events of this study were small-scale leak, large-scale release, and pipeline rupture. The pivotal events for each scenario were ignition, delayed ignition, fire escalation, and evacuation. The risks that occurred from gas leakage were evaluated by risk level. Risk evaluation was conducted by comparing the calculated risk level in the risk analysis step with the standard criteria used. Subsequently, the result of the risk evaluation was used to determine the risk control program.
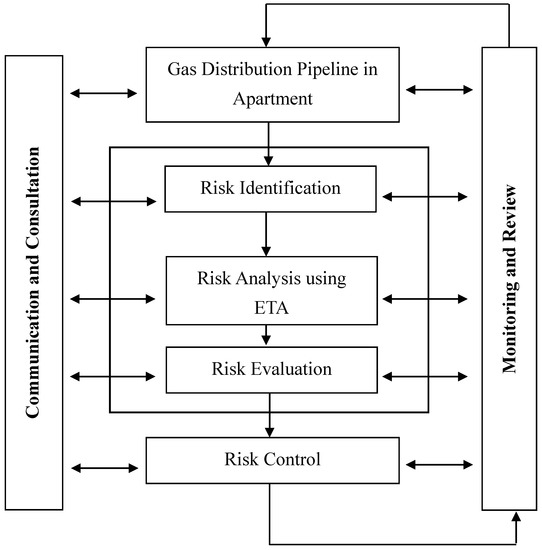
Figure 1.
Research procedures.
Event Tree Analysis
Event Tree Analysis is a commonly applied technique used for identifying the consequences that can result following the occurrence of a potentially hazardous event [14]. This technique is used to define potential accident sequences associated with a particular initiating event or set of initiating events. The event tree model describes the logical connection between the potential successes and failures of a defined safety system or safety functions as they respond to the initiating event and the sequence of events [18].
The sequences in the analyzed system show the success and failure of the safety system and actions available. The sequences include initiating events and failures or successes of the safety functions. The event tree is a diagram that shows the initiating event and the failures or successes of the safety functions. The event tree is a standard tool in probabilistic risk assessment and it links the responses of the safety system following the initiating event [18].
The probability value of outcome risk is calculated by Equation (1) as follows:
where PIE is the initial event probability and PPE1, PPE2, PPE3, and PPEn are the probabilities of pivotal events 1, 2, 3 and n, respectively.
Equation (1) is the multiplication of all probability values of pivotal events on a particular path in the event tree diagram that produces the probability value of an outcome in that path. The probability value generated is a probability of an accident occurring (outcome).
3. Results and Discussion
The gas leakage analysis for an existing building was analyzed using the ETA method. The analysis focused on small-scale leak, large-scale release, and gas pipeline rupture scenarios. The analysis of each scenario is described below.
3.1. Gas Leakage Analysis of Small-Scale Leak Scenario
The top event in this scenario is the small-scale leak, and the pivotal events are ignition, delayed ignition, fire escalation, and evacuation. The probability value for a small-scale leak for a 4 inch pipeline is 0.85, and those for ignition and delayed ignition in an urban area are 0.97 and 0.89, respectively [9]. The probability values of a failure event leading to fire escalation and an evacuation of a multi dwelling building are 0.43 and 0.10, respectively [19]. Every pivotal event has a success and failure event, and every success and failure event can lead to different outcome risks. The outcome risk is a consequence of every path in an event tree diagram. The event tree diagram for the small-scale leak scenario is shown in Figure 2. Each outcome risk has a probability value for incurring an accident. The probability value of each outcome risk (Outcomes 1.1–1.9 in Figure 2) was calculated using Equation (1).
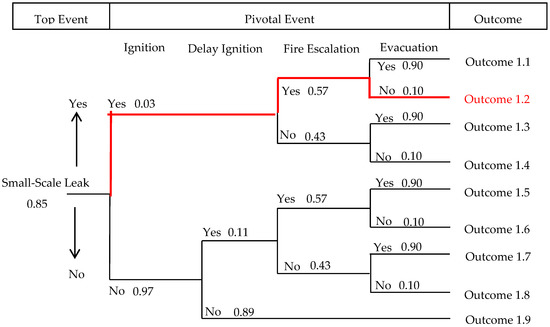
Figure 2.
Event tree diagram for the small-scale leak scenario.
The highest risk in the small-scale leak scenario is Outcome 1.2, which could incur a fireball, severe casualties, and light gas poisoning. The probability value of Outcome 1.2 is 1.5 × 10⁻³. The outcome risk probability values of the small-scale leak scenario are shown in Table 1. From Table 1, showing the probability value for each outcome risk in the small-scale leak scenario, all outcome risks are categorized as intolerable risks because the probability value of each is more than 10−4 [19].

Table 1.
Outcome risk probabilities of the small-scale leak scenario.
3.2. Gas Leakage Analysis of Large-Scale Gas Release Scenario
Large-scale gas release is the initial event in this scenario. The pivotal events in this scenario are ignition, delayed ignition, fire escalation, and evacuation. The probability value of large-scale gas release for a 4 inch pipeline is 0.10, and the probability values of a failure event for ignition and delayed ignition in an urban area are 0.90 and 0.80, respectively [9]. Probability values of failure events of fire escalation and evacuation in a multi dwelling building are 0.43 and 0.10, respectively [19]. The event tree diagram for the large-scale gas release scenario is shown in Figure 3.
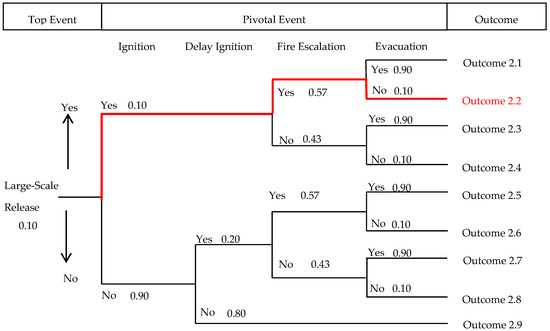
Figure 3.
Event tree diagram for the large-scale gas release scenario.
The probability value of each outcome risk (Outcomes 2.1–2.9 in Figure 3) was calculated using Equation (1). The highest risk in the large-scale gas release scenario is Outcome 2.2, which could incur a fireball, severe casualties, and light gas poisoning. The probability value of Outcome 2.2 is 6.0 × 10⁻⁴. The outcome risk probability values of the large-scale gas release scenario are shown in Table 2. From Table 2, showing the probability value for each outcome risk in the large-scale gas release scenario, all outcome risks are categorized as intolerable risks because each probability value is greater than 10−4 [19].
Table 2.
Outcome risk probabilities of the large-scale gas release scenario.
3.3. Gas Leakage Analysis of Gas Pipeline Rupture Scenario
The initial event in this scenario is gas pipeline rupture. The pivotal events in this scenario are ignition, delayed ignition, fire escalation, and evacuation. The probability value of gas pipeline rupture for 4 inch pipelines is 0.05, and the probability values of failure events of ignition and delayed ignition in an urban area are 0.75 and 0.64, respectively [9]. The probability values of failure events for fire escalation and evacuation in a multi dwelling building are 0.43 and 0.10, respectively [19]. The event tree diagram for gas pipeline rupture is shown in Figure 4. The probability value of each outcome risk (Outcomes 3.1–3.9 in Figure 4) was calculated from Equation (1). The highest risk in the gas pipeline rupture scenario is Outcome 3.2, which could incur a fireball, severe casualties, and light poisoning. The probability value of Outcome 3.2 is 7.0 × 10⁻⁴. The outcome risk probability values of the gas pipeline rupture scenario are shown in Table 3. From Table 3, showing the probability value for each outcome risk in the gas pipeline rupture scenario, all outcome risks are categorized as intolerable risks because the probability value of each is more than 10−4 [20].
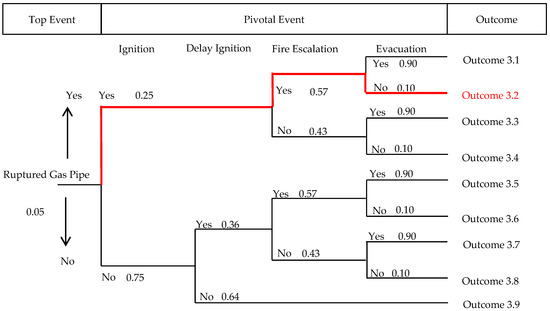
Figure 4.
Event tree diagram for the gas pipeline rupture scenario.
Table 3.
Outcome risk probabilities of the gas pipeline rupture scenario.
3.4. Gas Leakage Risk Evaluation
Risk evaluation was used to compare each risk probability value of each scenario with predetermined risk criteria. The evaluation shows whether the risk level is in the category of negligible, tolerable, or intolerable. The negligible risk category has a probability value of less than 10−6, the tolerable risk category has a probability value between 10−6 and 10−4, and the intolerable risk category has a probability value of more than 10−4 [20]. The outcome risks of small-scale leak, large-scale gas release, and gas pipeline rupture have probability values greater than 10−4. These probability values are within the intolerable risk category, so risk control is needed to reduce the risks in the small-scale leak, large-scale gas release, and gas pipeline rupture scenarios to either the tolerable or negligible risk category. The risk level of the highest risk for each scenario is shown in Table 4.
Table 4.
Highest risk level of each scenario.
3.5. Gas Leakage Risk Control
Risk control should be undertaken to reduce the risks already analyzed in the small-scale leak, large-scale gas release, and gas pipeline rupture scenarios to either the tolerable or negligible risk category. Risk controls to reduce the risk level in the small-scale leakage, large-scale gas release, or gas pipeline rupture scenarios should be pre-formed to detect gas leakage immediately by installing a gas detector around the pipe. Thus, if a gas leak is detected, the valve of the gas pipe can be closed immediately to stop the flow of gas. For ignition, it is necessary to install a water sprinkler so that fire can be extinguished immediately if ignition is detected. The probability value of a failure event for the gas detector is 0.05 and that for a water sprinkler is 0.20 [21].
3.6. Risk Control in Small-Scale Leak Scenario
To reduce risk in the small-scale leak scenario, risk control is performed by installing a gas detector and a water sprinkler around the pipeline area. The installation of the gas detector and water sprinkler needs to be assessed to prove that the gas detector and water sprinkler can reduce risk. Figure 5 illustrates the assessment of the gas detector and water sprinkler installation in the small-scale leak scenario. Through the installation of a gas detector and water sprinkler, three safe conditions can be identified. The highest risk in the small-scale leak scenario (Outcome 1.2) is reduced to tolerable risk with a probability value of 1.5 × 10⁻⁵.
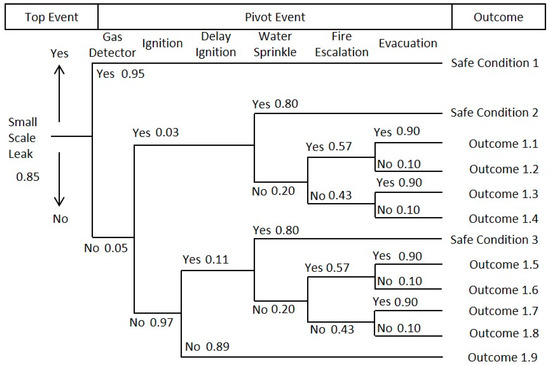
Figure 5.
Event tree diagram for the small-scale leak scenario with a gas detector and water sprinkler.
3.7. Risk Control in Large-Scale Gas Release Scenario
To reduce risk, installation of a gas detector and water sprinkler was also applied in the large-scale gas release scenario. Figure 6 illustrates the analysis in this scenario. After the installation of a gas detector and water sprinkler, three safe conditions can be identified. Outcome 2.2, representing the highest risk in the large-scale gas release scenario, is reduced to the tolerable risk category with a probability value of 5.7 × 10⁻⁶.
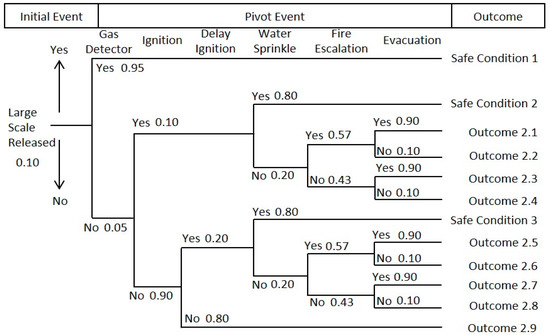
Figure 6.
Event tree diagram for the large-scale gas release scenario with a gas detector and water sprinkler.
3.8. Risk Control in Gas Pipeline Rupture Scenario
In the gas pipeline rupture scenario, risk control was also assessed using a gas detector and water sprinkler to reduce risk. Figure 7 illustrates the event tree diagram with a gas detector and water sprinkler as a barrier in the gas pipeline rupture scenario. From Figure 6, after installation of the gas detector and water sprinkler, there are three safe conditions. Outcome 3.2, representing the highest risk in the gas pipeline rupture scenario, is reduced to the tolerable risk category and has a probability value of 7.1 × 10⁻⁶, which proves that a gas detector and water sprinkler can reduce the risk in the gas pipeline rupture scenario. The risk level and probability value of the highest risk in each scenario are described in Table 5.
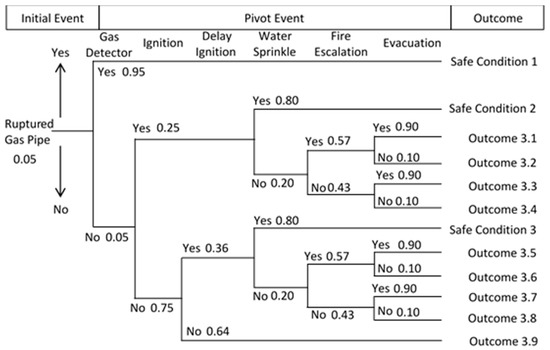
Figure 7.
Event tree diagram for the gas pipeline rupture scenario with a gas detector and water sprinkler.
Table 5.
Highest risk level of each scenario after risk control.
4. Conclusions
Gas distribution in existing buildings using a pipeline network entails potential hazards and high risk. The results of this study showed that Outcome 1.2, Outcome 2.2, and Outcome 3.2 had the highest risk levels in their respective scenarios. Outcome 1.2 in the small-scale leak scenario has a probability of 1.5 × 10⁻³ to incur fire, severe casualties, and light gas poisoning. In the large-scale gas release scenario, Outcome 2.2 has a probability of 6.0 × 10⁻⁴ to incur fire, severe casualties, and light poisoning. Additionally, Outcome 3.2 in the gas pipeline rupture scenario has a probability of 7.0 × 10⁻⁴ to result in fire, severe casualties, and light gas poisoning. The probability value and risk level of the highest risk in each scenario are reduced to the tolerable risk category by the installation of a gas detector and water sprinkler. The probability value of Outcome 1.2 becomes 1.5 × 10⁻⁵, that of Outcome 2.2 becomes 5.7 × 10⁻⁶, and that of Outcome 3.2 becomes 7.1 × 10⁻⁶. The result of this study can be a reference for analyzing the risk of pipeline leakage in the gas distribution network of existing buildings in Indonesia.
Author Contributions
Conceptualization, H.H.; Methodology, H.H.; Validation, H.H. and M.E.N.H.; Formal Analysis, H.H. and M.E.N.H.; Investigation, H.H. and M.E.N.H.; Resources, H.H. and M.E.N.H.; Data Curation, H.H. and M.E.N.H.; Writing—Original Draft Preparation, M.E.N.H.; Writing—Review & Editing, H.H., M.E.N.H. and A.R.K.; Visualization, H.H. and M.E.N.H.; Supervision, M.Y., and A.B.M.S.; Project Administration, A.R.K.; Funding Acquisition, H.H.
Funding
This research was funded by World Class Professor Program (number 123.3/D2.3/KP/2018) from Ministry of Research, Technology and Higher Education of The Republic of Indonesia. This research also was funded by the United States Agency for International Development (USAID) through the Sustainable Higher Education Research Alliance (SHERA) Program for Universitas Indonesia’s Scientific Modeling, Application, Research and Training for City-centered Innovation and Technology (SMART CITY) Project, Grant #AID-497-A-1600004, sub-grant #IIE-00000078-UI-1.
Acknowledgments
This work party was supported by the World Class Professor Program (number 123.3/D2.3/KP/2018) from Ministry of Research, Technology and Higher Education of The Republic of Indonesia. The authors would also like to acknowledge the publication support provided by the United States Agency for International Development (USAID) through the Sustainable Higher Education Research Alliance (SHERA) Program for Universitas Indonesia’s Scientific Modeling, Application, Research and Training for City-centered Innovation and Technology (SMART CITY) Project, Grant #AID-497-A-1600004, sub-grant #IIE-00000078-UI-1.
Conflicts of Interest
The authors declare no conflict of interest. The funders had no role in the design of the study; in the collection, analyses, or interpretation of data; in the writing of the manuscript; or in the decision to publish the results.
References
- Dirjen Migas ESDM. Pembangunan Jaringan Gas Bumi untuk Rumah Tangga. Jakarta. Indonesia. 2010. Available online: http://edoc.site/buku-jargas-jaringan-gas-city-gas-indonesia-pdf-free.html (accessed on 15 May 2018).
- Demirbas, A. Methane Gas Hydrate. X. 186, p. 47. Illus. 2010. Available online: http://www.springer.com/us/book/9781848828711 (accessed on 15 May 2018).
- ASME B31.8. ASME Managing System Integrity of Gas Pipelines. The American Society of Mechanical Engineers, 2004. Available online: http://law.resource.org/pub/us/cfr/ibr/002/asme.b31.8s.2004.pdf (accessed on 10 April 2018).
- Muhlbauer, W.K. Pipeline Risk Management Manual: Ideas Technique and Resources; Gulf Publishing Company: Burlington, NJ, USA, 2004. [Google Scholar]
- Bariha, N.; Mishra, I.M.; Srivastava, V.C. Hazard Analysis of Failure of Natural Gas and Petroleum Gas Pipeline. J. Loss Prev. Process Ind. 2016, 40, 217–226. [Google Scholar] [CrossRef]
- Jo, Y.D.; Crowl, D.A. Individual Risk Analysis of High-Pressure Natural gas pipelines. J. Loss Prev. Process Ind. 2008, 21, 589–595. [Google Scholar] [CrossRef]
- Cunha, S.B. A Review of Quantitative Risk Assessment of Onshore Pipelines. J. Loss Prev. Process Ind. 2016, 44, 282–298. [Google Scholar] [CrossRef]
- Beizma, M.V.; Agudo, D.; Barron, G. A Fuzzy Logic Method: Predicting Pipeline External Corrosion Rate. Int. J. Press. Vessel. Pip. 2018, 163, 55–62. [Google Scholar] [CrossRef]
- Park, K.S.; Lee, J.H.; Jo, Y.D. An Approach to Risk Management of City Gas Pipeline. Process Saf. Environ. Prot. 2004, 82, 446–452. [Google Scholar] [CrossRef]
- Xian, S.; Liu, K.; Sun, P.L. Risk Analysis on Leakage Failure of Natural Gas Pipelines by Fuzzy Bayesian Network with a Bow-Tie Model. Sci. Program. 2017. [Google Scholar] [CrossRef]
- Hao, M.J.; You, Q.J.; Yue, Z. Risk analysis of urban gas pipeline network based on improved bow-tie model. IOP Conf. Ser. Earth Environ. Sci. 2017, 93, 1. [Google Scholar] [CrossRef]
- Yuhua, D.; Datao, Y. Estimation of failure probability of oil and gas transmission pipelines by fuzzy fault tree analysis. J. Loss Prev. Process Ind. 2005, 18, 83–88. [Google Scholar] [CrossRef]
- Cheliyan, A.S.; Bhattacharyya, S.K. Fuzzy event tree analysis for quantified risk assessment due to oil and gas leakage in offshore installations. Ocean Syst. Eng. 2018, 8, 41–55. [Google Scholar]
- Andrews, J.D.; Dunnett, S.J. Event Tree Analysis Using Binary Decision Diagrams. IEEE Trans. Reliab. 2000, 49, 230–238. [Google Scholar] [CrossRef]
- Wang, H.; Duncan, I.J. Likelihood, causes, and consequences of focused leakage and rupture of US natural gas transmission pipelines. J. Loss Prev. Process Ind. 2014, 30, 177–187. [Google Scholar] [CrossRef]
- Standards Australia/Standards New Zealand. Risk Management Guidelines Companion to AS/NZS 4360:2004. Standards Australia International Ltd.: Sydney, Australia, 2004. Available online: https://www.saiglobal.com/PDFTemp/Previews/OSH/as/misc/handbook/HB436-2004(+A1).pdf (accessed on 12 May 2018).
- Kishawy, H.; Gabbar, A. Review of pipeline integrity management practices. Int. J. Press. Vessel. Pip. 2010, 87, 373–380. [Google Scholar] [CrossRef]
- Čepin, M. Assessment of Power System Reliability: Methods and Applications; Springer Science & Business Media: London, UK, 2011. [Google Scholar]
- Ashe, B.S.W.; Rew, P.J. Effects of Flashfire on Building Occupants. WS Atkins Consultants Ltd.: Surrey, 2003. Available online: http://www.hse.gov.uk/research/rrhtm/rr084.htm (accessed on 17 May 2018).
- Schmidt, M. Tolerable Risk, Chemical Engineering. The YGS Group, ER-00054. 2007. Available online: https://pdfs.semanticscholar.org/72e0/82bcb61cc2f6433976b25c40a384f59396cb.pdf (accessed on 21 March 2018).
- Oreda. Det Norske Veritas. Norway. 2009. Available online: http://www.putrastandards.net/shop/product.php?id_product=779 (accessed on 21 March 2018).
© 2018 by the authors. Licensee MDPI, Basel, Switzerland. This article is an open access article distributed under the terms and conditions of the Creative Commons Attribution (CC BY) license (http://creativecommons.org/licenses/by/4.0/).