Review

Recent Advances in Computational Modeling of Primary Atomization of Liquid Fuel Sprays

Department of Mechanical, Electrical and Electronic Engineering, Shimane University, Matsue 690-8504, Japan
Energies 2018, 11(11), 2971; https://doi.org/10.3390/en11112971
Submission received: 27 September 2018 / Revised: 25 October 2018 / Accepted: 28 October 2018 / Published: 1 November 2018
(This article belongs to the Section I: Energy Fundamentals and Conversion)

Abstract

:
Recent advances in modeling primary atomization in order to enable accurate practical-scale jet spray simulation are reviewed. Since the Eulerian–Lagrangian method is most widely used in academic studies and industrial applications, in which the continuous gas phase is treated in the Eulerian manner and droplets are calculated as Lagrangian point particles, the main focus is placed on improvement within this framework, especially focusing on primary atomization where modeling is the weakest. First, limitations of the conventional methods are described and then novel modeling proposals intended to tackle these issues are covered. These new modeling proposals include the Eulerian surface density approach, and the hybrid Eulerian surface/Lagrangian subgrid droplet generation approach. Compared to conventional simple yet sometimes non-physical models, recent models try to include more physical findings in primary atomization which have been obtained through experiments or direct numerical simulation (DNS). Model accuracy ranges from one that still needs some adjustment using experimental or DNS data to one which is totally self-closed so that no parameter tuning is necessary. These models have the potential to overcome the long-recognized bottleneck in primary atomization modeling and thus to improve the accuracy of whole spray simulation, and may greatly help to improve the spray design for higher combustion efficiency.

1. Introduction

Liquid fuel combustion is widely used as an energy conversion method in automobile engines, aerospace engines, and power plants. Although emerging technologies are gradually increasing the choices of other energy conversion methods, combustion will still remain one of the major energy conversion methods in the foreseeable future. Utilization of biofuels is also a hot topic in this field for reducing the emission of overall carbon dioxide, and pursuit of optimum blending and combustion configurations has been sought for. Considering the number of existing and forthcoming engine devices (for example, nearly 0.1 billion new cars are sold every year worldwide [1]), improvement in combustion efficiency and exhaust gas cleanness will post a significant impact.
Liquid fuel is generally injected into the combustor as a turbulent spray. Spray combustion is a complicated combination of multi-scale and multi-physics phenomena. The spatial scale ranges from O (1–10 µm) of individual droplets to O (0.1–1 m) of the entire spray, and the temporal scale also varies accordingly. The physical processes include liquid atomization (liquid disintegration leading to droplet formation), evaporation, vapor mixing, and chemical reactions, which all occur under turbulent conditions [2]. The complexity is strongly increased due to the interaction with turbulence. Therefore, understanding essential key phenomena in these processes is significantly important.
Experimental studies have been intensively conducted to unveil spray dynamics [3,4,5] and many findings on spray formation mechanisms and subsequent combustion have been obtained. Recently, access to a variety of experimental data has been possible, for example in a database provided by the Engine Combustion Network (ECN) [5]. Still, experimental observation inside the combustion chamber is not easy due to the high temperature and high pressure conditions of the burning gas, and numerical simulation is thus also expected to play a role in predicting spray combustion behavior [6,7,8,9,10], but unfortunately the predictive capabilities of numerical simulation for spray combustion are still not sufficient. In fact, spray simulation is one of the largest bottlenecks in automotive design processes in industries [11]. Especially, a spray region called the primary atomization region is the main cause for this situation. The primary atomization region refers to a small-scale near-nozzle region where the spray formation (droplet generation) initiates from the surface of a liquid core (a liquid column continuously extending from the nozzle exit). Historically, progress of spray numerical simulation has been substantially made in a relatively easier region in the far-field downstream (typically in the Eulerian–Lagrangian framework), where generated droplets are already dispersed in the turbulent flow. Recent simulation results indicate the accuracy level is fine here if only the dynamics related to dispersed droplets is concerned [8,9,10,12,13]. However, physically these droplets are generated by primary atomization and the whole spray dynamics is strongly controlled by how the droplets are generated. Therefore, essentially the near-field primary atomization region and the far-field downstream region cannot be separated. This has been a large issue in simulating a jet spray typically used in automotive engines since the mechanisms of primary atomization have not been well understood. Figure 1 illustrates the conventional approach and the ideal approach in spray simulation [14]. The region marked by the solid square is the actual computational domain. In the conventional approach, the near-nozzle primary atomization region is omitted and replaced by some model information which is not necessarily physically accurate. In the ideal situation the spray must be solved consistently from the nozzle exit, or even from inside the nozzle, with physics-based primary atomization mechanisms. Since the conventional framework (Figure 1A) is still widely used in academic and industrial simulations, paradigm shift from Figure 1A,B would pose a significant impact if the accuracy can be improved with some modifications in the primary atomization models.
The necessity to overcome this difficulty in primary atomization modeling has been recognized for a long time, and recently substantial progress has been made in both numerical and experimental aspects. Since the reviews of the state-of-the-art spray simulation techniques around the late 2000s and the first half of the 2010s by Gorokhovski and Herrmann [7], Jiang et al. [8], Subramaniam [9], and Kolakaluri et al. [10], there have been several advances and the present paper aims to review these recent developments in primary atomization modeling for straight jet sprays, which are expected to improve the spray simulation in engineering applications, especially in internal combustion engines. Although there are many interesting topics also related to primary atomization such as flash boiling atomization [15], effervescent atomization [16], cavitation inside the nozzle [17,18], supercritical injection [19,20], covering all these aspects is beyond the scope of this paper, and here the numerical aspects on primary atomization and its connection to the downstream region are discussed.
This paper is organized as follows. Section 2 briefly describes the conventional simulation approaches and discusses remaining issues for improvement. Section 3 shows recent DNS (direct numerical simulation) and experimental results that can be used to understand the physical processes of primary atomization. Section 4 reviews recent new approaches for primary atomization simulation. Finally, Section 5 summarizes the paper.

2. Conventional Spray Simulation Approaches

2.1. Overall Structures of A Spray

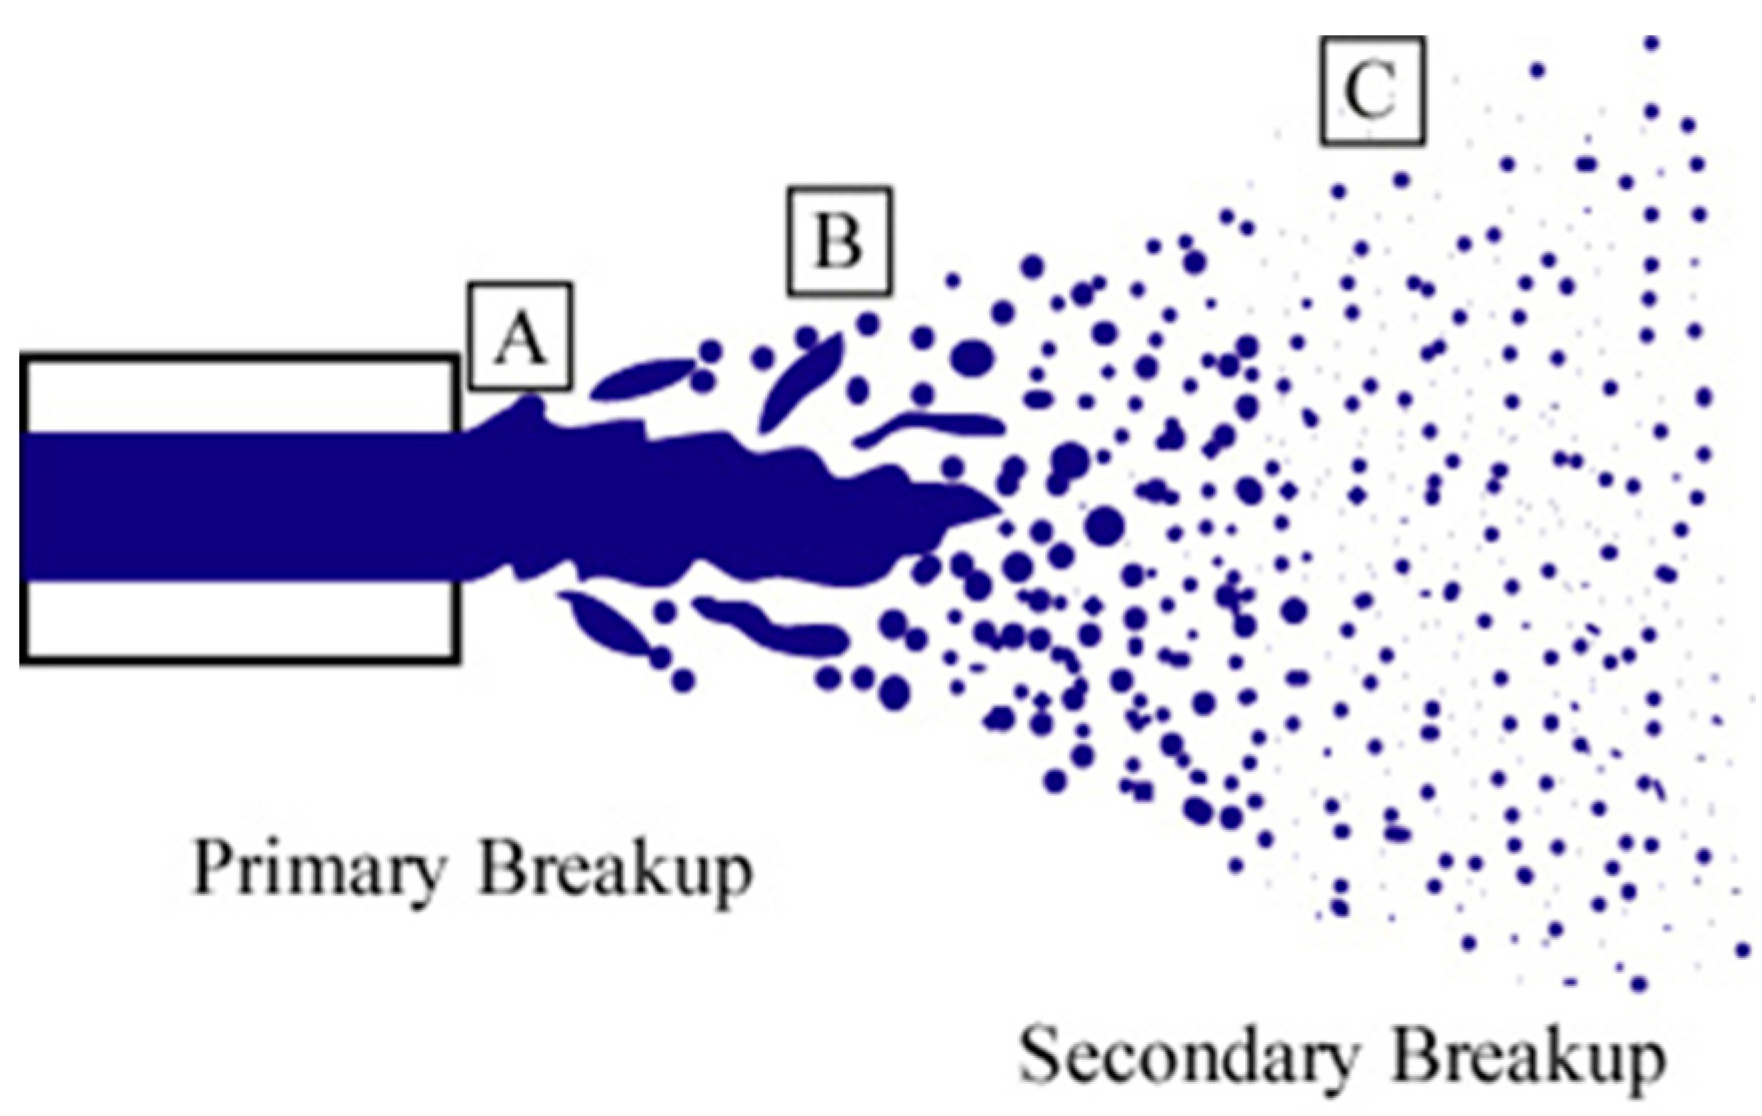
Here, a straight liquid jet spray injected into still air is mainly considered, which is commonly used in internal combustion engines. A fuel spray can be basically divided into two regions; dense spray in the near-field and dilute spray in the far-field. Although the definition of dense and dilute spray zones is sometimes not strict in the literature, here from a viewpoint of numerical implementation, the dense spray region refers to the near-nozzle region where primary atomization initiates with a distinct liquid core extending from the nozzle exit (A–B in Figure 2) and strong shear force acts on the liquid core surface leading to the generation of ligaments and droplets. The liquid/gas turbulent eddy scale is comparable to the small-scale liquid core surface deformation and due to the interaction between them, liquid fragments detach from the liquid core surface. These fragments are typically in a thread-like shape and called ligaments. Droplets will be finally generated from these ligaments due to pinch-off motion driven by surface tension. This atomization process from the liquid core to ligaments/droplets has been the difficult issue in numerical simulation, which has led to the situation where the near-field region was typically omitted, as mentioned in Section 1. The dilute spray region refers to the far-field region where the liquid core has already vanished and the gas eddy scale is larger than the droplet size. The generated droplets in the near-field spread into this far-field region. Here, droplets may quickly follow the gas motion as dispersed particles, and numerically this situation is easier to implement since the droplets can be treated as Lagrangian point particles. If evaporation is included, the droplets will finally disappear, which is also relatively easier in numerical implementation.
The Weber number (We) is one of the key parameters in determining spray and droplet behavior. Basically, the Weber number is a reference measure to observe the ratio of dynamic pressure (since ρ U 2 / 2 is the dynamic pressure) to surface tension (pressure), which is given as
W e = ρ U 2 L σ
where ρ is the density, U is the characteristic velocity, L is the characteristic length, and σ is the surface tension coefficient. The definition of the Weber number is sometimes ambiguous, but it should represent the main physical factors. For example, if the aerodynamic pressure is physically important in a situation such as droplet bag breakup in a gas flow [21], then the gas (air) density ρ G and the liquid/gas relative velocity U are taken as reference values. In this case, the length scale would be the droplet diameter D d . In an experiment of a liquid jet [22], the liquid density ρ L and the liquid injection velocity U i n j (assuming that the air is quiescent, this is the relative velocity) as well as the nozzle exit diameter D n o z z l e may be typically taken as reference values. In these cases, the Weber number is a reference value in a global sense so that different numerical/experimental conditions can be compared overall. It should be noted that this does not necessarily represent the ratio of aerodynamic and surface tension forces in a local sense since the local ratio may vary both spatially and temporally. Physically, in order to understand the atomization physics in a local area, a Weber number based on local information may be needed more. Since it is very difficult experimentally to measure local gas-phase dynamic conditions in the vicinity of a tiny liquid fragment and also it is very expensive to conduct fully-resolved simulations, there have been only a few numerical studies that discussed the local Weber number. Shinjo and Umemura [23] investigated the local Weber number for droplet generation, based on ρ G , the liquid/gas relative velocity | u L u G | and the ligament radius a l i g , and concluded that We ~ 1 is the criterion for droplet generation. Although the local Weber number definition is not always consistent in the literature, there should be more studies so that the accuracy of atomization modeling can be more refined. Models later discussed in Section 4.3, Section 4.4 and Section 4.5 more or less try to include the local We effect. Qualitatively, in the dense spray region (A in Figure 2), locally We >> 1 and in the dilute spray region (C in Figure 2) We << 1. Ligaments and droplets are generated when We ~ 1 (B in Figure 2). The droplet scale is typically around O (1–10 µm) and the entire spray scale is O (0.1–1 m). While droplet generation (atomization) in the dense region is termed as primary atomization, further breakup in the downstream region, if it occurs, is termed as secondary breakup. It should be noted that the definition of primary breakup and secondary breakup is not always clear.
In engine combustion applications, liquid is injected under turbulent conditions. The Reynolds number (Re) describes turbulent characteristics, which is given as
R e = ρ U L μ
where μ is the viscosity. For example, if the liquid turbulence transition/development in the injection pipe is concerned, ρ L , U i n j , D n o z z l e and the liquid viscosity μ L may be taken. If the gas phase turbulence is considered, these values will be replaced by those of the gas phase. Again the Reynolds number is a reference value and the issue of global or local also holds, similar to that for We. In the dense region, the droplet scale and the gas/liquid eddy scale are comparable, while the gas eddy scale is larger than the droplet scale in the dilute region. This scale difference makes it difficult to conduct consistent computational modeling throughout the entire spray.

2.2. DNS, RANS and LES

Here, three numerical approaches are briefly described [24]. The present paper is focused on conducting practical-scale unsteady simulation and the most suited approach for this purpose would be LES, as described below.
DNS (direct numerical simulation) is the simplest in numerical formulation, but the actual implementation is not easy due to high computational costs. As the term “direct” indicates, the Navier–Stokes equations are directly solved without introducing any turbulence model. To capture turbulence correctly, the grid spacing must be finer than the smallest scale of the flow field. In a single-phase gas flow, the smallest scale is the Kolmogorov scale where the smallest eddies are only to dissipate due to viscosity. In a multiphase flow, like a spray flow, the smallest scale of droplet also needs to be considered. In the primary atomization region, the flow and droplet scales are comparable and must be resolved, which is very costly since the grid resolution must be very fine. In the far-field dilute region, the droplet scale is much smaller than the flow scale. In a strict sense, the droplet scale must be resolved if it is called a DNS, but typically a simulation based on the point–particle droplet approximation, where the droplet structure (shape and its internal flow) is not resolved, is called a DNS since the Stokes number (an index for relative motion between the gas and the droplet, see Section 2.3) is very small and the droplet can be assumed to be a sphere without any internal flow. Therefore, in the far-field dilute region, DNS can be used with relatively less costs than in the near-field dense region. Since DNS does not contain models, DNS data can be used as reference data for validation.
RANS (Reynolds-averaged Navier–Stokes simulation) is a method where the governing Navier–Stokes equations are ensemble-averaged, and the computational cost is low. The Reynolds-stress term, which is derived by averaging, is unclosed and should be modeled. Since ensemble-averaging is used, the obtained results are basically suited for averaged steady-state analysis. In the early stage of simulation, RANS was popularly used because the computational cost was low and it was suited for parametric studies, but recently RANS has been relatively little used since there is a limitation in the accuracy used in unsteady flow cases.
LES (large-eddy simulation) is a method to introduce spatial filtering of the governing Navier–Stokes equations. By this, the requirement of grid spacing is eased compared with that in DNS. Flow structures larger than the grid spacing (GS; grid scale) are directly solved, and turbulent eddies smaller than the grid spacing (SGS; subgrid scale) are modeled. For the velocity field, the SGS viscosity needs to be modeled. The simplest and most widely-used SGS model for this is the Smagorinsky model [24]. Including atomization further requires an additional SGS atomization model and will be discussed later in Section 4. Since the averaging is done for space, LES is suited for temporally unsteady simulation. It should be noted that if the grid resolution is made smaller than the Kolmogorov scale, LES reduces to DNS. LES has recently become more and more popular even in industrial applications. Therefore, the present paper mainly discusses modeling for LES.

2.3. Computational Approaches for the Dilute Spray Region

Historically, the far-field dilute region is the first region where numerical spray simulation was made possible. If the dilute spray region is only concerned, the flow field can be set up in the range of practical scales. As already described, in the dilute region, the gas eddy scale is larger than the droplet scale, which makes it possible to treat the droplets as point particles. This means that the droplet inner structures or the flow structures in the very vicinity of the droplet surface may not need to be resolved and the requirement for grid resolution can be eased. Typically, simulations are conducted in the Eulerian–Lagrangian framework, where the gas flow field is solved in the Eulerian formulation and the liquid droplets, or parcels which include a group of droplets, are treated as point particles in the Lagrangian formulation. Eulerian–Eulerian mixture formulations have also been proposed [10], but they are not mentioned here. The Lagrangian method is often referred to as the discrete droplet model (DDM). Initially, one-way coupling, where the droplet motion is determined by the flow field but the flow field is not affected by the droplets, was used, but currently two-way coupling (interactions from liquid to gas and from gas to liquid are both considered) is usually used in DDM. The droplet equations of motion are typically given by [8,12]
d x d d t = u d m d d u d d t = m d f 1 / τ d ( u G u d )
where x d is the droplet position, u d is the droplet velocity, m d is the droplet mass, and f 1 = C D R e d / 24 is the drag for a sphere with drag coefficient C D . Here, the droplet Reynolds number is given as R e d = ρ G | u d u G | D d / μ G and τ d = ρ d D d 2 / 18 μ G is the Stokes time scale. D d is the droplet diameter and μ G the gas viscosity. The subscript d denotes droplet and G gas flow. If evaporation is involved, additional equations for heat transfer and evaporation are needed [12].
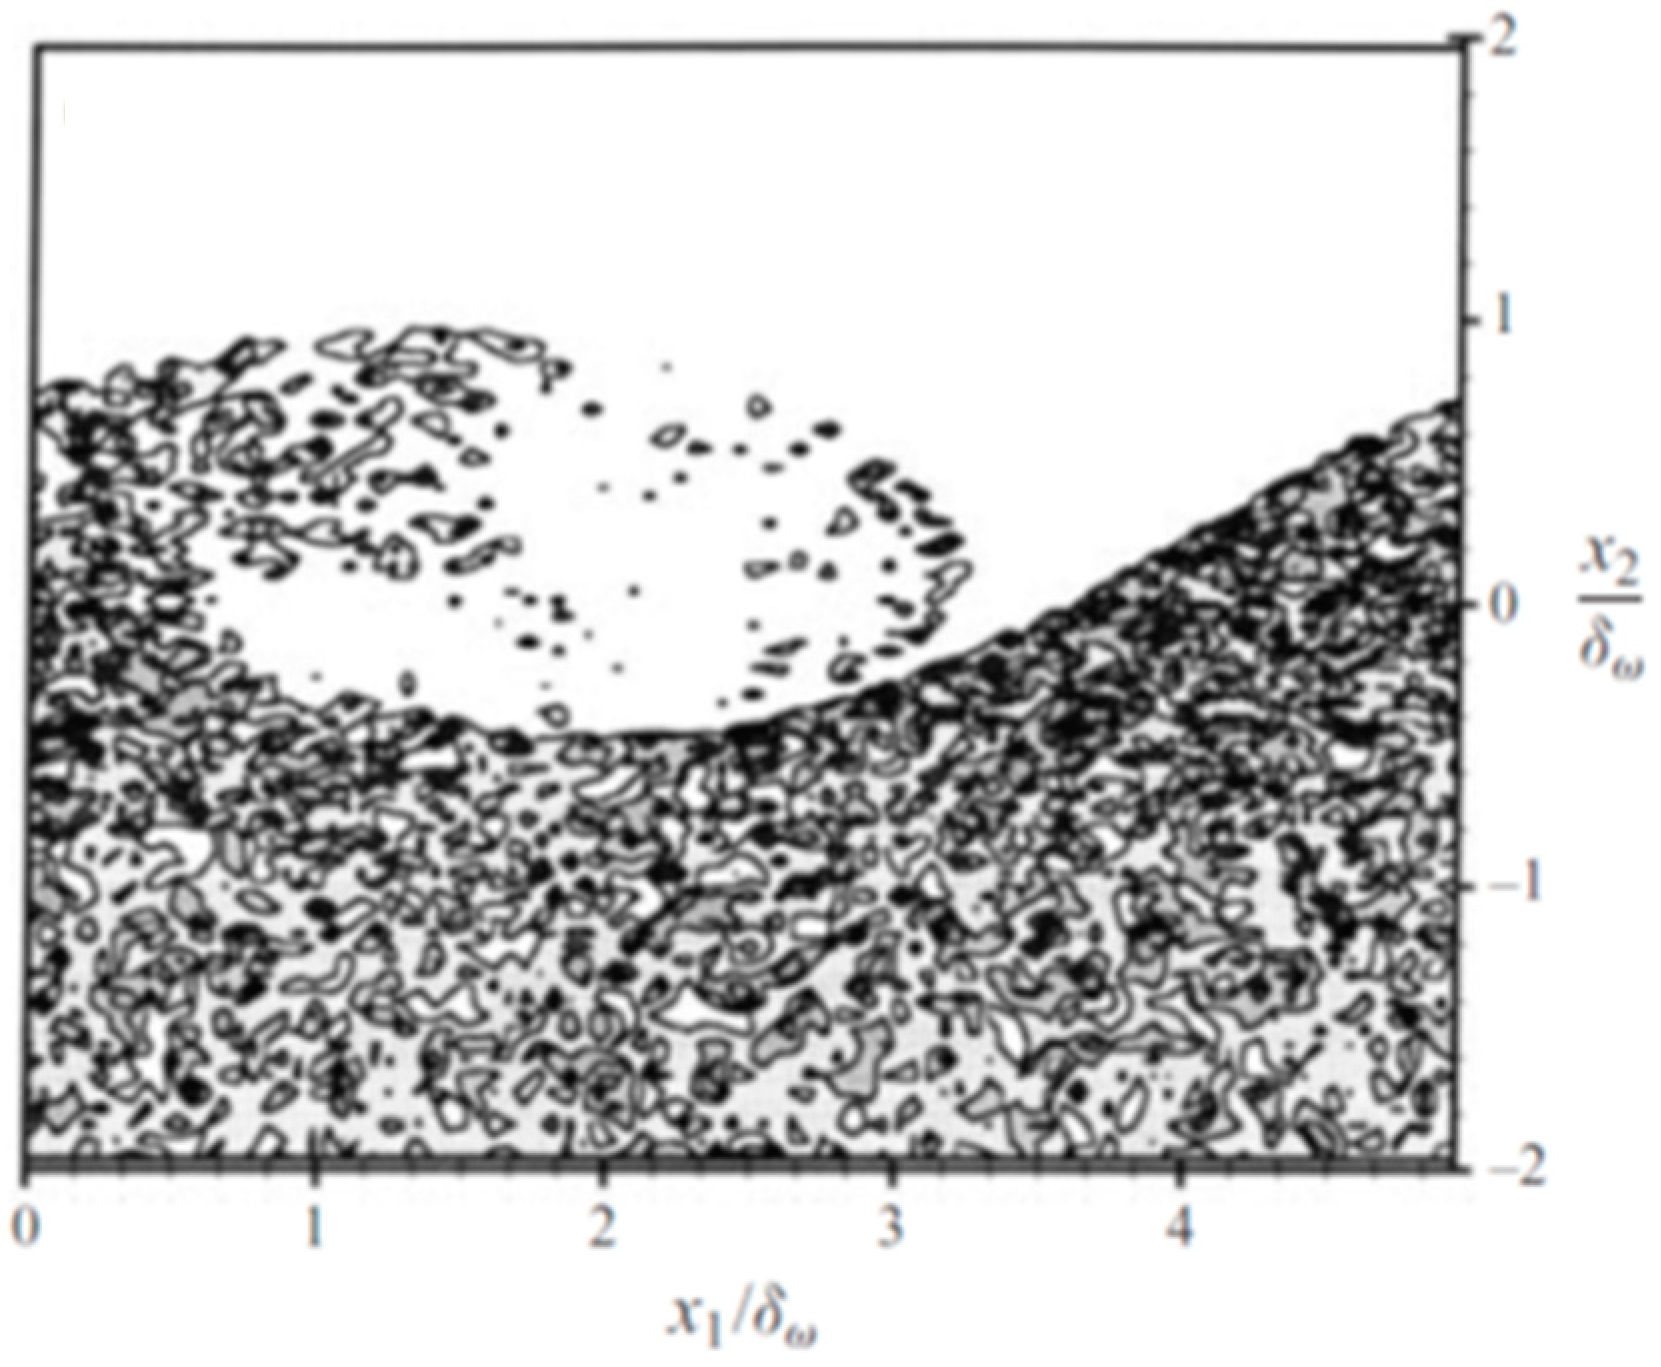
The term DNS is often used in this region in the context that the gas-phase turbulence is fully resolved while the droplet scale is not resolved, as mentioned in Section 2.2. LES is also used where spatial filtering is utilized. In LES, subgrid scale (SGS) phenomena should be modeled. For the gas phase, models such as the Smagorinsky model are used [24]. Using this approach, practical-scale sprays in many engineering areas can be simulated with less cost than DNS. There have been numerous simulations in the far-field dilute spray region [6,7,8,9,10,12,13]. A few examples are mentioned here from References [12] and [13]. Figure 3 shows the DNS result of the shear mixing layer [12]. A three-dimensional temporally developing mixing layer is considered where one gas stream is laden with hydrocarbon droplets. The initial droplet size ( D d = 115.5–231 µm) is determined by the specified values of Stokes number (St = 0.50–2.00). The Stokes number is defined as S t = ρ d D d 2 U / 18 μ G L and indicates the behavior of droplets. U and L represent the characteristic flow velocity and scale, for example the mean flow velocity and the main eddy size, and S t > > 1 means that droplets penetrate into the flow by their inertia and S t < < 1 means that droplets quickly follow the flow motion. The calculation was successful in predicting the droplet motion, as indicated in Figure 3, and also the evaporation and mixing characteristics of the fuel and air were investigated. It is evident in the figure that the vortical motion strongly affects droplet dispersion.
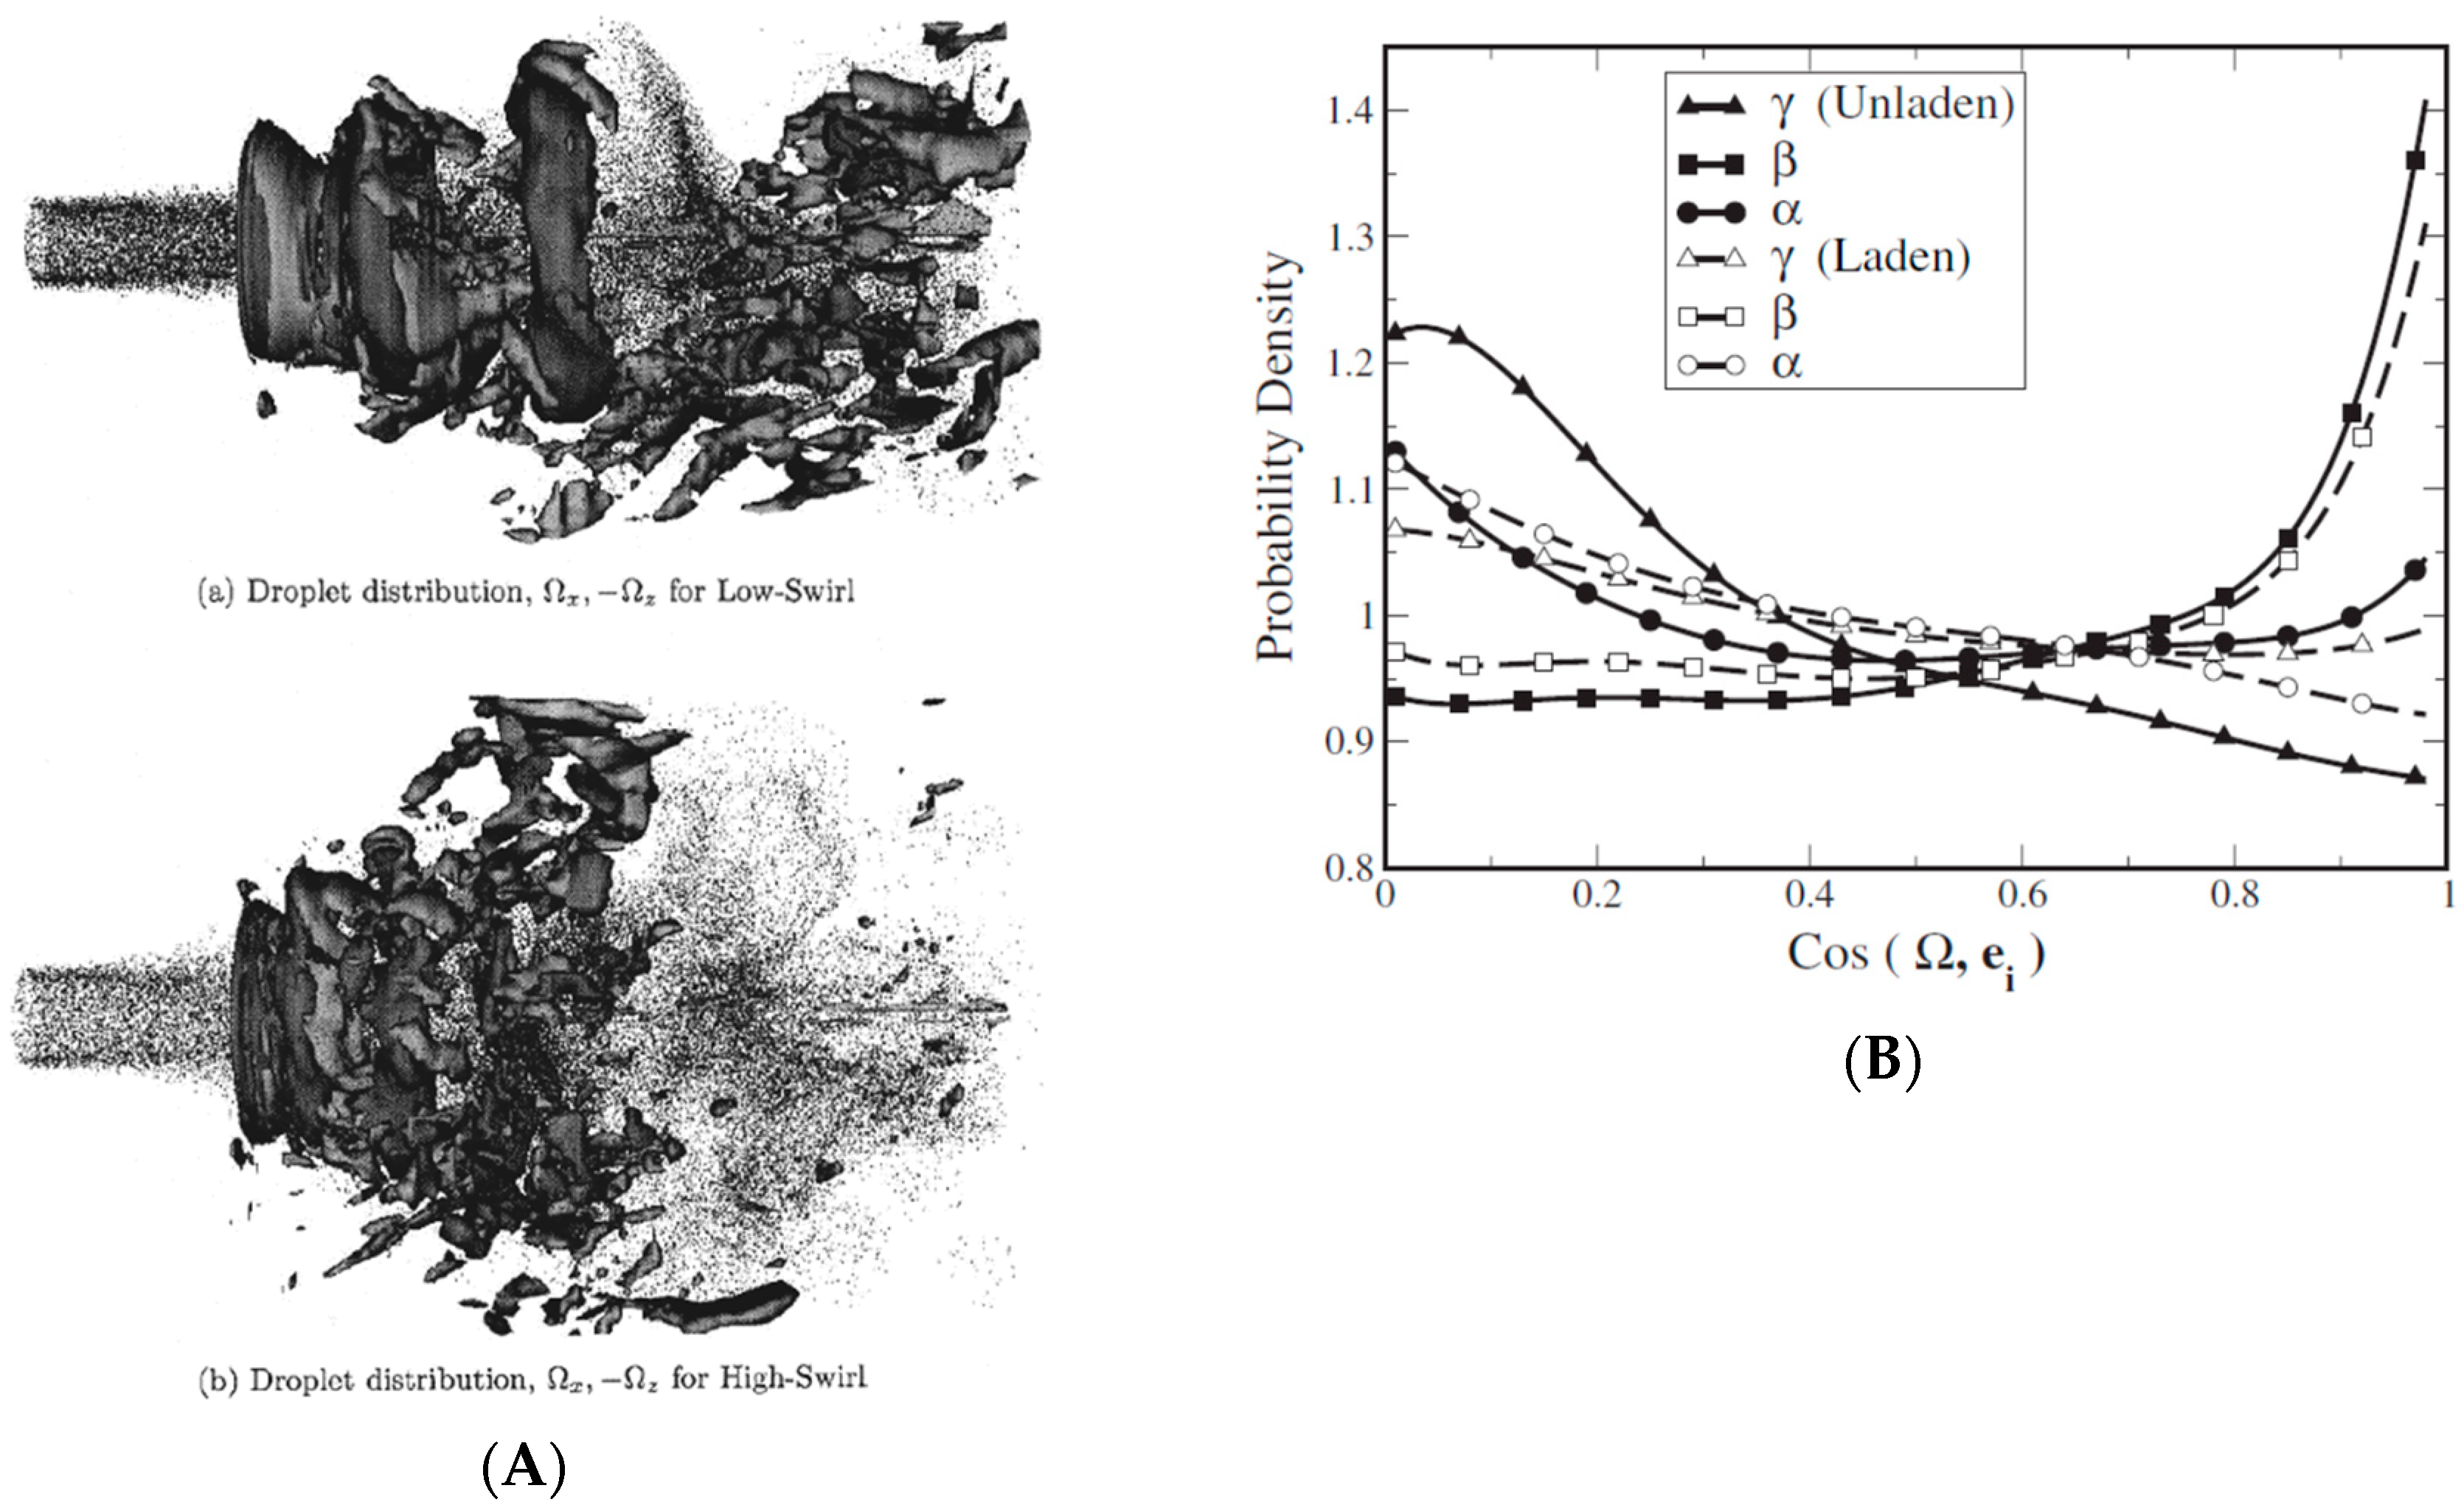
Another example is taken from a combustion LES case [13] where a realistic gas turbine swirl combustor configuration is considered. Fuel droplets are injected into the flow field as monodisperse 40 µm particles, which is close to the experimentally observed SMD (Sauter mean diameter). The flow field structures are well revealed as shown in Figure 4. Figure 4A shows the two cases with low and high swirl, and the shape of the vortical structures and the distribution of droplets are clearly visible. Also, this study importantly revealed the turbulence modulation characteristics due to the presence of droplets (Figure 4B) and combustion (not shown), since the droplets locally modulate the dissipation and production of turbulence. In fact, later, similar turbulence modulation due to finite-size particles was also reported by DNS [25,26]. Therefore, in the downstream region where the droplets can be assumed as point particles, the Lagrangian method is quite powerful in investigating the droplet-laden flows. (It should be noted that later their group extended their work to include polydisperse droplets with secondary breakup models [27]).
It has been shown that this approach is effective for the dilute spray region with a given size distribution of droplets. Although successful in describing the spray dynamics under turbulent conditions, one large issue is as yet unsolved. This is how to determine the number and size distribution of droplets. In the above simulations, it was pre-assumed that droplets are “given” from somewhere, namely, the calculations were conducted by giving the initial and/or boundary conditions of droplets, therefore not questioning how these droplets were generated. This approach is acceptable, if the main objectives are not to determine the droplet size, or if the flow field considered is not strongly affected by the droplet size.
In jet sprays such as those used in automotive internal combustion engines, however, this problem cannot be avoided. Physically, these droplets are generated by primary atomization processes and the dense and dilute regions are continuously connected and cannot be separated. It is known that the primary atomization region has a strong effect on the subsequent development of the entire jet spray. Therefore, careful attention must be paid to the primary atomization region in order to conduct a “full” jet spray simulation. In the following subsections, this primary atomization is focused on, since this is a key to the success of the whole jet spray simulation.

2.4. Conventional Computational Approaches for the Dense Spray Region

As described above, the scale of droplets/ligaments is comparable to the scale of liquid/gas eddies in the near-field dense spray region. Therefore, in principle, it is necessary to resolve the liquid surface motion, deformation, and thus the surface tension force. However, it has not been easy to do this especially for high-speed jet sprays. (In fact, only recently, DNS of primary atomization has been made possible. See Section 3.) As a consequence, several simple methods have been proposed and used for engineering applications, which do not necessarily represent accurately the actual primary atomization physics. Unfortunately, this issue has been a large bottleneck in spray simulation for decades.
To cope with the difficulty, several “practical” models have been proposed. The basic idea is to simply and directly extend the models in the dilute (secondary atomization) region to be used in the dense (primary atomization) region, regardless of the physical appropriateness. In fact, this is the very cause of the poor accuracy of conventional methods in predicting primary atomization.
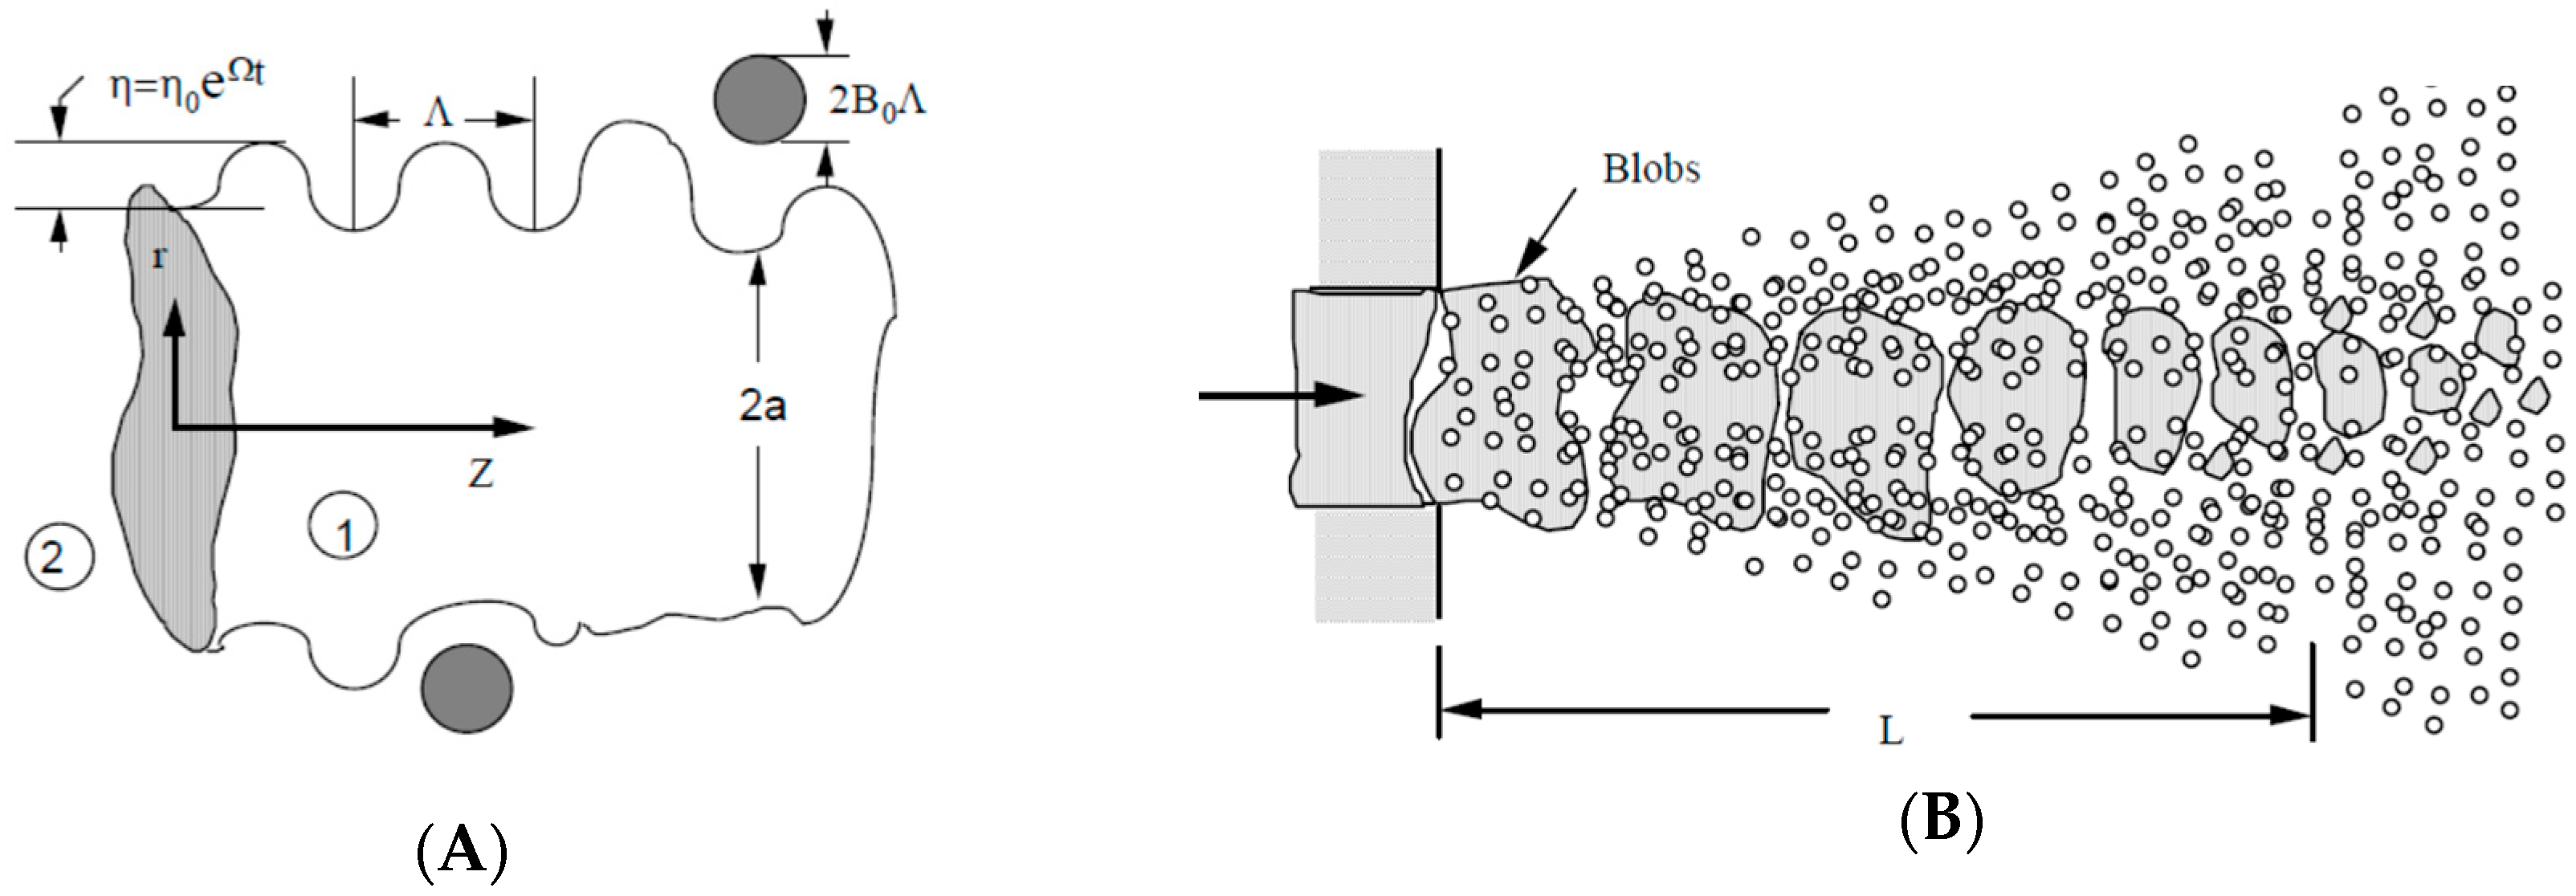
Representative models in the secondary atomization include the WAVE model, KH–RT (Kelvin–Helmholtz Rayleigh–Taylor) model and TAB (Taylor Analogy Breakup) model [28,29,30,31,32,33]. There are several variants but it is beyond the scope of this paper to go into details of all these models [34,35]. The WAVE model considers the Kelvin–Helmholtz (KH) surface instability as the main source for breakup. The KH–RT model additionally considers the Rayleigh–Taylor (RT) instability due to surface acceleration as a combined effect on breakup. This is schematically depicted in Figure 5A [28,29,30,31,32] and these models are mostly for high Weber number regimes. The wave patterns are amplified and the breakup wavelength is determined. To use these secondary atomization models in the primary atomization regime in the framework of the Lagrangian method, hypothetical “blobs” are introduced [28,29,30,31,32]. A blob is a liquid lump (parcel) whose characteristic size is similar to the nozzle diameter and breaks up into smaller fragments, as schematically shown in Figure 5B. Of course, physically such blobs are never observed [4], while there should be a continuous liquid core from the nozzle exit. Numerically, this blob assumption obviously violates the relation of D d < < Δ x (the particle size should be much smaller than the grid spacing). Still, this setting has been widely used simply because of the ease of numerical implementation. The WAVE model is applied numerically to the Lagrangian blobs. The blobs must undergo breakup continuously to produce smaller droplets in the downstream. Compared to the WAVE model, the TAB model [33] is a model for blob breakup mostly used in relatively lower Weber number regimes, therefore the TAB model may be successively used after the initial use of the WAVE model. The TAB model considers oscillation of a blob, caused by the balance between the aerodynamics force and the surface tension, and assumes breakup when the oscillation amplitude exceeds a threshold value. As a consequence, in the downstream region, a droplet cloud with some size/number distribution can be obtained. As mentioned, one advantage is the ease of numerical implementation in the Lagrangian formulation since the treatment of the liquid fuel starts from Lagrangian particles (parcels) regardless of the size. These models have been employed in many numerical codes, including commercial codes such KIVA [36]. There are numerous calculation cases and specific cases are not mentioned here.
In exchange for the ease of implementation, the price these models need to pay is how to determine the breakup rate of such blobs and some tuning or adjustment is inevitable. Strictly, it is difficult to say that such processes represent real physics of spray formation. In fact, the liquid core (continuous liquid cylinder) extends for some distance from the nozzle [4,37], and droplet breakup processes follow surface instability development, surface deformation, ligament ripping, and final pinch-off which leads to droplet generation [2,4,38]. This tuning procedure, where the breakup rate of blobs is artificially modulated, is typically done using experimental data so that the experimental characteristics such as global spray length or droplet size distribution can be recovered. Sometimes, these tuned model parameters are case-specific.
Another approach may be to presume some specific droplet size distribution, such as the Rosin–Rammler distribution, as the inlet boundary condition [39]. However, anyway this is equivalent to using external data tuning, and inputting a distribution which is typically established somewhat downstream as the inlet condition is physically questionable. Therefore, data adjustment, which is often physically unclear, is again inevitable.
In fact, recent papers on spray combustion are mostly made along with these conventional approaches. Reference [40] did not consider droplets but a mixture gas was injected. References [41,42,43] used the blob model and experimental data were used to tune the spray breakup length rather than directly predicting it. Reference [39] presumably used the Rosin–Rammler distribution as the inlet boundary condition. References [39,41,42,43] were related to the ECN database and mainly the downstream combustion dynamics was discussed, while the initial spray formation in the primary atomization was not thoroughly discussed. Practically, such approaches may be helpful from an engineering point of view. However, these conventional models cannot predict the spray characteristics by themselves and the problem further worsens when reference experimental data are not available. This lack of predictive capability has long hindered the accuracy improvement in spray simulations. It is now clear that the main problem in the accuracy of spray simulation lies in the lack of deterministic capability in the primary atomization region, and new modeling effort must be clearly directed towards this, including proper primary atomization physics and enabling prediction without external data [14]. In fact, a comment from a Japanese automobile manufacturer highlights this fact, in which it is stated that the largest bottleneck in automotive simulation (including all aerodynamic, structural and control simulations) is fuel spray simulation [11].
In the following sections, recent efforts to improve the accuracy of spray simulation in this direction are described. First, DNS and experimental studies are mentioned, which contribute to understanding the actual physics and obtaining modeling insights into the primary atomization region. Then, recent modeling efforts are described.

3. Understanding Primary Atomization by DNS and Experiments

DNS is a powerful tool to unveil the underlying physics as well as to obtain data for modeling. In DNS, it must be assured that all the scales down to the smallest scale of turbulent eddies (the Kolmogorov scale) are resolved and no modeling for flow motion is incorporated. The shortcoming of DNS is that the computational domain remains very small due to its high demand for computational resources, and thus the entire spray cannot be simulated currently. Recently, although the computational domain still remains small, DNS was successfully used to solve the near-nozzle dense spray region to unveil the physics of primary atomization [23,44,45,46,47,48,49,50,51,52,53]. Here, several examples are presented to show its effectiveness.
In DNS, it is necessary to capture the liquid/gas interface and resolve the local curvature so that the interaction between the gas/liquid eddies and the surface tension can be correctly captured. The level-set (LS) method and volume of fluid (VOF) method, and the combination of both, called the coupled level-set and volume of fluid (CLSVOF) method, are typically used [23,44]. Several techniques to modify the treatment of the interface have been also proposed, such as the ghost-fluid method [44].
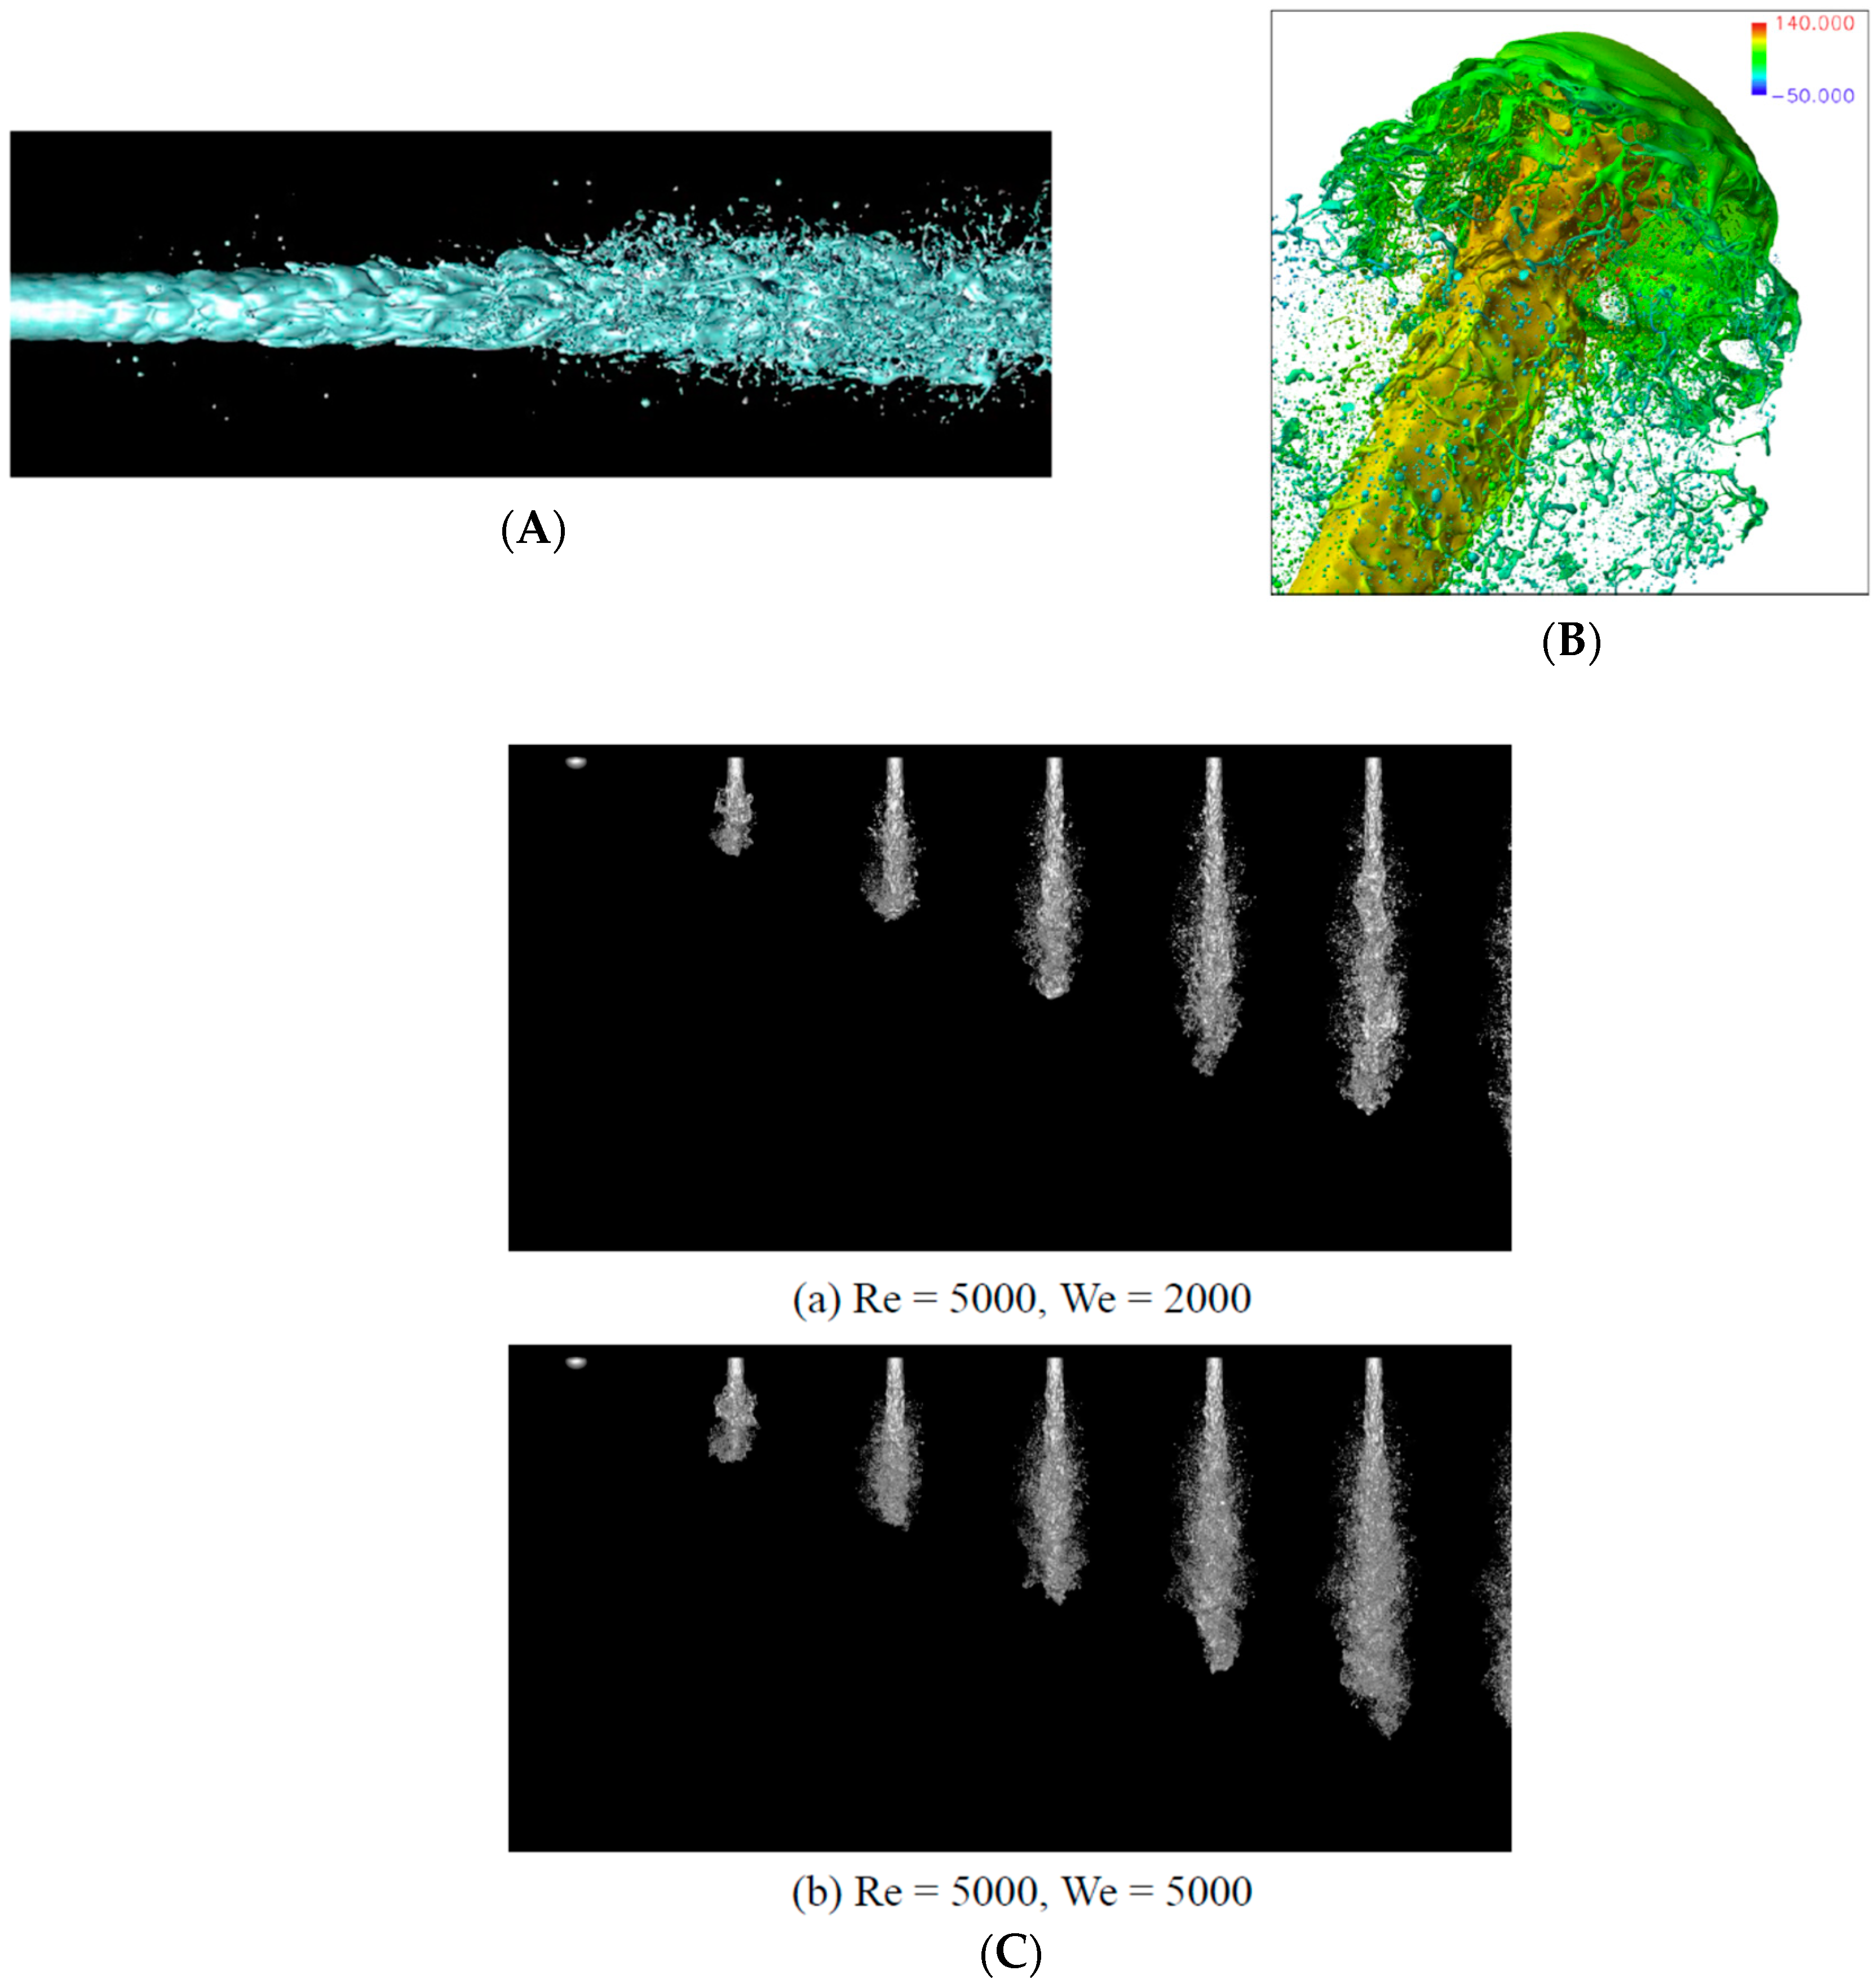
Figure 6 shows examples from References [23,44,51]. For a straight jet configuration, primary breakup initiates from the core front head formation, followed by core surface instability development, ligament ripping, and droplet pinch-off. The surface instability development is correlated with the injection speed, i.e., the shear force at the core interface, since the local balance between the aerodynamic force and surface tension (local We number) significantly affects the surface dynamics [47]. The liquid turbulence also enhances the growth of surface instability [44]. The ligament/droplet size is determined by the scale of surface deformation due to the surface instability. Zandian et al. [50] investigated the detailed mechanism of surface instability development and identified the role of gas-phase vortex dynamics near the surface. Ligament ripping occurs in the sequence of surface wave development, lobe-like shape formation, hole creation, and ligament detachment. This physical mechanism is basically similar in a planar jet configuration and was also investigated in detail quantitatively [51,52,53]. In [52,53], adaptive mesh refinement (AMR) is used to reduce the computational cost.
Herrmann [48] investigated the primary atomization in a jet-in-crossflow configuration. Since the liquid jet is injected normal to the main air flow, the surface instability development is also affected in the crossflow direction. Again, the surface instability development strongly affects the ligament/droplet generation. The effect of gas/liquid density ratio was also investigated, which affects the core penetration and spray spreading [49]. Figure 7 shows an example from [48], where the core surface instability development and subsequent atomization is clearly captured.
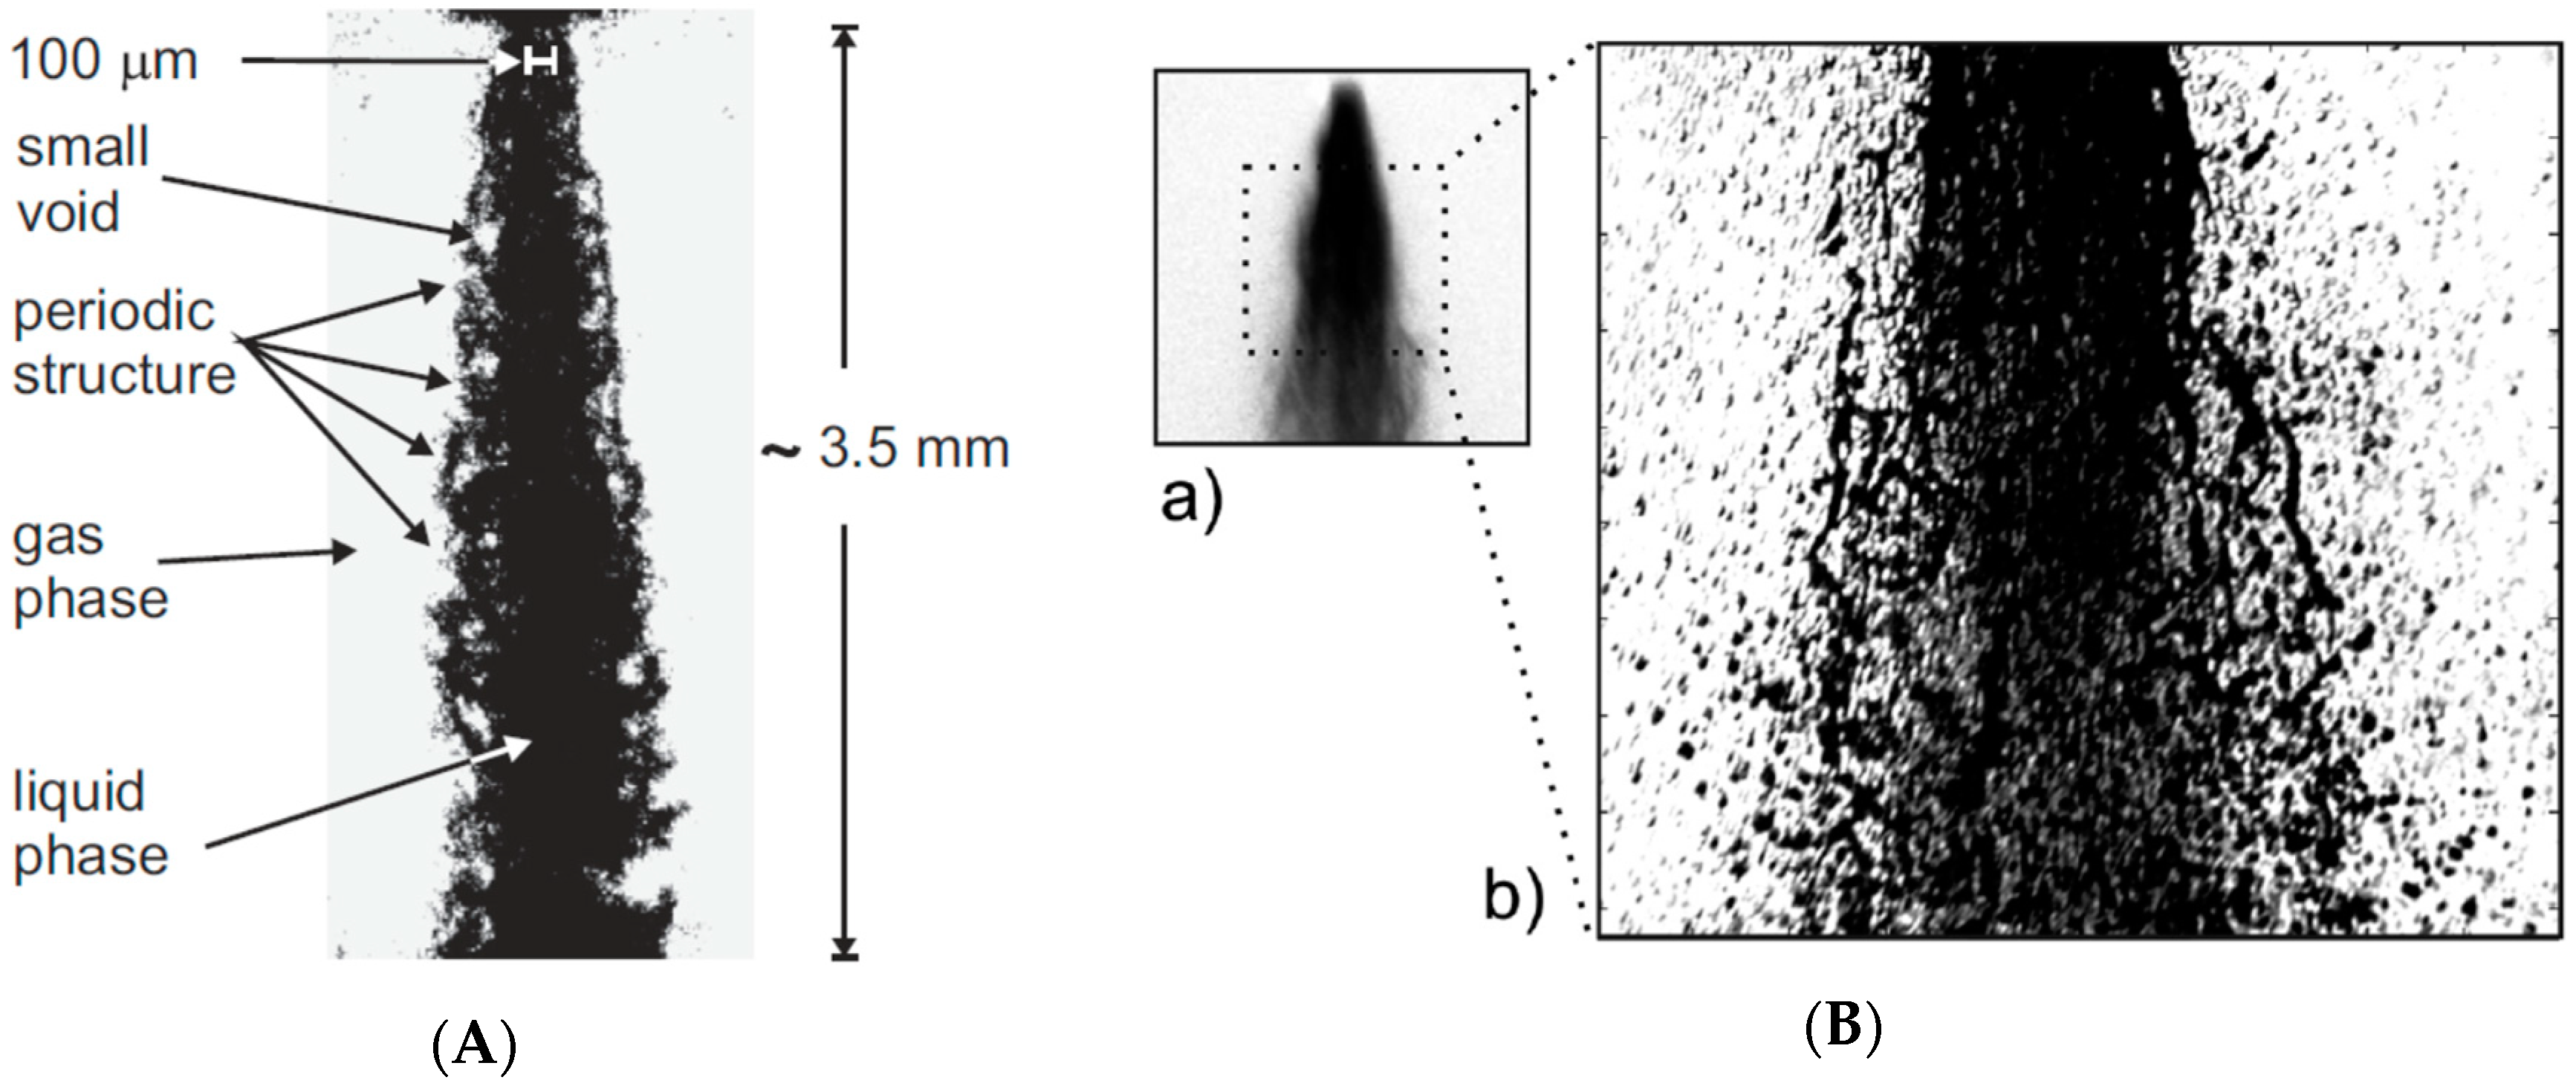
Experiments have also contributed to understanding the primary atomization dynamics [4,54]. Recent development in visualization techniques such as ballistic imaging, X-ray imaging, and others, has enabled quantitative measurements of shape, volume, orientation, and velocity in the primary atomization region. Figure 8 shows examples of experimental photo by ballistic imaging for jet sprays [4,54,55] (Figure 8B is for an effervescent spray but this is not essential). The important point is that small-scale ligaments and droplets are clearly seen, as well as the local flow structures. Such an image had been impossible until recently, where in the past only black images of sprays were possible and each small structure could not be seen. By quantifying the detailed shape and motion of these liquid fragments, the data can be very helpful for modeling and validation purposes.
Thanks to these recent successes in obtaining detailed quantitative data on the atomizing flow fields both numerically and experimentally, the data can be used for modeling and validation. In the proposed models in Section 4, validation data are fully utilized such as surface density distribution, spray shape (droplet distribution, spray angle), intact core length, and droplet SMD. This will be shown in the next section.
Since DNS of a whole spray is still impossible, modeling is important to conduct practical scale simulation cases. In the next section, recent new modeling methods are briefly reviewed.

4. Recent Modeling Approaches for Practical Scale Primary Atomization Simulations

4.1. Hybrid Eulerian DNS and Lagrangian Method

Although strictly this approach [56] is not a modeling approach, the objective of the method is also to enable practical scale spray simulations and thus this is mentioned first. The idea is straightforward. In order to maintain accuracy, the primary atomization region is directly solved in a DNS manner. In this region, the liquid/gas interface dynamics must be captured and the local grid resolution should be fine to capture the interface deformation (curvature) and the gas/liquid turbulent eddies. AMR is used to reduce the computational costs. However, small droplets and fragments are sometimes not well resolved (they are only a few times larger than the grid spacing) [56]. Therefore, replacing such a small droplet (resolved droplets; RD) with a Lagrangian point particle (LPP) may be reasonable. Therefore, “hybrid” means that the code is a combination of both an Eulerian–Eulerian part for capturing the liquid/gas interface and an Eulerian–Lagrangian part for capturing the droplet motion.
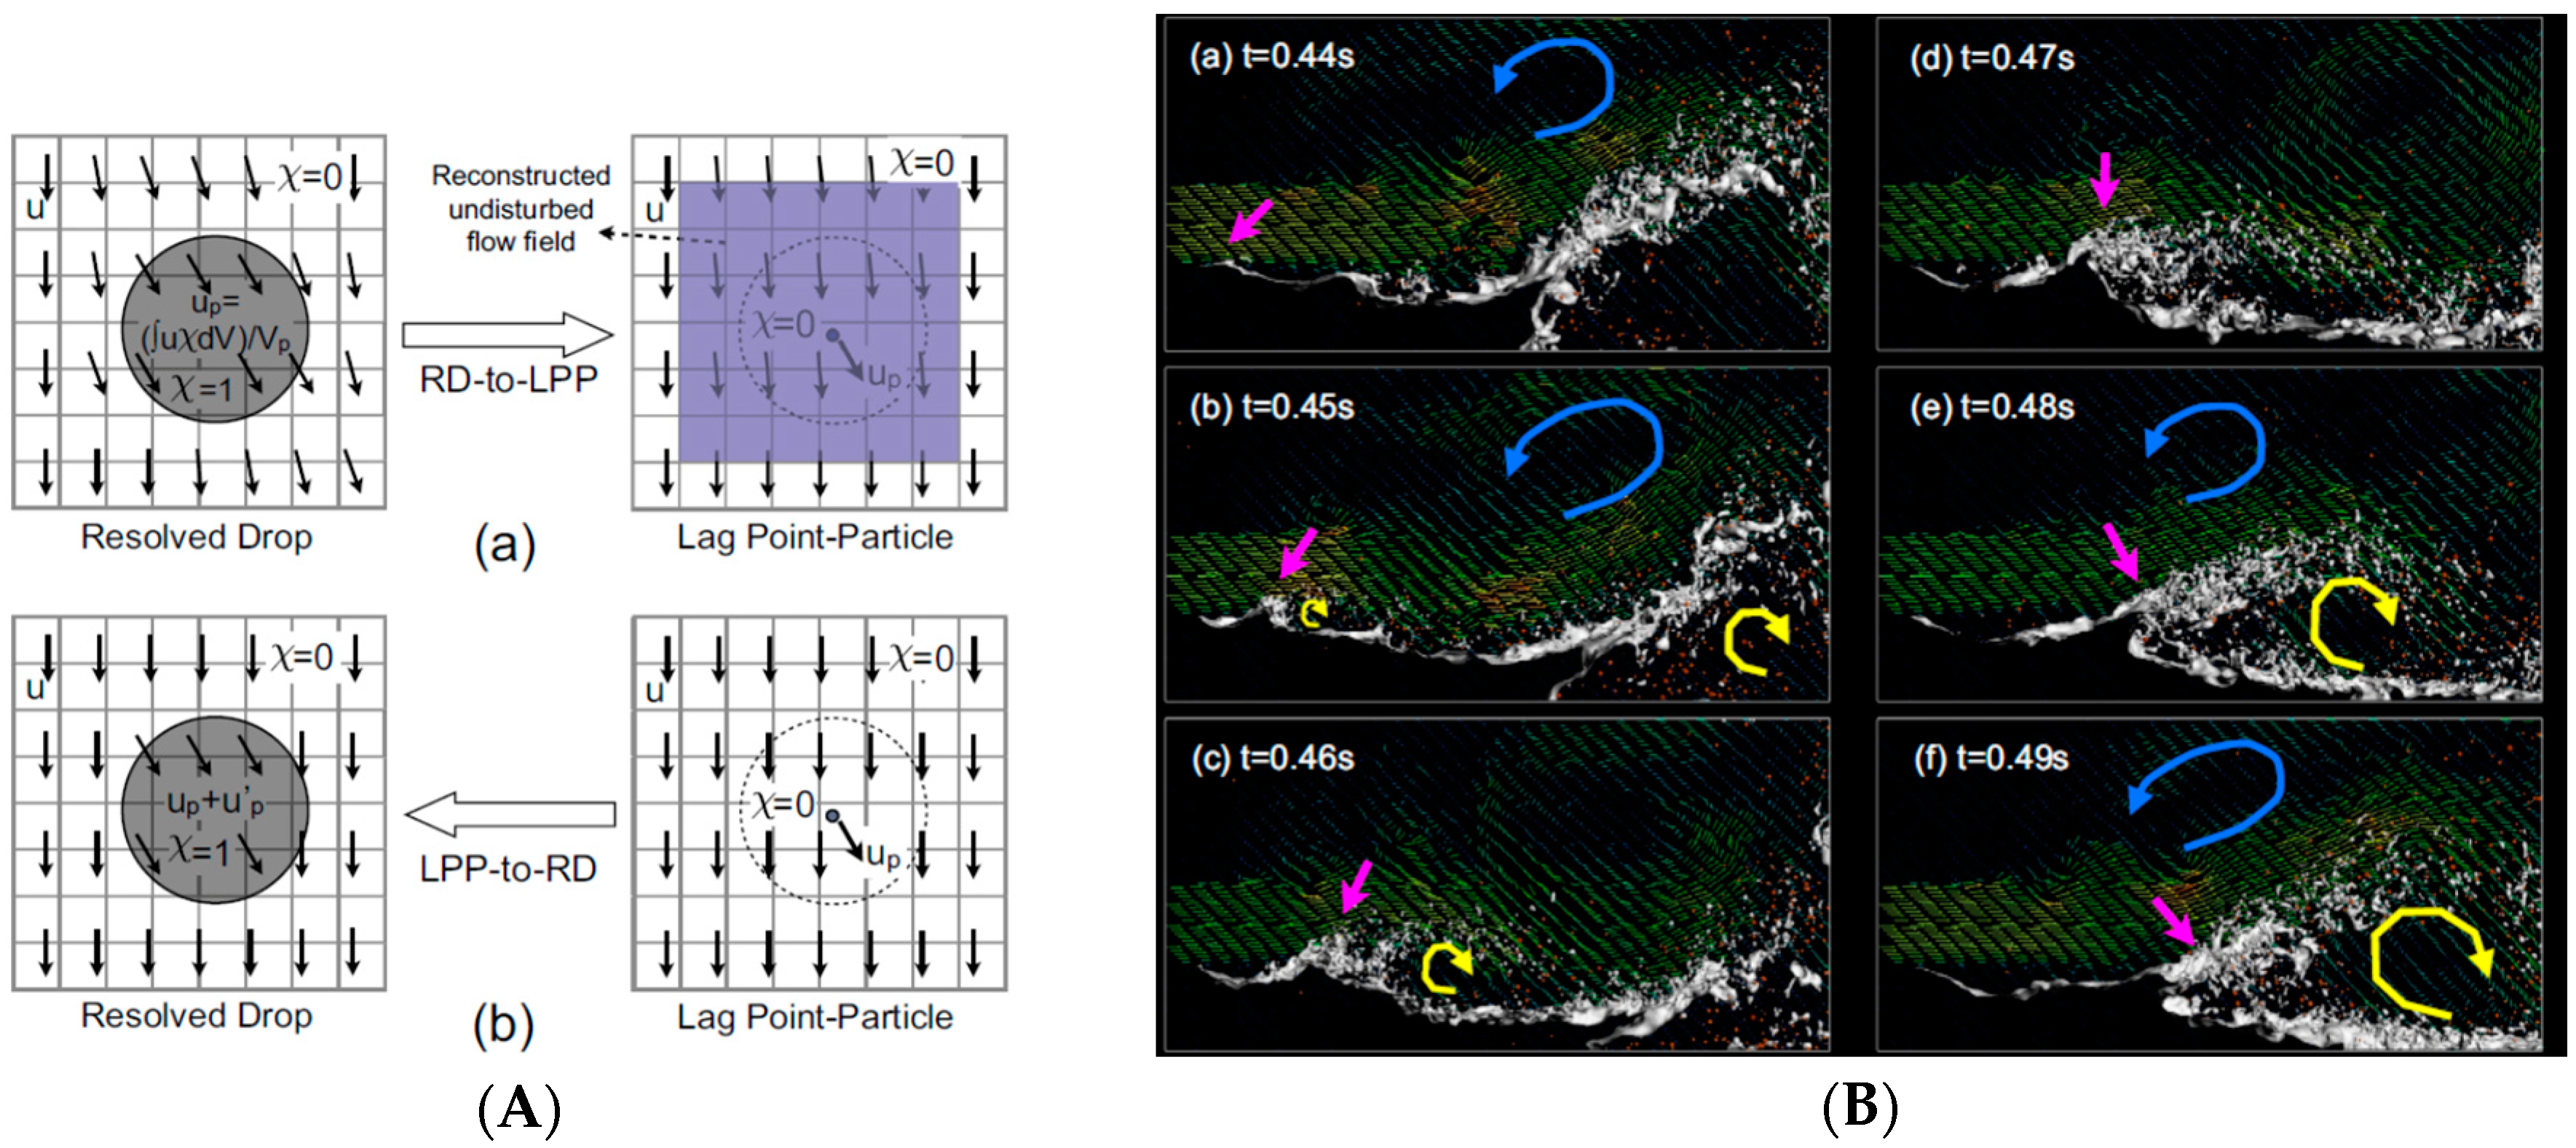
Ling et al. [56] carefully examined the effect of two-way coupling between the gas phase and the droplets and proposed a distributed force representation. The cut-off droplet size, below which the droplet is not well resolved, is set around 4–6 times the grid spacing. In the Lagrangian point– particle method in a usual sense, the particle size should be much smaller than the grid spacing and the formulation of momentum exchange is easy [8]. However, in the present method, the particles are larger than the grid spacing and careful attention is needed. Ling et al. [56] proposed a force distribution method using a Gaussian function and the effect of a droplet is spread in the flow field over a region which is slightly larger than the droplet size. Reconstruction of the velocity field after the replacement of a resolved droplet with a point particle is schematically shown in Figure 9A. A linear interpolation is performed and a divergence-free velocity field is reconstructed. Collision of a point-particle to the liquid surface (reverse conversion of LPP to RD) is also included in their method.
In validation test cases, the method was applied to a turbulent gas-assisted sheet atomization case. Figure 9B shows an example from [56] where small droplets are replaced by point particles indicated by the orange color. It is clear that a substantial number of droplets are generated from a developing wave front which is indicated by the red arrow and are treated as RDs and LPPs as atomization proceeds. The liquid motion is reasonable and the present method captures the detailed structures of atomization.
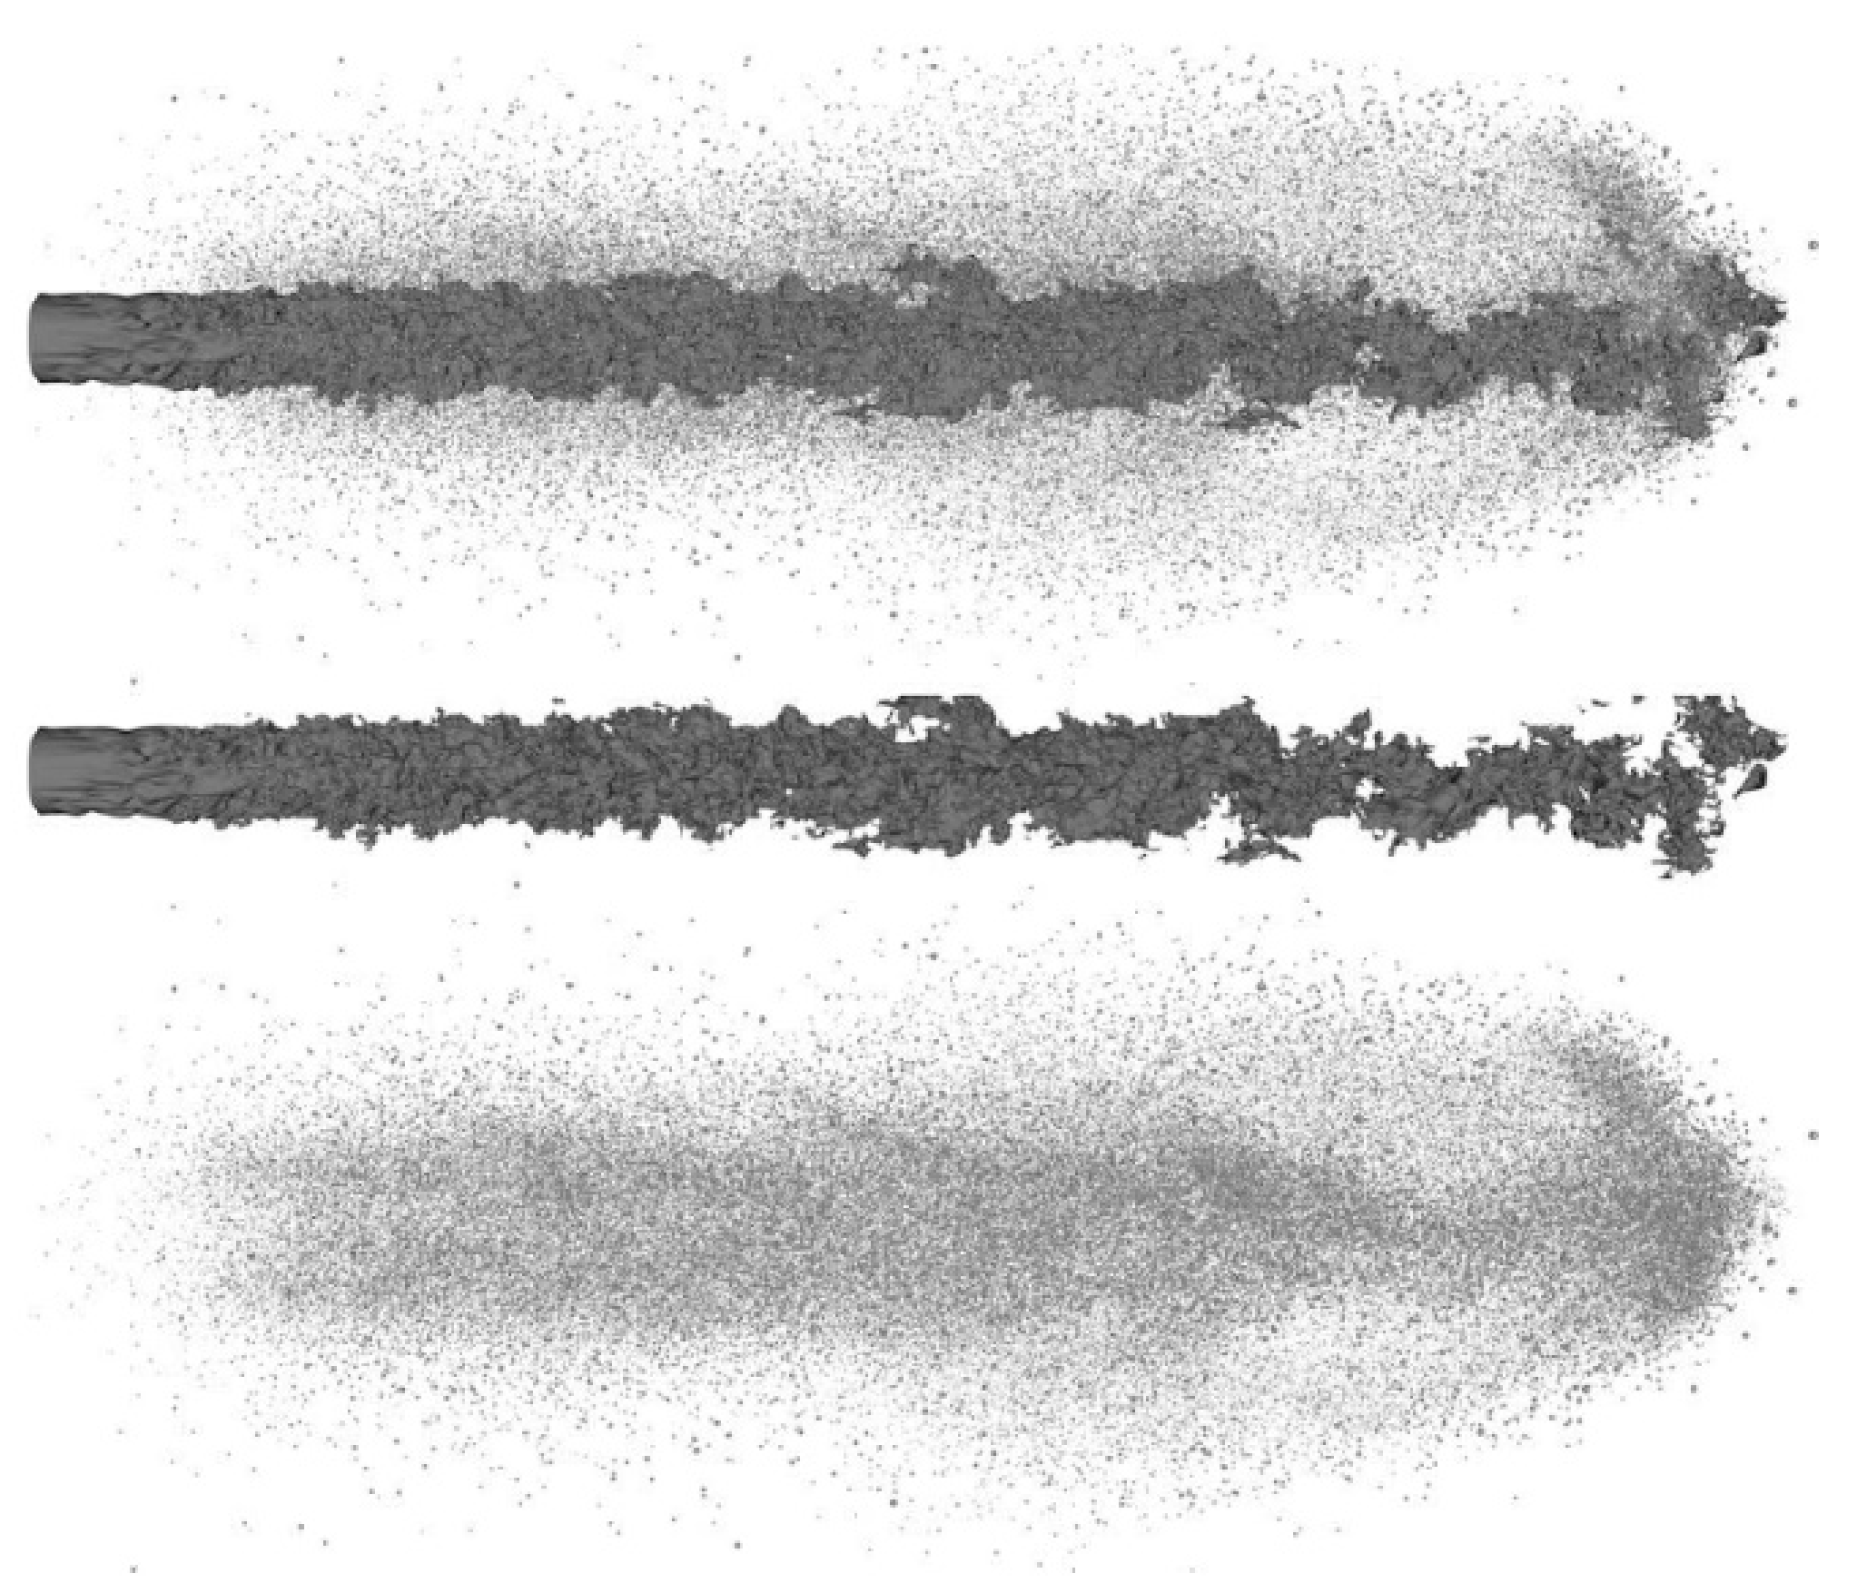
Herrmann [57] also proposed a similar method to convert small droplets into Lagrangian point particles and used it for a straight diesel fuel jet calculation. Figure 10 shows a result from [57] in which smooth transition from the Eulerian liquid to the Lagrangian droplets can be seen. The liquid core gradually transfers its mass to the Lagrangian droplets and it is expected that the core will eventually vanish.
In a straightforward manner, this method can be extended to include the downstream region where the gas flow can be resolved with a coarser grid and droplets can be readily represented as Lagrangian point particles. Thus, the grid resolution requirement is relaxed and the computational domain can be much larger than simply conducting a whole DNS, which makes this method promising for practical and industrial applications. The DNS part tracks the liquid interface until droplets are finally generated by the interface surface tension. Therefore, essentially no physical modeling for primary atomization is needed and the accuracy is high.
One drawback is that still the computational costs for DNS may be somewhat expensive and a relatively large parallel computer system may be needed to solve a spray problem by this method. Due to this cost issue, several other methods have been also proposed which may be less expensive. The next subsections describe such methods.

4.2. Eulerian–Lagrangian Spray Atomization (ELSA) Model

DNS results of primary atomization contain plenty of information on the interface dynamics, ligament generation, and droplet generation. The Eulerian–Lagrangian Spray Atomization (ELSA) formulation [45,58] utilizes the DNS database for modeling.
Since atomization is not directly resolved here, atomization should be represented by some model function. The approach here is to introduce the surface density function since atomization is a process to increase the surface area. The surface density function Ω ˜ (liquid/gas interface per unit mass) is defined as
Ω ˜ = Σ ¯ ρ ¯ ,
where Σ ¯ is the liquid/gas interface area per unit volume. The bar denotes an averaged value and the tilde a Favre-averaged value ( f ˜ = ρ f ¯ / ρ ¯ ). The evolution of surface density function can be written as [45],
ρ ¯ Ω ˜ t + ρ ¯ Ω ˜ u ˜ j x j = x j ( ρ ¯ Ω ˜ ( u ˜ j u ¯ j | Ω ) ) + S ,
where u ¯ j | Ω is the mean surface velocity. The last term in the RHS (S) is the source term discussed below. The first term in the RHS is unclosed and modeled as a turbulent diffusive term, as typically done in turbulence modeling. The source term in the RHS is directly linked to atomization processes and should be modeled properly. The generation of the surface density is mainly due to turbulence wrinkling and breakup, and the reduction is due to droplet coalescence and evaporation (if applicable).
In the ELSA model, the generation due to atomization is modeled as a relaxation process to an equilibrium value
S = ρ ¯ Ω ˜ τ ( 1 Ω ˜ Ω ˜ e q )
where Ω ˜ e q is the equilibrium value and τ is the relaxation time scale. Ω ˜ e q is derived by assuming an equilibrium between the total kinetic energy and the total surface energy. This process expresses that the Ω ˜ value eventually reaches Ω ˜ e q after the time period of τ . For the reduction of surface density due to droplet coalescence, a similar formulation based on the relaxation approximation is proposed. By this formulation, the detailed processes of breakup such as instability development, ligament formation, and droplet pinch-off are mostly hidden and the modeling of Ω ˜ e q and τ is significantly important. Therefore, in general, the model needs to determine the parameters using experimental/DNS database or theoretical consideration. In [45,58,59], using several previously proposed models, the contributions of turbulent mixing, mean shear stress, breakup, and coalescence to the source term are evaluated. Modeling parameters and constants have been fixed by comparisons with DNS data.
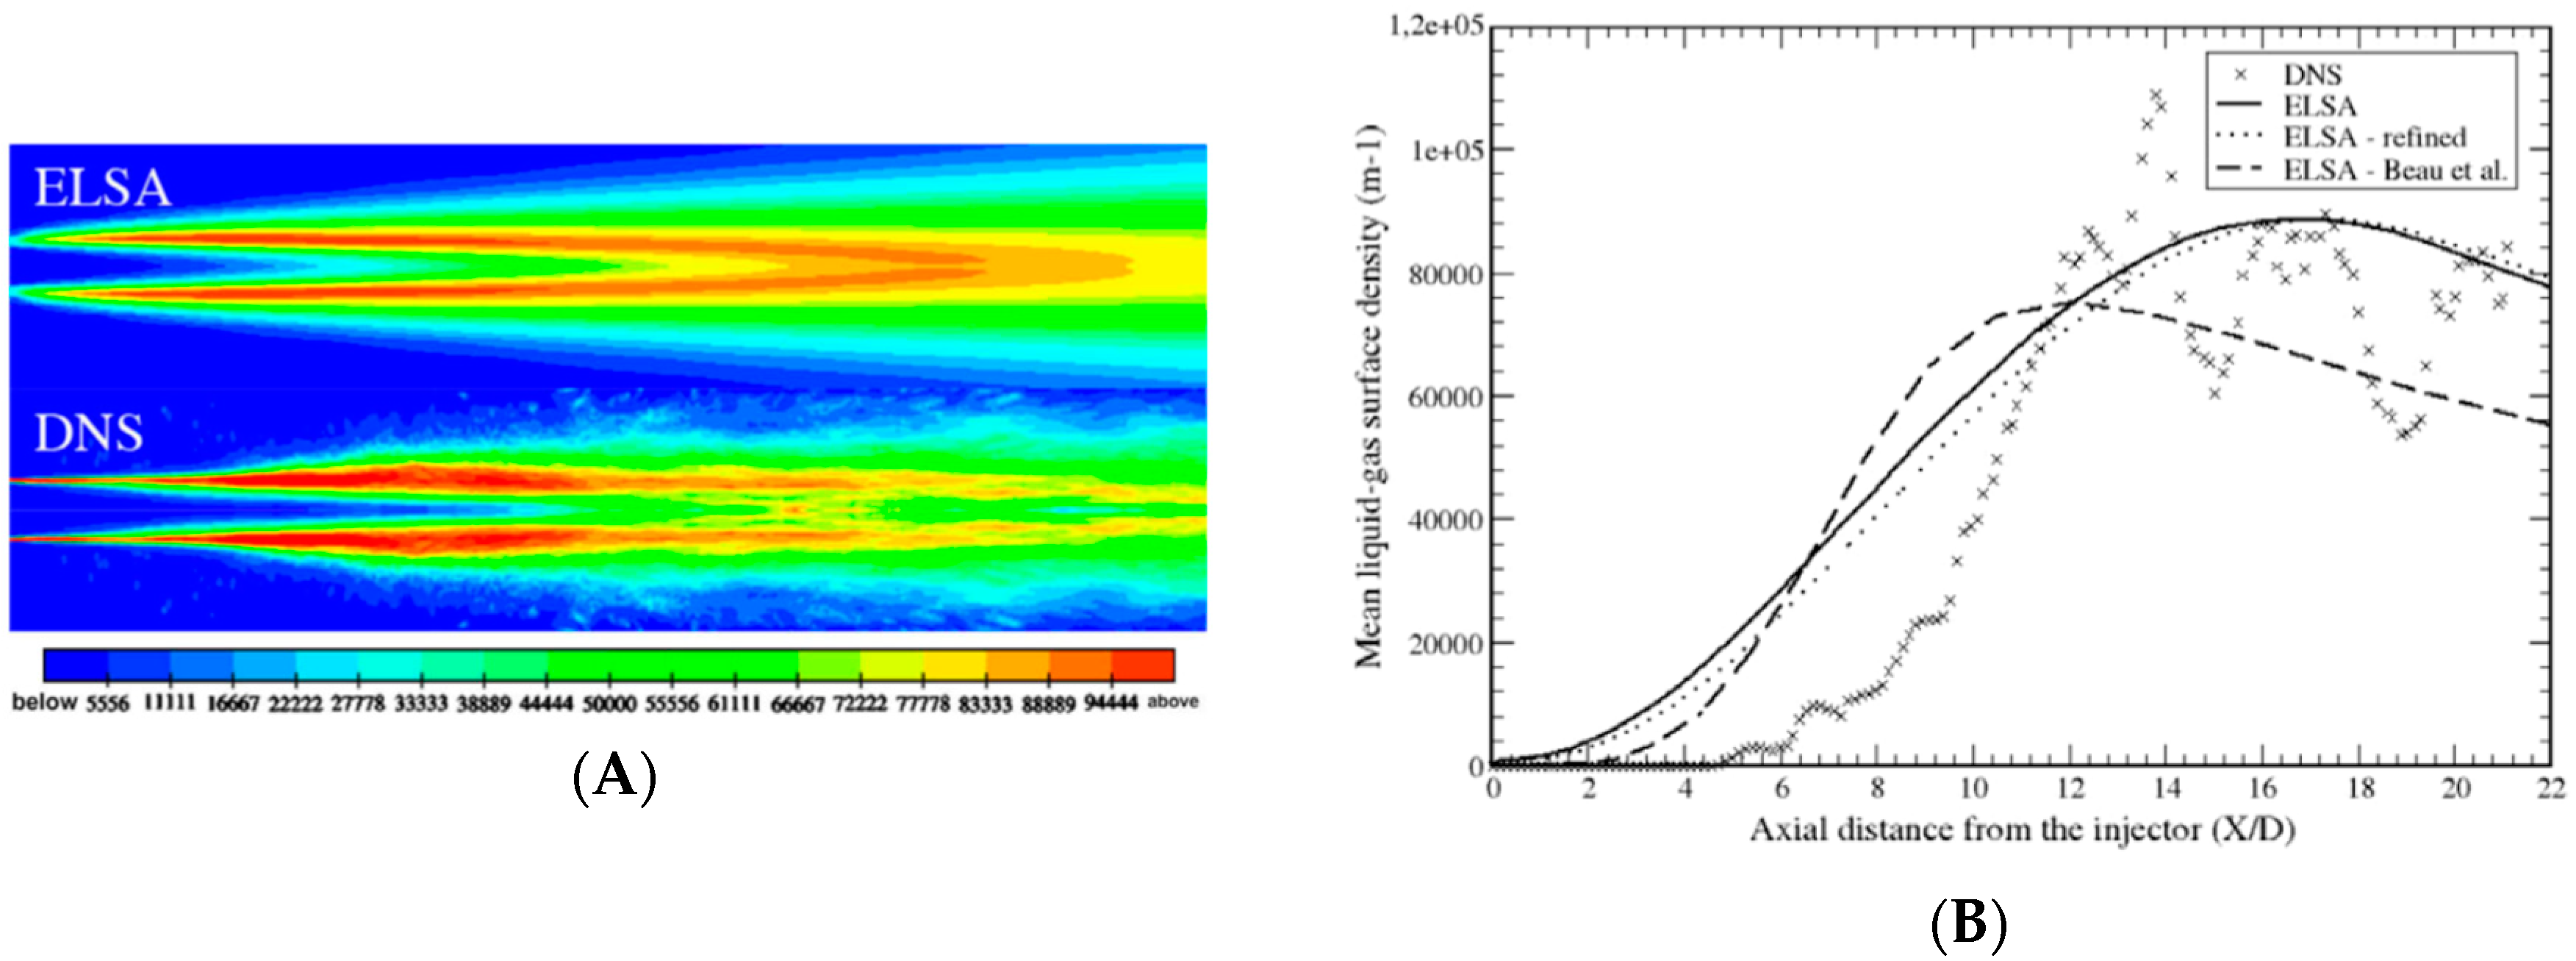
Figure 11 shows the results from [45] for the dense spray region. The surface density field is compared with that of DNS (the result is ensemble-averaged in the context of RANS). Overall, the ELSA model reproduces the spray shape similar to that obtained by DNS (Figure 11A). This is also clear from the axial distribution of surface density (Figure 11B). The method is also extended to the dilute region as well as to evaporative and reactive cases, and the results are promising.
Overall, the above formulation is simple and relatively easy to implement, but the model parameters need to be fitted. For sprays for which the DNS (or experimental) data are available, this model has a potential to enable low-cost and accurate simulation. For spray conditions for which DNS or experimental data are not readily available, it may be necessary to carefully examine whether the values of the above parameters represent the real physics under the flow conditions of interest.

4.3. PDF SGS Turbulent Atomization Model

Navarro–Martinez [60] pointed out that the ELSA representation is simple and easy, but the sizes of subgrid liquid structures interact in a more complex form, rather than represented by a single filtered value. Therefore, to describe the subgrid liquid structure fluctuation, a subgrid formulation is proposed based on a joint volume–surface density, subgrid probability density function (PDF) or filtered density function (FDF). The flow field itself is represented by the surface density formulation in the LES framework [60]. Therefore, the flow field is closed in the Eulerian representation and does not need the Lagrangian method, which eases the burden of numerical implementation similar to the ELSA model.
The surface density equation is similar to Equation (5), given as
Σ ^ t + u ¯ j Σ ^ x j = S g e n + S d e s t = S ,
where the hat represents the spatially filtered value. The term S in the RHS is the source term (generation and destruction) due to turbulent wrinkling, breakup and coalescence. To solve Equation (7), a subgrid-scale joint probability density function P s g s is introduced. A quantity P s g s d θ 1 d θ 2 defines the probability of θ 1 < ϕ < θ 1 + d θ 1 and θ 2 < Σ < θ 2 + d θ 2 , where ϕ corresponds to the liquid volume fraction. The PDF is governed by
P s g s t + u ¯ j P s g s x j = x j [ D s g s P s g s x j ] S g e n ( θ 1 , θ 2 ) P s g s θ 2 + S d e s ( θ 1 , θ 2 ) P s g s θ 2 ,
where the gradient-type subgrid-scale diffusivity is assumed here. In this formulation, a phenomenological model similar to that used in the ELSA model is assumed to derive S g e n or S d e s . In [60], they are given as
S g e n = θ 2 n i ( θ 1 ) n j ( θ 1 ) u ¯ i x j , S d e s = 1 τ ( θ 2 Σ e q ) θ 2 ,
where n i is the component of surface normal vector. Again, the equilibrium value Σ e q and the time constant τ need to be determined, similar to ELSA. For example, the equilibrium surface density Σ e q is derived by balancing the surface energy and the local kinetic energy, which is equivalently based on local We consideration. Considering a minimum surface value yields
Σ e q = ρ k ϕ σ + C Σ ϕ ( 1 ϕ ) / h ,
where k is the kinetic energy, h the size of the integration kernel, and C Σ is a coefficient. C Σ is determined from DNS data, and C Σ = 2.4 is given in [60]. The transport Equation (8) is solved using a stochastic approach to obtain the source term for Σ ^ in the LES formulation. Other quantities such as the SMD of droplets D 32 can be derived, for example, by D 32 = 6 ϕ / Σ .
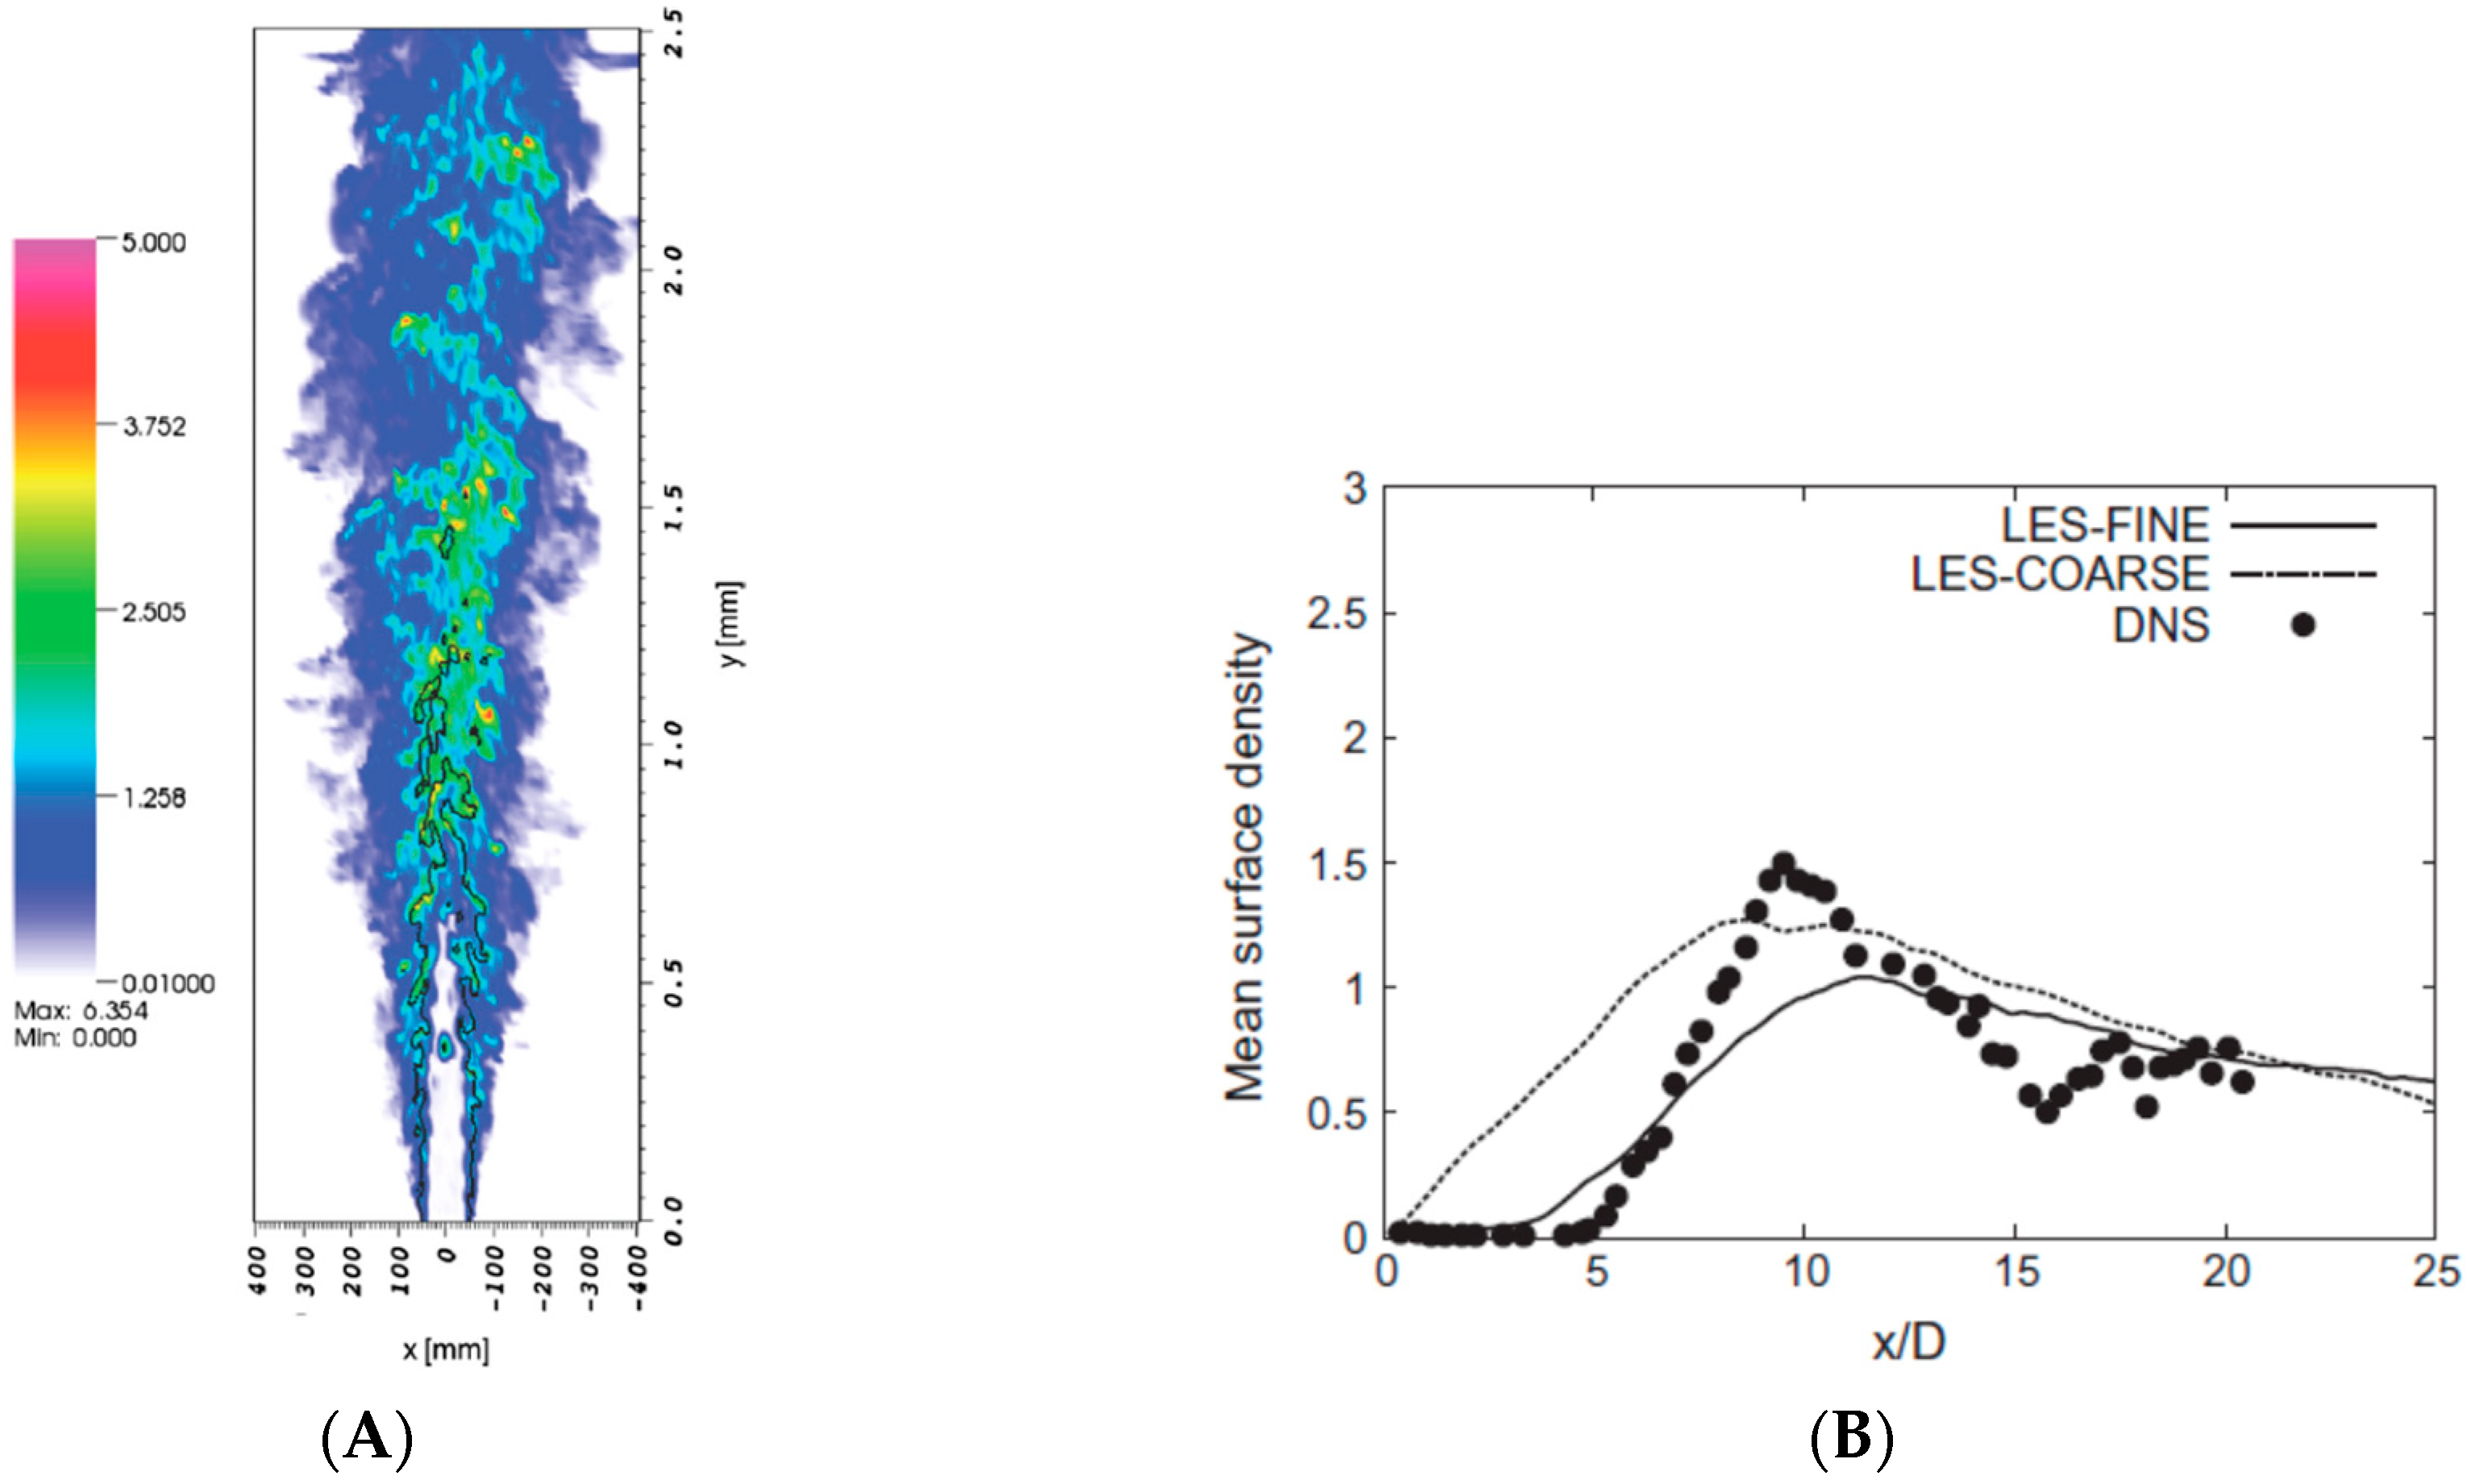
Figure 12 shows a result from [60] for a jet of injection velocity U i n j = 79 m/s from a nozzle of D n o z z l e = 0.1 mm. Figure 12A shows the surface density evolution. Its evolution is initiated from wrinkling, and after 5–10 diameters, breakup starts to occur. In the downstream, highly turbulent and intermittent dynamics can be seen. The surface density profiles along the injection axis well compared with the DNS result, as shown in Figure 12B.
The present model does not need a Lagrangian part and implementation into any Eulerian code is straightforward. The method is expected to be extended to evaporating and reacting flows by adding species and energy equations. Determination of the model constants may be an issue similar to the ELSA model.

4.4. Hybrid Eulerian–Lagrangian LES Approach

Saeedipour et al. [61] proposed a hybrid Eulerian–Eulerian and Eulerian–Lagrangian LES approach to include a mechanism of turbulent eddy interaction and subgrid droplet generation. To reduce the computational costs, DNS is not opted for primary atomization, and subgrid droplet generation must be modeled (cf. see Section 4.1). The liquid core surface is calculated using the VOF method on a relatively coarse grid in the LES framework. After modeled droplet generation due to primary atomization, the droplets are computed as Lagrangian particles and two-way coupling between the gas and liquid phases is considered similar to most conventional Eulerian–Lagrangian simulation methods.
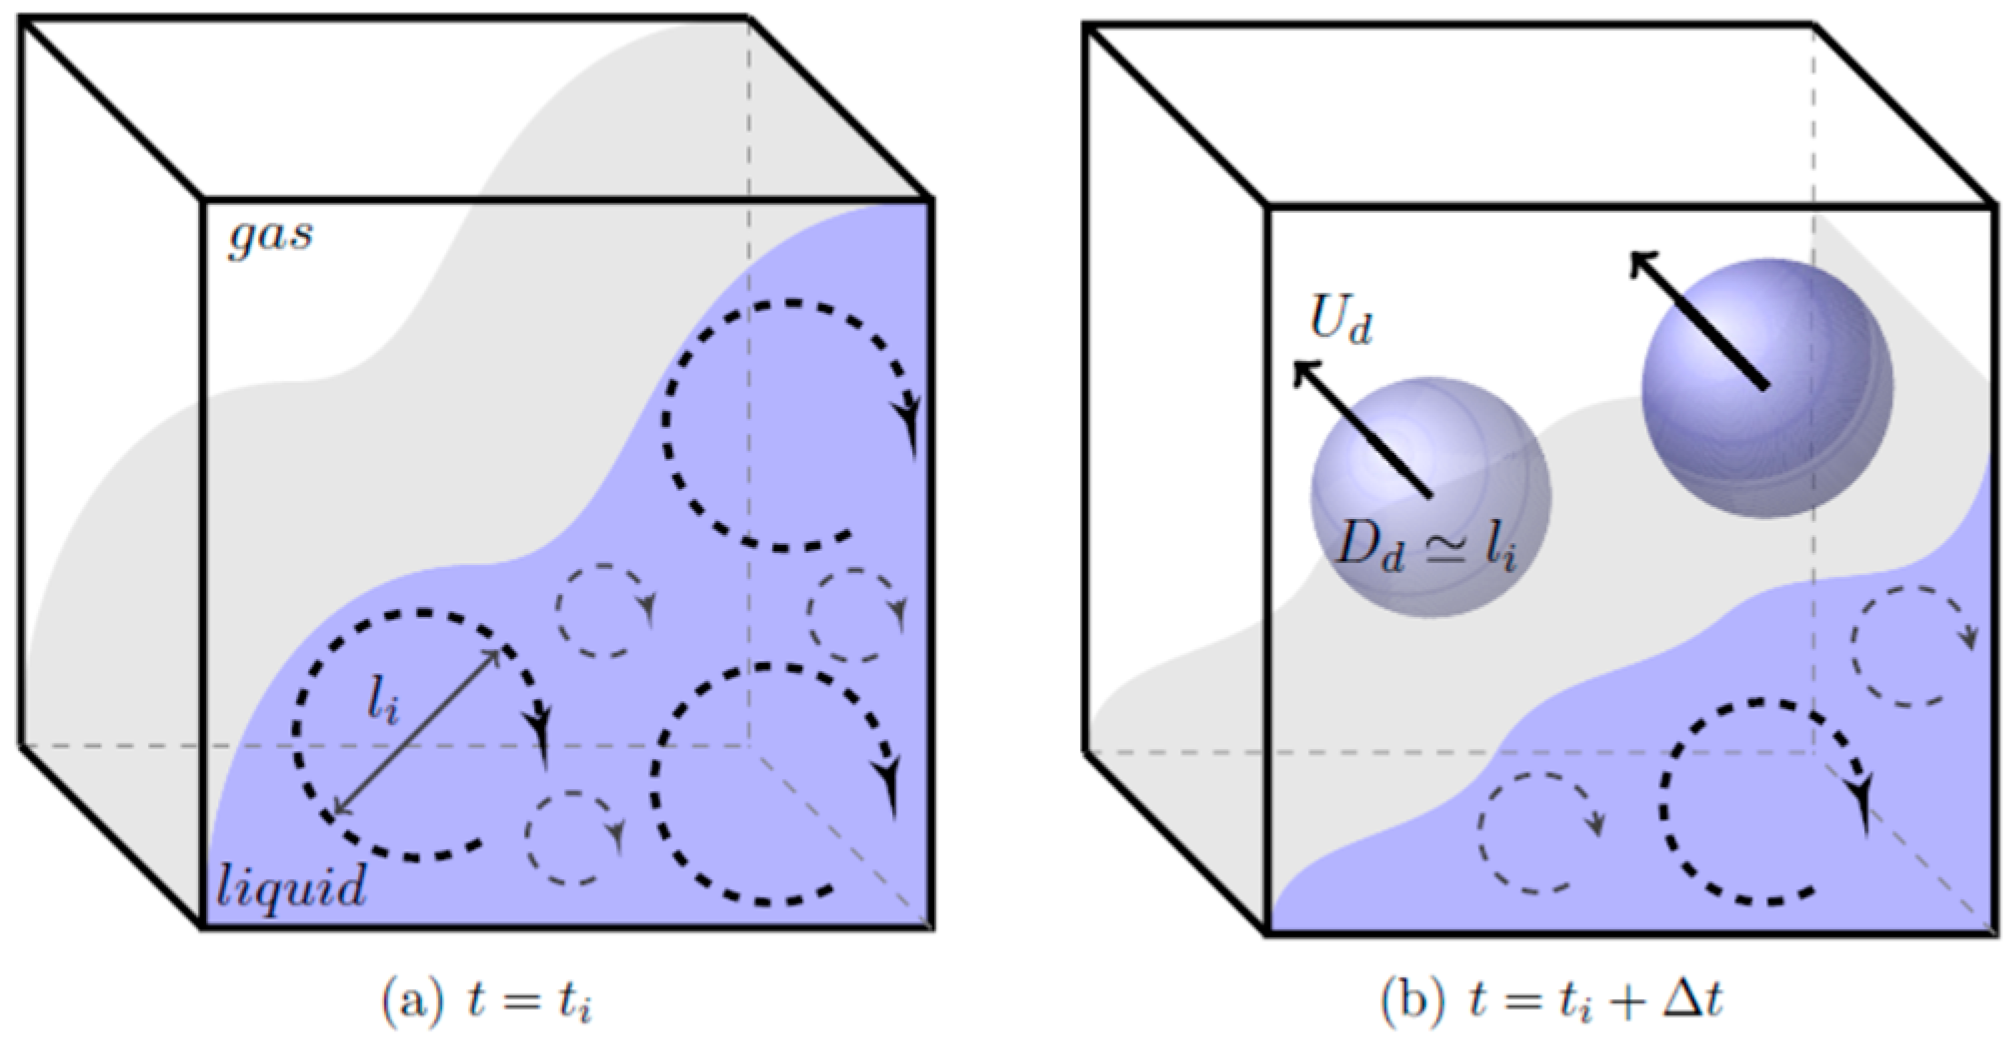
In the modeling of droplet ejection in primary atomization, it is assumed that droplets will be generated from the liquid surface when the sum of the liquid turbulent eddy energy and the aerodynamic pressure energy exceeds the surface energy. Figure 13 schematically shows the physical picture envisioned in this modeling [61]. If the eddy motion in the liquid phase is stronger than the resistant force of surface tension, droplets will be generated from the surface. Although this physical picture is overall much simplified, the idea here is important since it is considered that droplet generation is determined by the local We number consideration. Thus, in this model, the criterion for droplet generation is given as
( ρ L v L i 2 + C s a ρ G u ¯ G 2 ) l i 3 C s i σ l i 2
where v L i is the liquid velocity fluctuations perpendicular to the jet surface, u ¯ G is the mean gas velocity, l i is the turbulent length scale, and C s a and C s i are empirical constants. l i is assumed to be equal to the Taylor microscale, which is given as l i = λ ~ 10 ν k / ε . ν = μ / ρ is the kinematic viscosity. Although details are not described in [61], the Reynolds stress model (RSM) [62] is used for the evaluation of v L i . It is not clearly stated in [61] how the empirical parameters C s a and C s i are determined, but some tuning procedure is necessary using experimental or DNS data [61].
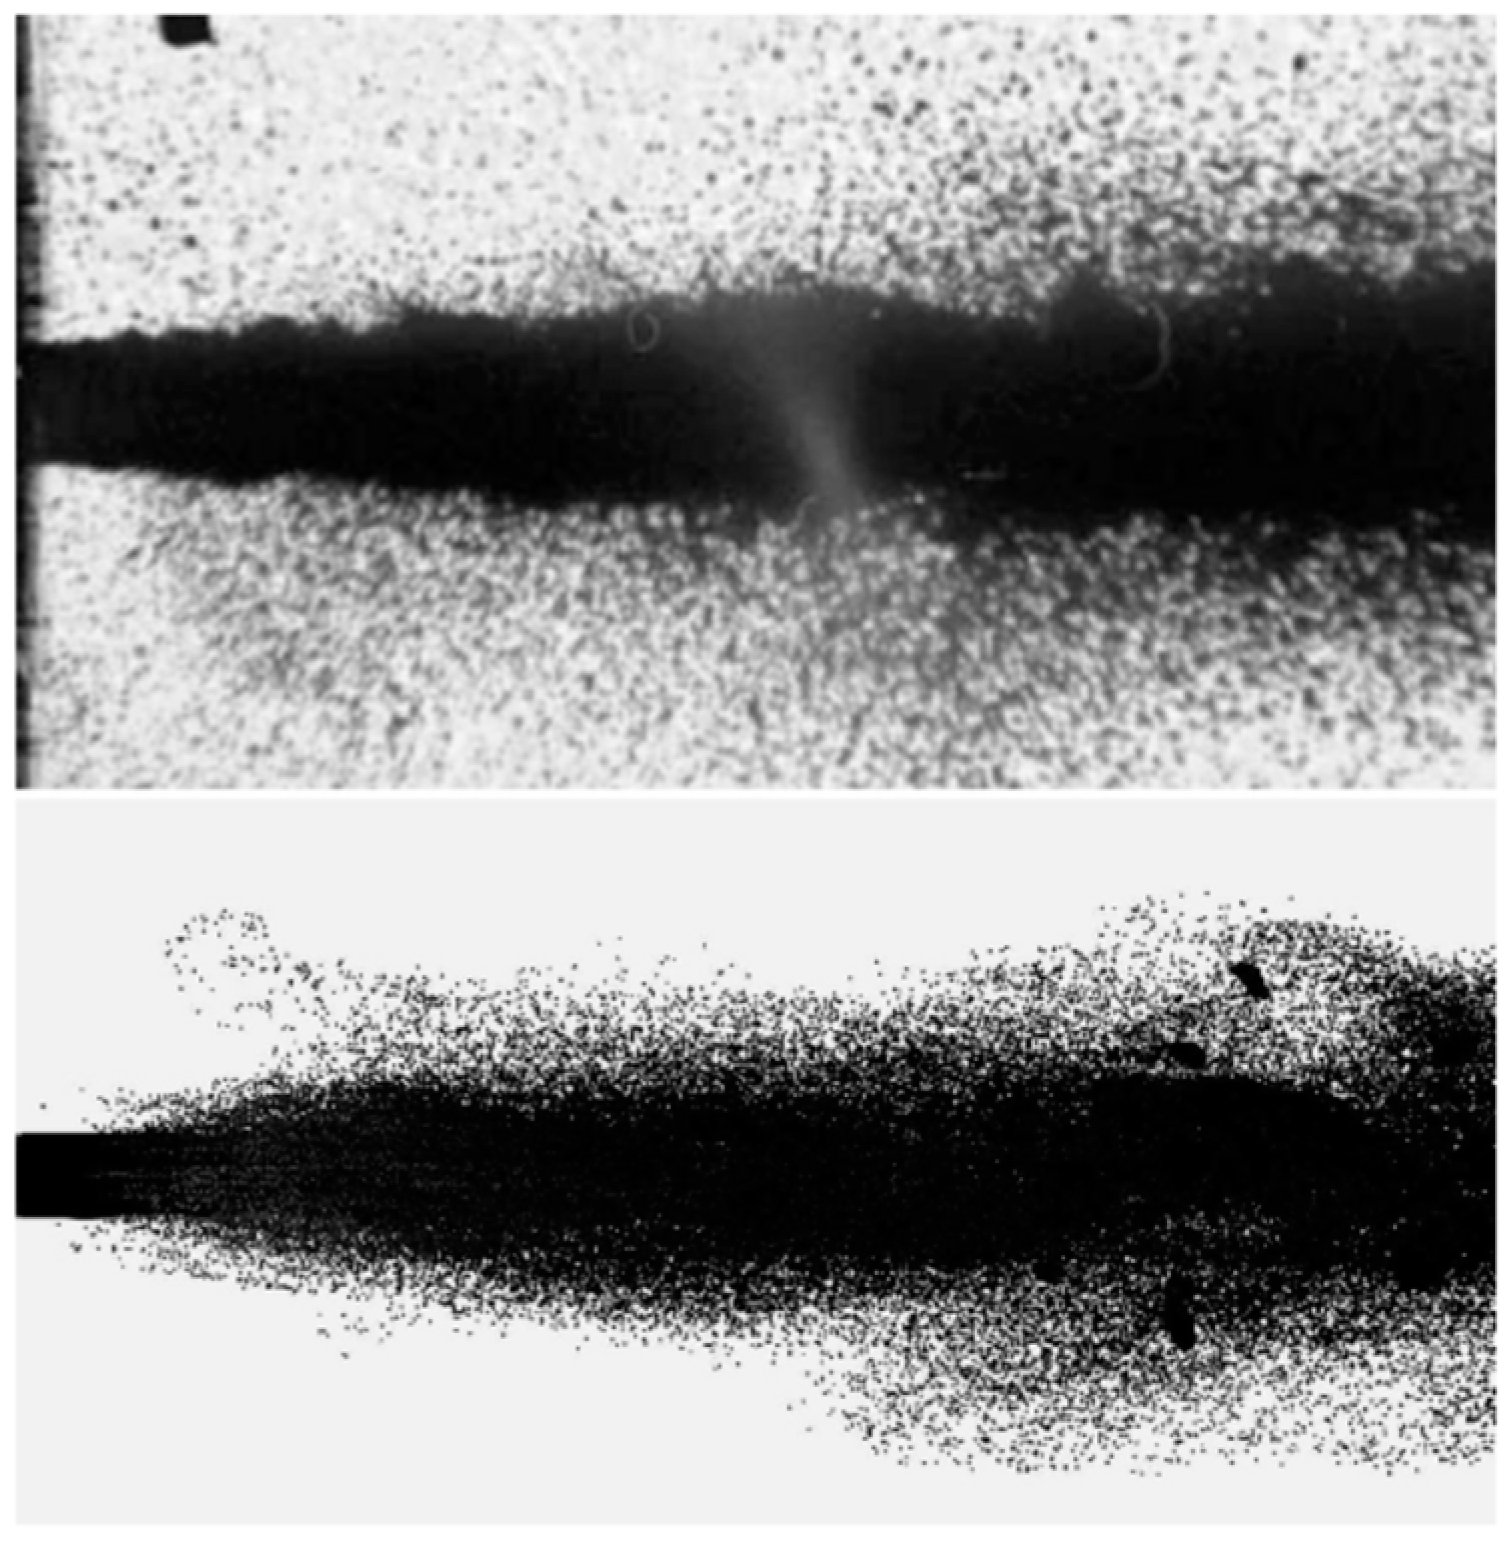
Figure 14 shows the comparison between the experimental shadowgraph image [63] and the simulation result. It can be seen that the overall spray evolution is well predicted. Reference [61] also presents several other cases under different flow conditions (not shown here). Since the droplet size is correlated with the Taylor microscale, the local variation of the eddy size leads to the difference in the droplet size. The droplet size distribution is also discussed in [61], which indicates that a similar distribution curve to that observed in the experiment can be reproduced.
Overall, such a physical picture is correct since the turbulent eddies in the liquid phase are strongly correlated with the surface deformation and breakup (in general, ligament formation may precede the droplet generation). However, the considered formulation seems to have been made too simple. Turbulent eddies exhibit a rotational motion and thus a resonant condition is needed to generate a free ligament from the surface [64,65]. Therefore, although details are not clear, the introduction of empirical parameters and thus parameter tuning is needed and the model itself is not self-closed. Therefore, it is still not clear whether this approach is a predictive tool for a wide range of general flow conditions. This also indicates the significance of considering the physical processes of atomization appropriately.

4.5. Hybrid Eulerian–Lagrangian LES with Self-Closed SGS Turbulent Atomization Model

A recently proposed subgrid-scale (SGS) turbulent atomization model for LES [64,65] has a potential to make a breakthrough in tackling the above bottleneck of spray simulation since the proposed model is self-closed. Namely, case-by-case phenomenological parameter tuning is not needed and spray simulation can become a real predictive tool. The model proposed by Umemura [64,65] is based on the findings on atomization mechanisms derived from theoretical analysis [66,67,68], DNS [23,46,47] and pinch-off experiments [69]. By these, each physical process of surface instability, ligament formation, and droplet formation are included in the model as subgrid phenomena.
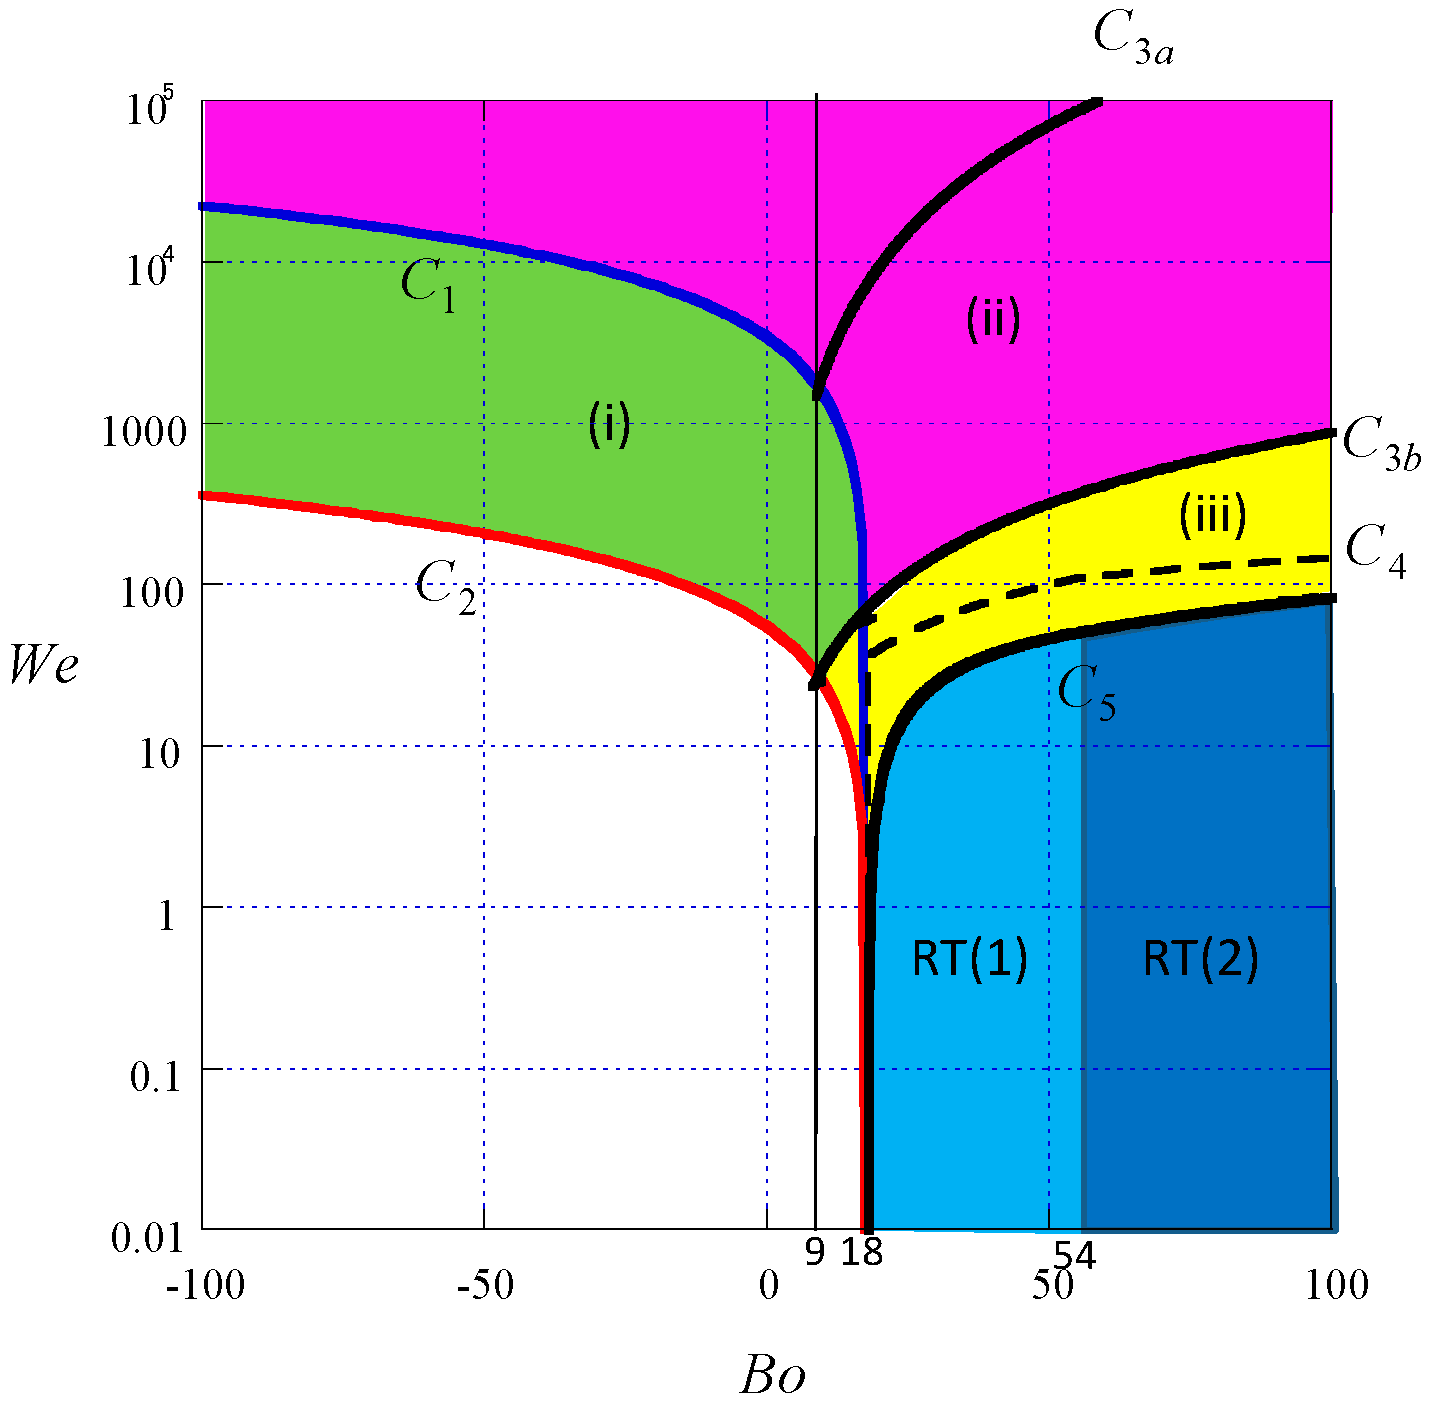
Two atomization modes have been identified, i.e., the turbulent resonant mode and the Rayleigh–Taylor mode. In the former mode, a free ligament is ejected driven by the resonance between the liquid turbulent eddies and the surface. The resonance is required, since the eddy motion itself is simply rotational and does not always eject a free ligament. In the latter mode, the local surface deceleration ejects a free ligament. The ligament finally breaks up into droplets. The mode identification is made by the following resonance condition, which is based on the linear theory of surface deformation assuming the cascaded LES turbulence,
[ ( λ * ) 2 B o 2 ] ( λ * ) = 1 2 [ ρ L + ρ G ρ L ( α h ) 2 W e 2 B ]
where is the reference turbulent eddy scale (~three times the grid spacing), λ * is the resonant eddy scale, α = 2 π / λ is the wavenumber, h is the distance of the LES-resolved surface from the eddy center, B is a constant (= 5.57) from isotropic turbulence. L and G denote liquid and gas, respectively. Two local parameters on the LES-resolved surface, the Weber number and the Bond number,
W e = ρ L ( 2 k L ) σ ,   B o = 1 ( 2 π ) 2 ( ρ L ρ G ) g 2 σ
determine the turbulent atomization mode. Here, k L is the liquid turbulent kinetic energy per unit density and g is the surface deceleration. The direct inclusion of local We and Bo under turbulent conditions is one of the key accomplishments of this model, which leads to a physically straightforward formulation. A detailed mode map can be derived by the above resonant condition with respect to We and Bo, which is presented as Figure 15 (taken from [65]).
For the turbulent resonant mode, λ * is obtained as a solution of Equation (12). Here, α h will take a stochastic value because subgrid turbulent eddy size and position may vary in the grid. Therefore, λ * is ensemble-averaged over the α h space to obtain the averaged wavelength < λ * > . For the Rayleigh–Taylor mode, the most unstable wavelength λ m is used. The droplet size is then determined by the Lang relation [70], which is also confirmed in a detailed numerical analysis in [68], as
D d = 0.34 λ *   or   D d = 0.34 λ m .
It should be noted that the above equations are comprised of only grid-scale (LES-resolved) information and the generated droplets are subgrid-scale. One important feature is that this modeling is closed by itself, namely, it does not contain case-by-case tuning parameters.
In order to obtain the LES-resolved local liquid surface information, the Eulerian–Eulerian interface capturing method is needed. Here, it is not necessary to fully resolve the liquid surface in a DNS sense, but a coarse grid in the context of LES to capture large scale surface deformation is sufficient. Since the generated droplets are smaller than the grid spacing, they are treated as Lagrangian point particles and follow the typical droplet equations as given in Equation (3). In this sense, a numerical code becomes a hybrid code of Eulerian–Eulerian and Eulerian–Lagrangian methods, similar to that used in Section 4.1 and Section 4.4. The difference from Section 4.1. is that the turbulent atomization model relaxes the grid requirement for the primary atomization region. It is also interesting to state that this modeling converges to DNS when the grid spacing is made smaller than the Kolmogorov scale, where the turbulent atomization model does not work and all the atomization can be directly captured in the fully-resolved Eulerian–Eulerian framework.
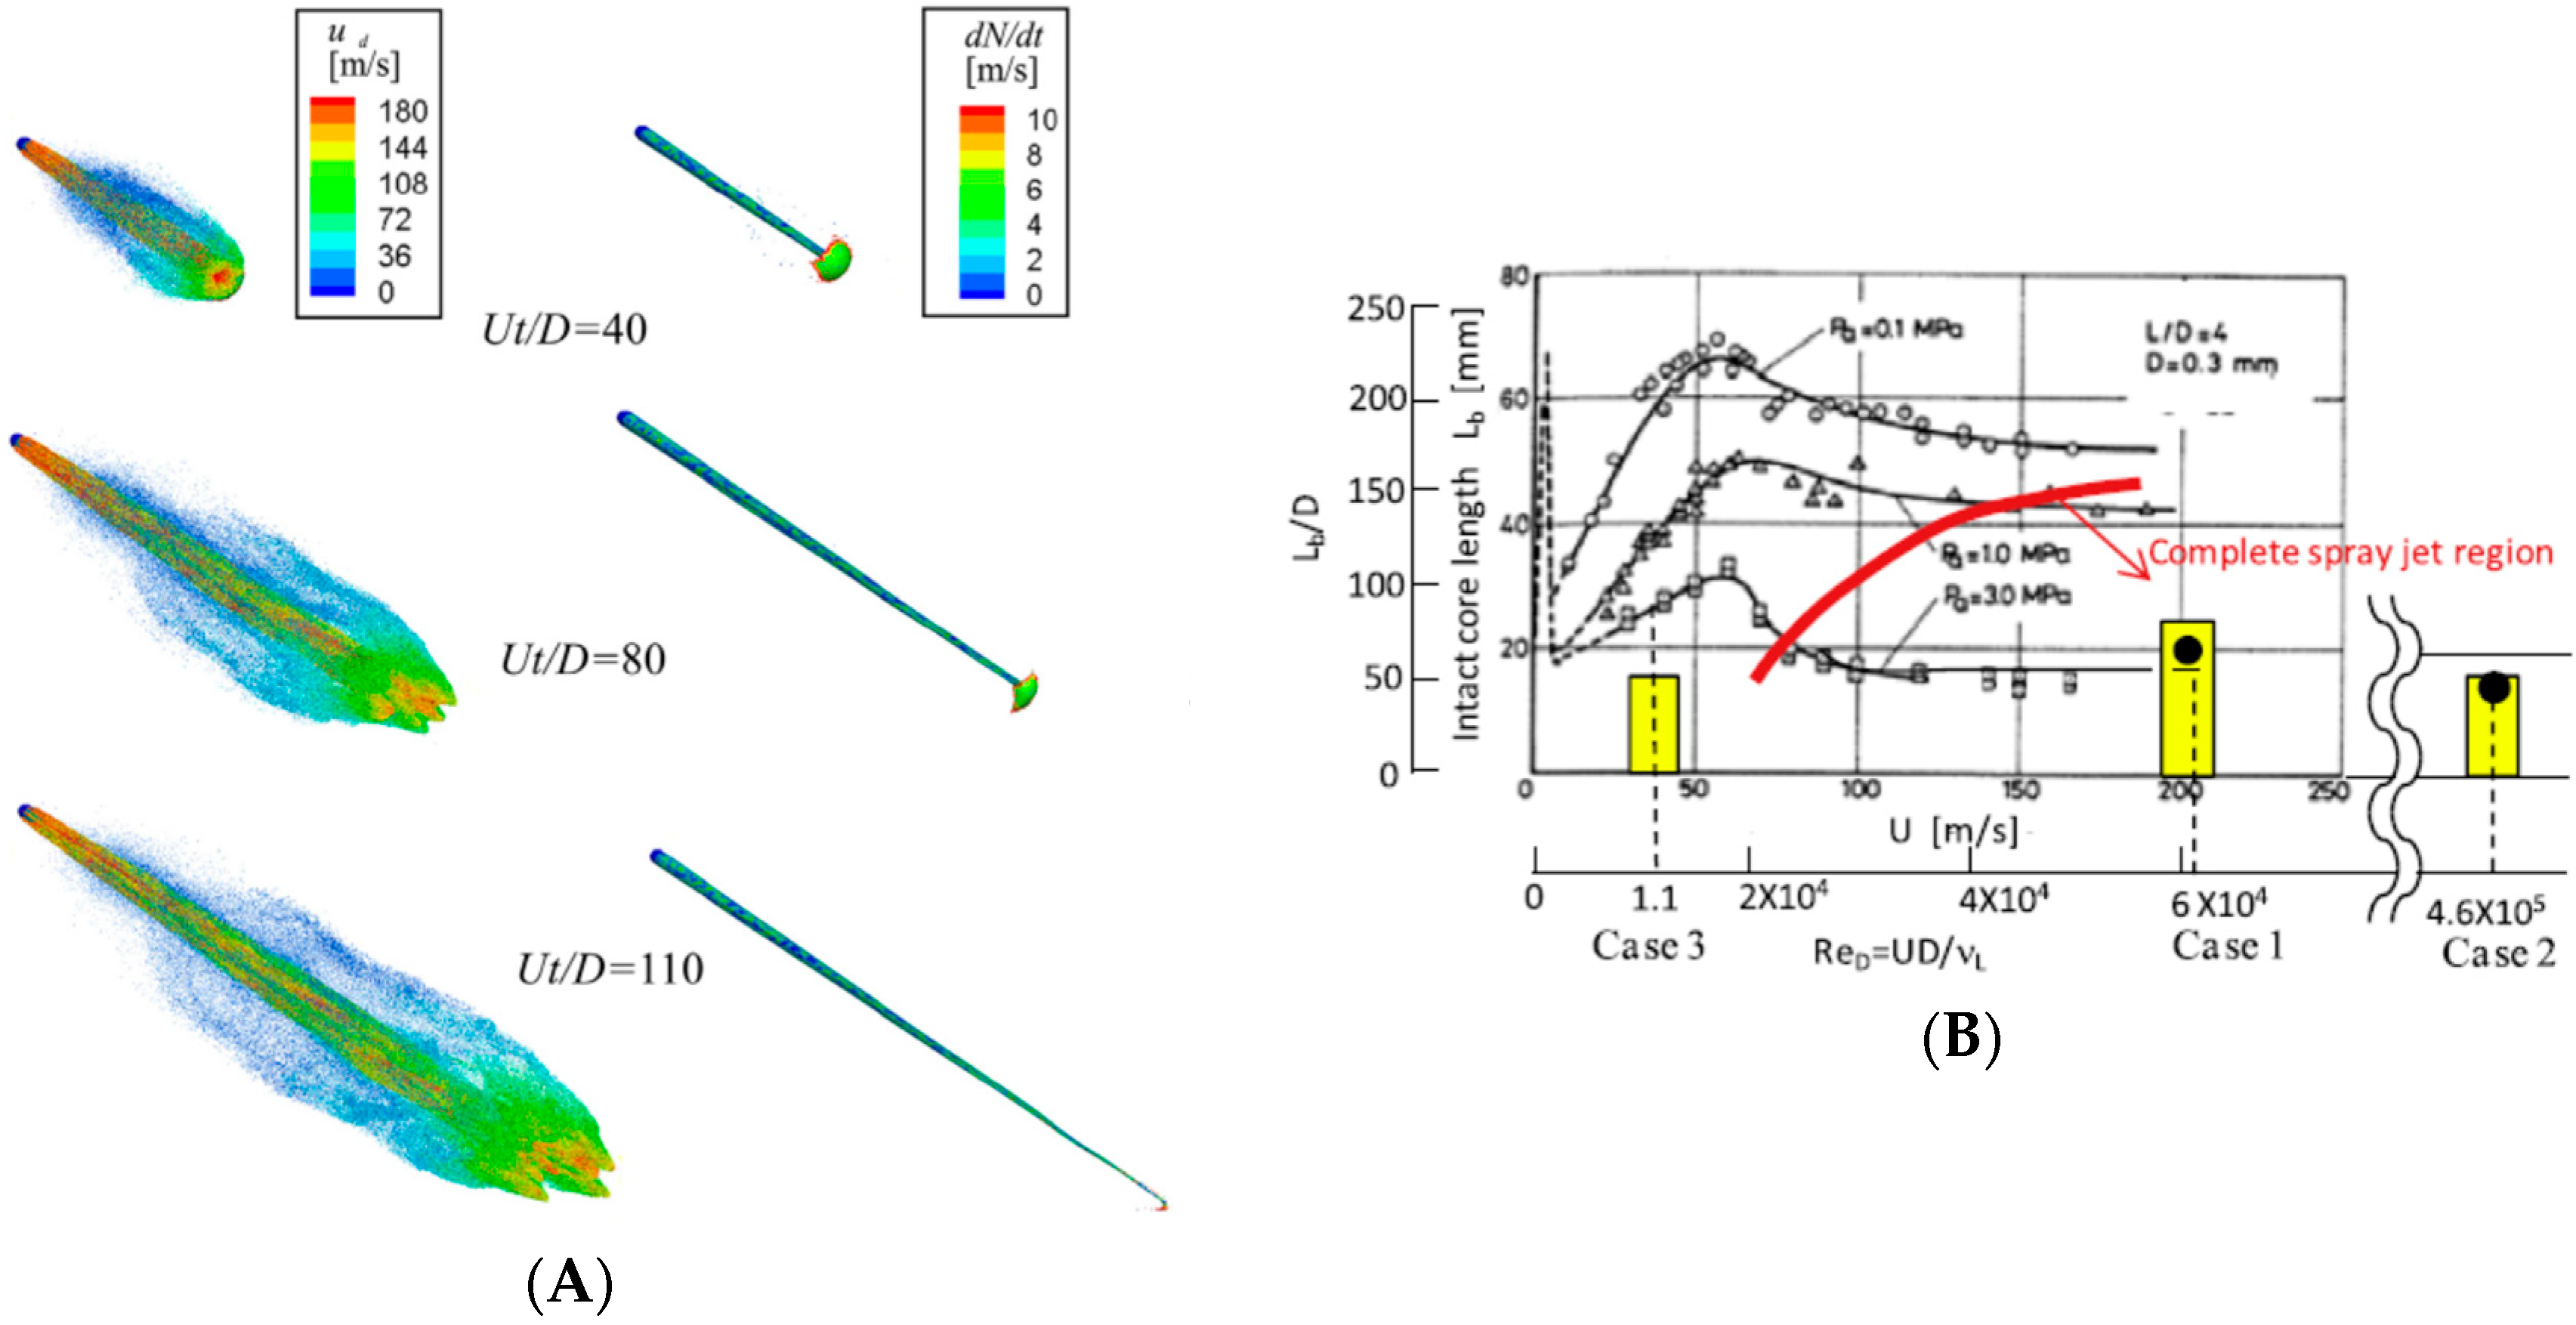
Reference [65] examines the predictive performance of this model. Figure 16 shows the result of a diesel jet spray using the present method (nozzle diameter D n o z z l e = 0.3 mm and injection velocity U i n j = 200 m/s). The spray shape is well predicted. The liquid core head initially deforms due to the impact against the ambient air, and the core gradually thins due to atomization. The atomized droplets form a dense cloud around the liquid core and gradually spread outward due to the induced gas motion. The predicted intact core length is in good agreement with the experimental data for several jet conditions [65], as shown in Figure 16B where the large filled dots (denoted as Case 1 and Case 2) are the simulation data to be compared with the experimental data represented by the small dots and lines. Note that no tuning has been made for this comparison.
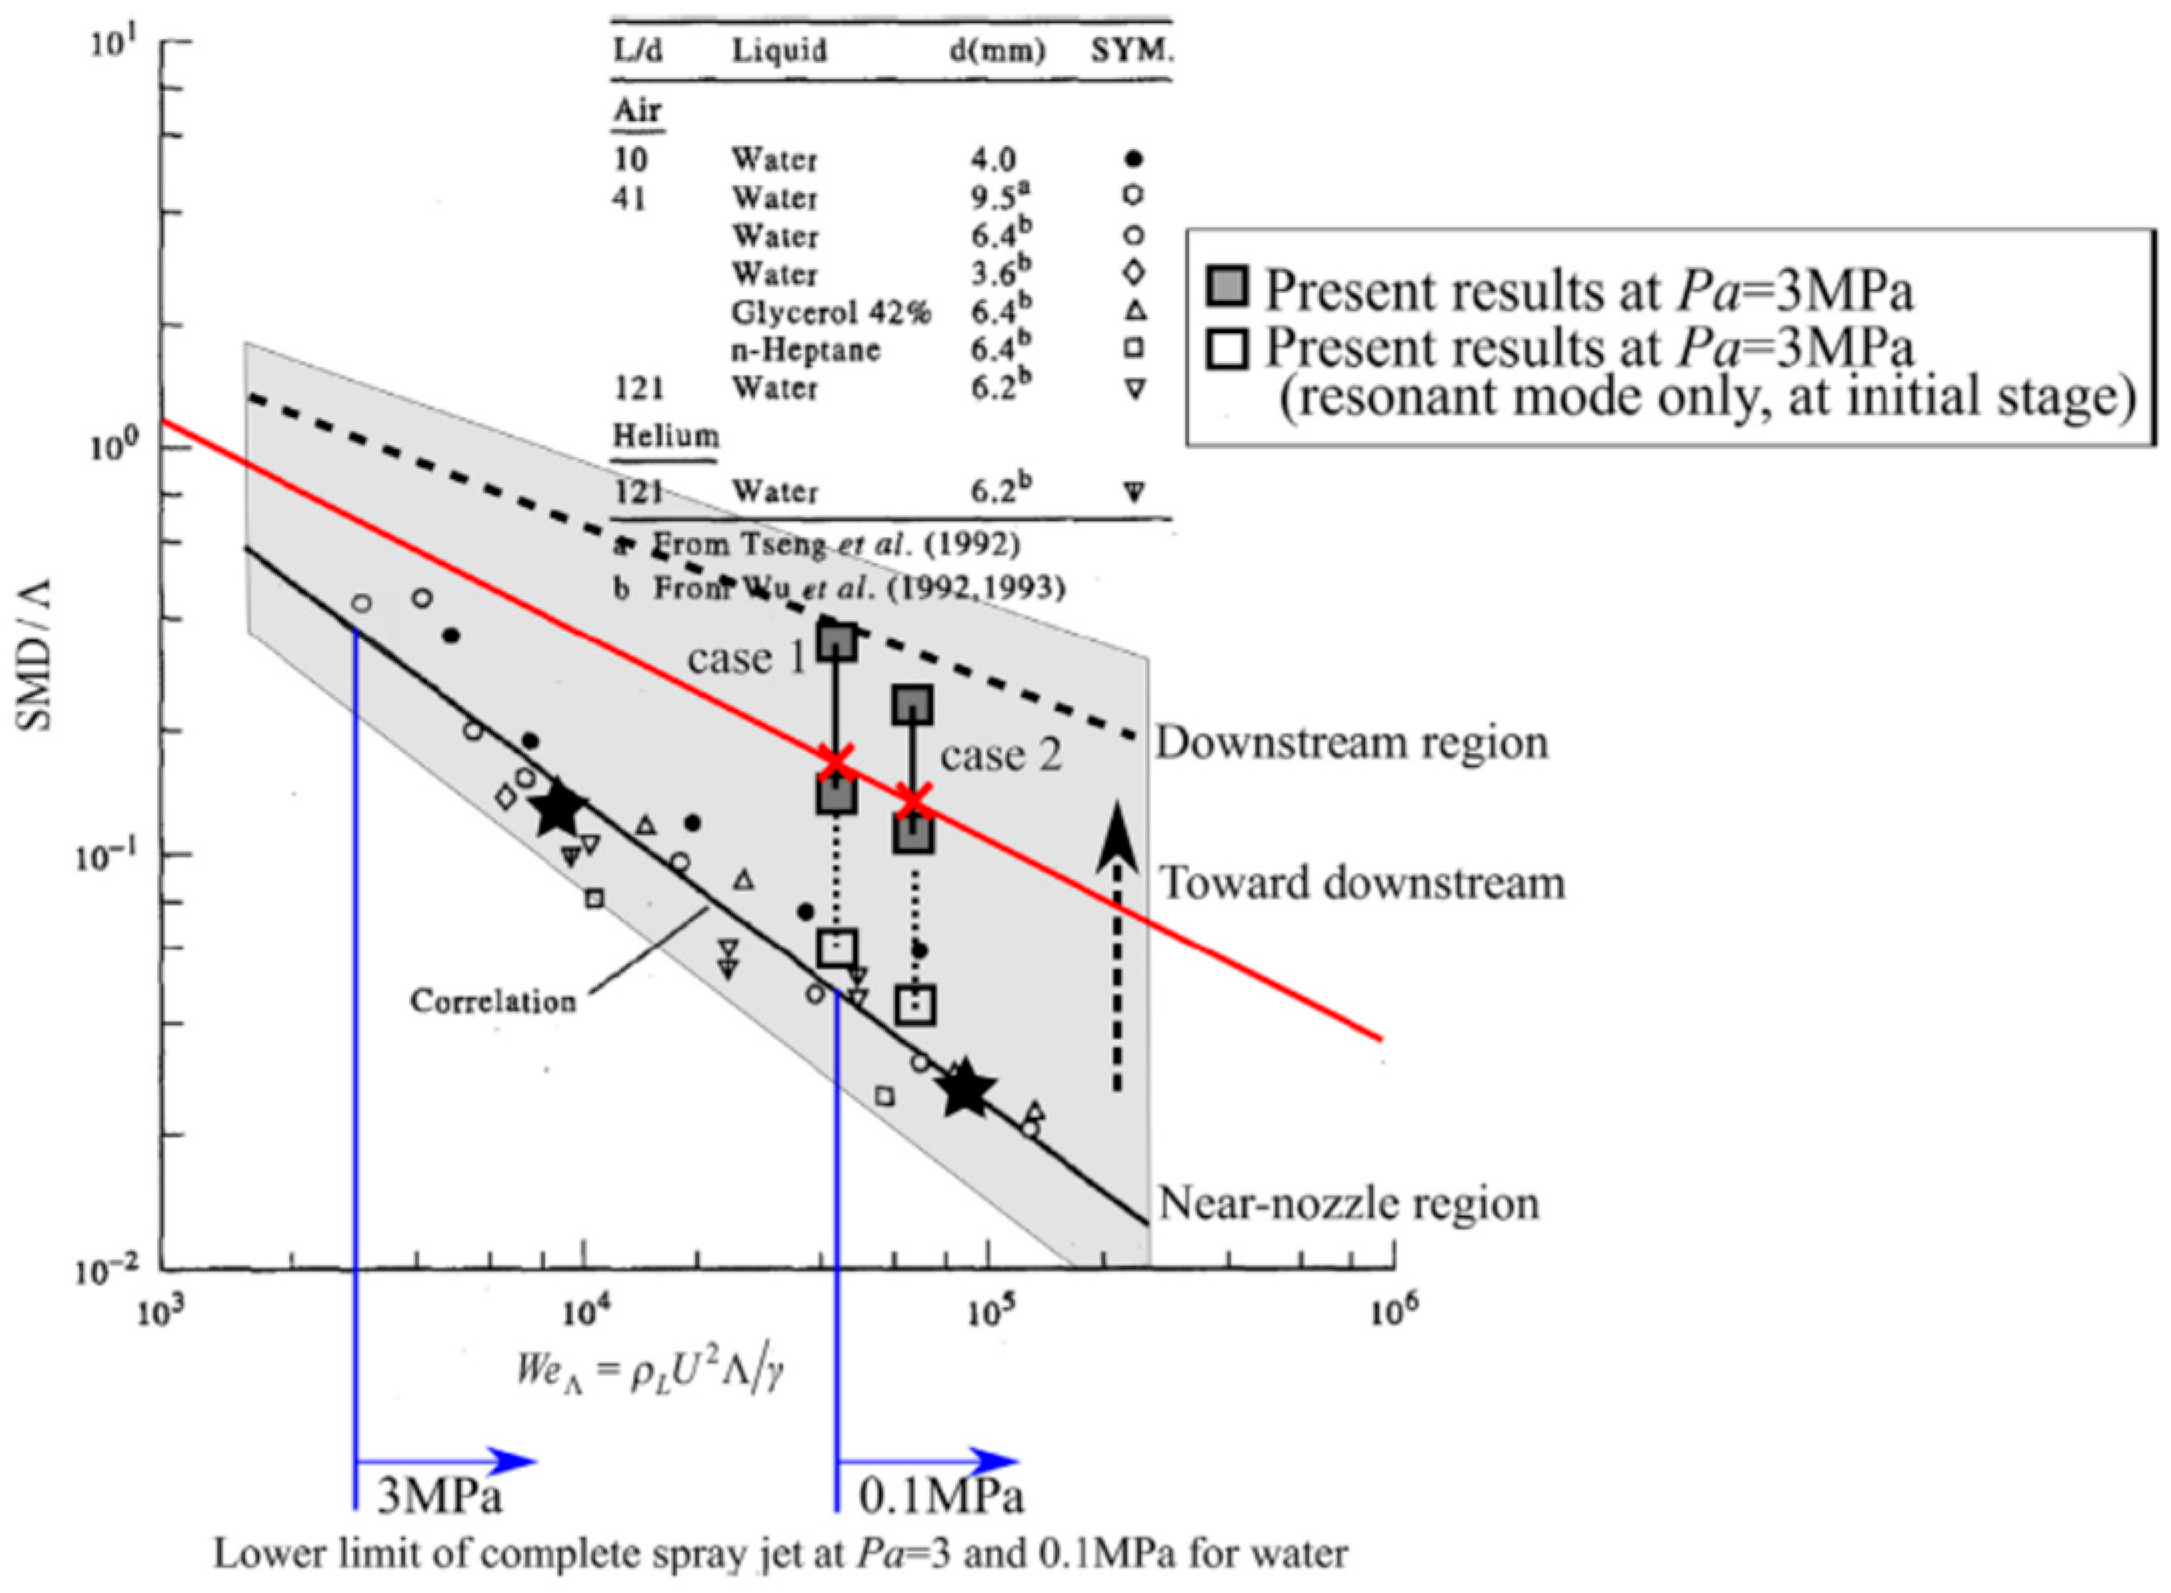
The SMD of droplets also well compares with experimental observations by Faeth et al. [71]. It has been reported that the SMD is correlated with the Weber number defined by the integral scale of the nozzle flow and the injection velocity (the horizontal axis of Figure 17). Assuming a fully turbulent nozzle flow, the proposed model (denoted as case 1 and case 2) reproduced the gradual trend of increasing SMD toward downstream (indicated by the hatched gray region).
These results indicate that the present modeling is effective in predicting a turbulent spray flow. Now this method can be extended to evaporative and reactive spray cases, as shown in Figure 18. For the evaporative spray, the formation of a dense droplet layer is observed over the liquid core in which the triple-layer structures, i.e., a cold inner layer, a hot outer layer, and an intermediate vaporizing layer, are confirmed similarly to the theoretical predictions [72]. For reacting cases, auto-ignited hot spots are observed after a certain period of ignition delay and the ignition kernels spreads due to convective motions.
By this method, it has been made clear that it is important to include the physical mechanisms precisely in the model and by doing so, detailed structures of spray formation in the near-field region can be predicted. It is also important to note that the inclusion of detailed physics can lead to a self-closed model without arbitrary model parameters. This has a potential to make a breakthrough in spray simulation in that the bottleneck problem of predictability, parameter tuning, may be finally solved.

5. Summary

Fossil fuels will be still necessary for transport engines and power generation plants in the foreseeable future. Spray combustion should be carefully designed for more efficient and less pollutive use in engines. In order to realize high-accuracy practical-scale spray simulation for that purpose, LES is becoming a common tool and accordingly an accurate primary atomization model is needed. This paper has briefly reviewed the recent efforts and advances in improving the accuracy of fuel spray simulation. It is known that the largest bottleneck has been the modeling of primary atomization in the near-nozzle region, and several methods have been proposed recently. The Eulerian-based methods use a model function to describe primary atomization, such as the surface density function. The increase or decrease of the surface density function is due to atomization and droplet coalescence, and the source term modeling is a key. Although the model accuracy has been improved, some proposed models still need experimental or DNS data to adjust the model parameters. The hybrid Eulerian–Eulerian and Eulerian–Lagrangian methods treat the generated droplets as Lagrangian point-particles as in the conventional approach and the key part is the modeling of droplet generation in primary atomization in the Eulerian–Eulerian part. The interaction between the liquid turbulence and the surface is considered to play a major role. Inclusion of precise primary atomization physics improves the model accuracy. The proposed model in 4.5. has succeeded in including the detailed physics of turbulence/surface resonance and RT instability, and the primary atomization model is self-closed and predicts the spray dynamics well. Currently, the model complexity and accuracy are different from each other, but the performance overall is being improved compared with the conventional models. It is expected that these efforts will be continued and lead to predicting better spray combustion performance and more efficient use of energy.

Funding

This research was supported by JSPS KAKENHI Grant Number JP17H03481. Part of this work was also financially supported by Mazda Motor Corporation.

Conflicts of Interest

The author declares no conflict of interest.

Nomenclature

Alphabetical symbols
a radius
B constant for turbulence (=5.57 in Section 4.5)
B o Bond number
C D drag coefficient
C s a , C s i empirical constants for model (in Section 4.4)
C Σ coefficient for modeling equilibrium interface area per unit volume (in Section 4.3)
D diameter
D s g s subgrid-scale diffusivity
D 32 Sauter mean diameter
f 1 drag force for droplet
g surface deceleration
h size of the integration kernel (in Section 4.3)
h distance of LES-resolved surface from the eddy center (in Section 4.5)
k kinetic energy
L characteristic length
l i turbulent length scale (in Section 4.4)
reference turbulent eddy scale (in Section 4.5)
m mass
n i component of surface normal vector
d N / d t liquid core surface regression due to atomization (in Section 4.5)
P s g s subgrid-scale joint probability density function
R e Reynolds number
S source term
S t Stokes number
t time
U characteristic velocity
u , u velocity
v i velocity fluctuation
W e Weber number
x position
Δ x grid spacing
Greek symbols
α wavenumber
α extensional eigenvalue of strain tensor (in Section 2.3)
β intermediate eigenvalue of strain tensor (in Section 2.3)
γ compressive eigenvalue of strain tensor (in Section 2.3)
ε dissipation rate
λ Taylor microscale (in Section 4.4)
λ wavelength (in Section 4.5)
μ viscosity
ν kinematic viscosity
ρ density
Σ interface area per unit volume
σ surface tension coefficient
τ relaxation time scale
τ d Stokes time scale
ϕ liquid volume fraction
Ω surface density function
Subscripts
ddroplet
destdestruction
eqequilibrium
Ggas
gengeneration
injinjection
Lliquid
ligligament
mmost unstable
nozzlenozzle
Superscripts
-averaged
^spatially filtered
~Favre-averaged
*resonant

References

  1. International Organization of Motor Vehicle Manufacturers. Available online: http://www.oica.net/category/sales-statistics/ (accessed on 2 September 2018).
  2. Sirignano, W.A. Fluid Dynamics and Transport of Droplets and Sprays, 2nd ed.; Cambridge University Press: Cambridge, UK, 2010. [Google Scholar]
  3. Faeth, G.M. Spray combustion phenomena. Proc. Combust. Inst. 1996, 26, 1593–1612. [Google Scholar] [CrossRef]
  4. Linne, M. Imaging in the optically dense regions of a spray: A review of developing techniques. Prog. Energy Combust. Sci. 2013, 39, 403–440. [Google Scholar] [CrossRef]
  5. Engine Combustion Network. Sandia National Laboratories. Available online: https://ecn.sandia.gov/ (accessed on 12 October 2018).
  6. Reitz, R.D.; Rutland, C.J. Development and testing of diesel engine CFD models. Prog. Energy Combust. Sci. 1995, 21, 173–196. [Google Scholar] [CrossRef]
  7. Gorokhovski, M.; Herrmann, M. Modeling primary atomization. Annu. Rev. Fluid Mech. 2008, 40, 343–366. [Google Scholar] [CrossRef]
  8. Jiang, X.; Siamas, G.A.; Jagus, K.; Karayiannis, T.G. Physical modelling and advanced simulations of gas-liquid two-phase jet flows in atomization and sprays. Prog. Energy Combust. Sci. 2010, 36, 131–167. [Google Scholar] [CrossRef]
  9. Subramaniam, S. Lagrangian-Eulerian methods for multiphase flows. Prog. Energy Combust. Sci. 2013, 39, 215–245. [Google Scholar] [CrossRef]
  10. Kolakaluri, R.; Subramaniam, S.; Panchagnula, M.V. Trends in multiphase modeling and simulation of sprays. Int. J. Spray Combust. Dyn. 2014, 6, 317–356. [Google Scholar] [CrossRef]
  11. Fujimoto, H.; Mazda Research and Development Divisions. Personal communication, 2017.
  12. Miller, R.S.; Bellan, J. Direct numerical simulation of a confined three-dimensional gas mixing layer with one evaporating hydrocarbon-droplet-laden stream. J. Fluid Mech. 1999, 384, 293–338. [Google Scholar] [CrossRef] [Green Version]
  13. Sankaran, V.; Menon, S. Vorticity-scalar alignments and small-scale structures in swirling spray combustion. Proc. Combust. Inst. 2002, 29, 577–584. [Google Scholar] [CrossRef]
  14. Umemura, A.; Shinjo, J. Toward a new paradigm of spray combustion research. In Proceedings of the 9th Asia-Pacific Conference on Combustion, Gyeongju, Korea, 19–22 May 2013. [Google Scholar]
  15. Sher, E.; Bar-Kohany, T.; Rashkovan, A. Flash-boiling atomization. Prog. Energy Combust. Sci. 2008, 34, 417–439. [Google Scholar] [CrossRef]
  16. Sovani, S.D.; Sojka, P.E.; Lefebvre, A.H. Effervescent atomization. Prog. Energy Combust. Sci. 2001, 27, 483–521. [Google Scholar] [CrossRef]
  17. Brennen, C.H. Cavitation and Bubble Dynamics; Oxford University Press: Oxford, UK, 1995. [Google Scholar]
  18. Sou, A.; Biçer, B.; Tomiyama, A. Numerical simulation of incipient cavitation flow in a nozzle of fuel injector. Comput. Fluids 2014, 103, 42–48. [Google Scholar] [CrossRef]
  19. Bellan, J. Supercritical (and subcritical) fluid behavior and modeling: Drops, streams, shear and mixing layers, jets and sprays. Prog. Energy Combust. Sci. 2000, 26, 329–366. [Google Scholar] [CrossRef]
  20. Lacaze, G.; Misdariis, A.; Ruiz, A.; Oefelein, J.C. Analysis of high-pressure Diesel fuel injection processes using LES with real-fluid thermodynamics and transport. Proc. Combust. Inst. 2015, 35, 1603–1611. [Google Scholar] [CrossRef] [Green Version]
  21. Jalaal, M.; Mehravaran, K. Fragmentation of falling liquid droplets in bag breakup mode. Int. J. Multiph. Flow 2012, 47, 115–132. [Google Scholar] [CrossRef]
  22. Sallam, K.A.; Dai, D.; Faeth, G.M. Liquid breakup at the surface of turbulent round liquid jets in still gases. Int. J. Multiph. Flow 2002, 28, 427–449. [Google Scholar] [CrossRef]
  23. Shinjo, J.; Umemura, A. Simulation of liquid jet primary breakup: Dynamics of ligament and droplet formation. Int. J. Multiph. Flow 2010, 36, 513–532. [Google Scholar] [CrossRef]
  24. Poinsot, T.; Veynante, D. Theoretical and Numerical Combustion, 2nd ed.; Edwards: Irvine, CA, USA, 2005. [Google Scholar]
  25. Burton, T.M.; Eaton, J. Fully resolved simulations of particle-turbulence interaction. J. Fluid Mech. 2005, 545, 67–111. [Google Scholar] [CrossRef]
  26. Shinjo, J.; Xia, J.; Umemura, A. Droplet/ligament modulation of local small-scale turbulence and scalar mixing in a dense fuel spray. Proc. Combust. Inst. 2015, 35, 1595–1602. [Google Scholar] [CrossRef]
  27. Patel, N.; Menon, S. Simulation of spray-turbulence-flame interactions in a lean direct injection combustor. Combust. Flame 2008, 153, 228–257. [Google Scholar] [CrossRef]
  28. Reitz, R.D. Modelling atomization processes in high-pressure vaporizing sprays. Atom. Spray Technol. 1987, 3, 309–337. [Google Scholar]
  29. Reitz, R.D.; Diwakar, R. Effect of Droplet Breakup on Fuel Sprays; Technical Paper for SAE International: New York, NY, USA, February 1986. [Google Scholar] [CrossRef]
  30. Reitz, R.D.; Diwakar, R. Structure of High-Pressure Fuel Sprays; Technical Paper for SAE International: New York, NY, USA, February 1987. [Google Scholar] [CrossRef]
  31. Reitz, R.D. A one-dimensional breakup model for low-speed jets. Atom. Sprays 2002, 12, 667–685. [Google Scholar] [CrossRef]
  32. Reitz, R.D. Modeling the primary breakup of high-speed jets. Atom. Sprays 2004, 14, 53–80. [Google Scholar] [CrossRef]
  33. O’Rourke, P.J.; Amsden, A.A. The TAB Model Method for Numerical Calculation of Spray Droplet Breakup; Technical Paper for SAE International: New York, NY, USA, November 1987. [Google Scholar] [CrossRef]
  34. Som, S.; Ramirez, A.I.; Aggarwal, S.K.; Kastengren, A.L.; El-Hannouny, E.M.; Longman, D.E.; Powell, C.F.; Senecal, P.K. Development and Validation of a Primary Breakup Model for Diesel Engine Applications; Technical Paper for SAE International: New York, NY, USA, April 2009. [Google Scholar] [CrossRef]
  35. Tanner, F.X. Liquid Jet Atomization and Droplet Breakup Modelling of Non-Evaporating Diesel Fuel Sprays; Technical Paper for SAE International: New York, NY, USA, February 1997. [Google Scholar] [CrossRef]
  36. Los Alamos National Laboratory. Available online: https://www.lanl.gov/projects/feynman-center/deploying-innovation/intellectual-property/software-tools/kiva/index.php (accessed on 12 October 2018).
  37. Tabata, M.; Arai, M.; Hiroyasu, H. Sauter mean diameter of a diesel spray injected into an environment of high pressure. Trans. Jpn. Soc. Mech. Eng. B 1989, 55, 3239–3245. [Google Scholar] [CrossRef]
  38. Lin, S.P. Breakup of Liquid Sheets and Jets; Cambridge University Press: Cambridge, UK, 2003. [Google Scholar]
  39. Kahila, H.; Wehrfritz, A.; Kaario, O.; Masouleh, M.G.; Maes, N.; Somers, B.; Vuorinen, V. Large-eddy simulation on the influence of injection pressure in reacting Spray A. Combust. Flame 2018, 191, 142–159. [Google Scholar] [CrossRef]
  40. Bekdemir, C.; Somers, L.M.T.; de Goey, L.P.H.; Tillou, J.; Angelberger, C. Predicting diesel combustion characteristics with Large-Eddy Simulations including tabulated chemical kinetics. Proc. Combust. Inst. 2013, 34, 3067–3074. [Google Scholar] [CrossRef]
  41. Pei, Y.; Soma, S.; Pomraning, E.; Senecal, P.K.; Skeen, S.A.; Manin, J.; Pickett, L.M. Large eddy simulation of a reacting spray flame with multiple realizations under compression ignition engine conditions. Combust. Flame 2015, 162, 4442–4455. [Google Scholar] [CrossRef] [Green Version]
  42. Irannejad, A.; Banaeizadeh, A.; Jaberi, F. Large eddy simulation of turbulent spray combustion. Combust. Flame 2015, 162, 431–450. [Google Scholar] [CrossRef] [Green Version]
  43. Wehrfritz, A.; Kaario, O.; Vuorinen, V.; Somers, B. Large Eddy Simulation of n-dodecane spray flames using Flamelet Generated Manifolds. Combust. Flame 2016, 167, 113–131. [Google Scholar] [CrossRef]
  44. Menard, T.; Tanguy, S.; Berlemont, A. Coupling level set/VOF/ghost fluid methods: Validation and application to 3D simulation of the primary break-up of a liquid jet. Int. J. Multiph. Flow 2007, 33, 510–524. [Google Scholar] [CrossRef]
  45. Lebas, R.; Menard, T.; Beau, P.A.; Berlemont, A.; Demoulin, F.X. Numerical simulation of primary break-up and atomization: DNS and modelling study. Int. J. Multiph. Flow 2009, 35, 247–260. [Google Scholar] [CrossRef]
  46. Shinjo, J.; Umemura, A. Detailed simulation of primary atomization mechanisms in diesel jet sprays (isolated identification of liquid jet tip effects). Proc. Combust. Inst. 2011, 33, 2089–2097. [Google Scholar] [CrossRef]
  47. Shinjo, J.; Umemura, A. Surface instability and primary atomization characteristics of straight liquid jet sprays. Int. J. Multiph. Flow 2011, 37, 1294–1304. [Google Scholar] [CrossRef]
  48. Herrmann, M. Detailed numerical simulations of the primary atomization of a turbulent liquid jet in crossflow. J. Eng. Gas Turbines Power 2010, 132, 061506. [Google Scholar] [CrossRef]
  49. Herrmann, M.; Arienti, M.; Soteriou, M. The impact of density ratio on the liquid core dynamics of a turbulent liquid jet injected into a crossflow. J. Eng. Gas Turbines Power 2011, 133, 061501. [Google Scholar] [CrossRef]
  50. Zandian, A.; Sirignano, W.A.; Hussain, F. Understanding liquid-jet atomization cascades via vortex dynamics. J. Fluid Mech. 2018, 843, 293–354. [Google Scholar] [CrossRef] [Green Version]
  51. Desjardins, O.; McCaslin, J.O.; Owkes, M.; Brady, P. Direct numerical and large-eddy simulation of primary atomization in complex geometries. Atom. Sprays 2013, 23, 1001–1048. [Google Scholar] [CrossRef]
  52. Fuster, D.; Bague, A.; Boeck, T.; Le Moyne, L.; Leboissetier, A.; Popinet, S.; Ray, P.; Scardovelli, R.; Zaleski, S. Simulation of primary atomization with an octree adaptive mesh refinement and VOF method. Int. J. Multiph. Flow 2009, 35, 550–565. [Google Scholar] [CrossRef]
  53. Fuster, D.; Matas, J.P.; Marty, S.; Popinet, S.; Hoepffner, J.; Cartellier, A.; Zaleski, S. Instability regimes in the primary breakup region of planar coflowing sheets. J. Fluid Mech. 2013, 736, 150–176. [Google Scholar] [CrossRef]
  54. Linne, M.; Paciaroni, M.; Hall, T.; Parker, T. Ballistic imaging of the near field in a diesel spray. Exp. Fluids 2006, 40, 836–846. [Google Scholar] [CrossRef]
  55. Linne, M.; Sedarsky, D.; Meyer, T.; Gord, J.; Carter, C. Ballistic imaging of the flow in the interior of the near-field of an effervescent spray. Exp. Fluids 2010, 49, 911–923. [Google Scholar] [CrossRef]
  56. Ling, Y.; Zaleski, S.; Scardovelli, R. Multiscale simulation of atomization with small droplets represented by a Lagrangian point-particle model. Int. J. Multiph. Flow 2015, 76, 122–143. [Google Scholar] [CrossRef]
  57. Herrmann, M. A parallel Eulerian interface tracking/Lagrangian point particle multi-scale coupling procedure. J. Comput. Phys. 2010, 229, 745–759. [Google Scholar] [CrossRef]
  58. Hoyas, S.; Gil, A.; Margot, X.; Khuong-Anh, D.; Ravet, F. Evaluation of the Eulerian-Lagrangian Spray Atomization (ELSA) model in spray simulations: 2D cases. Math. Comput. Model. 2013, 57, 1686–1693. [Google Scholar] [CrossRef]
  59. Vallet, A.; Burluka, A.A.; Borghi, R. Development of a Eulerian model for the “Atomization” of a liquid jet. Atom. Sprays 2001, 11, 619–642. [Google Scholar] [CrossRef]
  60. Navarro-Martinez, S. Large eddy simulation of spray atomization with a probability density function method. Int. J. Multiph. Flow 2014, 63, 11–22. [Google Scholar] [CrossRef]
  61. Saeedipour, M.; Pirker, S.; Bozorgi, S.; Schneiderbauer, S. An Eulerian–Lagrangian hybrid model for the coarse-grid simulation of turbulent liquid jet breakup. Int. J. Multiph. Flow 2016, 82, 17–26. [Google Scholar] [CrossRef]
  62. Launder, B.E.; Reece, G.J.; Rodi, W. Progress in the development of a Reynolds-stress turbulence closure. J. Fluid Mech. 1975, 68, 537–566. [Google Scholar] [CrossRef]
  63. Mayer, W.O.H.; Branam, R. Atomization characteristics on the surface of a round liquid jet. Exp. Fluids 2004, 36, 528–539. [Google Scholar] [CrossRef]
  64. Umemura, A. Turbulent atomization subgrid model for two-phase flow large eddy simulation (theoretical development). Combust. Flame 2016, 165, 154–176. [Google Scholar] [CrossRef]
  65. Umemura, A.; Shinjo, J. Detailed SGS atomization model and its implementation to two-phase flow LES. Combust. Flame 2018, 195, 232–252. [Google Scholar] [CrossRef]
  66. Umemura, A. Model for the initiation of atomization in a high-speed laminar liquid jet. J. Fluid Mech. 2014, 757, 665–700. [Google Scholar] [CrossRef]
  67. Umemura, A. Self-destabilising loop of a low-speed water jet emanating from an orifice in microgravity. J. Fluid Mech. 2016, 797, 146–180. [Google Scholar] [CrossRef]
  68. Li, Y.; Umemura, A. Threshold condition for spray formation by Faraday instability. J. Fluid Mech. 2014, 759, 73–103. [Google Scholar] [CrossRef]
  69. Umemura, A.; Osaka, J. Self-destabilizing loop observed in a jetting-to-dripping transition. J. Fluid Mech. 2014, 752, 184–218. [Google Scholar] [CrossRef]
  70. Lang, R.J. Ultrasonic atomization of liquids. J. Acoust. Soc. Am. 1962, 34, 6–9. [Google Scholar] [CrossRef]
  71. Faeth, G.M.; Hsiang, L.-P.; Wu, P.-K. Structure and breakup properties of sprays. Int. J. Multiph. Flow 1995, 21, 99–127. [Google Scholar] [CrossRef]
  72. Umemura, A. Interactive droplet vaporization and combustion: Approach from asymptotics. Prog. Energy Combust. Sci. 1994, 20, 325–372. [Google Scholar] [CrossRef]
Figure 1. Schematic images of conventional (A) and ideal (B) spray combustion simulation approaches [14]. The region marked by the solid square is the actual computational domain. In the left figure, “given” does not necessarily mean that the given model is physically accurate.
Energies 11 02971 g001
Figure 2. Schematic of a turbulent liquid fuel spray.
Energies 11 02971 g002
Figure 3. Instantaneous contour plot of the droplet number density on the spanwise plane x3 = 0 at non-dimensional time t = 50 with mass loading ratio 0.225 [12]. The mainstream gas flows in the x1 direction. The droplet distribution is strongly affected by the gas-phase vortex roll-up. Reproduced with permission from Cambridge University Press.
Energies 11 02971 g003
Figure 4. Swirled spray flows in a gas turbine combustor [13]. (A) Spray droplets and vortical structures for (a) low swirl number (0.75) and (b) high swirl number (1.5). The swirl number is the ratio of axial flux of angular momentum to the axial momentum; (B) Modulation of turbulence due to droplets. The eigenvalues are α for extensional, β for intermediate, and γ for compressive, respectively. The horizontal axis represents the alignment angle between the vorticity and the strain rate eigenvectors. Reproduced with permission from Elsevier.
Energies 11 02971 g004
Figure 5. Schematic diagrams of classical models that treat the dense spray region. (A) Concept of WAVE model [28]; (B) Concept of blob model for numerical implementation [30].
Energies 11 02971 g005
Figure 6. Examples of direct numerical simulation (DNS) in a straight jet configuration. (A) Turbulent jet spray by Menard et al. [44] with nozzle diameter D n o z z l e = 0.1 mm and injection velocity U i n j = 100 m/s; (B) Head deformation and atomization for a jet spray by Shinjo and Umemura [23] with nozzle diameter D n o z z l e = 0.1 mm and injection velocity U i n j = 100 m/s. Reproduced with permission from Elsevier; (C) Temporal development of turbulent spray [51]. Re and We are based on liquid values.
Energies 11 02971 g006
Figure 7. DNS result of a jet spray in crossflow [48]. The flow conditions are the jet velocity of 97.84 m/s, the crossflow velocity of 120.4 m/s and the nozzle diameter is 1.3 mm. The surface instability development and subsequent atomization can be seen. Reproduced with permission from ASME.
Energies 11 02971 g007
Figure 8. Experimental image of a spray [4,54,55]. (A) Fine structures captured in diesel injection [4,54]; (B) a laser shadowgram and a ballistic image (enlarged) [4,55]. Reproduced with permission from Springer and Elsevier.
Energies 11 02971 g008
Figure 9. Result of the atomizing planar liquid jet with the hybrid DNS and Lagrangian method [56]. (A) Proposed numerical procedure (a) to convert a resolved droplet (RD) to a Lagrangian point particle (LPP) and (b) vice versa; (B) Example of a planar jet. The gray and orange colors indicate the resolved interface and the point-particle droplets, respectively. The red arrow indicates the position of a wave front where vigorous atomization (including RDs and LPPs) occurs as it develops. Reproduced with permission from Elsevier.
Energies 11 02971 g009
Figure 10. A jet spray result by hybrid approach [57]. The nozzle diameter is D n o z z l e = 0.1 mm and the injection velocity is U i n j = 100 m/s. The top image is a combination of resolved liquid core and Lagrangian droplets, the central image shows the core and the bottom image shows the Lagrangian droplets. Reproduced with permission from Elsevier.
Energies 11 02971 g010
Figure 11. Result of spray simulation using ELSA model in the dense spray region [45]. (A) Surface density field; (B) Surface density profiles along the injection axis. Reproduced with permission from Elsevier.
Energies 11 02971 g011
Figure 12. Result of spray simulation using the probability density function (PDF) method [60]. (A) Surface density field; (B) Surface density profiles along the injection axis. Reproduced with permission from Elsevier.
Energies 11 02971 g012
Figure 13. Physical picture of droplet ejection in the modeling [61]. The eddies in the liquid phase play an important role in droplet generation. Reproduced with permission from Elsevier.
Energies 11 02971 g013
Figure 14. Comparison of experimental shadowgraph [61,63] and numerical simulation result [61]. Reproduced with permission from Elsevier.
Energies 11 02971 g014
Figure 15. Turbulent atomization mode map [65]. The blue area (RT(1) and RT(2)) is the regime of the Rayleigh–Taylor mode. The other colored areas ((i), (ii) and (iii)) are for the resonant mode. Details can be found in [65].
Energies 11 02971 g015
Figure 16. Result of spray simulation using the subgrid-scale (SGS) turbulent atomization model [65]. (A) Evolution of the entire spray and the liquid core, where the droplet color indicates the axial velocity and the core color indicates the surface regression velocity due to atomization d N / d t ; (B) Comparison of the intact core length with experimental data [37]. The large filled dots (Case 1 and Case 2) are the simulation data to be compared with the experimental data represented by the small dots and lines.
Energies 11 02971 g016
Figure 17. Comparison of SMD with data from Faeth et al. [65,71]. The gradual trend of increased SMD toward downstream (indicated by the hatched gray region) is predicted in the simulation (case 1 and case 2).
Energies 11 02971 g017
Figure 18. Extension to evaporating and reacting cases. (A) Temperature of an evaporating spray. The liquid fuel temperature is 300 K and the ambient air is 900 K. A low-temperature layer (dense droplet layer) surrounds the liquid core; (B) Temperature of a reacting (auto-igniting) case in the 1000 K air with one-step global reaction mechanism. Ignition initiates from the outer layer edge where the fuel vapor mixes with the outer air. The solid line indicates the stoichiometric condition.
Energies 11 02971 g018