Article

Framework for Microgrid Design Using Social, Economic, and Technical Analysis

by
Athila Quaresma Santos
*,
Zheng Ma
,
Casper Gellert Olsen
and
Bo Nørregaard Jørgensen
Center for Energy Informatics, Southern Denmark University, Campusvej 55, 5230 Odense M, Denmark
*
Author to whom correspondence should be addressed.
Energies 2018, 11(10), 2832; https://doi.org/10.3390/en11102832
Submission received: 2 August 2018 / Revised: 1 September 2018 / Accepted: 17 October 2018 / Published: 20 October 2018
(This article belongs to the Special Issue Microgrids-2018)

Abstract

:
Microgrids are emerging as feasible solutions to handle local energy systems. Several factors influence the development of such systems, such as technical, economic, social, legal, and regulatory issues. These important aspects need to be addressed to design appropriate microscale projects that take into consideration adequate technology without underestimating local characteristics. This article aims to propose a framework design for microgrid optimization using technical, social, and economic analysis. The framework is presented through a small island case study that shows each step of the method. As a contribution, this work provides a multi-objective optimization framework with different criteria consideration, such as the inhabitants’ cost of living and inter-cultural aspects, instead of traditional technical and economic analysis. The results show the applicability of the proposed framework showing better alternatives when compared with actual or future improvements in the study case scenario.

1. Introduction

Today, the high penetration of hybrid renewable energy sources (HRES) and the reduction or complete CO2-free systems is being widely accepted and included in energy policies all over the world [1]. Microgrids have become a promising solution to handle local energy supply and increase the reliability of electrical power systems. Among the reasons to adopt microgrids as feasible solutions, there is their relatively low environmental impact, ability to meet the diverse needs of end users for higher-quality power supplies, the restructuring of the electric power industry, and restrictions on the extension of power transmission and distribution facilities [2].
Electrical power systems can minimize increasing fuel costs by introducing renewable energy (RE) generation into their energy system. In the past, RE technologies were costly affairs due to low efficiencies and high prices. However, the cost of such technologies has decreased over recent decades along with an increased efficiency e.g., on photo voltaic (PV) panels and wind turbines. The cost reduction of RE technologies is caused by growing global investments [3]. As a result, challenges such as the high intermittence of renewables and the design of such systems should be addressed.
Several policies, models, and frameworks have been reported in the literature. For example in [4] there is an extensive literature review in the context of rural energy microgrid planning in different economic scenarios. The authors show how social and political factors considerably affect the overall performance and feasibility of the final solution. In [5] a jointly optimization energy portfolio of conventional power source, solar, wind, battery, and demand response was developed.
A framework for the design of sustainable rural microgrids in developing nations based on decision analysis and optimization models was developed by [6]. The authors take various criteria (technical, social, economic, and environmental) for the selection of the best suitable energy portfolio.
The Distributed Energy Resources Costumer Adoption Model (DER-CAM) technique was proposed by [7] to optimize technical and economic aspects of the planning and design of hybrid renewable energy systems for microgrid applications.
Furthermore, mathematical and optimization algorithms are used to identify optimal energy configuration to assist in planning and designing renewable energy-based microgrids and to represent a reliable model of real systems. Therefore, an optimization tool capable of inspecting different multi-objective scenarios and analyzing different dynamic energy requirements is needed to determine the optimal architecture, structure, size, and control strategy of the hybrid microgrid. The final optimal microgrid solutions should consider several factors, such as economic, political, social, environmental, and technical issues.
There are three issues in the microgrid design and analysis [8,9,10,11,12]:
  • Analysis concerns mostly technical and operational issues. Little focus has been done with socio-economic analysis.
  • No consideration of the inhabitants’ cost of living
  • Limited consideration of inter-cultural aspects
Therefore, a structured approach to assist the design of microgrids is necessary. This study aims to develop a framework design for microgrid optimization, considering multi-objective issues. The optimal system configuration addresses several requirements, such as economic feasibility, demand estimation, energy technology selection, renewability assessment, storage capability, energy efficiency, and demand management, etc. The optimal solution includes the consideration of the inhabitants’ cost of living and inter-cultural aspects such as user behavior, island configuration, and tourist concentration, etc. The scope of the project is limited to consider small islands with no connection to the main grid and with a peak demand less than 10 MW.
The proposed framework was demonstrated and evaluated through a case study of a small island application with geographic resources and local concerns. The test system provides real data and project description of the current microgrid. The system was modeled in a simulation tool. The results were compared with the optimization framework to demonstrate the applicability of the proposed framework.

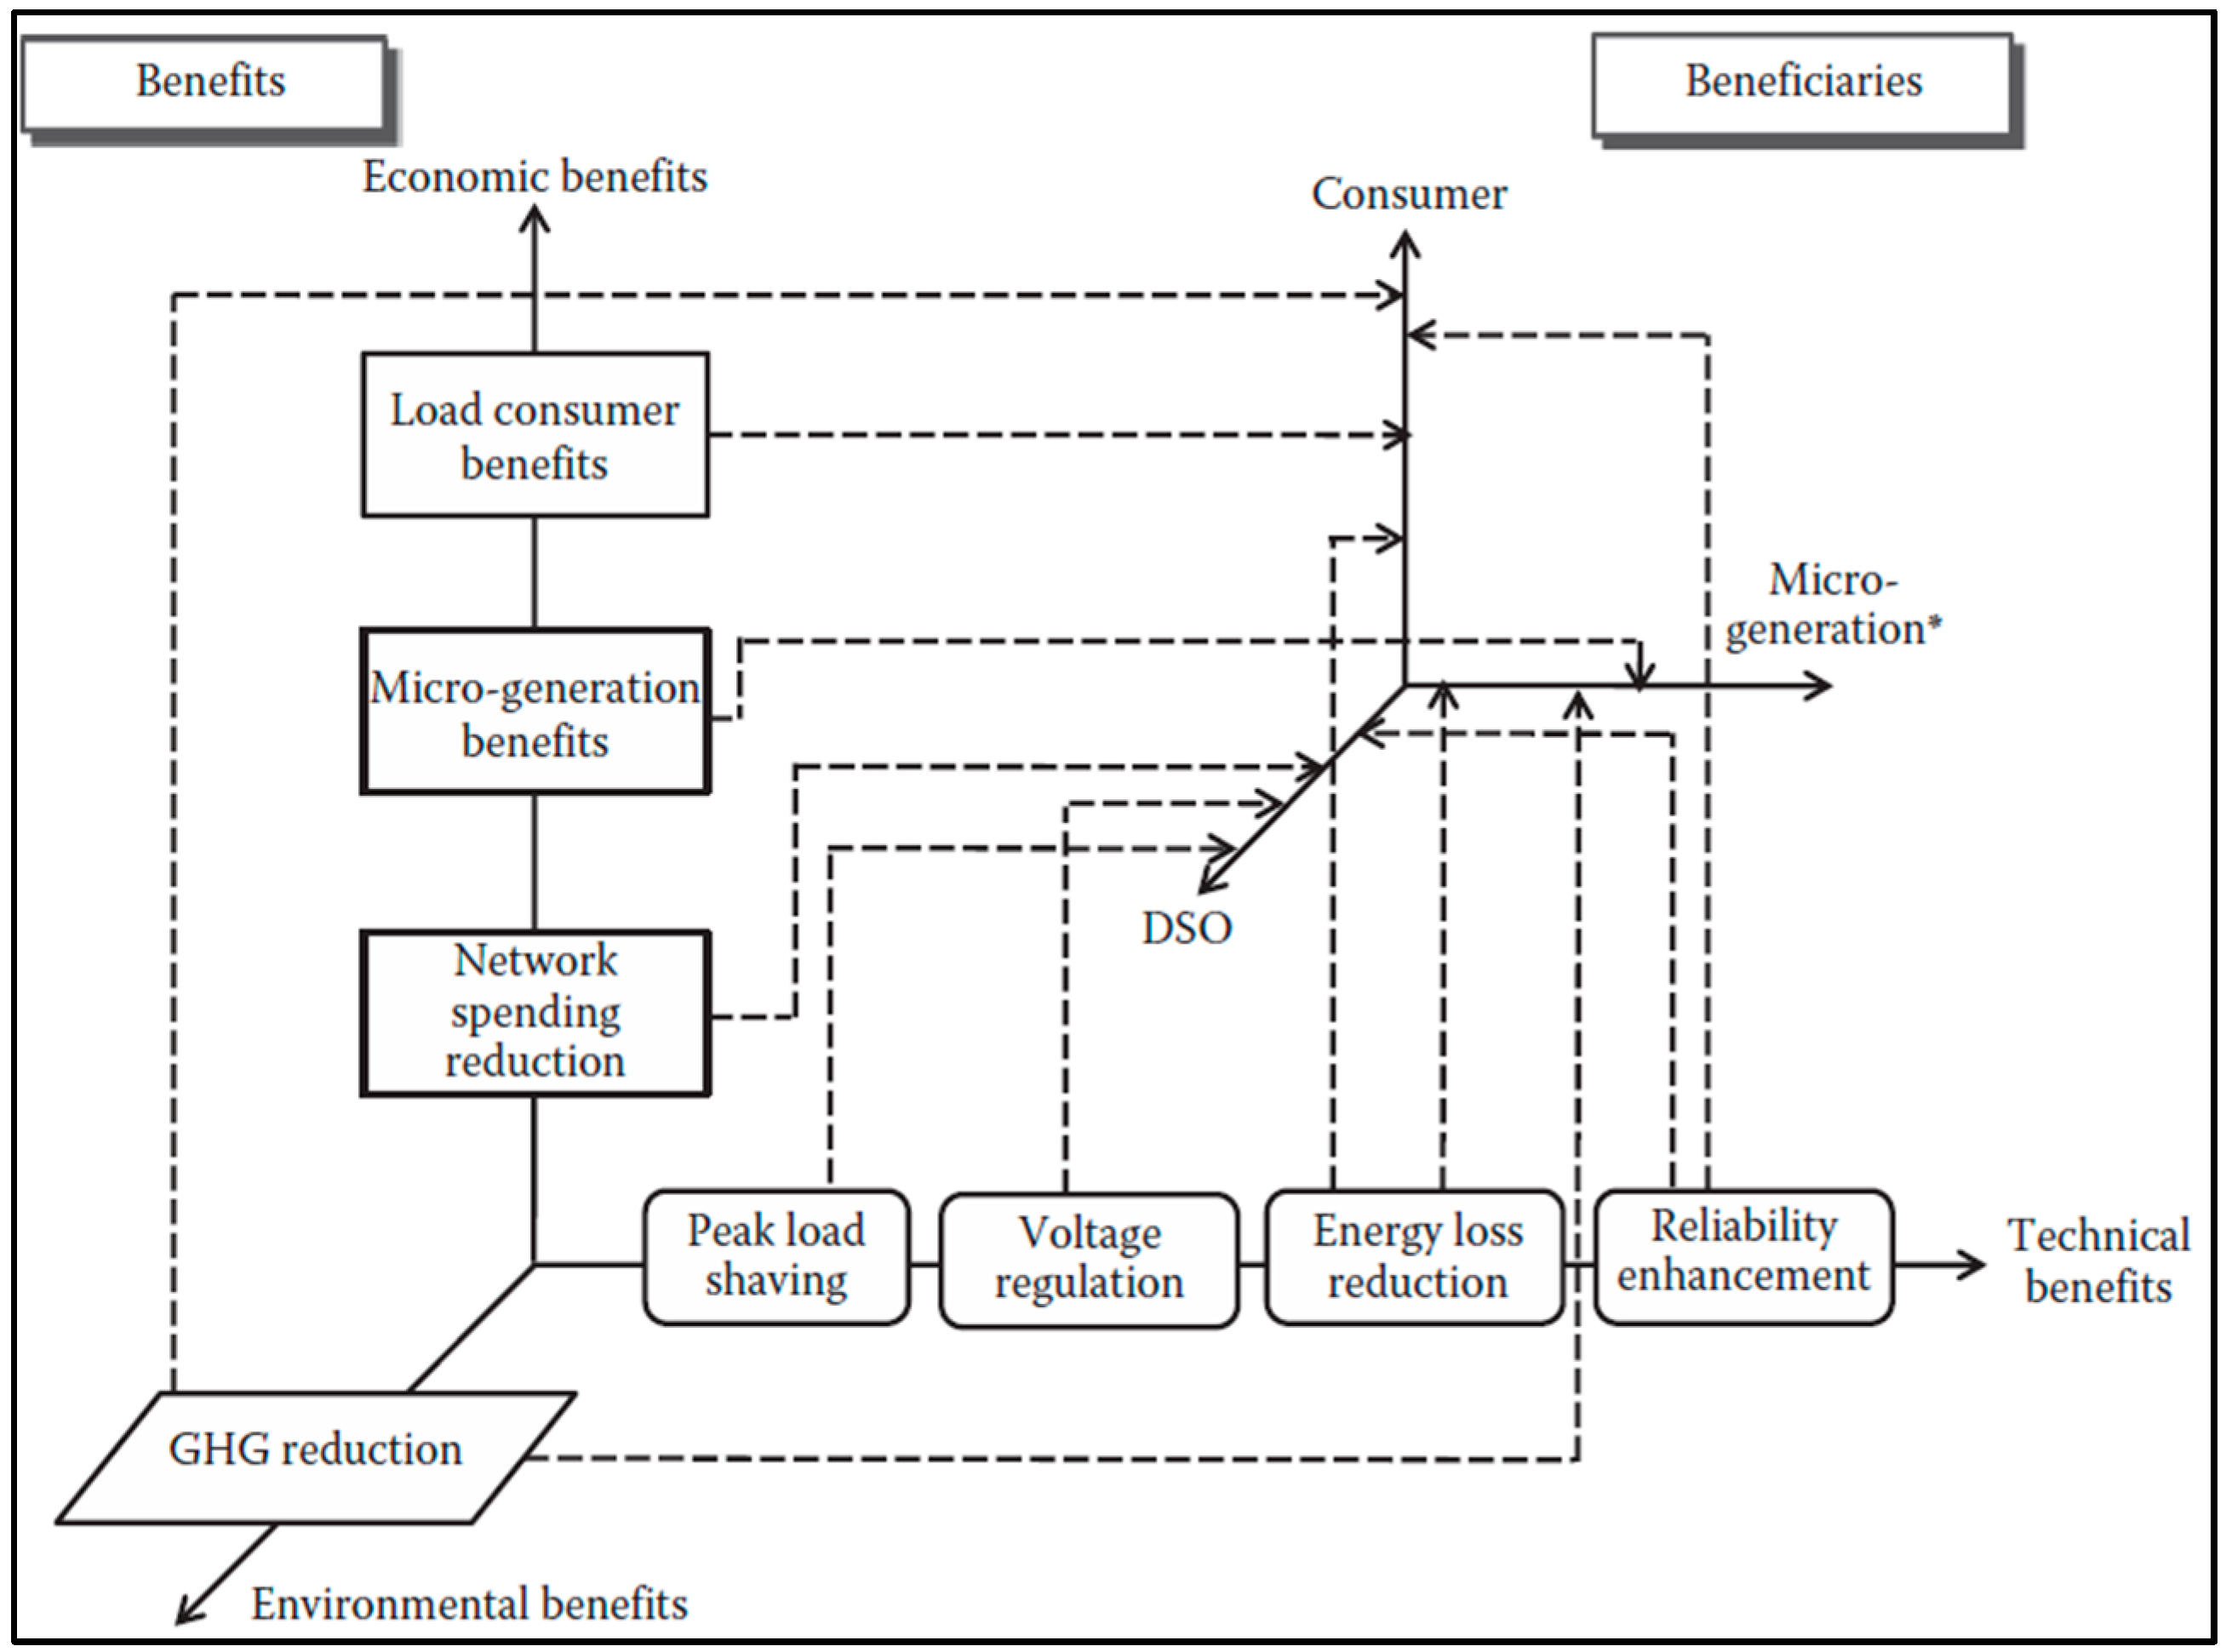
2. Theoretical Background

The Department of Energy (DOE) defines the microgrid as “a group of interconnected loads and distributed energy resources within clearly defined electrical boundaries that acts as a single controllable entity with respect to the grid. A microgrid can connect and disconnect from the grid to enable it to operate in both grid-connected or island mode” [13]. The main functions of microgrids can be defined as [14,15]:
  • Provide enough and continuous energy
  • Internal control and optimization strategy
  • Can connect and reconnect to the grid
  • Used as a flexible entity to provide services to the grid or energy market
  • Applicable to various voltage levels
  • Includes an energy storage.
According to [14], microgrids can provide economic, environmental, and technical benefits to the relevant stakeholders, e.g., consumers and Distribution System Operators (DSOs) (shown in Figure 1). Consumers can get cheap electricity either from microgrids or the main grids. DSOs can benefit from the local generation and demand management initiatives to reduce the load on distribution grids at peak periods. Microgenerators can benefit from providing electricity to the microgrids or the main grids. Some governments provide subsidies to the microgenerators for using renewable energy technologies. There are two environmental benefits of the microgrid: the reduction of greenhouse gas emissions and the adoption of more energy-efficient energy supply solutions [16].
Among the various challenges for implementing microgrids, technical and legal challenges are popularly discussed in the literature (e.g., [9,17]). One of the technical challenges is the balance management between demand and supply that is important for maintaining reliability and voltage quality in the grid. The real-time monitoring of electrical parameters can affect the voltage quality, e.g., frequency, reactive power, and power flows. Another technical challenge is the interconnection between the main grids and microgrids, especially with larger microgrids. Meanwhile, the security of data communication, especially with the usage of smart meters and other IoTs (Internet of Things) components, is a challenge.
The discussion of social and environmental benefits of microgrids is missing in [14] and other literature. The social benefits should be an important factor to consider for the microgrid implementation, especially for island microgrids. For instance, [18] states that microgrid implementation can improve the lifestyles of people in isolated communities. [16] points out that social benefits of the microgrid can be mainly expected for “rising public awareness and fostering incentives for energy saving and Greenhouse Gases (GHG) emission reduction, creation of new research and job opportunities, and electrification of remote or underdeveloped areas”. The overall business case for environmental and social goals in the design of microgrids is less clear due to the inability of distribution-only utilities to capture the energy benefits of production assets. Therefore some internalization into economics is essential [19].
There is literature on microgrid optimization and modeling from different aspects. For instance, some research tries to design the optimal energy system for microgrids with simulation software or mathematical models [20,21,22], methodologies for applying specific energy technologies such as PV panels, wind power, batteries [23,24,25], or the impact of different loads, emission policies, and locations on the optimal microgrid design [26,27]. Some research proposes multi-objective mathematical models for optimal microgrids [21,24,25]. A case study review by [28] reveals that methodologies are not identified in about half of the case studies. Meanwhile, there is no literature that includes method selection for the microgrid optimization. Furthermore, no research has considered all energy technologies. Although most of the literature mentions the technical-economic issues, no research has considered the local economy. Therefore, a systematic approach including all the missing aspects of the literature is needed.
Ten percent of the world’s population live on islands, with special challenges for the energy supply [29]. Meanwhile, electricity generation on islands still mainly relies on fossil fuel-based power plants. Therefore, microgrid optimization with consideration for renewable energy technologies is important for the island energy system. The benefits of adding renewable energy technologies to the island microgrids are to reduce greenhouse gas emissions, increase energy efficiency and system stability. The community can rely less on imported fossil fuel and thereby increase the resilience. The geographical boundaries of islands provide the feasibility to investigate the influential factors for the implementation of renewable energy resources on islands. For instance, a report by the International Energy Agency Renewable Energy Technology Deployment (IEARETD) [30] investigates renewable energy technologies in remote areas and summarizes six categories that influence the deployment of renewable energy technologies based on climates, grid sizes, and area type e.g., residence or military base. Therefore, this paper aims to investigate and develop a systematic framework for designing energy systems for small islands with the integration of social economic and technological analysis.

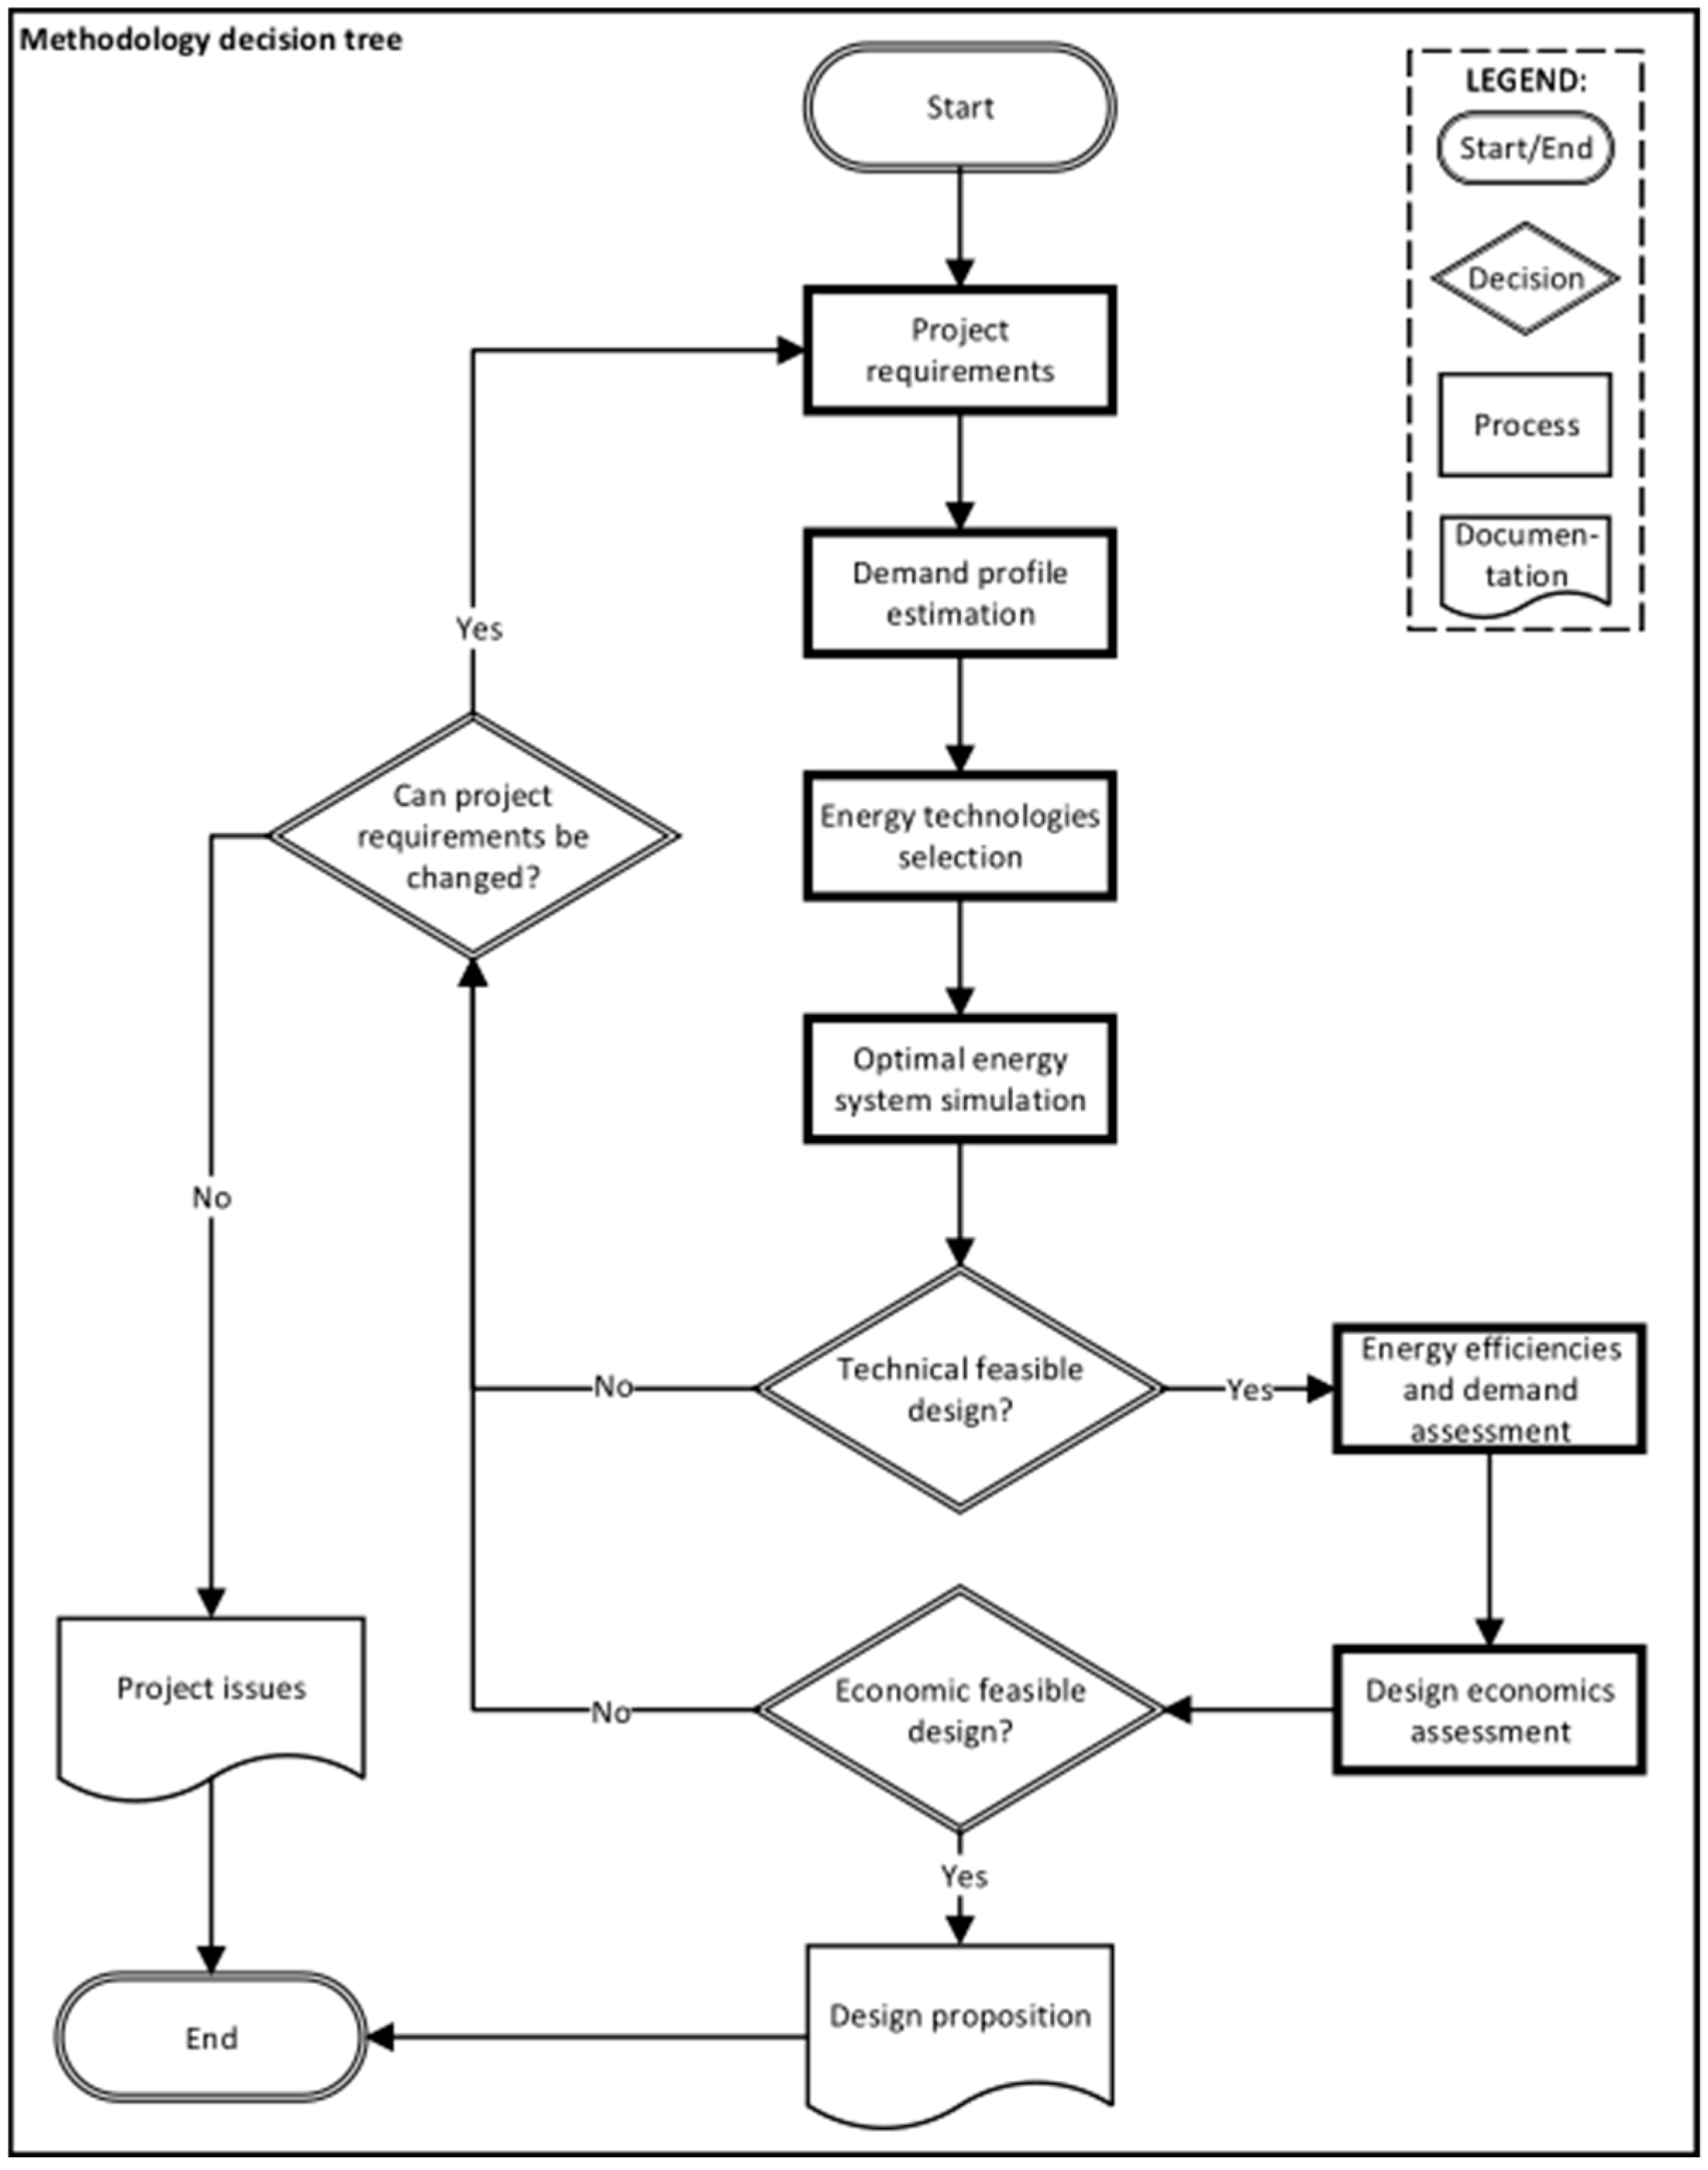
3. Framework for Small Islands’ Microgrid Optimization

The design framework for microgrids is shown as a flowchart in Figure 2. The flowchart consists of four main components: A start/end, a process, a decision operation, and a documentation. A process element is where work tasks such as assessments, calculations, and simulations take place. A decision element is where results from the processes are evaluated and it is decided if some process must be redone or to proceed with the Framework. The last element, the documentation, is where documentation is made, whether the design is feasible or not.
The four process boxes after the start element, the Project requirements, the Demand profile estimation, the Energy technologies selection, and the Optimal energy system simulation, relate to the technical aspects and requirements of the energy system design. With the decision element, is there technically feasible design? After the first four processes the energy system will be designed until it is technically feasible, if possible. When a technically feasible design is simulated, then the value of energy efficiency and demand management is determined in the Energy efficiencies and demand assessment process. Afterwards the energy system design is assessed, in the Design economics assessment process, to determine if it is economically feasible. Along with the latter process, the decision element, is there economically feasible design? This is where it is decided if the energy system design must be redone or a design can be proposed. If no design is feasible, then the related issue is highlighted in the documentation element, Project issues. On the positive side, if a simulated design is feasible then it is presented in the Design proposition documentation element.
Each process, decision and documentation element of the methodology is described in the following subsections.

3.1. Project Requirement

Sustainable microgrid electrification has become very complex in nature [6]. It operates in two modes: grid-connected and islanded. The configuration should be taken into consideration to maintain the balance between power supply and demand. This is done by several methods, such as hill climbing, Perturbation and Observation, incremental conductance, optimum gradient method, fuzzy logic control, neural networks and the Maximum Power Point Tracking (MPPT) [2,31]. Several works address this issue, such as [32] that proposes a hybrid intelligent power control system composed by a Wilcoxon radial basis function network and an Elman neural network that implements a MPPT.
Another important issue is the stability and reliability of the system. Several works address protection and fault analysis algorithms regarding microgrid distribution systems, such as [33,34], as well as system stability [33].
It is necessary to identify the constraints for the project requirements’ determination. There are two types of constraints, fixed and variable, which are dependent on the characteristics of each system.
  • Fixed constraints: the determination of fixed constraints process comprises non-flexible requisites, such as physical constraints such as geographic data or a case-specific requirement for the projected reliability.
  • Variable constraints: the determination of variable constraints process comprises all constraints that are flexible and can be changed under given conditions, such as renewable generation penetration and project cost.
It must be noted that a fixed constraint regarding one system can be a variable constraint for another system. For example, the fraction of RE generation, where the fixed could be e.g., a minimum requirement of 50%, and the variable could be, e.g., 50% if possible within a budget limit. Table 1 includes examples of both fixed and variable constraints.

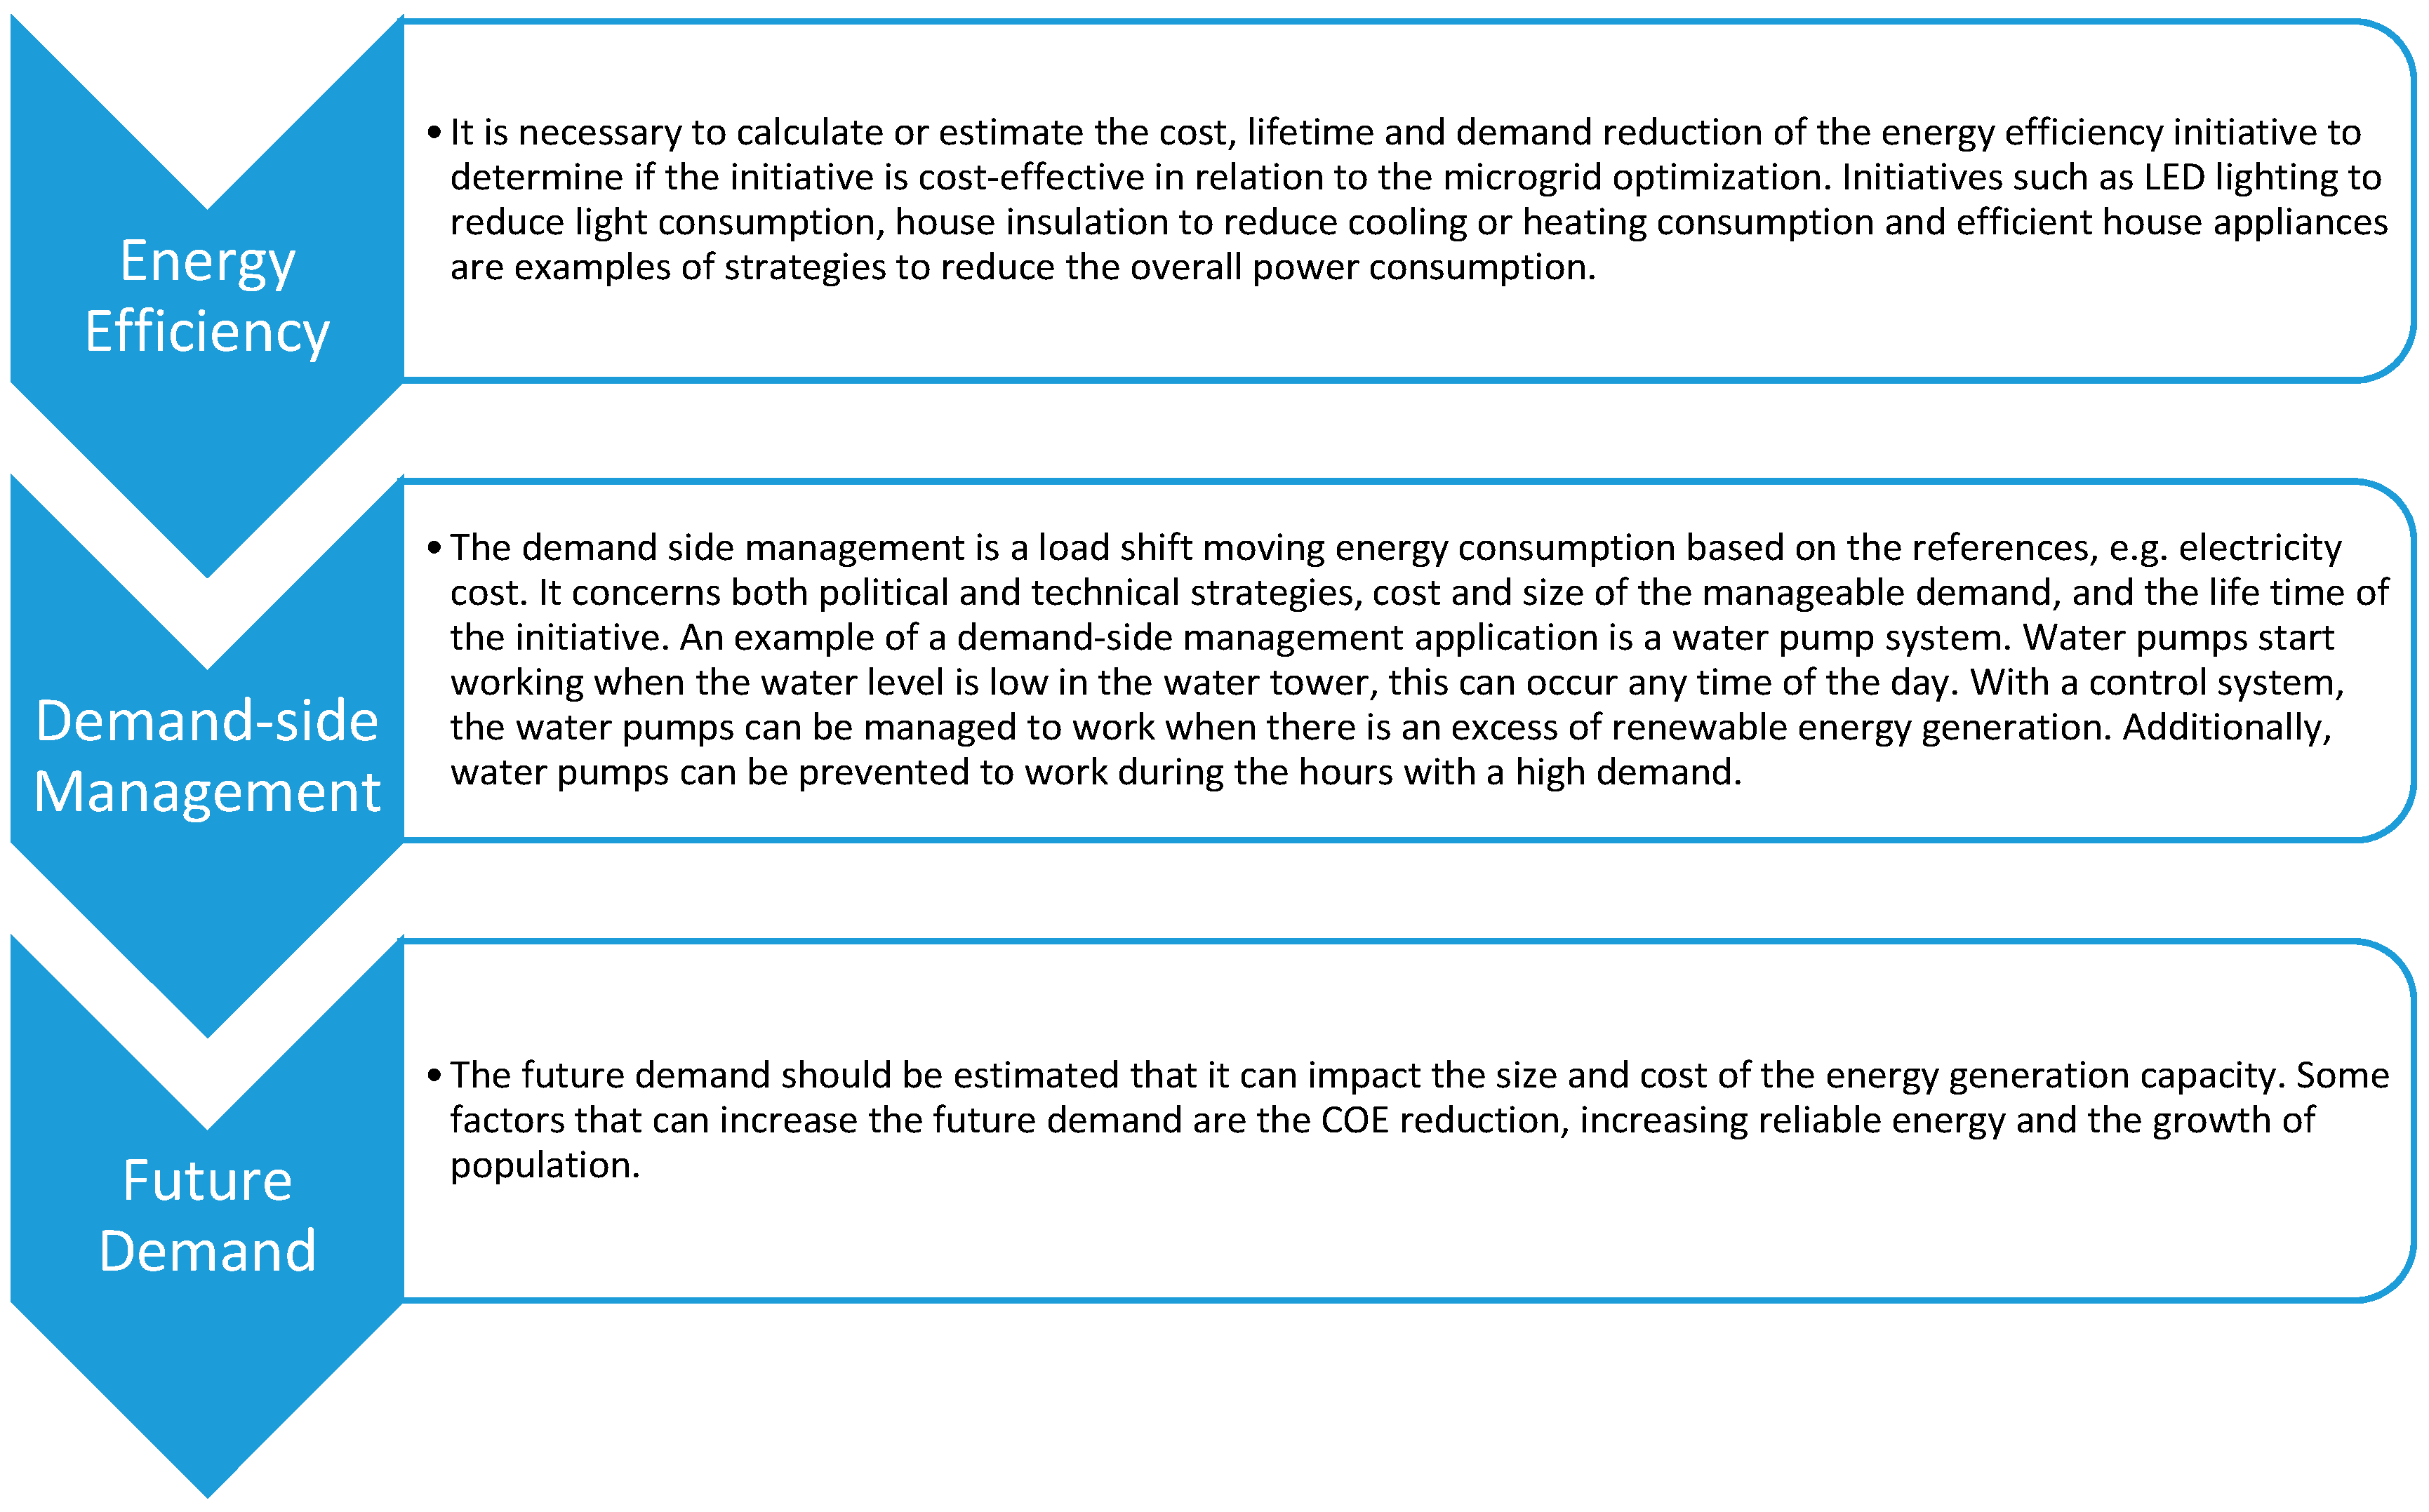
3.2. Demand Profile Estimation

Demand profile estimation considers the energy efficiency, demand management, and the future demand because these three fields can help to reduce the size of the energy system and thereby the Cost of Energy (COE). The result of this process is a demand profile that can be used for microgrid optimization. A demand profile can be estimated based on the type of inhabitants in the remote area, the current energy generation system and the microgrid location. Figure 3 presents the demand profile estimations that needs to be taken into consideration.

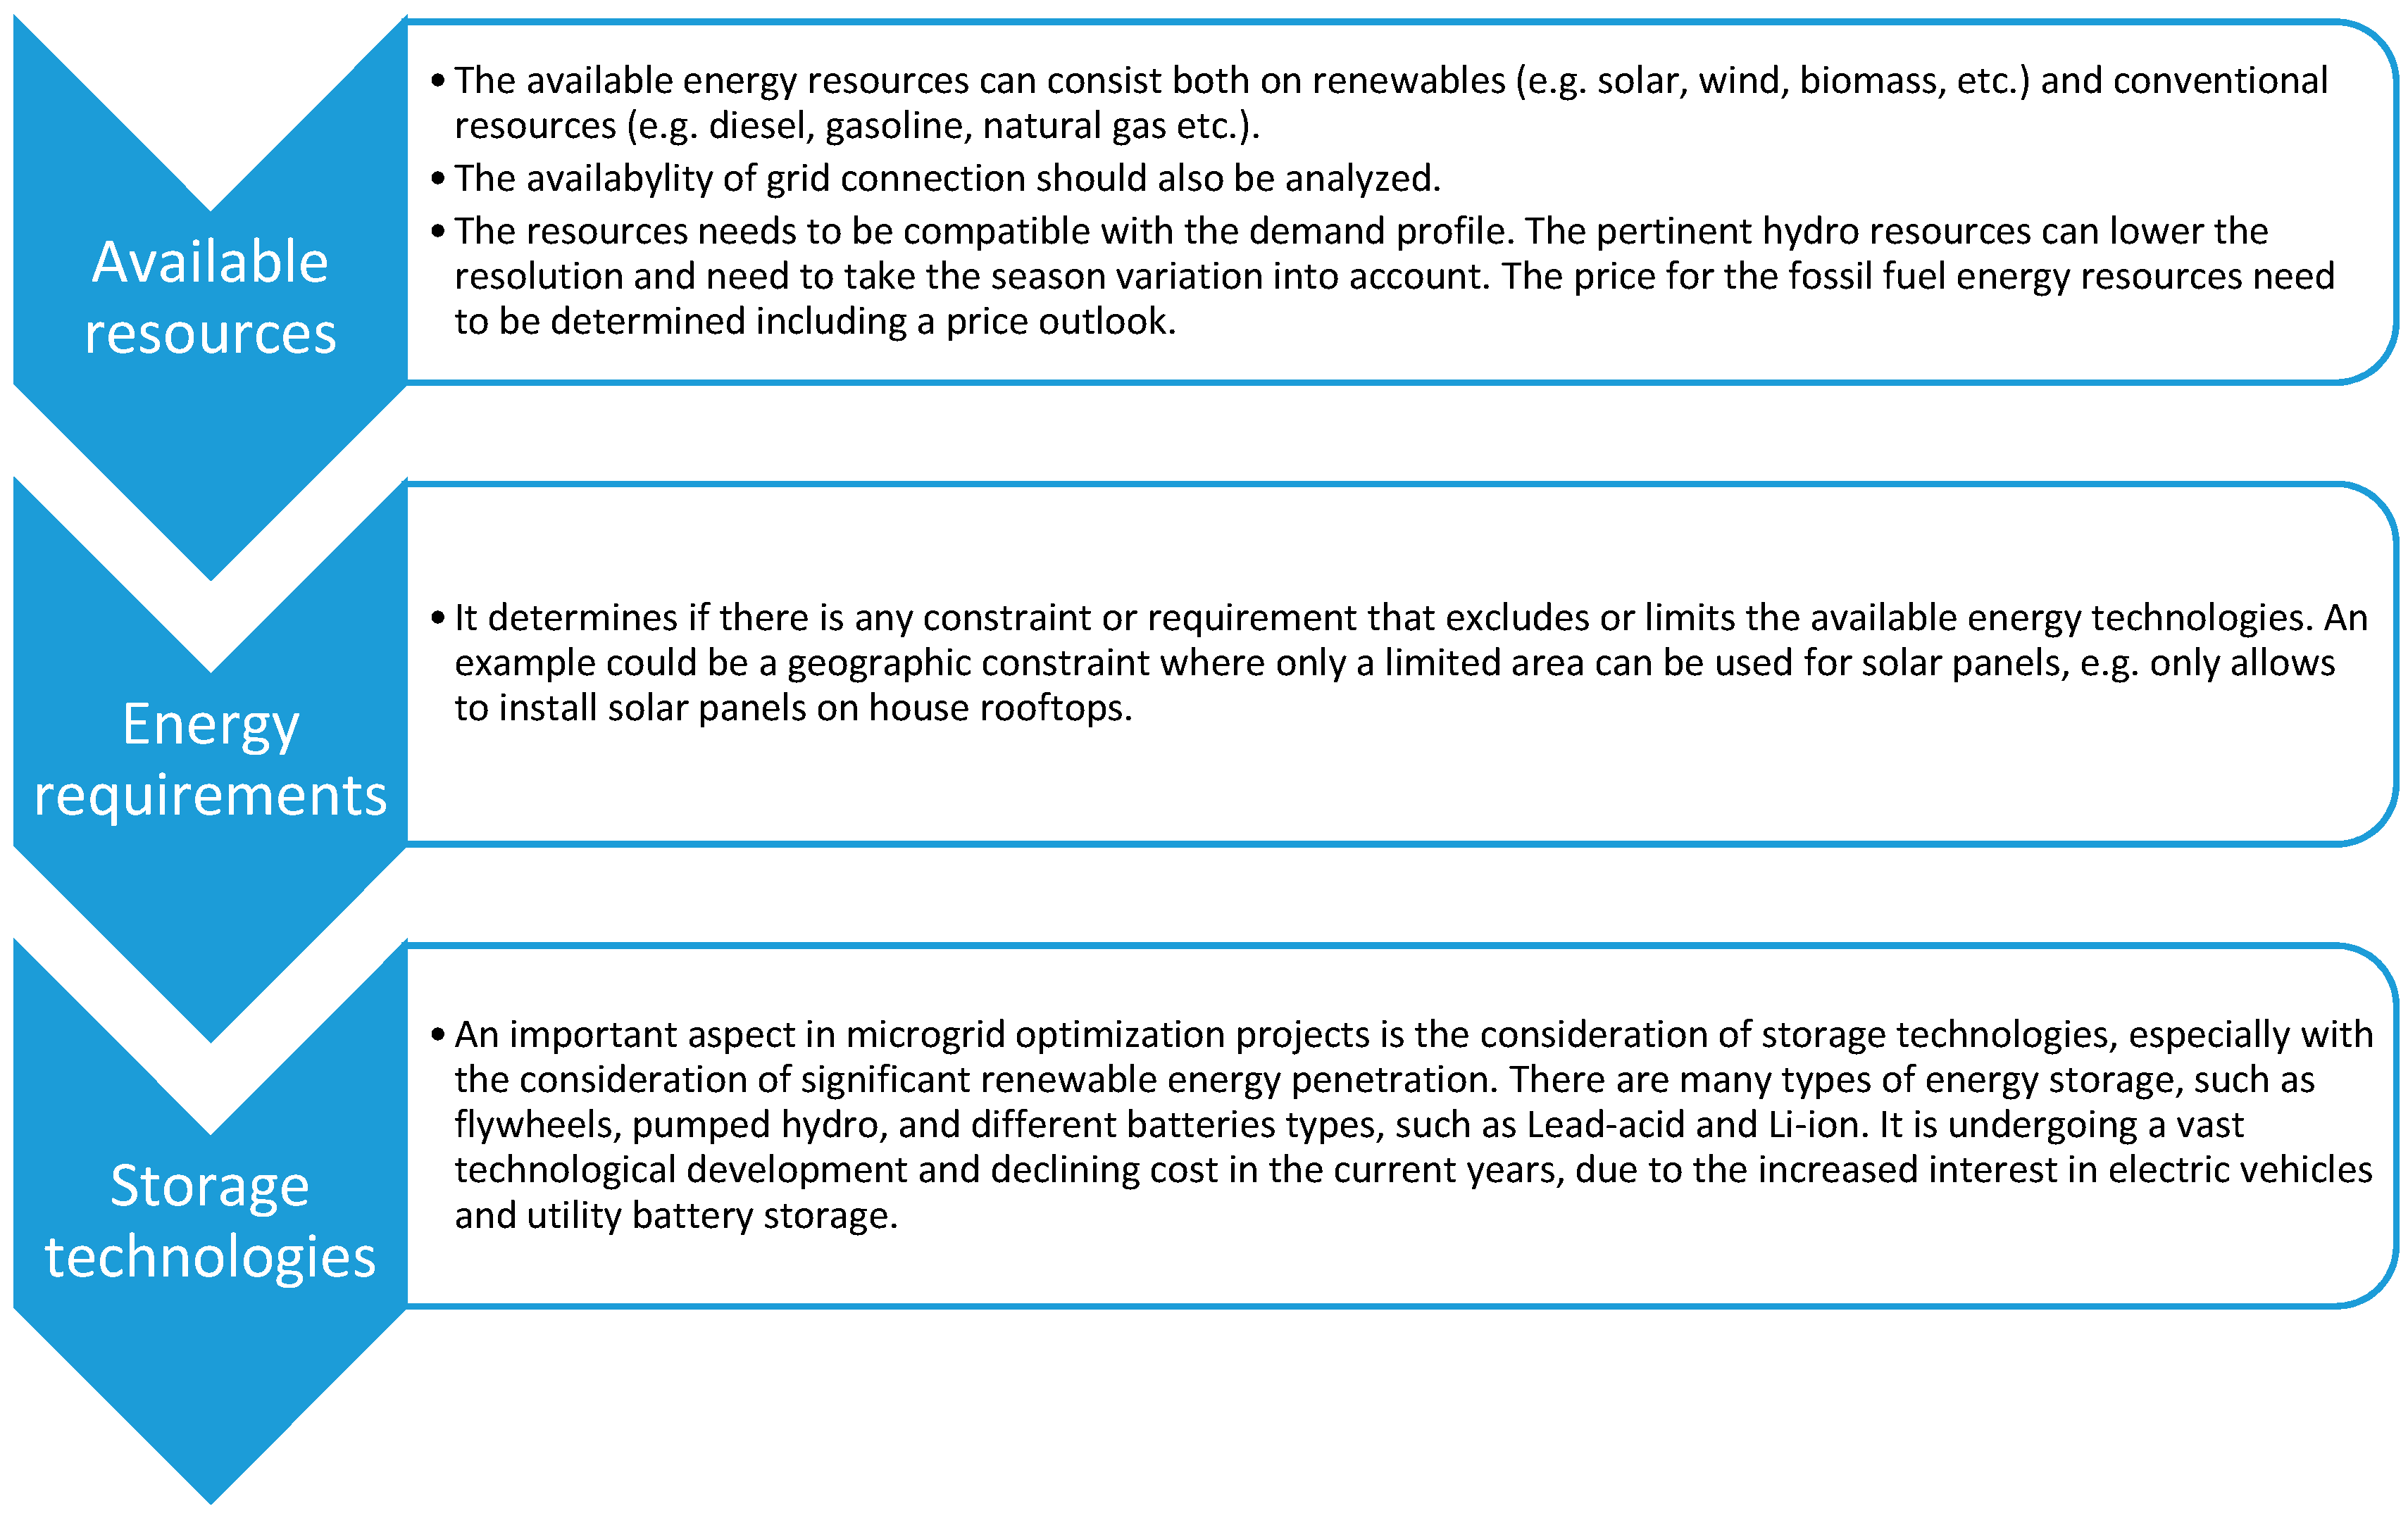
3.3. Energy Technologies Selection

The step of energy technology selection defines appropriate energy technologies adopted in the microgrid optimization. The potential energy technologies to be considered in this step are defined by the available energy resources, such as average solar irradiation, wind speed, hydro availability, etc. The project requirements are assessed to determine if any constraint associated with the framework excludes or limits the use of some technologies. The fraction of the renewable energy generation from the total energy generation determines whether the energy storage needs to be included in the energy system. The cost and size are estimated once the energy technologies are identified. Figure 4 presents the common energy technology selection considerations that need to be addressed.
The estimation for cost and size of each generation unit is needed in relation to the configured demand load profile. The final dimensioned infrastructure should be selected according to pre-determined criteria, such as the lowest COE with a minimum renewable generation fraction condition.
To distribute the energy capacity among the generation portfolio, it is necessary to define a maximum capacity for each considered generation unit. This is restricted according to the energy demand on the site, the initial investment and the total available area [35].

3.4. Criteria Analysis

The potential solutions need to be assessed regarding the social, economic, and technical characteristics to establish a correlation between optimal response and feasible implementation regarding the reality of the microgrid configuration. The designs need to be filtered by the social, economic and technical criteria as shown in Table 2 [36,37].

3.5. Calculation for Microgrid Optimization

An optimization calculation needs to be performed to define the best microgrid configuration. There are several conflicting objectives regarding microgrids, therefore, multi-objective analysis is generally proposed in this case [21,24,25]. The cost for each generation unity should be fully addressed with the consideration of the initial capital investment, replacement costs, operation, and maintenance cost. Fuel prices, as well as their expected variation, should also be taken into consideration. As shown in Figure 2, some of the previous processes must be redone if a technically feasible energy system cannot be designed.
An important aspect of this phase is to consider the uncertainty of the input variables. Values such as the fuel price, wind speed, solar irradiation, inflation rate, etc. can suffer significant variation during the project lifetime. Therefore, a sensitivity analysis needs to be considered for the most important inputs. All the previous process must be redone if no technically feasible design can be obtained. This cycle needs to repeat until a technically feasible design is achieved.

3.6. Economics Assessment Design

The cost of microgrid optimization is done by the comparison between the socio-economic and local economy. If more than one viable microgrid optimization can be identified, other interests can be compared, such as CO2 emissions, COE, total investment, etc. Otherwise, changes need to be considered in the project requirements if no system is feasible. The local economy is assessed in relation to the economy of the new energy system. This is done by the comparison between the local cost of living and the system COE. The monthly individual cost of living provides a relative indication of price acceptance by consumers. The COE is calculated as Equation (1).
  COE = Total   cos t   for   energy   generation Total   energy   consumption  
To compare the monthly cost of living with the COE, a monthly COE per capita should be computed, as shown by Equation (2). The allowed percentage of the COE in relation to the cost of living depends on several factors and relies on the willingness of consumers to pay for energy.
  COE month = COE Total   annual   energy   consumption population ·   12   months  

3.7. Design Proposition and Project Issues

The last part of the framework is the documentation of the design proposition and project issues in the decision tree of Figure 2. Both depend on the outcome of the optimization process. The identified issues are listed and described in the documentation of project issues if no microgrid optimization can be proposed. The technical and socio-economically feasible designs are presented in the documentation of the design proposition.

4. Case Study

To test and validate the proposed framework, a microgrid energy system design was selected based on the following criteria:
  • Previous existing microgrid implementation;
  • Plan for energy system transition;
  • Data before the transition; and
  • Data or plans for the new design.
The location must be known to identify geographic resources and local concerns. A comparison is more qualified when the case study has been conducted and a new energy transition project has been performed. Information regarding the energy system before a transition is necessary to determine the demand and validate the proposed framework.
The optimization software used to validate the proposed framework was the Hybrid Renewable and Distributed Generation System Design Software (HOMER) [38]. HOMER is used to simulate microgrids systems and to find their optimal configuration. The demand can consist of both electric and thermal loads. For every component type, there is a built-in catalog with different brands and capacities with all necessary technical and financial information. HOMER features an option to download wind and solar resources. The wind and solar resources can be downloaded from the National Aeronautics and Space Administration (NASA) Surface meteorology and Solar Energy Database or from the National Renewable Energy Laboratory.
When simulating a microgrid system, HOMER performs three different processes: simulation, optimization, and sensitivity analysis. The optimization process comprises several simulations and the sensitivity analysis comprises several optimizations.
HOMER considers the calculated year representative for every year in the project’s life span. The simulation estimates the life-cycle cost of the system. This includes initial capital cost, fuel cost, Operation and Maintenance (O&M) cost, replacement cost. The future cash flow is discounted to the present. The life-cycle cost is calculated as one value, the Net Present Cost (NPC), which is a good key figure for comparing different systems, see Equation (3):
  NPC = C a n n ,   t o t a l i ( 1 + i ) N ( 1 + i ) N 1  
where C a n n ,   t o t a l is the total annualized cost, i is the discount rate, and N is the project life span. Concurrently, the levelized COE is calculated, this is calculated as seen in Equation (4):
  COE = C a n n ,   t o t a l E p r i m + E d e f + E g r i d , s a l e  
where C a n n ,   t o t a l is the total annualized cost, E p r i m is the total amount if primary load, E d e f is the total deferrable load, and the E g r i d , s a l e is the total amount of energy sold to the grid.

4.1. Selection Criteria

Several cases were analyzed and filtered by the defined selection criteria as shown by Table 3. The Rottenest Island in Australia [39,40], was selected due to the most comprehensive description, available data and agreement with the selection criteria.
Rottnest Island is located on the off coast of Western Australia in the Indian Ocean as shown in Figure 5. It covers 19 km2 of land area with approximately 10 km from east to west and 5 km from north to south. It has an A-class reserve (the highest level of protection afforded to public land). Rottnest Island is a sandy, low-lying island formed on a base of aeolianite limestone.
This island is managed by the Australian Renewable Energy Agency (ARENA) and it is own by the Rottnest Island Authority. This authority is responsible for building, operating, and maintaining the required infrastructure, including the generation and distribution infrastructure.
The increase of the distributed generation in Australia provides utilities with a unique opportunity to manage portions of the network more effectively as microgrids [56]. Energy in Australian off-grid locations has traditionally been supplied by fossil fuels, particularly diesel and natural gas [57]. In addition, the cost of fossil fuels systems in some remote locations is higher than in urban areas. These factors present a considerable opportunity to increase the uptake of renewable energy in these locations. The ARENA was established in 2012 to improve the competitiveness and increase the supply of renewable energy in Australia.
This work focuses on the electrification system of Rottnest Island. The current system configuration will be compared with the short-term project plan. Both will be evaluated through the proposed framework to validate the best approach.

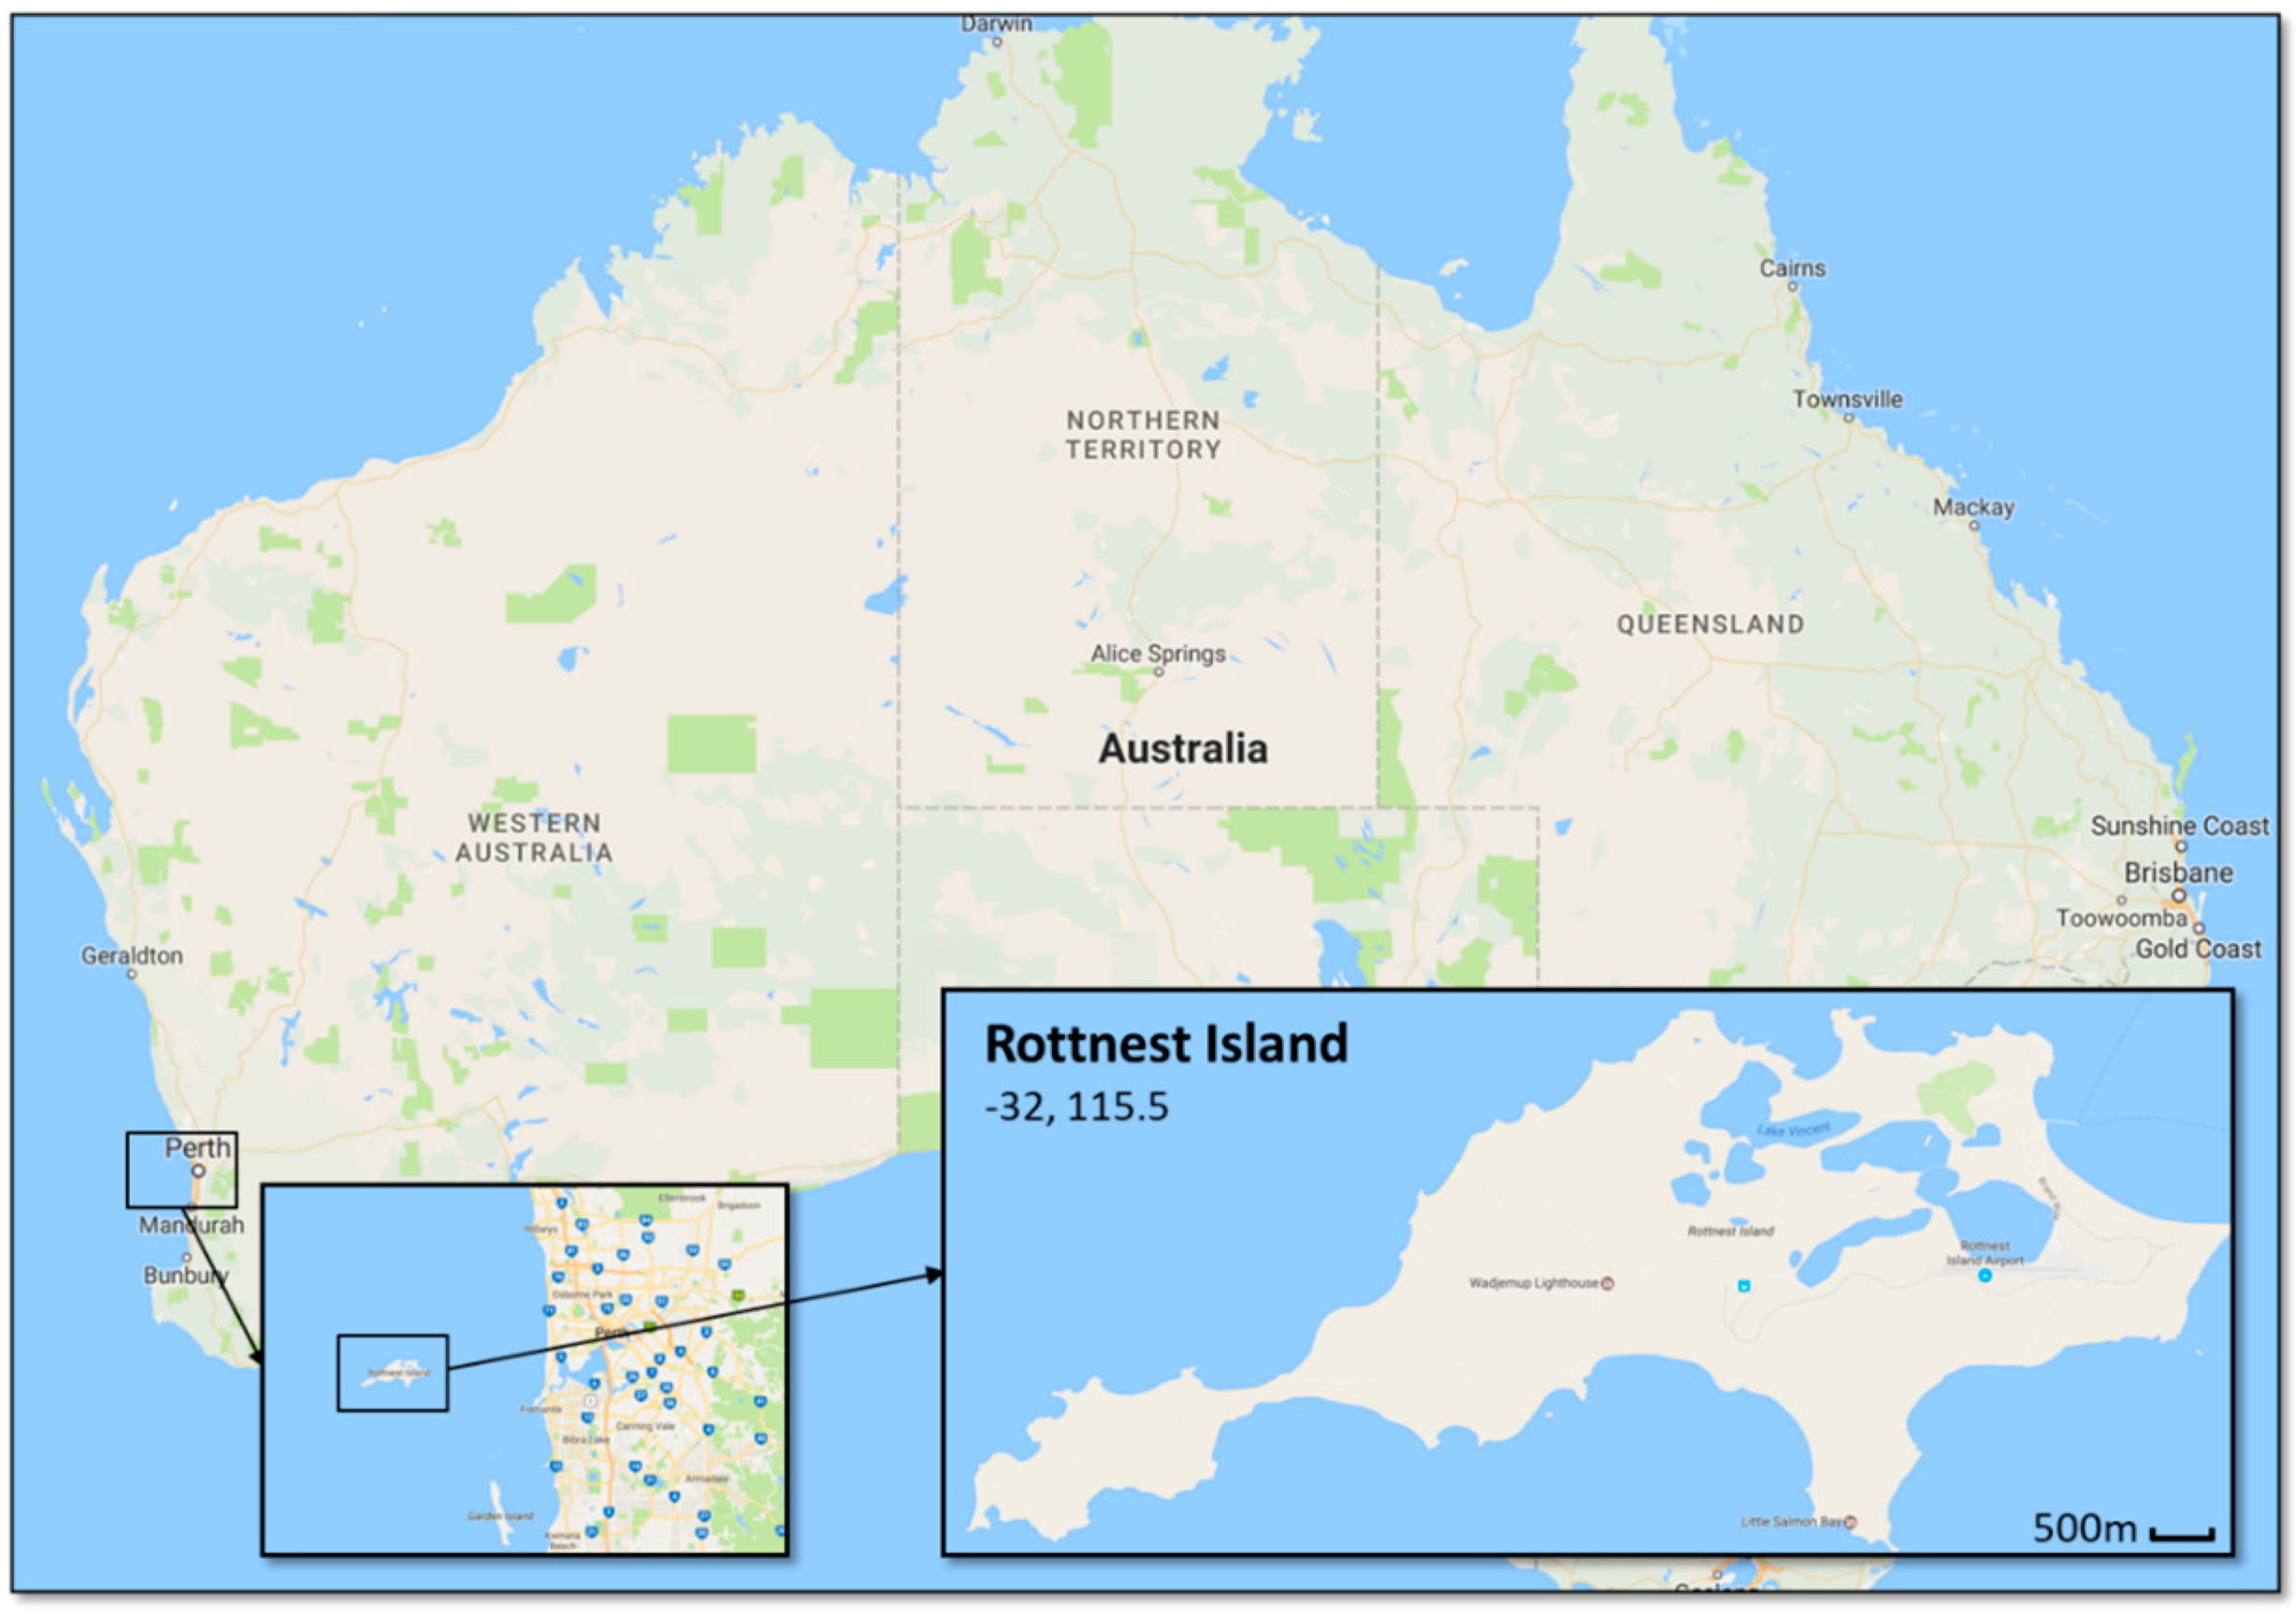
4.1.1. Rottnest Island: The Existing Project

The current project has a hybrid configuration composed of diesel and wind generation. It is a self-sufficient island regarding supplying electricity and drinking water. Rottnest Island Authority has traditionally supplied an annual demand of 5 GWh and peak load of 1.2 MW through diesel and wind generation. Useful information regarding the project Rottenest Island is described in Table 4.

4.1.2. Rottnest Island: Planning for the Future

Rottnest Island has already an energy efficiency and renewable energy roadmap. The roadmap presents a staged approached to increase renewable energy contribution to the 65% annual average, with times of 100% renewable supply by 2023 [57]. The objective is to increase renewable energy contribution from 30 to 45%, mostly using solar generation. The most significant customer load is a reverse osmosis desalination system. The future project details are described in Table 5.

4.2. Project Requirements

The reliability of electricity was considered 100% to attract tourists regarding energy technology sustainability. It is stated by the project material that by implementing solar power together with wind power on the islanding, a reduction of 45% in diesel fuel is expected. By this, a minimum share of RE must deliver the remaining 55%. The constraints are listed in Table 6.

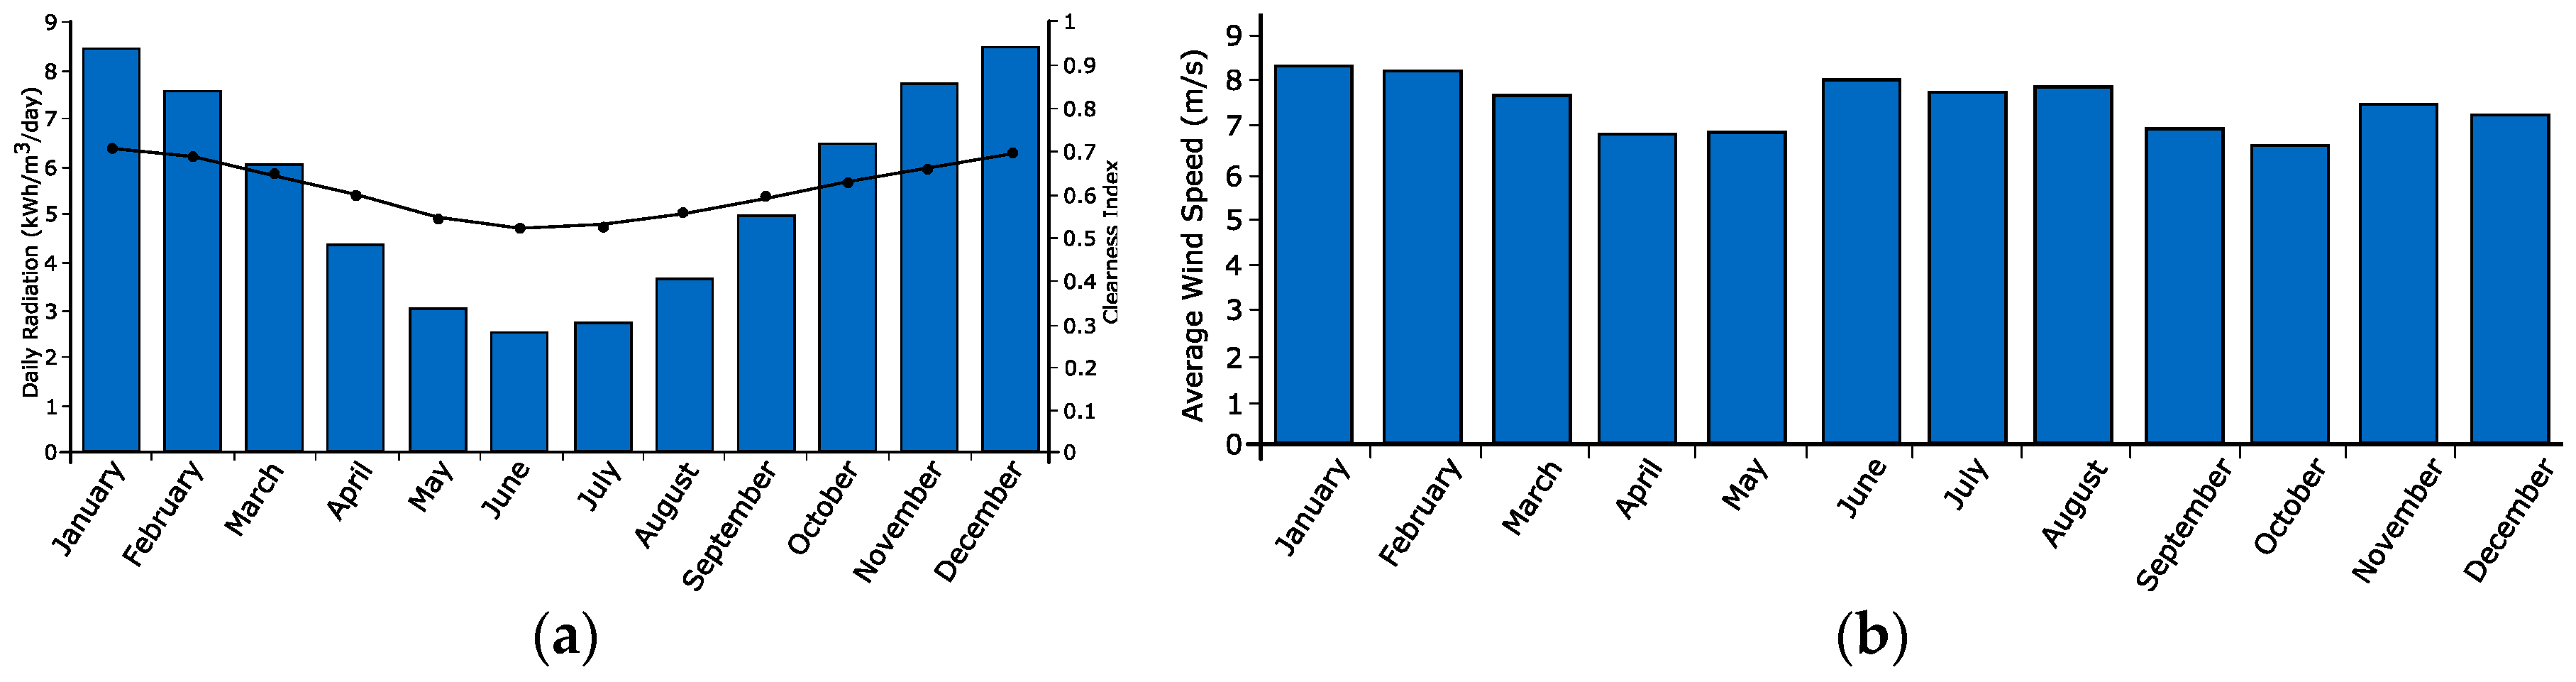
4.3. Demand Profile Estimation

The island is a popular holiday and tourist destination. It has a permanent population of around 100 people with approximately 500,000 tourists and visitors annually, 15,000 of these only during summer and holidays [58]. During the mild wet winter, the temperature is about 12–13 °C, while during the dry summer the temperature is about 25–27 °C. The average relative humidity varies between 61–64%.
The demand profile for Rottnest island is estimated, using HOMER tool as a community project with peak consumption in January, due to the summer in the southern hemisphere and the tourism intensification. It is assumed that the heating demand is included in the electricity demand. The total annual demand is 5 GWh, which is equal to an average consumption of 13,700 kW/day. The manageable demand from Table 5 is subtracted from the daily demand, so a separated file is defined on HOMER tool as a deferrable load. The average demand is then 8700 kWh/day. The deferrable water use is assumed to be the same during every month and that half of the average daily consumption can be stored.
No energy efficiency initiatives were identified. A demand management initiative can be implemented, regarding water storage and desalination plant on the island. The 600 kW wind turbine and the 600 kW planned PV panels can cover the consumption of the desalination plant, reducing the diesel fuel consumption. The wind turbine supply 30% of the energy demand, which is an average of 4110 kW/day. The panels generate on average 2834 kWh/day. Due to variations of energy generation from wind and solar resources, the demand size that can be managed is assumed to be 5000 kWh/day with a peak load of 1000 kW, as shown by Table 7.

4.4. Energy Technologies Selection

No limitations or constraints regarding energy technologies in the project material was identified. Because of the very high RE penetration such as solar panels and wind turbines, and since there is no grid connection to the island, fossil diesel-based generators, and an energy storage system (Li-ion battery) were considered.
The wind and solar resources are obtained through the NASA database. The resolution of the solar data is provided by hourly time step. The resolution of wind data is provided by monthly average time step. The annual average solar Global Horizontal Irradiance (GHI) is 5.51 kWh/m2/day and the annual average wind speed is 7.48 m/s. Figure 6a shows the solar radiation from 1983 to 2005. The solar energy generation potential is higher between October and April months. Figure 6b shows the monthly average wind speed data from 1983 to 1993, illustrating good wind speed resource.
There is no identification of any hydro resources. The diesel fuel price is obtained from Global Petrol Prices [59], costing 0.97 $/L. The price of crude oil is projected to increase in the following years, therefore a diesel price of 1.1 and 1.2 USD/L is entered for sensitivity analysis purpose.
The area used by solar and wind power technologies must be taken into consideration to identify any limitation regarding proper available space. This is done by assuming if one technology should cover the total annual demand (5 GWh). For the solar power, the total annual demand is divided by the average daily PV output multiplied by 365 days to calculate the total capacity needed, as shown by Equation (5).
  5 , 000 , 000   kWh / year 4723   kWh kWp × 365   days = 2900   kWp  
The capacity of the solar power is divided by the maximum solar power capacity per square meter, as shown by Equation (6). Table 8 shows how the maximum capacities were defined in this work. To calculate the maximum wind and solar capacity, a good estimate of the available area to install the solar panels and the wind turbines are needed. The total land use of wind turbines is based on onshore turbines [60]. The efficiency of solar panels is based on a 16% average commercial efficiency under standard test conditions [61]. The maximum capacity of the energy storage is assumed to be equal to the average daily consumption.
  2900   kWp 0.160 kW m 2 = 18 , 125   m 2  
The required area is then divided by the area of Rottnest Island, which is 19 × 106 m2 [62]. The percentage size of the solar power plant compared to the size of the island is showed by Equation (7).
  18 , 125   m 2 19 × 10 6   m 2 100 % 0.1 %  
In the same way, the 600 kW wind turbine can generate 30% of the demand. To cover the annual demand by wind power, Equation (8) shows that the capacity of the current wind turbine has to be divided by 30% and by the capacity per area is shown in Table 8.
  600   kW 30 % × 5000   kW / km 2 = 0.4   km 2  
The percentage of the island area needed for wind power is calculated by Equation (9).
  400 × 10 3   m 2 19 × 10 6   m 2 × 100 % 2.1 %  
Two of the seven diesel generators are a low-load type. It is assumed that the diesel generators can cover the demand at any time, even if other resources are not available. With an average daily demand of 13,700 kWh, the peak demand is 1929 kW.
Table 9 shows the capacity and the quantity, as well as the initial capital cost investment and the O&M cost of each considered generation unity. In addition, a power electronics-based converter is used to convert the DC voltage generated by the photovoltaic and battery system to the AC voltage. This converter has a bidirectional behavior, so the battery can be charged from the AC system as well. Figure 7 shows the distribution network topology of the microgrid.

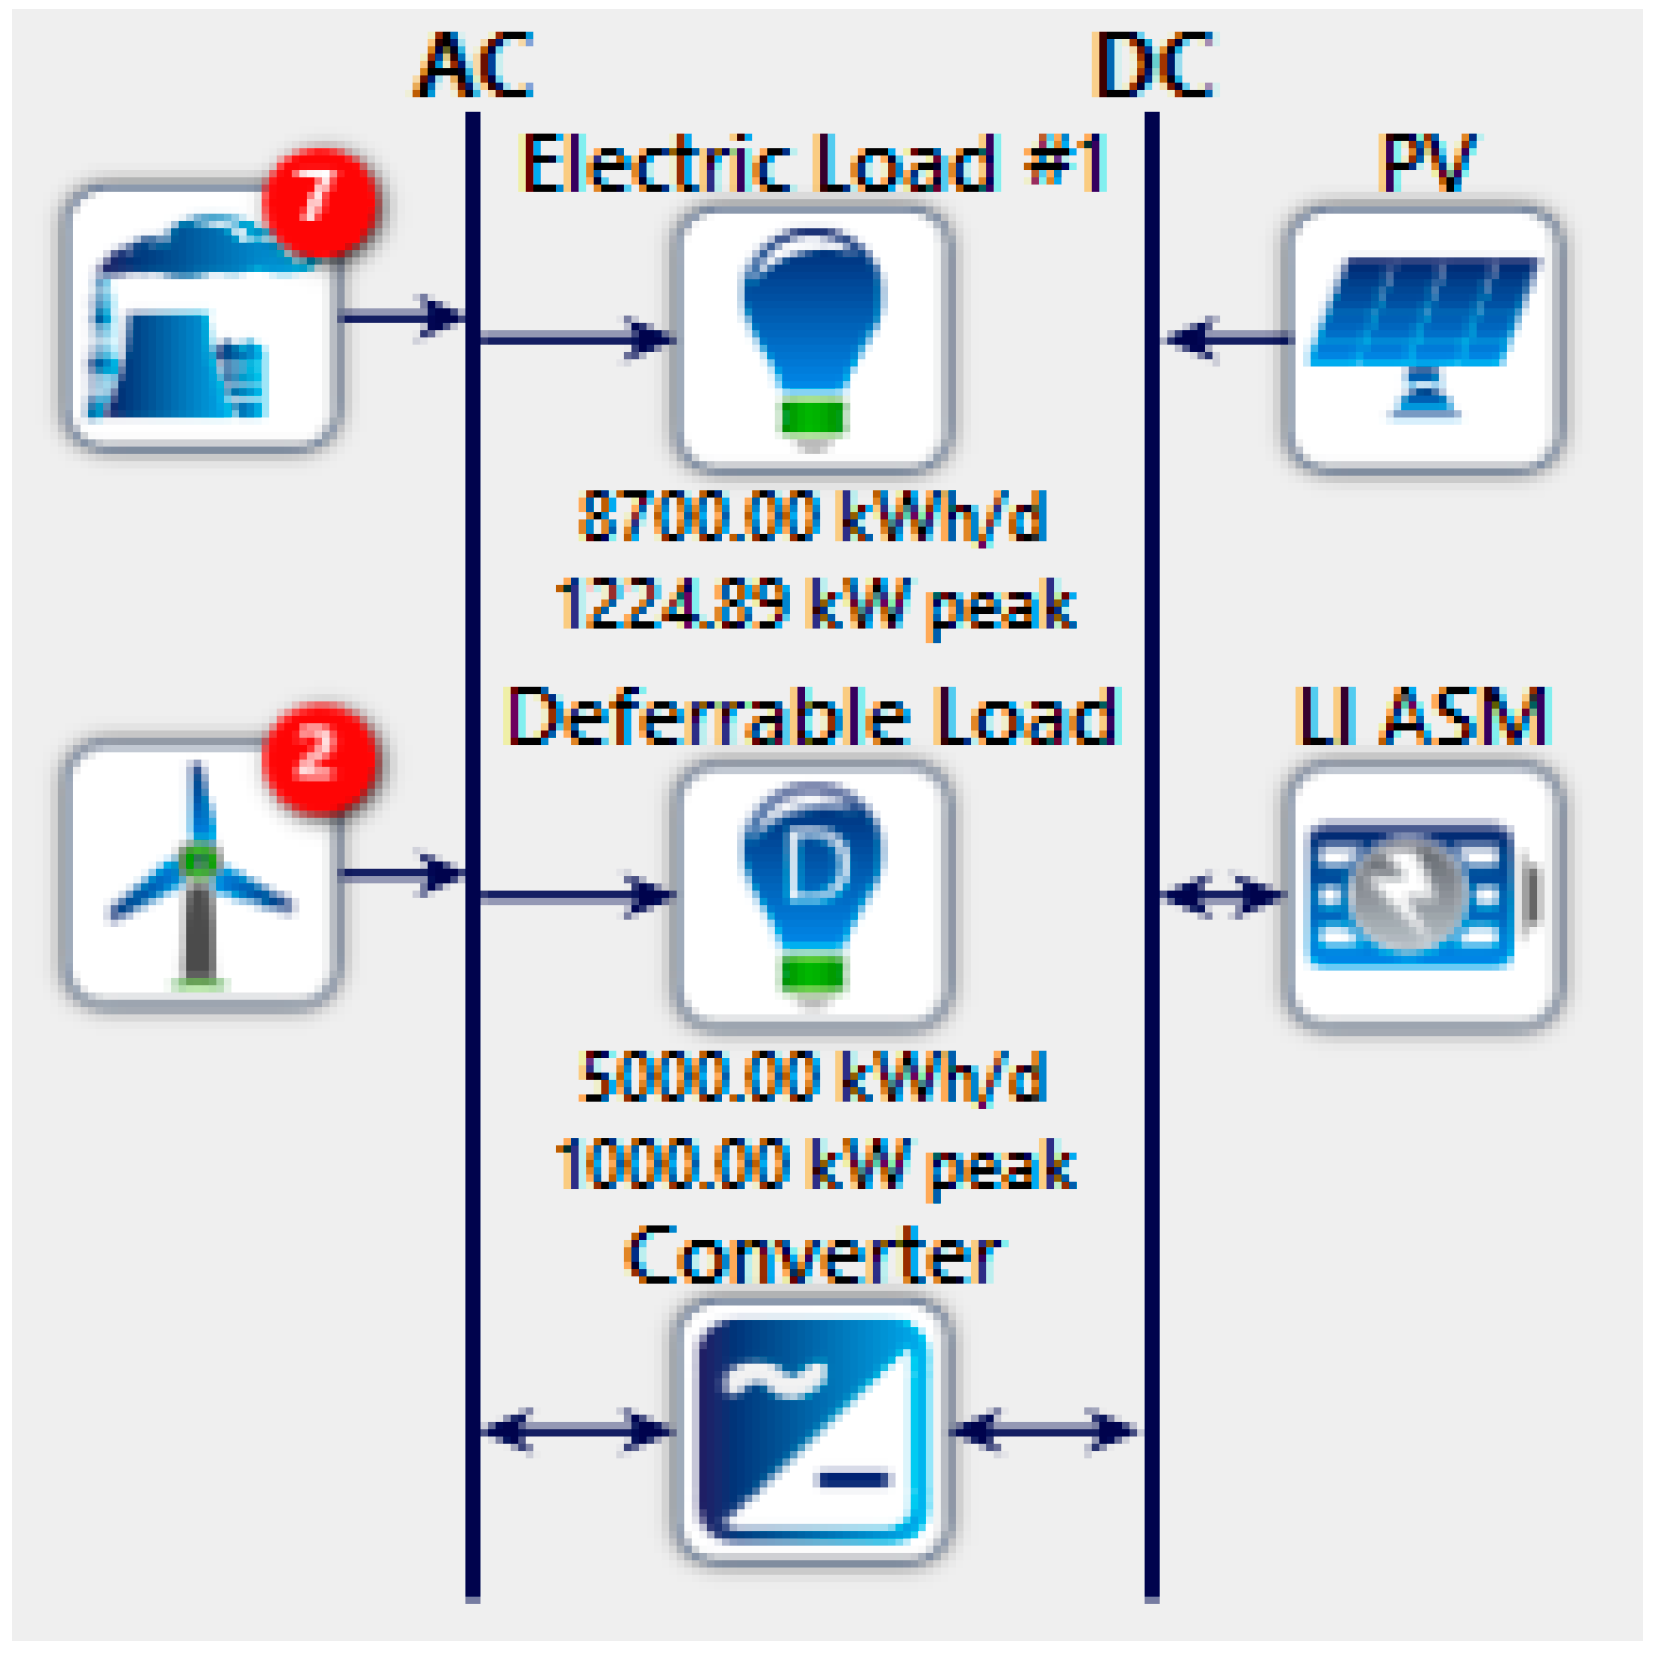
4.5. Optimal Energy System Simulation
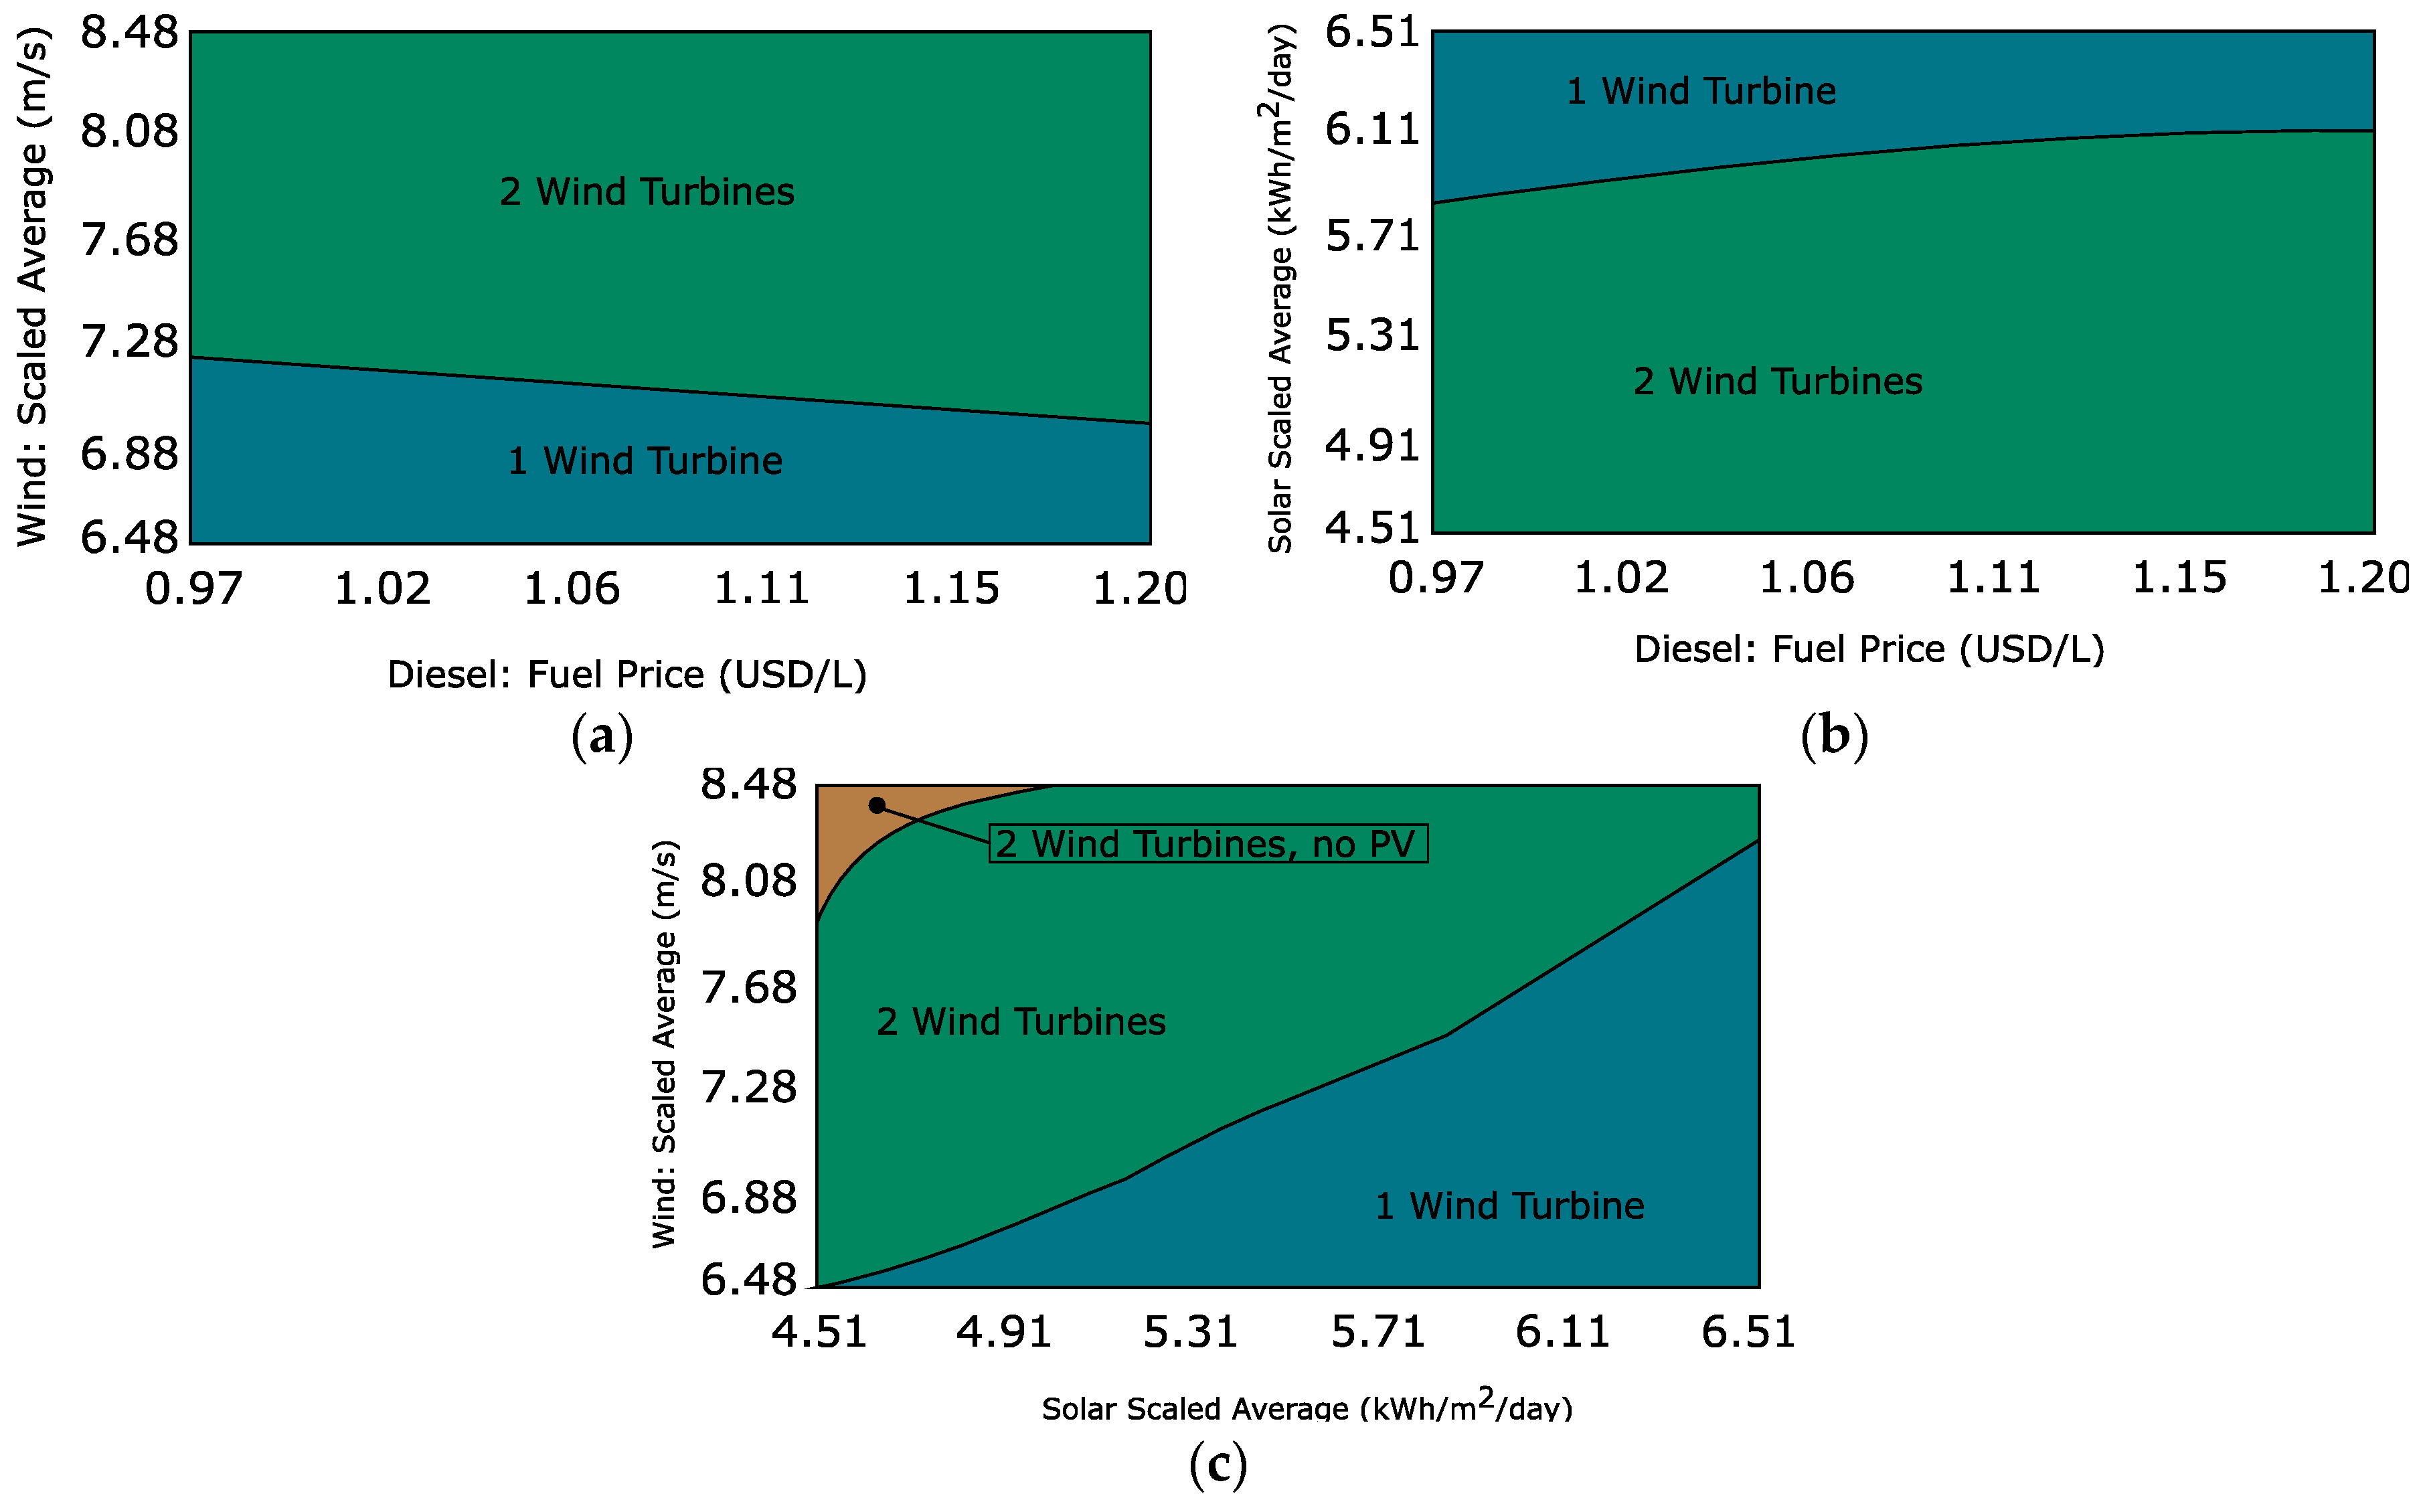
Before running the simulation, the last settings need to be defined. The project lifetime is designed for the next 25 years. The expected inflation rate is 2% with an 8% of nominal discount rate, while the real interest rate was considered as 5.88%. The maximum annual energy shortage is desired to be 0% over the whole period. The system is designed such that the available energy from the existing sources can meet the instantaneous demand for a 10% step increase of the demand.
The system controller is set to use the Load Following strategy, due to the high penetration of RE generation. Since wind power is a part of the energy system, sensitivity variables are introduced on the average annual wind speed. The values are ±1 m/s of the value from the database, which is 6.48 and 8.48 m/s. The diesel price is assumed to increase, due to the projections, therefore an increase of approximately 10% and 20% is added to the sensitivity variables, which corresponds to 1.1 and 1.2 USD/L. For solar power, a ±1 kWh/ m2/day of solar irradiation is added.

4.6. Results

Several technically feasible energy system designs can be simulated. The sensitivity analysis reveals that optimal energy system design contains two wind turbines, Figure 8a–c. By visual inspection, the optimal energy system type that comprises two wind turbines are the most dominant. The capacity of the solar power and the battery storage varies, depending on the sensitivity variables. Except for the high wind and low solar irradiation scenario, where the optimal system design does not contain PV panels.
The optimal energy system design is listed in Table 10. Besides the existing energy technologies, an extra wind turbine is added and PV panels with a capacity of 386 kW. The battery storage has a storage capacity of 507 kWh, and the system inverter has a capacity of 258 kW. The COE is 0.161 USD/kWh, the NPC is 10.4 M USD, the initial capital cost is 3.44 M USD, and the renewable fraction is 71%.

4.6.1. Energy Efficiency and Demand Assessment

The estimated costs, for energy efficiency initiatives, are simulated without the sensitivity variables, due to the runtime of the simulation. Demand management initiatives will be simulated as additional percentages to the already assumed manageable demand.
The estimated costs of the energy efficiencies are compared with the optimal energy system design found in Table 10. Introducing 10% energy efficiency at no capital cost results in the optimal energy system highlighted in Table 11. The new optimal energy system has a COE of 0.158 USD/kWh and an NPC of 9.54 M USD.
Introducing 20% energy efficiency at no capital cost, to the optimal energy system (Table 10), results in the optimal energy system highlighted in Table 12. The optimal energy system has a COE of 0.152 USD/kWh and an NPC of 8.59 M USD.
In both cases, the second wind turbine of the optimal energy system design (Table 10) is excluded. However, an increase of the solar power capacity and the converter capacity are a result of the exclusion of the second wind turbine. The maximum cost for energy efficiency of 10% and 20% are calculated and listed in Table 13. A 10% energy efficiency can cost 0.86 M USD in NPC and a 20% energy efficiency can cost 1.81 M USD in NPC. The COE decreases with higher energy efficiencies.
Simulating the energy system with 10% additional demand management, the optimal system type remains the same as the optimal system type shown in Table 10. The energy system comprises the existing generators, two wind turbines, 427 kW PV panels, 526 kWh battery storage. The COE is 0.159 USD/kWh and the NPC is 10.3 M USD. The energy system is shown in Table 14.
With 20% additional demand management, the optimal system type remains the same, see Table 15. The energy system comprises the existing generators, two wind turbines, 302 kW PV panels, 356 kWh battery storage. The COE is 0.159 and the NPC is 10.25 M USD.
The values for COE and NPC from the two demand management simulations are listed in Table 16. The results are the 0.10 M USD and 0.15 M USD for the additional demand management at 10% and 20%, respectively.

4.6.2. Design Economics Assessment

The cost of living is obtained from the city of Perth, which is the city in Australia that is nearest to Rottnest Island. The cost of living per month is 1249 AUD [63] which is 924 USD (1 AUD = 0.74 [64]). The population is calculated with the visitors in 2010 and the inhabitants in 2011, assuming that the number of inhabitants was the same as in 2010. About 500,000 visitors in 2010 [65] and 114 inhabitants lived on the island in 2011 [66]. Assuming that the visitors stayed on average one week on the island, then 9615 visitors are permanently on the island. Together with the inhabitants, the total population of the island is 9729.
Simulations for the existing energy system and the planned transition of the energy system have been made for comparison reasons. The existing energy systems and the new energy systems are listed in Table 17, along with the COE, NPC, CO2-emissions, and the main differences between the systems. The new energy system with 20% energy efficiency is the overall best system with the lowest COE, NPC, and CO2-emissions.
The COE per capita is calculated with Equation (2), the results are divided by 12 months to match the resolution of the cost of living. The results are listed in Table 18. The COE as a percentage of the cost of living is also listed in the table. The new energy system with 20% energy efficiency has the lowest COE per capita per month.
All new energy systems are considered economically feasible. The COE can be further reduced by introducing energy efficiency initiatives, this will also positively impact the CO2-emissions. Whereas the additional demand management will only slightly decrease the COE and negatively impact the CO2 emissions. The new energy system has a lower COE and less CO2-emissions. It is noticeable that the average consumption per month per capita is approximately 43 kWh.

4.6.3. Design Proposition

The optimization result indicates the following system architecture: seven existing generators, 1200 kW wind power, 386 kW solar power, 507 kW battery storage and a 258 kW system converter. The COE is 0.161 $/kWh and the NPC of the energy system is 10.4 M$.
Figure 9 shows the power output for each type of generators. The diesel generators are in the top of the columns. Some of them have few operating hours, compared to the solar and wind power. Regarding the assessment of energy efficiency and demand management, when using the energy efficiency function in HOMER, it reduces the energy demand for every hour with a specified factor. Another approach could be to make a new demand profile where the energy efficiency is applied to the peak hours, this might result in greater potentials. This could also be investigated for the deferrable load profile, to move the demand from peak hours to off-peak hours.
By looking at the excess energy generation from the different systems in Figure 10, it can be seen how efficient the energy usage is. The new energy systems with energy efficiency have less excess energy, but still higher than the existing and planned energy system. The excess energy could also act as a promotor for demand management or response.
The initial capital costs for Rottnest Island is 3.44 M USD and the project costs were 4.38 M USD. Therefore, the proposed design has a lower cost than the planned system. The framework does not account for increased costs related to the expenditures for transport, grid expansion, spare part stockpile, local training etc.
By introducing energy efficiency initiatives, the COE and CO2 emissions can be reduced. Also, the introduction of additional demand management will reduce the COE slightly and the CO2 emissions will increase. This is illustrated in Figure 11, the values are inverted and normalized for better visual comparison. The further away the graph lines are from the middle, the more positive impact.

5. Conclusions

This paper proposed a framework for designing energy systems for small islands. The proposed framework is composed of several steps and decisions. It serves as a guide that the possible inputs are considered in the design architect to achieve an optimal solution for the problem, regarding the criteria (social, economic, technical, legal, regulation, etc.). Although the early processes depend on each application and need guidance from the problem formulation, the later steps start with “Optimal Energy System Simulation” and address the solution for the system with the consideration of optimization and assessment of each criteria.
Compared to the existing methodological framework design for microgrids (e.g., [6]), this paper proposed a specific framework applied for sustainable rural microgrids. The proposed solution does not define fixed assumptions or modeling approximations for each process and decision. Instead, the proposed framework is a generic tool and several solutions can be used for each process and decision operation. For example, in the case study, an optimization tool (HOMER) was selected to show the performance of the framework.
The case study shows that the design of energy systems for small islands can be significantly improved by applying this framework. In the case study, the proposed design consists of two 600 kW wind turbines, 386 kW solar power, a 507 kWh battery storage, and the existing diesel generators. The COE of the energy system design is 0.161 USD/kWh. This is lower than the existing energy system and the planned energy system, which is 0.207 USD/kWh and 0.170 USD/kWh, respectively. The CO2 emissions are reduced to 1086 t/year from 2469 t/year and 1665 t/year for the existing and planned energy systems, respectively.
The study mainly contributes to microgrid optimization for small islands from three aspects:
  • A framework for microgrid optimization;
  • Multi-objective optimization analysis through different aspects, taking socio-economic and technical criteria; and
  • Taking the inhabitants’ cost of living and inter-cultural aspects into consideration.
The proposed framework in this study is only tested in one island case study. In the future, case studies of more islands with different island types at different locations are recommended. Furthermore, other simulation software or mathematical models are recommended to support the general aspects of the framework.

Author Contributions

Supervision, B.N.J.; Writing—review & editing, A.Q.S., Z.M. and C.G.O.

Conflicts of Interest

The authors declare no conflict of interest.

References

  1. Ou, T.-C. Design of a novel voltage controller for conversion of carbon dioxide into clean fuels using the integration of a vanadium redox battery with solar energy. Energies 2018, 11, 524. [Google Scholar] [CrossRef]
  2. Ou, T.-C.; Hong, C.-M. Dynamic operation and control of microgrid hybrid power systems. Energy 2014, 66, 314–323. [Google Scholar] [CrossRef]
  3. World Energy Investment 2016. Available online: https://www.iea.org/newsroom/news/2016/september/world-energy-investment-2016.html (accessed on 15 July 2018).
  4. Herington, M.J.; van de Fliert, E.; Smart, S.; Greig, C.; Lant, P.A. Rural energy planning remains out-of-step with contemporary paradigms of energy access and development. Renew. Sustain. Energy Rev. 2017, 67, 1412–1419. [Google Scholar] [CrossRef]
  5. Wang, H.; Huang, J. Joint investment and operation of microgrid. IEEE Trans. Smart Grid 2017, 8, 833–845. [Google Scholar] [CrossRef]
  6. Kumar, A.; Singh, A.R.; Deng, Y.; He, X.; Kumar, P.; Bansal, R.C. A novel methodological framework for the design of sustainable rural microgrid for developing nations. IEEE Access 2018, 6, 24925–24951. [Google Scholar] [CrossRef]
  7. Jung, J.; Villaran, M. Optimal planning and design of hybrid renewable energy systems for microgrids. Renew. Sustain. Energy Rev. 2017, 75, 180–191. [Google Scholar] [CrossRef]
  8. Cao, T.; Hwang, Y.; Radermacher, R. Development of an optimization based design framework for microgrid energy systems. Energy 2017, 140, 340–351. [Google Scholar] [CrossRef]
  9. Wouters, C. Towards a regulatory framework for microgrids—The Singapore experience. Sustain. Cities Soc. 2015, 15, 22–32. [Google Scholar] [CrossRef]
  10. Diddigi, R.B.; Danda, S.K.R.; Narayanam, K.; Bhatnagar, S. A Unified Decision Making Framework for Supply and Demand Management in Microgrid Networks. Available online: https://arxiv.org/pdf/1711.05078.pdf (accessed on 15 July 2018).
  11. Young-Morris, G.; Abbey, C.; Joos, G.; Marnay, C. A framework for the evaluation of the cost and benefits of microgrids. In Proceedings of the CIGRÉ International Symposium, The electric power system of the future—Integrating supergrids and microgrids, Bologna, Italy, 13–15 September 2011. [Google Scholar]
  12. Johnson, B.; Davoudi, A.; Chapman, P.; Sauer, P. A Unified Dynamic Characterization Framework for Microgrid Systems. Electr. Power Compon. Syst. 2011, 40, 93–111. [Google Scholar] [CrossRef]
  13. Ton, D.T.; Smith, M.A. The U.S. Department of energy’s microgrid initiative. Electr. J. 2012, 25, 84–94. [Google Scholar] [CrossRef]
  14. Borlase, S. Smart Grids: Infrastructure, Technology, and Solutions; CRC Press: Boca Raton, FL, USA, 2016. [Google Scholar]
  15. Hatziargyriou, N. Microgrid: Architectures and Control; Wiley: Hoboken, NJ, USA, 2014. [Google Scholar]
  16. Schwaegerl, C.; Tao, L. Quantification of Technical, Economic, Environmental and Social Benefits of Microgrid Operation; Wiley: Hoboken, NJ, USA, 2013. [Google Scholar]
  17. Beard, L.M.; Cardell, J.B.; Dobson, I.; Galvan, F.; Hawkin, D.; Jewell, W.; Kezunovic, M.; Overbye, T.J.; Sen, P.K.; Tylavsky, D.J. Key Technical Challenges for the Electric Power Industry and Climate Change. IEEE Trans. Energy Convers. 2010, 25, 465–473. [Google Scholar] [CrossRef]
  18. Akinyele, D.O.; Nair, N.K.C.; Rayudu, R.K.; Chakrabarti, B. Decentralized energy generation for end-use applications: Economic, social and environmental benefits assessment. In Proceedings of the IEEE Innovative Smart Grid Technologies–Asia (ISGT ASIA), Kuala Lumpur, Malaysia, 20–23 May 2014. [Google Scholar]
  19. Microgrids: An assessment of the Value, Opportunities and Barriers to Deployment in New York. Available online: http://www.ourenergypolicy.org/wp-content/uploads/2013/08/10-35-microgrids.pdf (accessed on 15 July 2018).
  20. Baek, S.; Kim, H.; Chang, H.J. Optimal hybrid renewable power system for an emerging island of South Korea: The case of Yeongjong Island. Sustainability 2015, 7, 13985–14001. [Google Scholar] [CrossRef]
  21. Koroneos, C.; Michailidis, M.; Moussiopoulos, N. Multi-objective optimization in energy systems: The case study of Lesvos Island, Greece. Renew. Sustain. Energy Rev. 2004, 8, 91–100. [Google Scholar] [CrossRef]
  22. El-Leathey, L.-A.; Nicolaie, S.; Chihaia, R.-A.; Oprina, G. Technical economic analysis of a small-scale microgrid for a specific location. Electroteh. Electron. Autom. 2015, 63, 134–140. [Google Scholar]
  23. Nayar, C.; Tang, M.; Suponthana, W. A case study of a pv/wind/diesel hybrid energy system for remote islands in the republic of maldives. In Proceedings of the 2007 Australasian Universities Power Engineering Conference, Perth, Australia, 9–12 October 2007. [Google Scholar]
  24. Sachs, J.; Sawodny, O. Multi-objective three stage design optimization for island microgrids. Appl. Energy 2016, 165, 789–800. [Google Scholar] [CrossRef]
  25. Nasser, A.; Reji, D.P. Optimal Planning Approach for a cost effective and reliable microgrid. In Proceedings of the 2016 International Conference on Cogeneration, Small Power Plants and District Energy, Bangkok, Thailand, 14–16 September 2016. [Google Scholar]
  26. Zachar, M.; Trifkovic, M.; Daoutidis, P. Policy effects on microgrid economics, technology selection, and environmental impact. Comput. Chem. Eng. 2015, 81, 364–375. [Google Scholar] [CrossRef]
  27. Zachar, M.; Daoutidis, P. Understanding and predicting the impact of location and load on microgrid design. Energy 2015, 90, 1005–1023. [Google Scholar] [CrossRef]
  28. Neves, D.; Silva, C.A.; Connors, S. Design and implementation of hybrid renewable energy systems on micro-communities: Areviewoncasestudies. Renew. Sustain. Energy Rev. 2014, 31, 935–946. [Google Scholar] [CrossRef]
  29. Ma, Z.; Billanes, J.D.; ⊘rgensen, B.N.J. The island smart energy system and market. In Proceedings of the IEEE International Conference on Power and Energy (PECon), Melaka, Malaysia, 28–29 November 2016; pp. 369–400. [Google Scholar]
  30. Renewable Energies for Remote Areas and Islands (Remote). Available online: http://iea-retd.org/documents/2014/02/iea-retd-remote-project-sheet.pdf (accessed on 15 July 2018).
  31. Bui, V.-H.; Hussain, A.; Kim, H.-M. Optimal operation of microgrids considering auto-configuration function using multiagent system. Energies 2017, 10, 1484. [Google Scholar] [CrossRef]
  32. Hong, C.-M.; Ou, T.-C.; Lu, K.-H. Development of intelligent MPPT (maximum power point tracking) control for a grid-connected hybrid power generation system. Energy 2013, 50, 270–279. [Google Scholar] [CrossRef]
  33. Ou, T.-C.; Lu, K.-H.; Huang, C.-J. Improvement of Transient Stability in a Hybrid Power Multi-System Using a Designed NIDC (Novel Intelligent Damping Controller). Energies 2017, 10, 488. [Google Scholar] [CrossRef]
  34. Ou, T.-C. Ground fault current analysis with a direct building algorithm for microgrid distribution. Int. J. Electr. Power Energy Syst. 2013, 53, 867–875. [Google Scholar] [CrossRef]
  35. Rey-López, J.M.; Vergara-Barrios, P.P.; Osma-Pinto, G.A.; Ordóñez-Plata, G. Generalities about design and operation of microgrids. DYNA 2015, 82, 109–119. [Google Scholar] [CrossRef]
  36. Domenech, B.; Ferrer-Martí, L.; Lillo, P.; Pastor, R.; Chiroque, J. A community electrification project: Combination of microgrids and household systems fed by wind, PV or micro-hydro energies according to micro-scale resource evaluation and social constraints. Energy Sustain. Dev. 2014, 23, 275–285. [Google Scholar] [CrossRef] [Green Version]
  37. Hirsch, A.; Parag, Y.; Guerrero, J. Microgrids: A review of technologies, key drivers, and outstanding issues. Renew. Sustain. Energy Rev. 2018, 90, 402–411. [Google Scholar] [CrossRef]
  38. HOMER-Hybrid Renewable and Distributed Generation System Design Software. Available online: https://www.homerenergy.com/ (accessed on 15 July 2018).
  39. Rottnest Island Water and Renewable Energy Nexus project. Available online: https://www.hydro.com.au/docs/default-source/clean-energy/hybrid-energy-solutions/rottnest_island.pdf?sfvrsn=f2ad4828_2 (accessed on 15 July 2018).
  40. Rottnest Island. Available online: http://rottnestisland.com/ (accessed on 15 July 2018).
  41. Andaman Island—Indian Coast Guard Microgrid. Available online: http://goo.gl/JPLJmb (accessed on 15 July 2018).
  42. From Alcatraz to Africa—Operating a Solar Microgrid to Deliver 100% Island’s Energy. Available online: https://goo.gl/dkFuT2 (accessed on 15 July 2018).
  43. Could Richard Branson’s Microgrid Save Catalina Island? Available online: https://www.aiche.org/chenected/2015/09/could-richard-bransons-microgrid-save-catalina-island (accessed on 15 July 2018).
  44. Atlantic Island Deploys Technology to Green its Microgrid. Available online: http://www.abb.com/cawp/seitp202/c9bf245e74325758c1257c360055552f.aspx (accessed on 15 July 2018).
  45. Microgrids—Bringing Electricity to Rural Communities: Fair Isle. Available online: http://www2.ee.ic.ac.uk/daniel.mewton09/yr2proj/fairisle.htm (accessed on 15 July 2018).
  46. Global Sustainable Energy Starts on Korea’s Islands. Available online: http://koreajoongangdaily.joins.com/news/article/article.aspx?aid=3004894 (accessed on 15 July 2018).
  47. Gasado’s Microgrid Projects Future of Electricity. Available online: http://www.koreaherald.com/view.php?ud=20150603000860 (accessed on 15 July 2018).
  48. Leclanche, Graciosa Island Microgrid System. Available online: www.leclanche.com/markets-solutions/graciosa-project/ (accessed on 15 July 2018).
  49. Lord Howe Island Hybrid Renewable Energy System. Available online: https://arena.gov.au/projects/lord-howe-island-hybrid-renewable-energy-system/ (accessed on 15 July 2018).
  50. Northern Reliability. Available online: https://www.nothernreliability.com/project-profiles (accessed on 15 July 2018).
  51. Kort over vedvarende energi på Samsø. Available online: http://energiakademiet.dk/vedvarende-energi-o/ (accessed on 15 July 2018).
  52. Dockrill, P. This Island in American Samoa Is Almost 100% Powered by Tesla Solar Panels. Available online: https://www.sciencealert.com/this-island-in-american-samoa-is-almost-100-powered-by-tesla-solar-panels (accessed on 15 July 2018).
  53. Solar Microgrids For Fiji. Available online: https://www.engerati.com/article/solar-microgrids-fiji (accessed on 15 July 2018).
  54. Japanese Agency Gives Tonga Islands Solar Power Grid. Available online: http://borgenproject.org/japanese-agency-gives-tonga-islands-solar-power-grid/ (accessed on 15 July 2018).
  55. Rottnest Island-Google Maps. Available online: goo.gl/XebxNJ (accessed on 15 July 2018).
  56. Beere, N.; McPhail, D.; Sharma, R. A general methodology for utility microgrid planning: A Cairns case study. In Proceedings of the IEEE PES Asia-Pacific Power and Energy Engineering Conference (APPEEC), Brisbane, Australia, 15–18 November 2015; pp. 1–5. [Google Scholar]
  57. Regional Australias Renewables-Community and Regional Renewable Energy Program. Available online: https://arena.gov.au/assets/2017/05/RAR-CARRE-Information-Manual-1.pdf (accessed on 15 July 2018).
  58. Shahnia, F.; Moghbel, M.; Arefi, A.; Shafiullah, G.M.; Anda, M.; Vahidnia, A. Levelized cost of energy and cash flow for a hybrid solar-wind-diesel microgrid on Rottnest island. In Proceedings of the Australasian Universities Power Engineering Conference (AUPEC), Melbourne, VIC, Australia, 19–22 November 2017; pp. 1–6. [Google Scholar]
  59. Australia Diesel Prices, Liter. Available online: http://www.globalpetrolprices.com/Australia/diesel_prices/ (accessed on 24 April 2017).
  60. 20% Wind Energy by 2030—Increasing Wind Energy’s Contribution to US Electricity Supply. Available online: https://www.nrel.gov/docs/fy08osti/41869.pdf (accessed on 15 July 2018).
  61. Technology Roadmap—Solar Photovoltaic Energy. Available online: https://www.iea.org/publications/freepublications/publication/TechnologyRoadmapSolarPhotovoltaicEnergy_2014edition.pdf (accessed on 15 July 2018).
  62. Rottnest Island Western Australia 6161, Australien. Available online: https://goo.gl/EiAFu8 (accessed on 24 April 2017).
  63. NUMBEO, Cost of Living in Perth. Available online: https://www.expatistan.com/cost-of-living/perth-australia (accessed on 15 July 2018).
  64. XE Currency Charts: AUD to USD. Available online: goo.gl/nV3QsU (accessed on 15 July 2018).
  65. Rottnest Society Unhappy Despite Island’s Record Visitor Numbers. Available online: https://goo.gl/Akkt9K (accessed on 15 July 2018).
  66. 2011 Census QuickStats. Available online: http://quickstats.censusdata.abs.gov.au/census_services/getproduct/census/2011/quickstat/0 (accessed on 15 July 2018).
Figure 1. Microgrid benefits [14] (* If owners of the micro-generation capability are neither DSO nor consumer).
Energies 11 02832 g001
Figure 2. Microgrid Design framework flowchart.
Energies 11 02832 g002
Figure 3. Demand profile considerations.
Energies 11 02832 g003
Figure 4. Energy technology selection considerations.
Energies 11 02832 g004
Figure 5. Rottnest Island location [55].
Energies 11 02832 g005
Figure 6. Renewable energy resources: (a) Solar global horizontal radiation; (b) Wind Speed.
Energies 11 02832 g006
Figure 7. Microgrid distribution network topology.
Energies 11 02832 g007
Figure 8. Sensitivity analyses; (a) Wind and diesel; (b) Solar and diesel; (c) Wind and solar.
Energies 11 02832 g008
Figure 9. Monthly power output by type.
Energies 11 02832 g009
Figure 10. Excess of electricity.
Energies 11 02832 g010
Figure 11. Comparison of COE and CO2-emissions for the different energy systems.
Energies 11 02832 g011
Table 1. Examples of fixed and variable constraints.
Fixed ConstraintsVariable Constraints
Min. reliability100%
Min. RE share 50%
Emissions limit(s)
CO2Max 100 t/year
Geographic constraint(s)
Area limitMax 100 m2 for PV
Table 2. Social, economic, and technical evaluation criteria.
CriteriaDescription
SocialManagementEase of managing the electrification system inside the families and among them.
EquityEquality in the amount of electricity supplied to each family.
Household benefitsImprovements in the quality of life of the families and their incomes.
Community servicesElectrification of the community services (school, health center, church)
Productive activitiesGeneration of local jobs thanks to the development of productive activities.
Impact on local resourcesLand covered by the installed equipment
Clean energyRenewables with the variable generation or hybrid
EconomicInvestmentThe initial investment, operation, and maintenance costs.
TariffThe effort of consumers to pay the tariff for the electricity.
SubsidiesFinancial aid or support granted by the state or public/private authorities.
Fuel savingsReduced losses, combined heat, cooling, and power, etc.
Ancillary servicesCongestion relief, frequency regulation, reactive power, and voltage control, etc.
TechnicalApplicationCampus/Institutional, Military, Residential, Remote, and/or Rural areas
Supplied energyAmount of energy and power supplied to each family.
Continuity of the resourcesReliability of the used energy resources and autonomy of the batteries.
FlexibilityExpandability of users and increase in consumption
Local replacementAssistance to repair equipment failures.
Local manufacturingThe proximity to the places where the equipment is manufactured.
Energy SecuritySystem reliability in the event of failures: equipment, severe weather, cascading outages, cyber and physical attacks.
Legal & RegulatoryRegulatory issuesState or private regulation
InterconnectionDeregulation of small power producers, Load aggregator
Utility regulationRegulation by public or private authorities
Table 3. Analyzed cases.
Name of IslandCharacteristic
Andaman & Nicobar Islands [41]Insufficient data
Annobon Island [42]<10 MW, Off-grid
Catalina Island [43]<10 MW, Off-grid
Faial Island [44]>10 MW
Fair Isle [45]Insufficient data
Gasa Island [46]<10 MW, Off-grid
Gasado Island [47]<10 MW, Off-grid
Graciosa Island [48]<10 MW, Off-grid
Lord Howe Island [49]<10 MW, Off-grid
Naushon Island [50]<10 MW, Off-grid
Rottnest Island [40]<10 MW, Off-grid
Samsø Island [51]>10 MW
Ta’u Island [52]<10 MW, Off-grid
Three Fijian islands [53]<10 MW, off-grid. However, a lot of assumptions
Tonga Island [54]Insufficient data
Table 4. Current Rottnest Island project details.
ParameterDescription
Annual Demand5 GWh
Low-Load Diesel Generators2 × 320 kW
Diesel generators5 × 300 kW
Wind Turbine600 kW, covering 30% of annual demand
Project Value In 2016$6,510,000
Table 5. Future Rottnest Island project details.
ParameterDescription
Solar Power PlantPlanned installation of a 600 kW
Reduce diesel fuel consumption 45%
Desalination PlantRun on RE technologies
Table 6. Fixed and variable constraints in Rottnest Island.
Constraint TypeFixed ConstraintsVariable Constraints
Min reliability100%
Min RE share55%
Table 7. Estimated demand management initiatives for Rottnest Island.
Demand Management InitiativesManageable Demand [Kwh/Day]Peak Load [Kw]Lifetime
Desalination plant and water storage5000100025%
Table 8. Maximum capacities of energy technologies.
Generation TypeMax.
Fuel Generatorpeak demand
Wind Turbine5 MW/km2
Solar Panels0.16 kW/km2
Batteriesaverage daily consumption
Table 9. Energy technologies and storage systems.
CategoryComponentsCapacity [kW]QuantityInvestment [$]O&M
Diesel generatorDanvest–Low-load hybrid131245,8502.62 $/h
Diesel generatorKohler–Standby360348,0002.00 $/h
Diesel generatorFixed Capacity300240,0002.00 $/h
Solar PVGeneric flat plate3861249319 $/year
StorageGeneric Li-Ion Battery50723009 $/year
ConverterGeneric Converter25823000 $/year
Wind TurbineVestas V4760022,250,60018,600 $/year
Total2542142,347,583
Table 10. Most optimal energy system design.
Diesel Gen PV
[kW]
Wind Turbine
[unit]
Battery
[kWh]
Converter
[kW]
COE
[$]
NPC
[M$]
Initial Capital
[M$]
O&M
[$]
Ren Frac
[%]
7 (1945 kW)38615072580.16110.43.44536,15271
7 (1945 kW)1113 8086820.16310.53.22563,64168
7 (1945 kW)3661 2930.16310.53.25562,47169
7 (1945 kW) 119773.80.16410.62.33637,29163
7 (1945 kW) 1 0.16410.62.25646,82063
7 (1945 kW)1031 7690.16510.62.80607,16364
Table 11. Optimal system types with 10% energy efficiency.
Diesel Gen PV
[kW]
Wind Turbine
[unit]
Battery
[kWh]
Converter
[kW]
COE
[$]
NPC
[M$]
Initial Capital
[M$]
O&M
[$]
Ren Frac
[%]
7 (1945 kW)1023 6736570.1589.542.95509,90369
7 (1945 kW)37815234270.1609.663.48478,06873
7 (1945 kW)962 7620.1609.682.63545,59766
7 (1945 kW) 121077.50.1619.722.34571,22466
7 (1945 kW) 1 0.1619.772.25581,65165
7 (1945 kW)4411 4610.1629.813.49489,33372
Table 12. Optimal system types with 20% energy efficiency.
Diesel Gen PV
[kW]
Wind Turbine
[unit]
Battery
[kWh]
Converter
[kW]
COE
[$]
NPC
[M$]
Initial Capital
[M$]
O&M
[$]
Ren Frac
[%]
7 (1945 kW)933 5756110.1528.592.68457,38670
7 (1945 kW)838 6600.1558.742.29499,41467
7 (1945 kW)46616513250.1588.913.71402,56677
7 (1945 kW) 121897.50.1588.912.35507,87768
7 (1945 kW) 1 0.1598.962.25518,72167
7 (1945 kW)2911 2290.1598.963.04457,95272
Table 13. Maximum energy efficiency cost of 10% and 20% energy efficiency.
COE [USD/kWh]NPC [M USD]Max. EE Cost [M USD]
Energy Efficiency0%0.16110.40
Energy Efficiency10%0.1589.540.86
Energy Efficiency20%0.1528.591.81
Table 14. Optimal system types with 10% additional demand management.
Diesel Gen PV
[kW]
Wind Turbine
[unit]
Battery
[kWh]
Converter
[kW]
COE
[$]
NPC
[M$]
Initial Capital
[M$]
O&M
[$]
Ren Frac
[%]
7 (1945 kW)42715263000.15910.33.56521,44772
7 (1945 kW)2691 1990.16210.42.98576,71268
7 (1945 kW)1079 8586590.16210.53.15565,63567
7 (1945 kW) 118070.10.16210.52.33632,02264
7 (1945 kW) 1 0.16310.52.25640,77763
7 (1945 kW)957 6960.16410.62.59619,21863
Table 15. Optimal system types with 20 % additional demand management.
Diesel Gen PV
[kW]
Wind Turbine
[unit]
Battery
[kWh]
Converter
[kW]
COE
[$]
NPC
[M$]
Initial Capital
[M$]
O&M
[$]
Ren Frac
[%]
7 (1945 kW)30213562120.15910.33.17547,40370
7 (1945 kW)3631 2750.16010.43.24551,10069
7 (1945 kW)1057 4427300.16110.42.99572,01366
7 (1945 kW) 117671.40.16110.42.32625,25464
7 (1945 kW) 1 0.16210.52.25634,55763
7 (1945 kW)946 6770.16310.52.56616,25063
Table 16. Maximum demand management cost with an additional 10% and 20%.
COE
[USD/kWh]
NPC
[M USD]
Max. DM Cost
[M USD]
Demand management0 %0.16110.40
Demand management+10%0.15910.300.10
Demand management+20%0.15910.250.15
Table 17. Comparison list with the different optimal energy system types.
COE
[USD/kWh]
NPC
[M USD]
CO2-Emissions
[t/year]
Wind Turbine
[600 kW]
PV
Capacity
[kW]
Battery Storage
[kWh]
Existing energy system0.20713.3562469100
Planned energy system0.17010.986166516000
New energy system0.16110.37210862386507
New energy system EE 10%0.1589.539108711023673
New energy system EE 20%0.1528.5949651933575
New energy system DM +10%0.15910.3010522427526
New energy system DM +20%0.15910.2511352302356
Table 18. List of COE per capita per month and the percentage of the cost of living.
COE/Capita/Month
[USD]
Percentage of Cost of Living [%]
Existing energy system8.870.96
Planned energy system7.280.79
New energy system6.900.75
New energy system EE 10%6.770.73
New energy system EE 20%6.510.70
New energy system DM 10%6.810.74
New energy system DM 20%6.810.74

