Abstract
The cleaning effect of heavy rain (the rainfall reaches 5 mm every day) on surface contamination of insulators is more effective than dew, fog, mist, and other light rain conditions which can initiate leakage currents and increase the likelihood of flashover. It is well understood that heavy rain can wash away contamination from the surface of high voltage (HV) insulators and thereby reduce the risk of pollution flashover. This study examines the cleaning effect of natural wetting conditions on HV insulators on four 500 kV transmission lines in Hunan Province, China. Historical meteorological data, monthly equivalent salt deposit density (ESDD) and non-soluble deposit density (NSDD) measurements taken over a period of five years were analyzed to investigate the relationship between rainfall intensity and insulator cleaning. The measured data show that the ESDD/NSDD changes with the seasonal variation, which accumulates in dry season (January–April, about 117–122 days) and is washed off in the wet season (June–October, about 118–127 days). According to the measured data, the ESDD and NSDD on the surface of insulators were affected by the rainfall intensity (in the dry season it is about 1 mm/day and in the wet season it is about 5 mm/day). Based on a comparison of the four study sites, we propose a mathematical model to show the functional relationship between rainfall intensity and insulator self-cleaning capability. The mathematical model’s coefficient of determination (R2) is greater than 0.9 and the effective rate of self-cleaning capability reaches 80%.
1. Introduction
It is well understood that airborne contamination can strongly influence the voltage that HV insulators can withstand [,,]. Therefore, accurate measurement and prediction of natural contamination on insulator surfaces is important for taking the appropriate measures to prevent pollution flashover in power systems. Some examples of typical pollution environments are defined as follows: marine environments, industrial environments, agricultural environments, and desert environments, since there is the release of some pollution, like marine salts, inert dust, and high degrees of salt. These environments may appear alone or in some combination. The winter environment, especially concerning the period with low absolute humidity, dusty, windy and exposure to sand and salt (from road salting) is most similar to the desert environment. This means that some seemingly illogical combinations, such as agricultural and desert conditions, do occur in winter in some areas [,,]. Due to the high accumulation rates of natural contamination from industry and agriculture on insulator surfaces in Southern China during the winter months, an insulator cleaning program has been devised for transmission lines in the region [,]. However, the cleaning scheme is always carried out in December and only once for every year, therefore it is not very effective and the insulator surface could not maintain cleanliness for the whole year. The accumulation of contamination will increase with the air pollution after a few months. Thereby, it endangers the safe operation of power networks.
The accumulation of contamination is mainly divided into two processes: contamination of HV insulators is highest during the dry season and lowest during the wet season, when rainfall efficiently removes some of the surface contaminants [,]. At present, the research mainly focuses on the pollution accumulation process, studies on air quality index (AQI), size and gravity of particles, wind speed, electric field intensity, and the force of adhesion, etc. [,]. However, there have been few studies on the effect of rainfall flushing. The existing research relies on artificial rainfall experiment platforms [,,,]. However, artificial pollution tests on outdoor insulators mostly consider the parameters of ideal conditions and the test results are not in conformity with reality. Therefore, it is very important to research the cleaning effect of the natural rainfall, which can be used to predict the pollution degree and provides a reference for the electric power departments to clean the external insulation of transmission lines.
In Southern China, the rainfall always happens in summer months (April to August, about 90 rain days). During the season, the pollution on the surface decreases due to the rainfall. In some special geographies such as the coastal areas and islands, the rainfall intensity need reach above 4.0 mm/day, it is able to largely and significantly affect the contamination on the outdoor insulator. In [], the coastal and island meteorological conditions were considered and a mathematical model was introduced, which is used to predict pollution performance of insulators on islands under similar conditions. The Egypt electric power company have selected six regions in Northern Egypt of different types of pollutants to monitor. The study was conducted through measurements of: equivalent salt deposition density (ESDD), surface conductivity, maximum leakage current and flashover voltage. The results are useful to assess the insulation performance in different environmental situations and to improve the design, if necessary, and finally to propose an updated pollution map in Northern Egypt []. A paper by Ahmad et al. [] proposes a new relationship of ESDD with six meteorological variables: temperature, humidity, pressure, rainfall, wind speed, and wind direction. Multiple linear regression techniques have been used to predict ESDD from these six relevant meteorological parameters. A paper by Allister et al. [] proposes specific data in terms of ESDD and the pollution index of the Dhahran test site are presented, including significant meteorological parameters (ambient temperature, relative humidity, quantity of rainfall, pressure, wind speed and wind direction). Quantity of rainfall appears to be the most influential meteorological parameters responsible for self-cleaning. However, the underside of insulators, especially those of anti-fog insulators with deep ribs that are less exposed to wetting, remain relatively un-cleaned. A paper by Lin et al. [] investigates the influence of insulator shed profiles on insulator contamination performance in heavy industrial contamination areas in Shanghai of China.
This paper investigates the role and characteristics of natural rainfall in reducing the surface pollution on HV insulators. Then, for the important and specific pollution sources, such as the industrial, local agriculture, transportation, or geographic conditions, the suitable exponential model of salt losses is considered, which can effectively verify and predict the insulator surface pollution characteristics. According to the large number of historical and measured data during the five years, we provide an analysis of the data that will aid power system operators to decide when or whether to initiate insulator cleaning during winters in Southern China.
2. Experimental Setup
2.1. Test Locations
To study the effect of natural rainfall flushing on the accumulated pollution, the natural contamination tests were carried out in Hunan Province and the de-energized glass standard disc insulators of four 500 kV transmission lines were selected. The specimen insulators were installed on the cross-arm near the transmission lines, which had a distance of 500 mm–600 mm from the transmission tower. In each selected area, five adjacent transmission line towers were installed with about 50 pieces of insulators to study the pollution accumulation on the insulator surface (shown in Figure 1). The process of pollution accumulation has been analyzed and the data have been measured for each month from 2011 to 2015. The structural parameters of the insulator are presented in Table 1. Before the experiment, all of the insulators were cleaned up and naturally dried in a clean place.
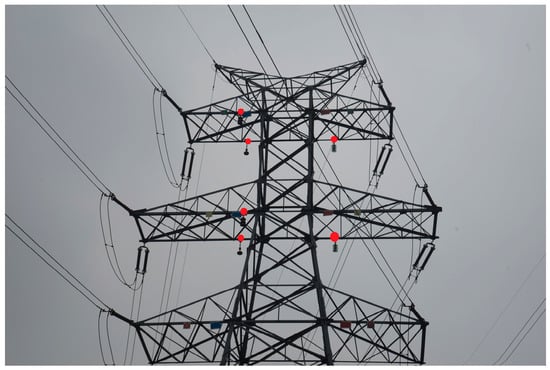
Figure 1.
Layout of experimental point (in 500 kV transmission tower).

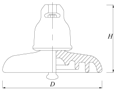
Table 1.
Main parameters and profile of insulator tested.
2.2. Meteorological Condition
To decide the effect of rainfall, the major sources of pollution around the test area, and the pollution level were considered. In this condition, the He-Yun II line, Xing-Yun line, Chuan-Gu I line, and Gu-Xing I line were firstly selected (shown in Table 2). Figure 2 indicates the average air quality index for every month, which includes the main air pollutant, particulate matter (PM10), followed by SO2, and 30% of the total months from 2011 to 2015 reach or exceed the level of slight pollution. As shown that the air quality is very serious in the winter season and the rainfall in the wet summer season helps to clear up the air pollution. The test sites are situated in South China, and it has four distinct seasons: a significant amount of rainfall at the end of spring and the beginning of summer (the rainy weather reached more than 800 days); and drought at the end of summer and autumn. Figure 3 shows the average amount of rainfall for every month in 2011–2015. Illustrated in the figure, the main rainy season lasts from April to October, while the dry season is from November to January of the next year (this data come from the local meteorological statistical departments). The weather in spring (February, March, and April) is changeable and wet; more sunny days in summer (May, June, and July) and autumn (August, September, and October). The annual average temperature in Hunan is about 17 °C (63 °F).
Table 2.
Information of the experimental sites.
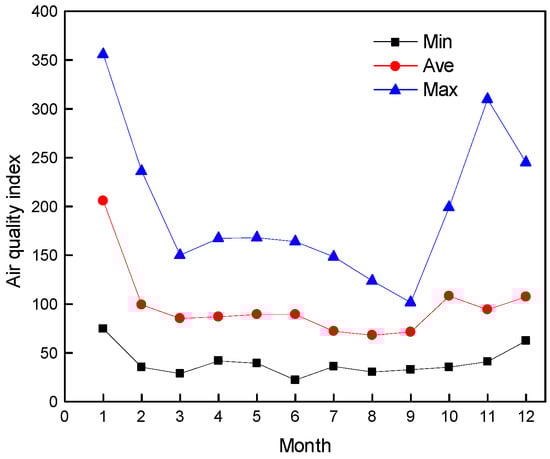
Figure 2.
Average air quality index for each month in 2011–2015 (Hunan Province).
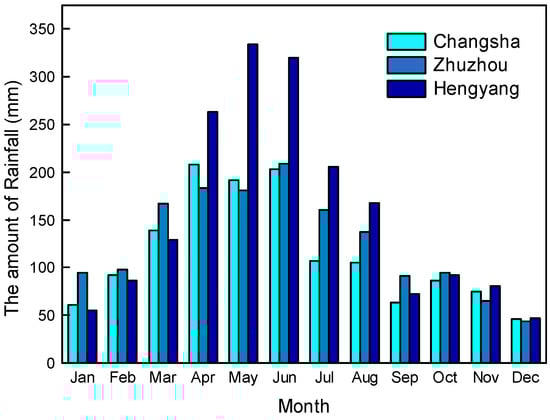
Figure 3.
Average monthly rainfall for five years (2011–2015).
By comparing the air quality index (AQI) with average rainfall, the level of high pollution always appears in winter when the rainfall days are fewer and the intensity of rainfall is light. Therefore, the rainfall is the main factor influencing the AQI.
2.3. ESDD and NSDD Measured Method
The samples were polluted by the natural environment. Before pollution, all samples were carefully cleaned so that all the traces of dirt and grease were removed. The samples were then dried naturally. The ESDD/NSDD were obtained by weighing a dried filter paper, pouring a sample of insulator wash water through it, then redrying and reweighing the filter. The conductivity and the temperature of the water containing the pollutants gives the ESDD. The change in weight (in mg or μg) divided by the surface area wiped (in cm2) gives the NSDD. The details for the measuring procedure are fully described in Annex C of IEC Standard 60815 (2008) [].
The insulator strings were hung on the left and right sides of towers, the contamination on the second to the forth insulator units were measured. The test time was from 2011 to 2015, and contamination was measured on the 28th of every month.
3 Results and Discussion
3.1. Seasonal Variation
3.1.1. ESDD/NSDD Trends during Different Periods of the Year
According to the Figure 2 and Figure 3, the data show that the airborne contamination which is present in the atmosphere are seasonally dependent, where the majority of contamination accumulates during the drier winter months (January–April) and is washed during the wet summer months (June–October). The average values of the measured ESDD and NSDD between 2011 and 2015 also show seasonal variation: contamination accumulates in the dry season and is washed off in the wet season. Therefore, the contamination deposit densities change with the amount of rain, as shown in Figure 4a–e.
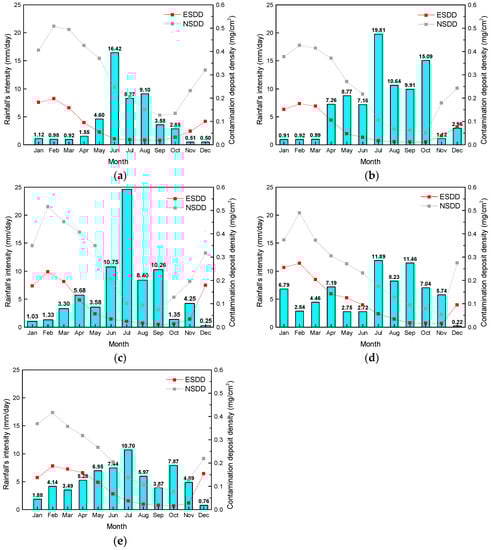
Figure 4.
Averaged monthly rainfall intensities and corresponding contamination deposit densities for each year (a) 2011; (b) 2012; (c) 2013; (d) 2014 and (e) 2015 in the test period (He-Yun Line).
In Figure 4a–e, the ESDD and NSDD reach the peak value (ESDD/NSDD maximum data from Table 3) in February during the period from 2011–2015. At the same time, the rainfall intensity is very small (about 0.91 mm/day~4.0 mm/day) in this month. Then, the wet season (starts from March) comes and the extreme value of the average monthly rainfall intensities appears in June or July. The value of ESDD reaches the lower level (about 0.015 mg/cm2) in these months. However, the NSDD does not reach the least value, it still decreases until the rainy season is over in September or October. The least NSDD value is 0.05 mg/cm2~0.12 mg/cm2.
Table 3.
The extreme values in Figure 4 (during 2011–2015).
By comparing the two years (2012–2013) with other years, the effect of rainfall with heavy intensity and long duration directly flushing out the NSDD was more obvious. Since there were more heavy rainy days in the summer during the two years (19.81 mm/day and 24.61 mm/day). The changes of ESDD and NSDD also reflected the relationship between contamination and rainfall intensity.
Based on statistics of actual rainfall, ESDD and NSDD during 2011~2014, the variation trend of ESDD/NSDD with the duration and season in 2015 is predicted. As shown in Figure 5, the predicted values are fitted with the actual values in 2015. The curves show that the air pollution concentration is higher and it promotes the particle accumulation on the insulator surface from October to February in next year. Thus, the actual value and predicted value all reach the maximum (ESDD: 0.187 mg/cm2 and 0.214 mg/cm2, NSDD: 0.416 mg/cm2 and 0.470 mg/cm2). Then, the actual value and predicted value all reach the minimum during the rainfall season from March to October in 2015 (ESDD: 0.016 mg/cm2 and 0.018 mg/cm2, NSDD: 0.077 mg/cm2 and 0.083 mg/cm2).
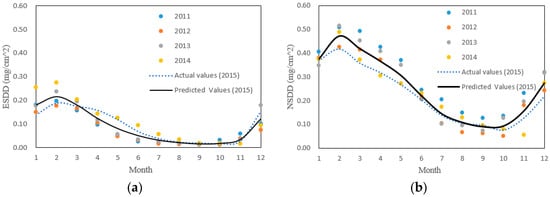
Figure 5.
Comparison of predicted values (a) ESDD and actual values (b) NSDD in 2015 (He-Yun Line).
According to the ESDD and NSDD trend during different periods of the year, the trend of the ESDD/NSDD value basically met the rule of seasonal variation.
3.1.2. Comparison of ESDD/NSDD Levels at Different Time of the Year
Due to the different washing effects of rainfall intensity on the surface contamination of insulators, the washing effect is different on ESDD and NSDD. The variations trend of ESDD and NSDD were studied, Figure 4b shows that NSDD decreases significantly while the change of ESDD is smaller during the rainy season. The value of NSDD declined 75% and the value of ESDD only declined 50%. Because the ESDD was washed in the initial phase of rain days in April to May and the maximum value of ESDD is smaller than the maximum value of NSDD in the February. Therefore, the value of NSDD is faster declined than the value of ESDD. Generally, the value of ESDD appears to trend downward in March, when the rainfall intensity is not strong. From June to July, the rainfall intensity is strong, but the ESDD decreases gently, while during August to September the ESDD is almost unchanged. The value of ESDD reaches the balanced value and the value (about 0.01 mg/cm2). Since the upper piece of the insulator has sheltered the one below, the residual contamination is not easy to be washed-off by rainfall. In the initial period of rainfall, the NSDD decreased gently with the rainfall duration. From April to July the variation trend is very clear. In the later rainy season, the NSDD still decreased, but the effect of wash-off is not obvious. This is because the effect of weather on the NSDD lags behind that of the ESDD.
It can be seen from the above experiment results that, the soluble pollution was flushed at the initial phase of rainfall, and was taken away by the run-off, which formed on the surface of the insulator. Even with small amounts of rainfall, the soluble pollutants can be cleaned effectively. Meanwhile, the wash-off law of insoluble pollutants was different, which can only be washed off by the mechanical force of the moving water and washed away when the surface run-off rate reaches the relevant speed. In other words, the wash-off of insoluble pollutants needs enough rainfall intensity. The main component of ESDD are soluble pollutants and NSDD are insoluble pollutants. Therefore, the ESDD was not only soluble in water, but also suffers from the mechanical force of rainfall during the wash-off process.
3.1.3. The Effect of Washing in Different Test Sites
In order to investigate the insulator natural contamination trend under different physiognomies of test sites, the ESDD/NSDD values on the four typical of pollutions were measured in 2014. On the basis of the ESDD and NSDD test data, the results show that different areas have different cumulative contamination features.
Comparative analysis has been conducted on contamination data based on the four 500 kV transmission lines (as shown in Figure 6). It is easy to determine that, in the four sites, the contamination in the industrial area (Figure 6c) is more serious (the maximum of ESDD and NSDD are 0.658 mg/cm2 and 0.410 mg/cm2) than other test sites, and the carbon emissions/particulate matter from automobile traffic on a nearby highway in the He-Yun line (transportation) is the second most serious (the maximum of ESDD and NSDD are 0.50 mg/cm2 and 0.31 mg/cm2). The two areas have a common feature, in that the pollution accumulation on the HV insulators has a sharp increase in NSDD and ESDD during the dry season. When the wet season (June–October about 118–127days) is coming, there is a sharp decrease in NSDD and ESDD. Figure 6d shows that there are fewer contamination sources in the geographic condition (the maximum of ESDD and NSDD are 0.358 mg/cm2 and 0.250 mg/cm2) than other sites. However, the contamination decreased gently over the rainfall duration. Since, in the geographic condition, the transmission lines run across forests and mountains, the surrounding environment can greatly weaken the cleaning effect on salt, and the NSDD/ESDD value still reaches 0.4 mg/cm2 and 0.28 mg/cm2, respectively. As shown in Figure 6b, the contamination level in local agriculture conditions (the maximum of ESDD and NSDD are 0.41 mg/cm2 and 0.256 mg/cm2) is in the middle for the four test sites, the main source are fertilizers and soil particles from nearby farmland. Therefore, the power department should make different insulator cleaning plans with different types of pollution found at each site.
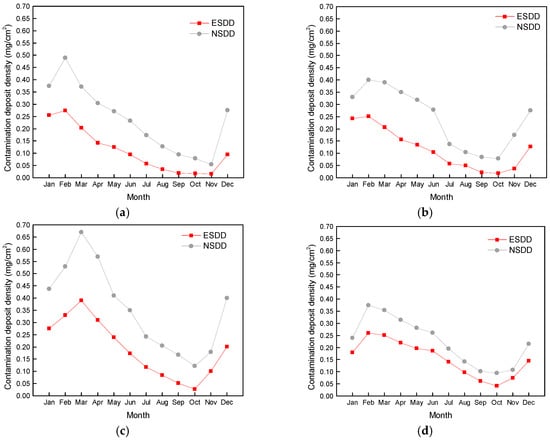
Figure 6.
The contamination deposit densities for 2014 in different test sites: (a) He-Yun (Transportation); (b) Xing-Yun (Local agricultural); (c) Chuan-Gu (Industrial) and (d) Gu-Xing (Mountainous region).
3.2. The Influence of Rainfall Intensity to Flush
The contamination accumulation process on insulators shows seasonal variation. During the washing process, the washing effect of rainfall intensity on surface contamination of insulators was useful. According to the measured contamination data of the four test sites, the values of ESDD and NSDD from February to September were selected to study the effect of washing in 2012. During the wet season, the rainfall intensity increased with the months and the degree of contamination was affected by the rain wash-off. Several experimental data results show how the residual contamination deposit densities change with rainfall intensity, as shown in Figure 7.
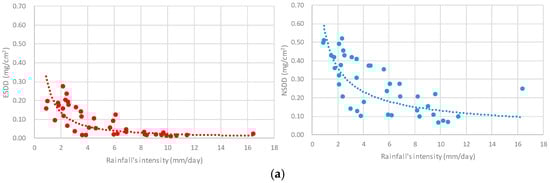
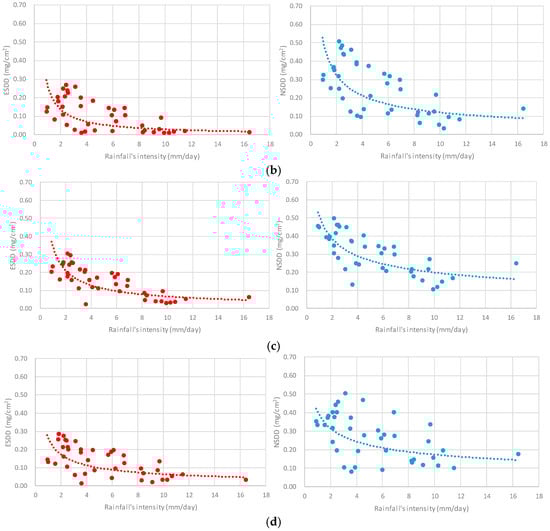
Figure 7.
Residual contamination and rainfall’s intensity for all four test sites (a) He-Yun; (b) Xing-Yun; (c) Chuan-Gu and (d) Gu-Xing for 2012.
In Figure 7a–d, the washing effect on insulators contamination is mainly effective in the initial rainfall. The residual contamination deposit densities diminish largely when rainfall intensity is still at a relatively low level (range from 1.5 mm/day to 4.0 mm/day), especially in He-Yun transmission line and Xing-Yun transmission line (Figure 7a,b). The value of ESDD decreases from 0.35 mg/cm to 0.10 mg/cm and the value of NSDD decreases from 0.45 mg/cm2 to 0.21 mg/cm2 during the low rainfall intensity, then diminish in a small range with increasing rainfall intensity. Finally, the ESDD and NSDD stop changing after the rainfall intensity reaches a high level (about 10 mm/day). The four test sites’ data all show that the value of ESDD and NSDD is very small (only 0.012 mg/cm2 and 0.10 mg/cm2, respectively) when the intensity reaches 10 mm/day. Therefore, the value of rainfall intensity is the common threshold across all sites. The intensity of rainfall of 10 mm/day is regarded to be the standard value, and it helps the power department to measure the effective rainfall days for every month.
Based on the measured values in the four test sites, the functional relationship between the intensity of rainfall and measured value was obtained by the curve fitting, as:
where MESDD and MNSDD are the ESDD and NSDD values in the February; and a and b represent the test sites’ respective washing rates.
By comparing the data from ESDD and NSDD, the residual contamination trends are stable with the increase of rainfall intensity. Through the treatment and analysis of a lot of test data, the relationship between rainfall intensity and pollution on the surface was obtained. Thereby, measuring the rainfall intensity can effectively predict the level of pollution and the trend of accumulated contamination during the rainy season.
3.3. Pollution Wash-Off Model
The wash-off model is based on the following first-order equation describing the pollutant mass remaining on a surface at time t after rainfall:
where M represents the pollutant mass on the insulator surface per unit area (mg/cm2); c represents the transport coefficient (cm−1); k represents the average event rainfall intensity (mm/day). By integration M = M0e−ckt is the pollution mass after the accumulation of contamination where M0 is the initial mass on the surface per unit area at t = 0. Thus, the rate of mass per unit area removal M is:
Equations (3) and (4), or similar equations, were formulated by Sartor and Alley [,,,]. In order to simplify the model, the area was assumed to be completely cleaned by the previous rain (all of the insulators were cleaned and naturally dried in a clean place).
The effect of rainfall intensity on the washing surface and umbrella skirt edge of insulators is completely satisfied by washing modeling verified by experiment [,]. The residual wash-off ESDD and NSDD on the surfaces of insulators decreases with the intensity and duration of the rainfall, which meets the power function, exponential function, or other functions. The results show that the pollution wash rate has a positive correlation with the quantity of pollutants:
where, Mt is the pollutant mass on the insulator surface per unit area (mg/cm2); M0 is the initial mass on the surface at t = 0; C is the transport coefficient; k is the average rainfall intensity (constant); and t is the duration of rainfall (the duration of rainy days in every month). With this formula, the pollution mass exponentially decays with the duration and rainfall intensity.
According to Equations (1)–(5), the fitting parameters about the rule of wash-off on the insulator surfaces were obtained. As shown in Table 4, the fitting results (coefficient of determination, R2) noted that salt losses with cleaning duration and rainfall intensity fitted to the exponential function. At the same time, the exponential model reflects that the residual contamination deposit densities decrease significantly when the rainfall duration is within a certain value, and tends to be stable after that. Table 4 shows that the pollution transports with the rainfall intensity coefficient ck for ESDD is close in each year, and based on the R2 value, the fitting results are reasonably good with most R2 > 0.90. During the washing process for every year, the relation coefficients are directly affected by the data of average rainfall, rainy days, and rainfall intensity. Therefore, the coefficients determine the effect of rainfall wash-off of the contamination on the surface of insulators. For NSDD, the effect of heavy intensity and long duration rainfall directly flushing out the NSDD was very obvious during the two years (2012 and 2013). On the other hand, it is possible that the low rainfall intensities observed during the winter months accelerate the pollution accumulation by forming multilayered water (and entrained pollution) films on the insulator surface. Although, the relation coefficient is not very close and the fitting result is not very good. The trend of the cleaning pollution is satisfied with the rule of wash-off on the insulator surface.
Table 4.
Fitting results of the cleaning model of insulators.
Based on the data of ESDD and NSDD, the cleaning model of insulators was established. The model can be used to predict the variation trend of contamination on the surface and a time plan regarding when to clean the insulators in the future is put forward as well.
4. Conclusions
The test observation in Hunan Province lasted for five years and the experiments have been carried out to study the washing effect of rainfall intensity. From the investigation, the major results can be summarized as follows:
(1) Based on the historical meteorological data, monthly equivalent salt deposit density (ESDD), and non-soluble deposit density (NSDD) measurements taken over a period of five years, the contamination accumulating on the surface of insulators presents seasonal changes: contamination accumulates in the dry season (January–April) and is washed off in the wet season (June–October).
(2) The effects of rainfall on flushing the ESDD and NSDD are very different. The main component of ESDD are soluble pollutants which suffer from the mechanical force of rainfall. Meanwhile, the main components of NSDD are insoluble pollutants, which are only influenced by mechanical splashing. Thus, the measured NSDDs change more slowly than the ESDDs with the increasing rainfall intensity and duration.
(3) By analyzing the contamination data of 2014 on the term of ESDD and NSDD, the result of the primary contamination law has been determined. In the four test sites, the contamination in industrial areas is more serious than other test sites and there are fewer contamination sources in these geographic conditions than in other sites.
(4) Based on the functional relationship between the rainfall intensity and measured value, the residual ESDD and NSDD decrease with increasing rainfall intensity and a rapid decline takes place at a relatively low level of rainfall intensity and then diminishes in a small range with increasing rainfall intensity. Therefore, the washing effect of insulator contamination mainly works during the initial period of rainfall.
(5) Based on the data of ESDD and NSDD, the cleaning model of insulators was established.
Overall, upon monitoring rainfall intensities throughout the year, and knowing background ESDD/NSDD levels, the proposed model can provide operator decision support to decide if, or when, we need to clean contaminated insulators.
Acknowledgments
This research work is supported by Funds for innovative Research Groups of China (51021005) and science and technology project of States Grid Corporation of China (SGTYHT/14-JS-188).
Author Contributions
Zidan Jiang organized the experiments, analyzed the test results, and wrote this paper. Xingliang Jiang and Zhijin Zhang gave input to the data analysis method and result discussion. They provided useful input in the original concept and improved the initial idea. Guo Yunjun performed the experiments; Yongfu Li checked the language and revised the contents.
Conflicts of Interest
The authors declare no conflict of interest.
References
- Gouda, O.E.; El Dein, A.Z. Experimental techniques to simulate naturally polluted high voltage transmission line insulators. IEEE Trans. Dielectr. Electr. Insul. 2014, 21, 2199–2205. [Google Scholar] [CrossRef]
- Yin, F.; Farzaneh, M.; Jiang, X.L. Electrical performance of composite insulators under icing conditions. IEEE Trans. Dielectr. Electr. Insul. 2014, 21, 2584–2593. [Google Scholar] [CrossRef]
- Ye, X.J.; Li, H.Z.; Liu, G. Effect of rainfall on contamination of porcelain and glass insulators: Experimental investigation. In Proceedings of the IEEE Conference on Electrical Insulation and Dielectric Phenomena, Shenzhen, China, 20–23 October 2013; pp. 391–394. [Google Scholar]
- Polluted Insulators: A Review of Current Knowledge; CIGRE TF 33.04.01; TIB: Hannover, Gemany, 2000.
- Egodawatta, P.; Thomas, E.; Goonetilleke, A. Mathematical interpretation of pollutant wash-off from urban road surfaces using simulated rainfall. Water Res. 2007, 41, 3025–3031. [Google Scholar] [CrossRef] [PubMed]
- Farzaneh, M.; Chisholm, W.A. Insulators for Icing and Polluted Environments; Wiley-IEEE Press: Hoboken, NJ, USA, 2009. [Google Scholar]
- Zhang, C.; Wang, L.; Guan, Z. Investigation of DC discharge behavior of polluted porcelain post insulator in artificial rain. IEEE Trans. Dielectr. Electr. Insul. 2016, 23, 331–338. [Google Scholar] [CrossRef]
- Farzaneh, M. Insulator flashover under icing conditions. IEEE Trans. Dielectr. Electr. Insul. 2014, 21, 1997–2011. [Google Scholar] [CrossRef]
- Zhang, C.; Meng, X.; Mei, H.; Zhang, F.; Ruihai, L.I.; Yi, M.A.; Wang, L.; Guan, Z. Research on the DC rain flashover mechanism of polluted post insulators. Chin. Soc. Electr. Eng. 2014, 34, 1481–1489. [Google Scholar]
- Song, Y.H.; Gang, L.; Chen, X.Y.; Amp, M.; Center, T. Influence of rain flushing on conductivity of insulator surface pollution layer and dynamic contamination accumulation. High Volt. Appar. 2013, 49, 43–48. [Google Scholar]
- Jiang, X.; Yang, L.; Meng, Z.; Long, C.; Xi, J.; Zhang, Z. Effect of fog-haze on AC flashover performance of insulator. High Volt. Eng. 2014. [Google Scholar] [CrossRef]
- Li, H.Z.; Liu, G.; Li, L.C. Natural contamination deposit law of line disc anti-contamination glass insulator in Guangzhou area. Proc. CSEE 2011, 31, 118–124. [Google Scholar]
- Chao, W.; Gao, Y.; Wang, J.; Jing, W.; Liang, X.; Liu, Y.; Tao, X.; Qin, L. Cleaning effect of rainfall on salt in pollution layer of silicone rubber insulators. In Proceedings of the IEEE Conference on Electrical Insulation and Dielectric Phenomena (CEIDP), Des Moines, IA, USA, 19–22 October 2014; pp. 275–278. [Google Scholar]
- Millar, R.G. Analytical determination of pollutant wash-off parameters. J. Environ. Eng. 1999, 125, 989–992. [Google Scholar] [CrossRef]
- Ming, L.; Wang, J.L.; Xin-Liang, M.A.; Jian-Hui, Y.U.; Huang, Y.J.; Zhou, W.J. Cleaning experiment of substation insulators by dry ice. Gaodianya Jishu/High Volt. Eng. 2011, 37, 1649–1655. [Google Scholar]
- Wang, L.M.; Wang, G.; Huang, R. Cleaning effect of rainfall on surface contamination of insulators. Power Syst. Technol. 2015, 39, 1703–1708. [Google Scholar]
- Ahmad, A.S.; Ahmad, H.; Jidin, R.B.; Tamsir, T. Contamination of high voltage insulators in the east coast of Peninsular Malaysia. In Proceedings of the International Conference on Power System Technology, Perth, Australia, 4–7 December 2000; pp. 1223–1228. [Google Scholar]
- Abouelsaad, M.A.; Abouelatta, M.A.; Arafa, B.; Ibrahim, M.E. Environmental pollution effects on insulators of northern Egypt HV transmission lines. In Proceedings of the IEEE Conference on Electrical Insulation and Dielectric Phenomena, Shenzhen, China, 20–23 October 2013; pp. 35–38. [Google Scholar]
- Ahmad, A.S.; Ahmad, H.; Salam, M.A.; Tamsir, T. Prediction of salt contamination on high voltage insulators in rainy season using regression technique. In Proceedings of the TENCON 2000, Kuala Lumpur, Malaysia, 24–27 September 2000. [Google Scholar]
- Allister, M.; Armbruster, K.; Wallace, K.; Avise, J.C. Performance of HV transmission line insulators in desert conditions. Part 4: Study of insulators at a semi-coastal site in the eastern region of Saudi Arabia. IEEE Trans. Power Deliv. 1991, 6, 439–447. [Google Scholar]
- Lin, X.; Chen, Z.; Liu, X.; Chu, K. Natural insulator contamination test results on various shed shapes in heavy industrial contamination areas. IEEE Trans. Electr. Insul. 1992, 27, 593–600. [Google Scholar] [CrossRef]
- IEC Standard 60815. Selection and Dimensioning of High-Voltage Insulators Intended for Use in Polluted Conditions; IEC: Geneva, Switzerland, 2008. [Google Scholar]
- Sage, J.; Bonhomme, C.; Ali, S.A.; Gromaire, M.C. Performance assessment of a commonly used accumulation and wash-off model from long-term continuous road runoff turbidity measurements. Water Res. 2015, 78, 47–59. [Google Scholar] [CrossRef] [PubMed]
- Haddad, K.; Egodawatta, P.; Rahman, A.; Goonetilleke, A. Assessing uncertainty in pollutant wash-off modelling via model validation. Sci. Total Environ. 2014, 497, 578–584. [Google Scholar] [CrossRef] [PubMed]
- Wang, Y.; Song, S.; Luo, Y.; Xiao, L.; Zhang, D.; Wang, S.; Chen, Q.; Zhenghao, H.E. Experiment research on AC flashover performance of smearing insulator under sea-salt pollution. Insul. Surge Arresters 2015, 5, 11–15. [Google Scholar]
- Liu, Y.; Du, B.X. Energy eigenvector analysis of surface discharges for evaluating the performance of polymer insulator in presence of water droplets. IEEE Trans. Dielectr. Electr. Insul. 2014, 21, 2438–2447. [Google Scholar] [CrossRef]
- Chandavong, S.; Tonmitra, K.; Kaewrawang, A. The flashover phenomena due to water drops on insulating surface under DC electric field. Adv. Mater. Res. 2014, 931–932, 962–967. [Google Scholar] [CrossRef]
- Zhao, H.; Zhao, J.; Yin, C.; Li, X. Index models to evaluate the potential metal pollution contribution from washoff of road-deposited sediment. Water Res. 2014, 59, 71–79. [Google Scholar] [CrossRef] [PubMed]
© 2017 by the authors. Licensee MDPI, Basel, Switzerland. This article is an open access article distributed under the terms and conditions of the Creative Commons Attribution (CC BY) license (http://creativecommons.org/licenses/by/4.0/).