
Deformation Behavior of Hard Roofs in Solid Backfill Coal Mining Using Physical Models


Abstract
:1. Introduction
2. Design of Physical Simulation Models
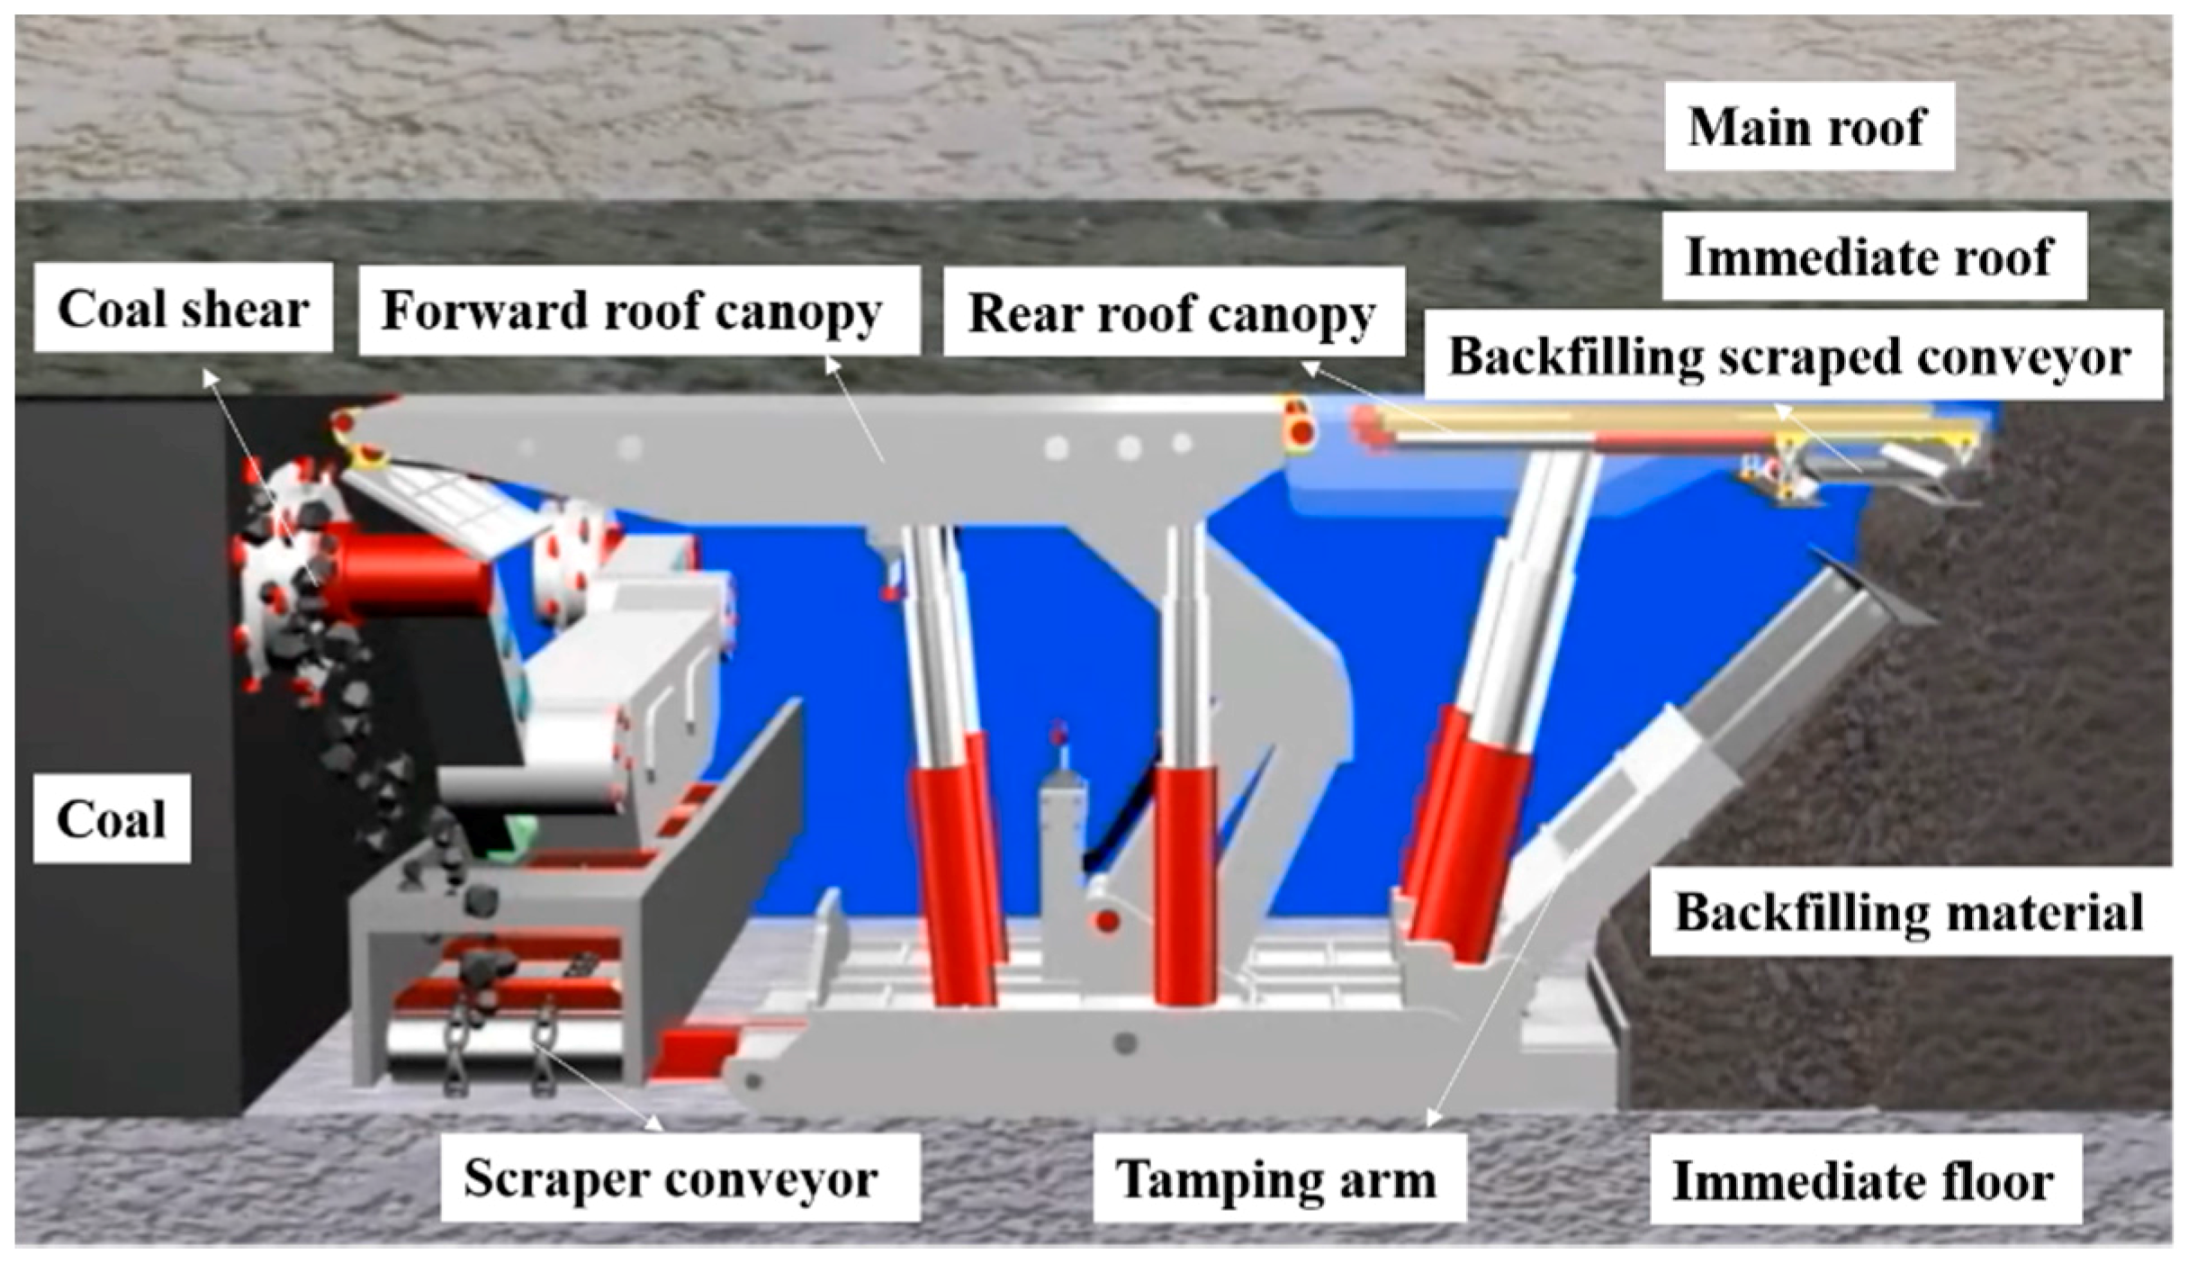
2.1. Principle of Solid Backfilling
2.2. Basic Parameters of the Working Face
2.3. Experimental Installation and Determination of Model Simulation Scale
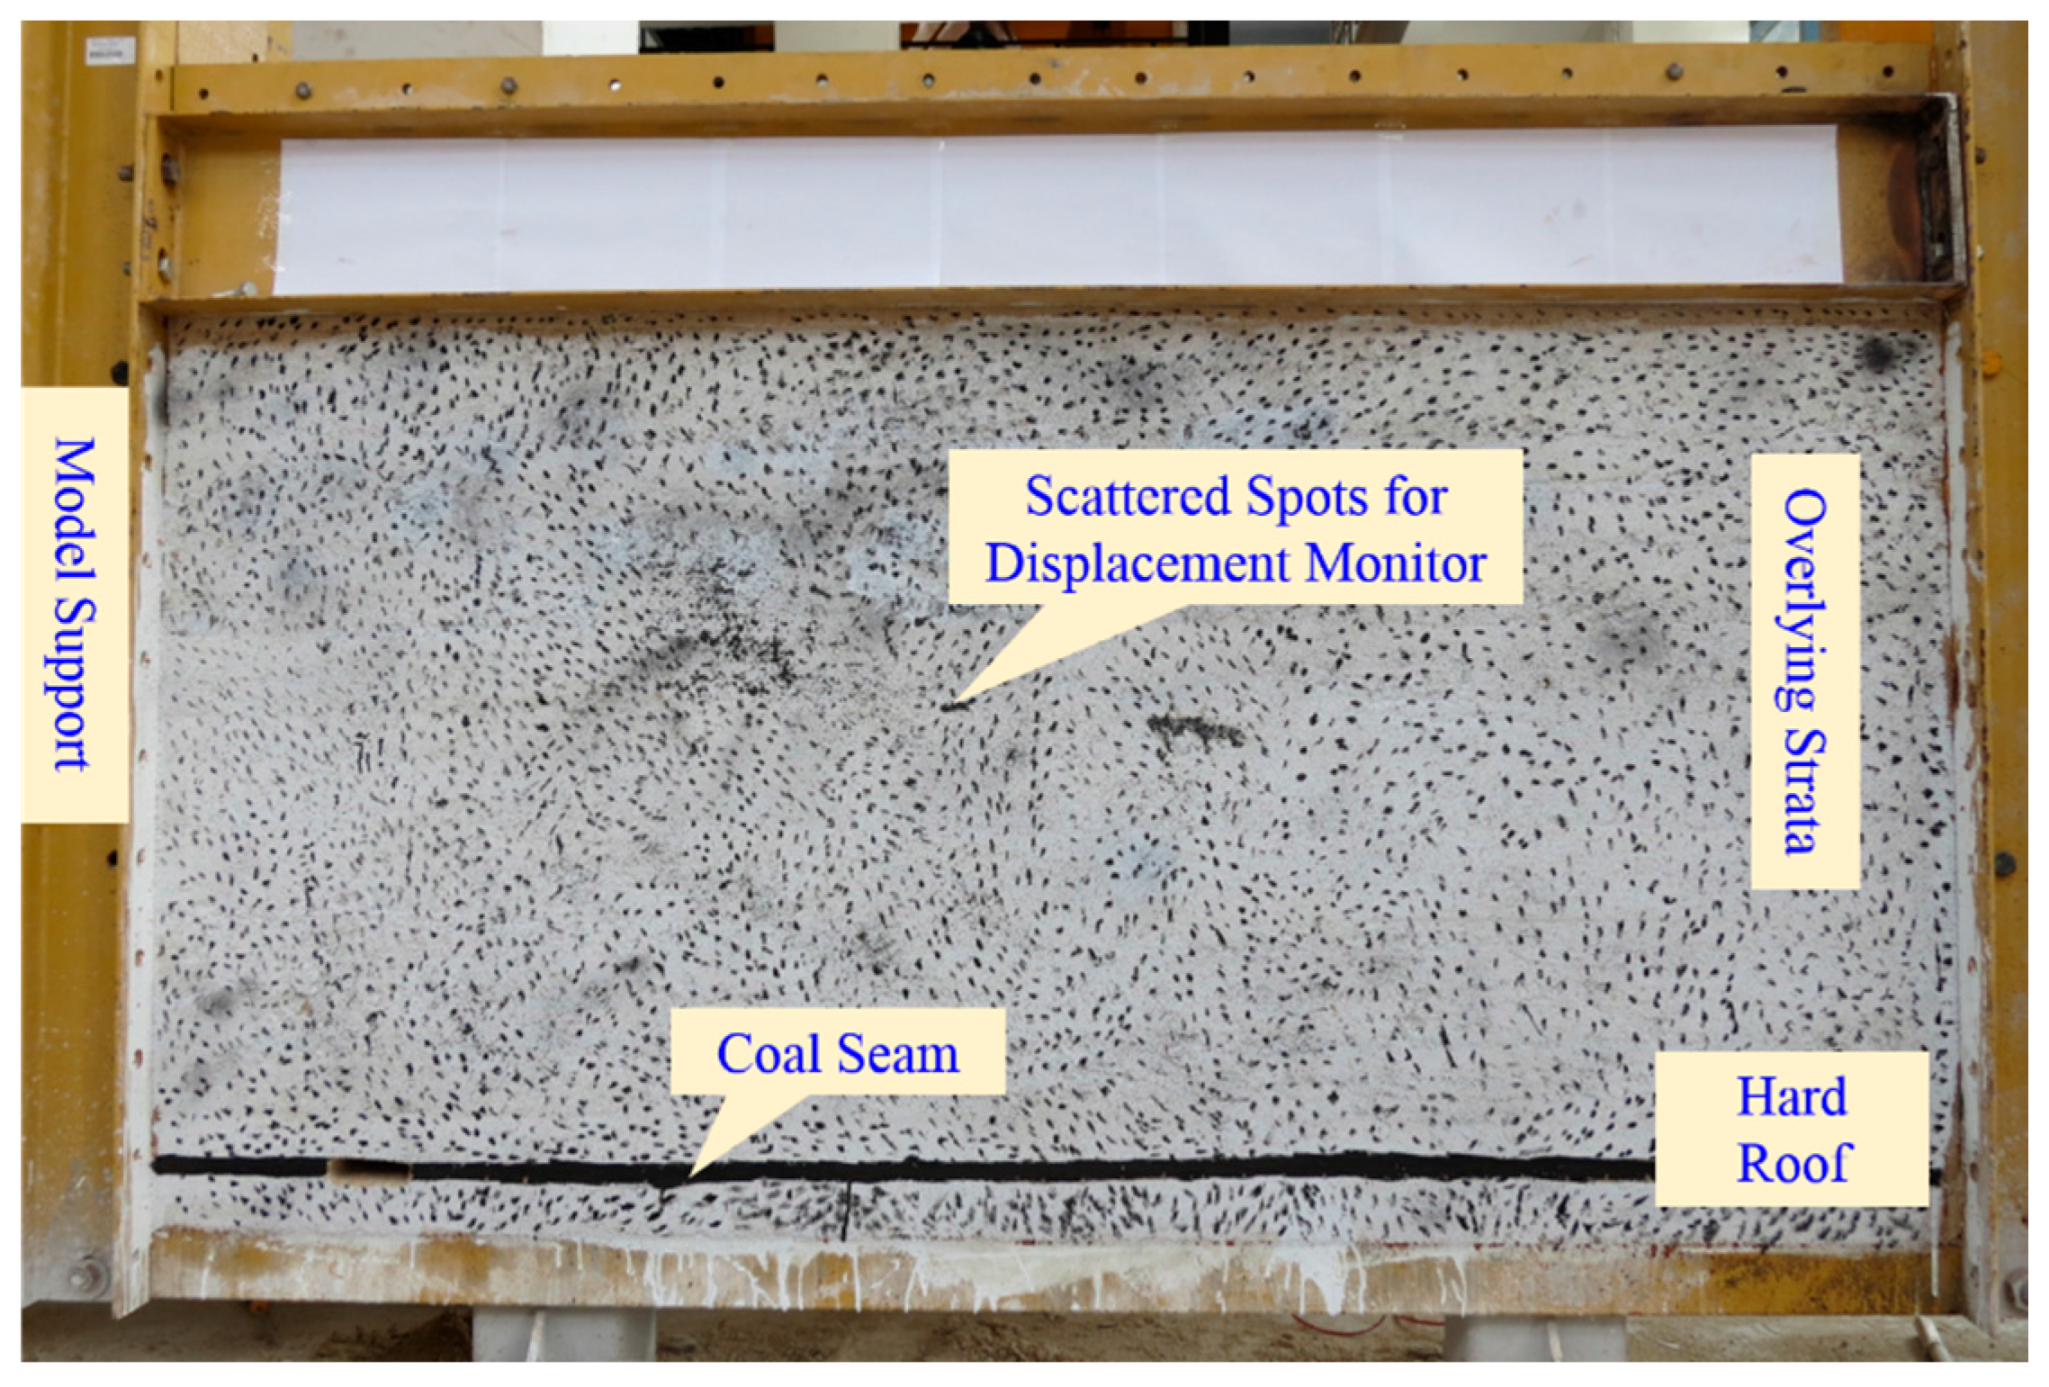
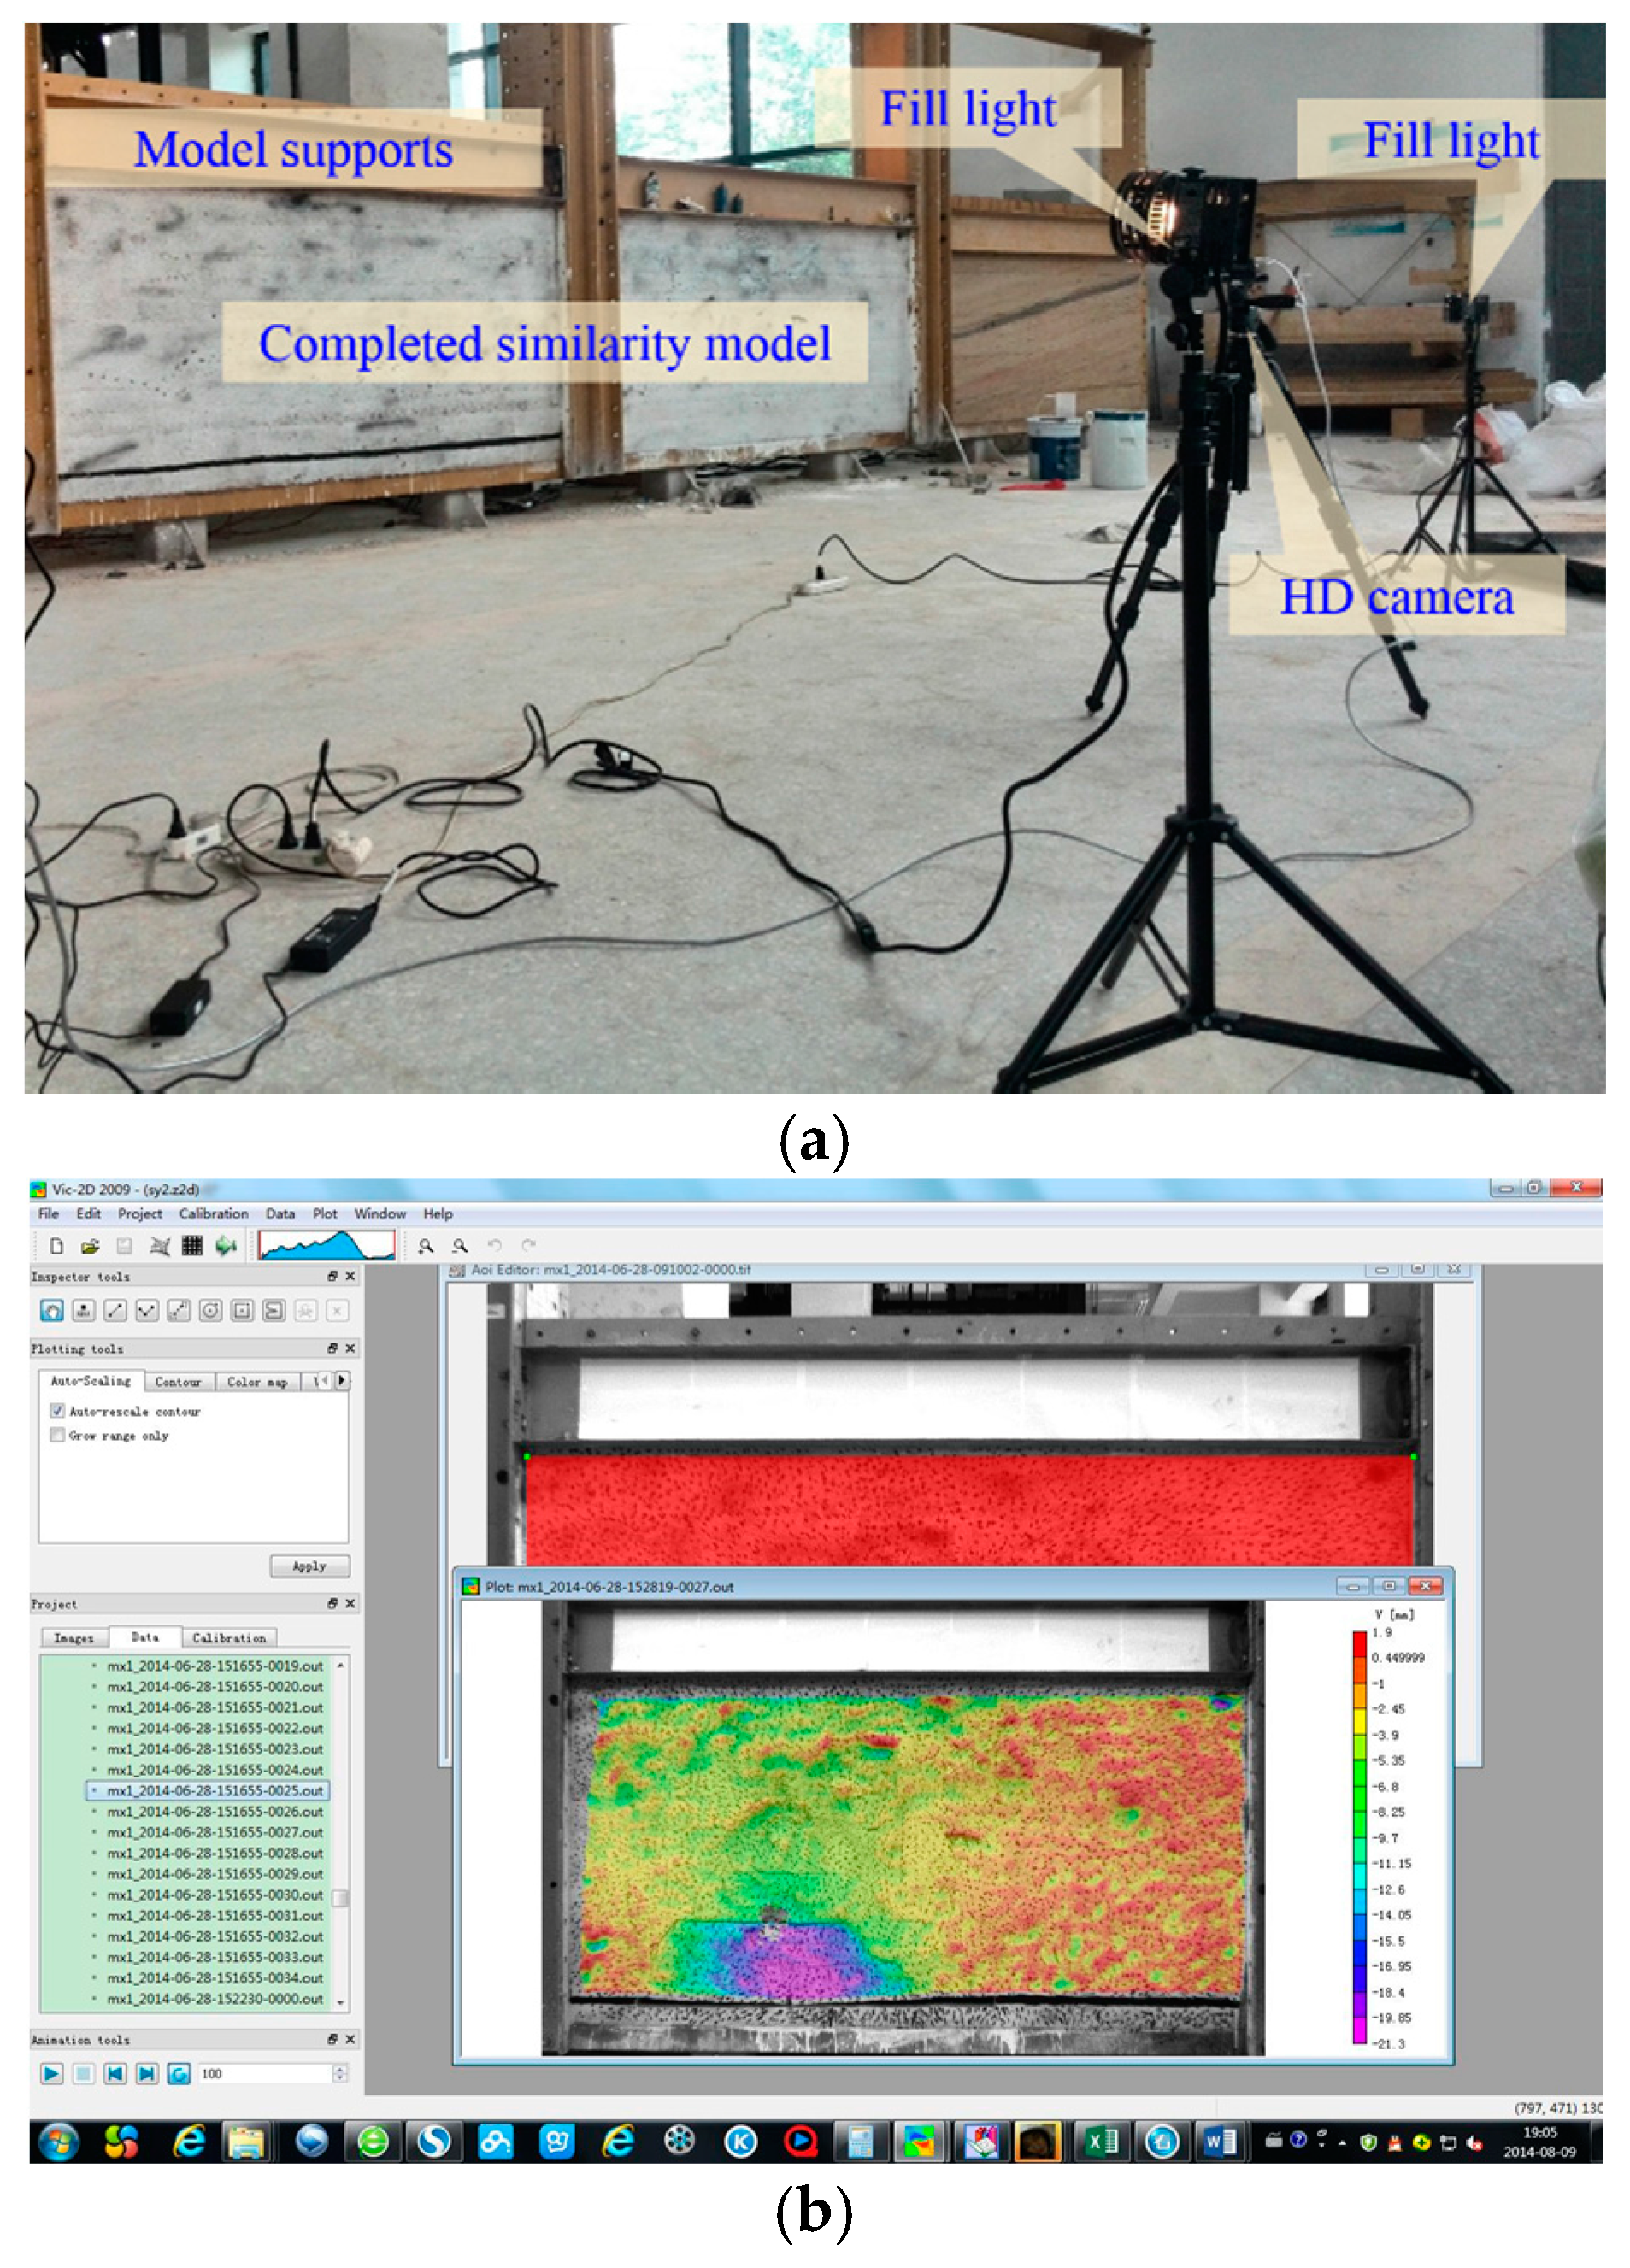
2.3.1. Experimental Installation
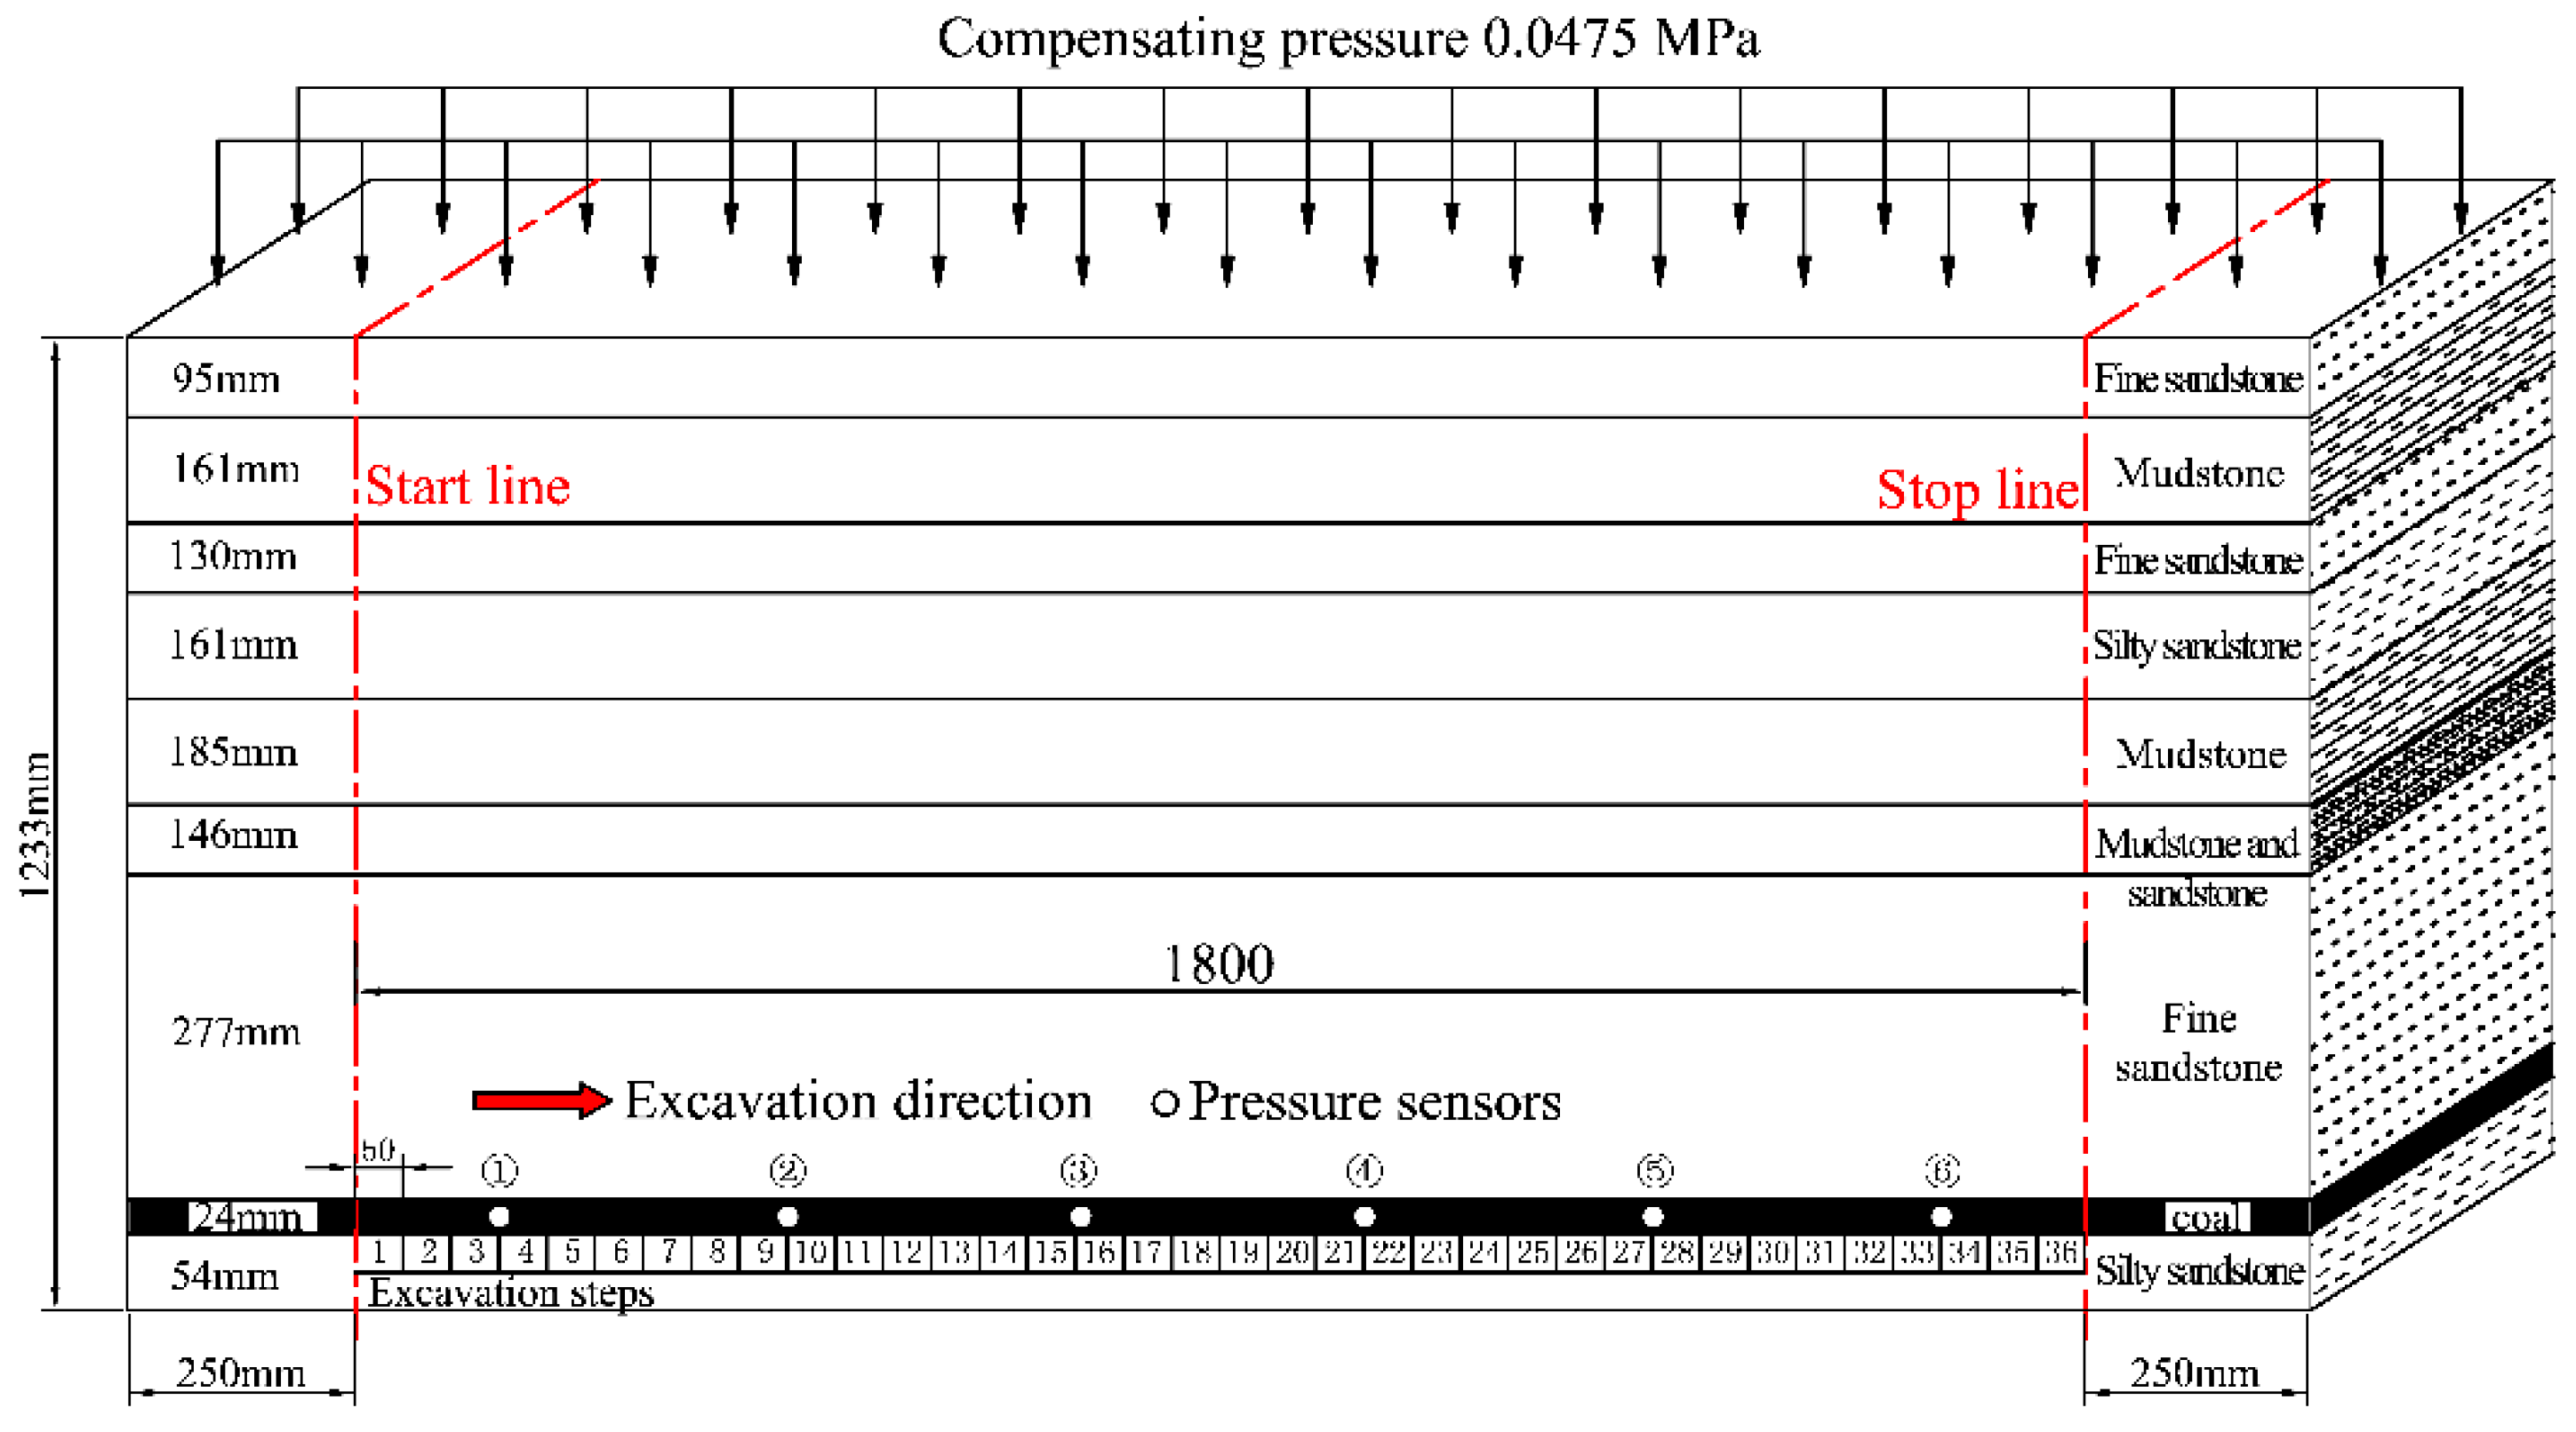
2.3.2. Determination of the Model Simulation Scale
2.4. Design of Model Parameters
2.5. Backfill Mining of the Models and Design of Monitoring Scheme
2.5.1. Design of Scenarios for Comparison
2.5.2. Backfill Mining and Monitoring of the Models
3. Selection of Solid Backfill Analogs
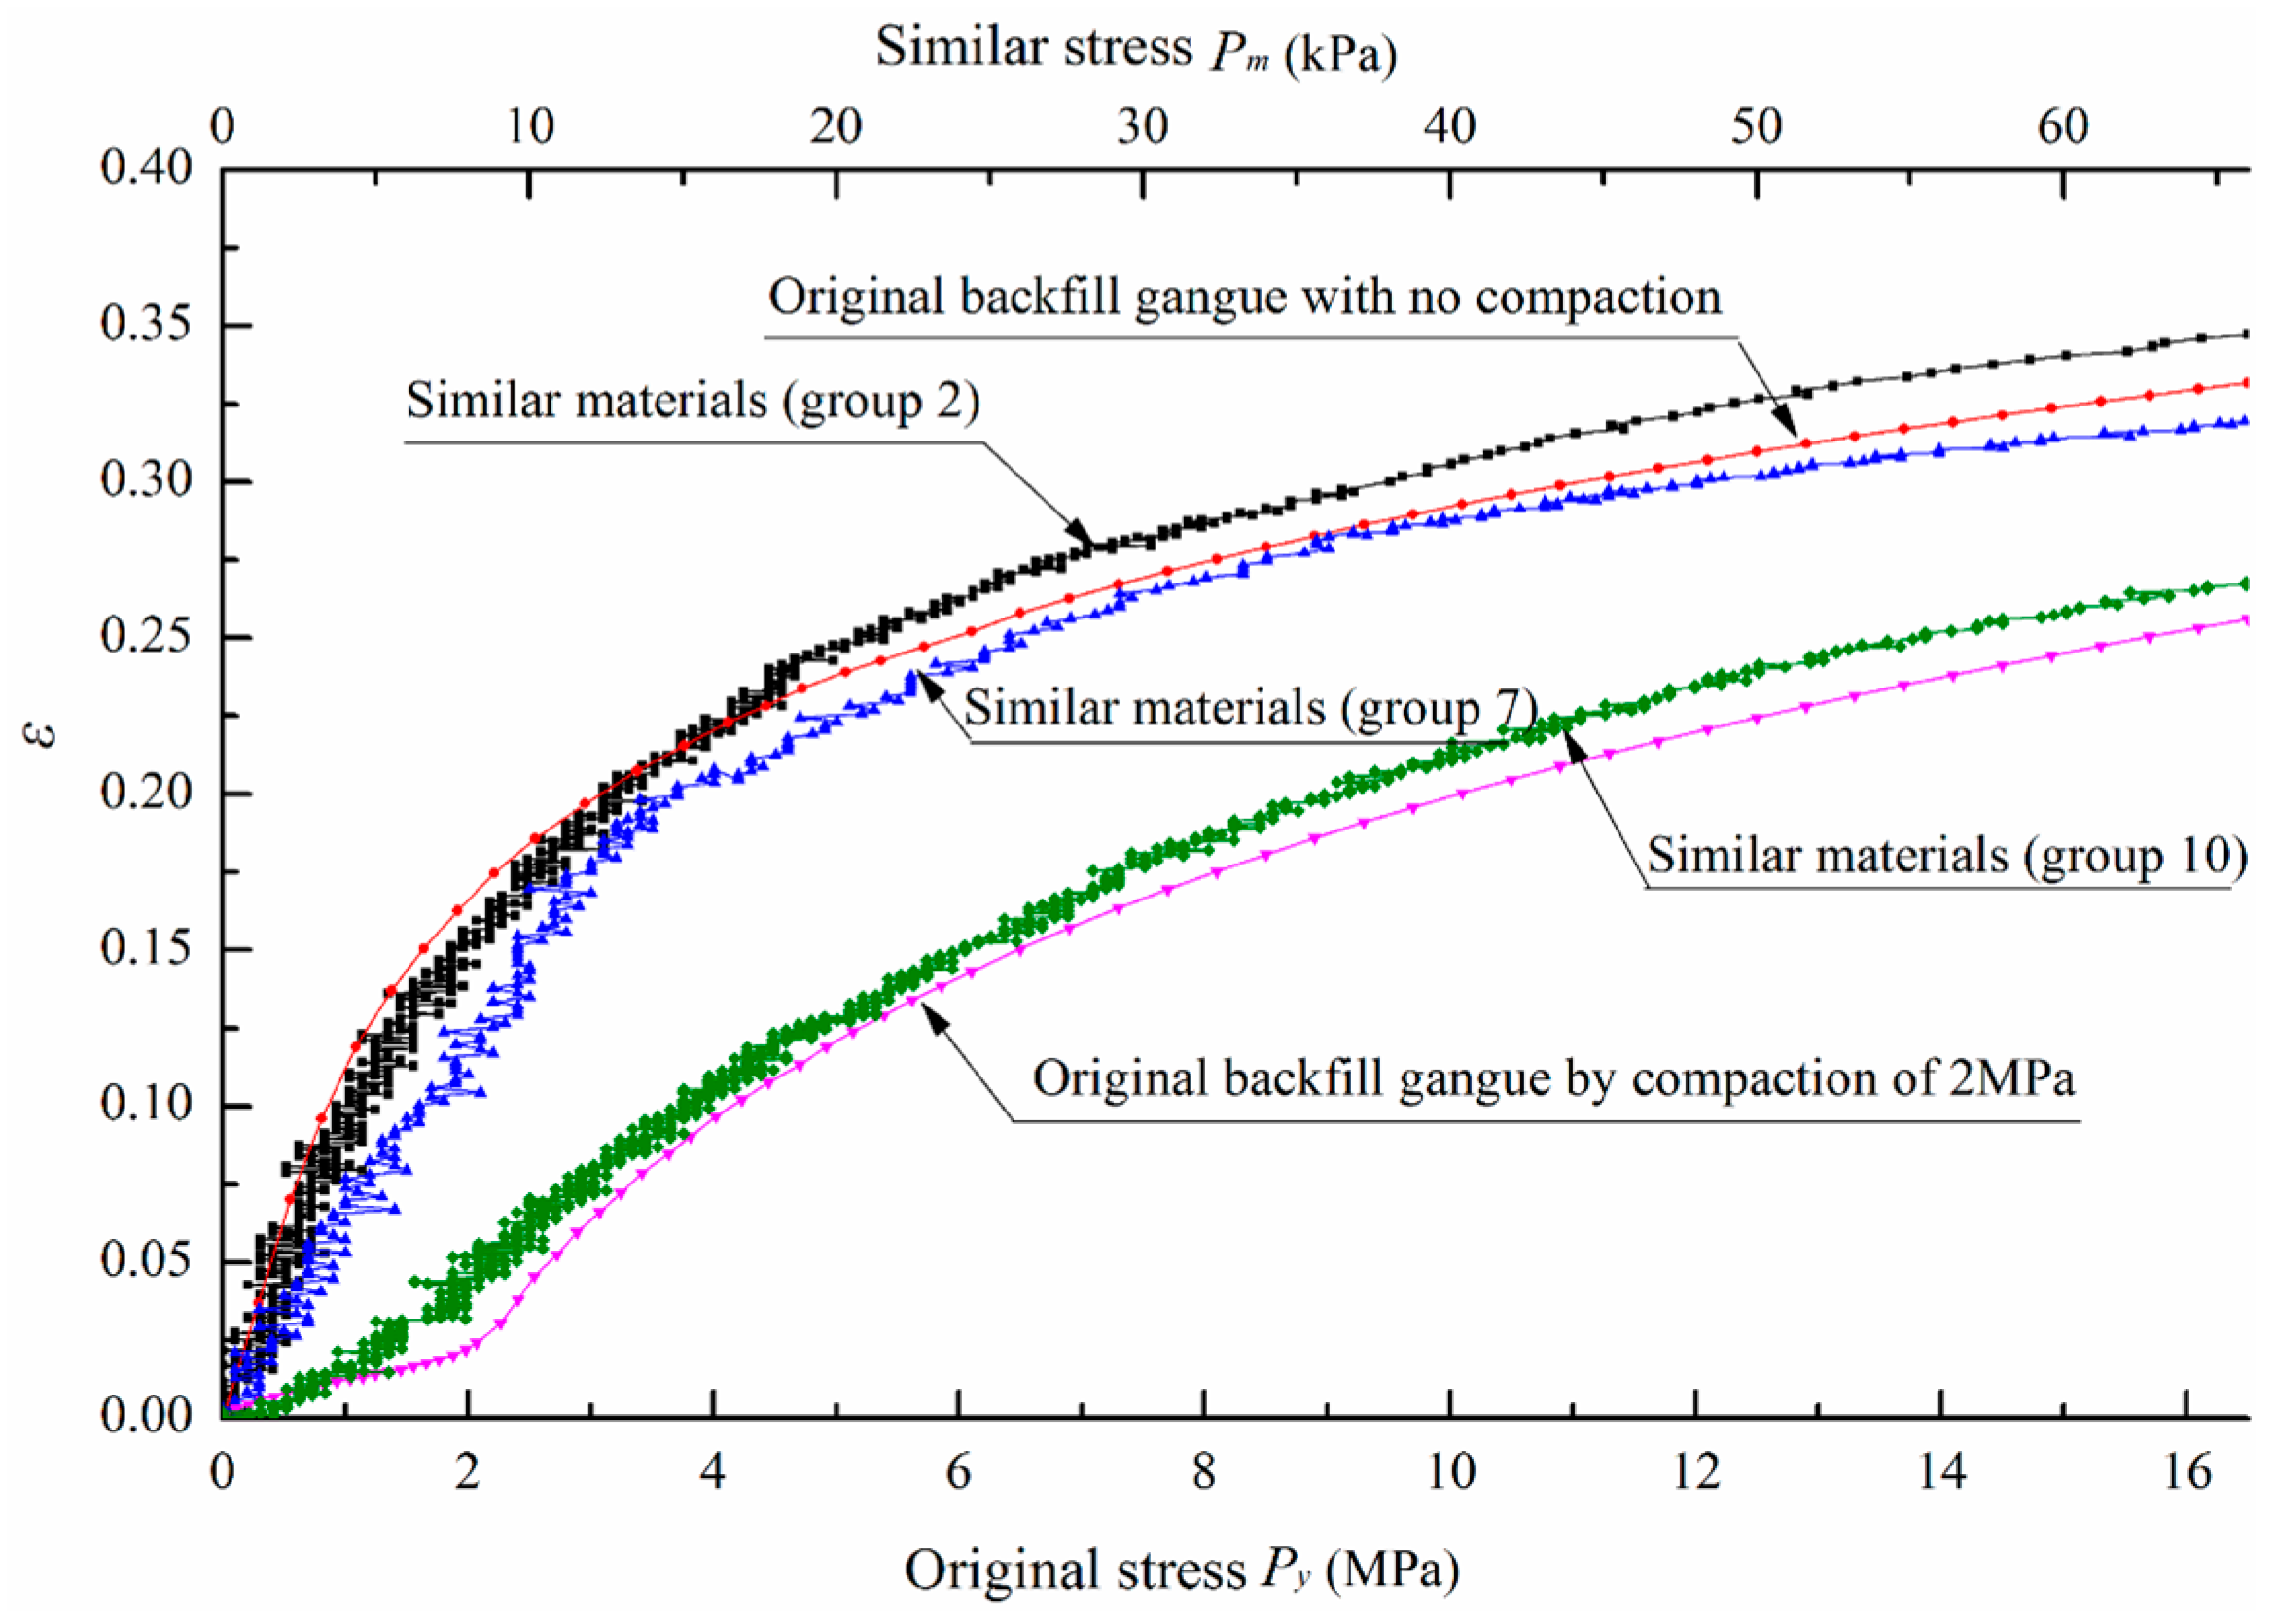
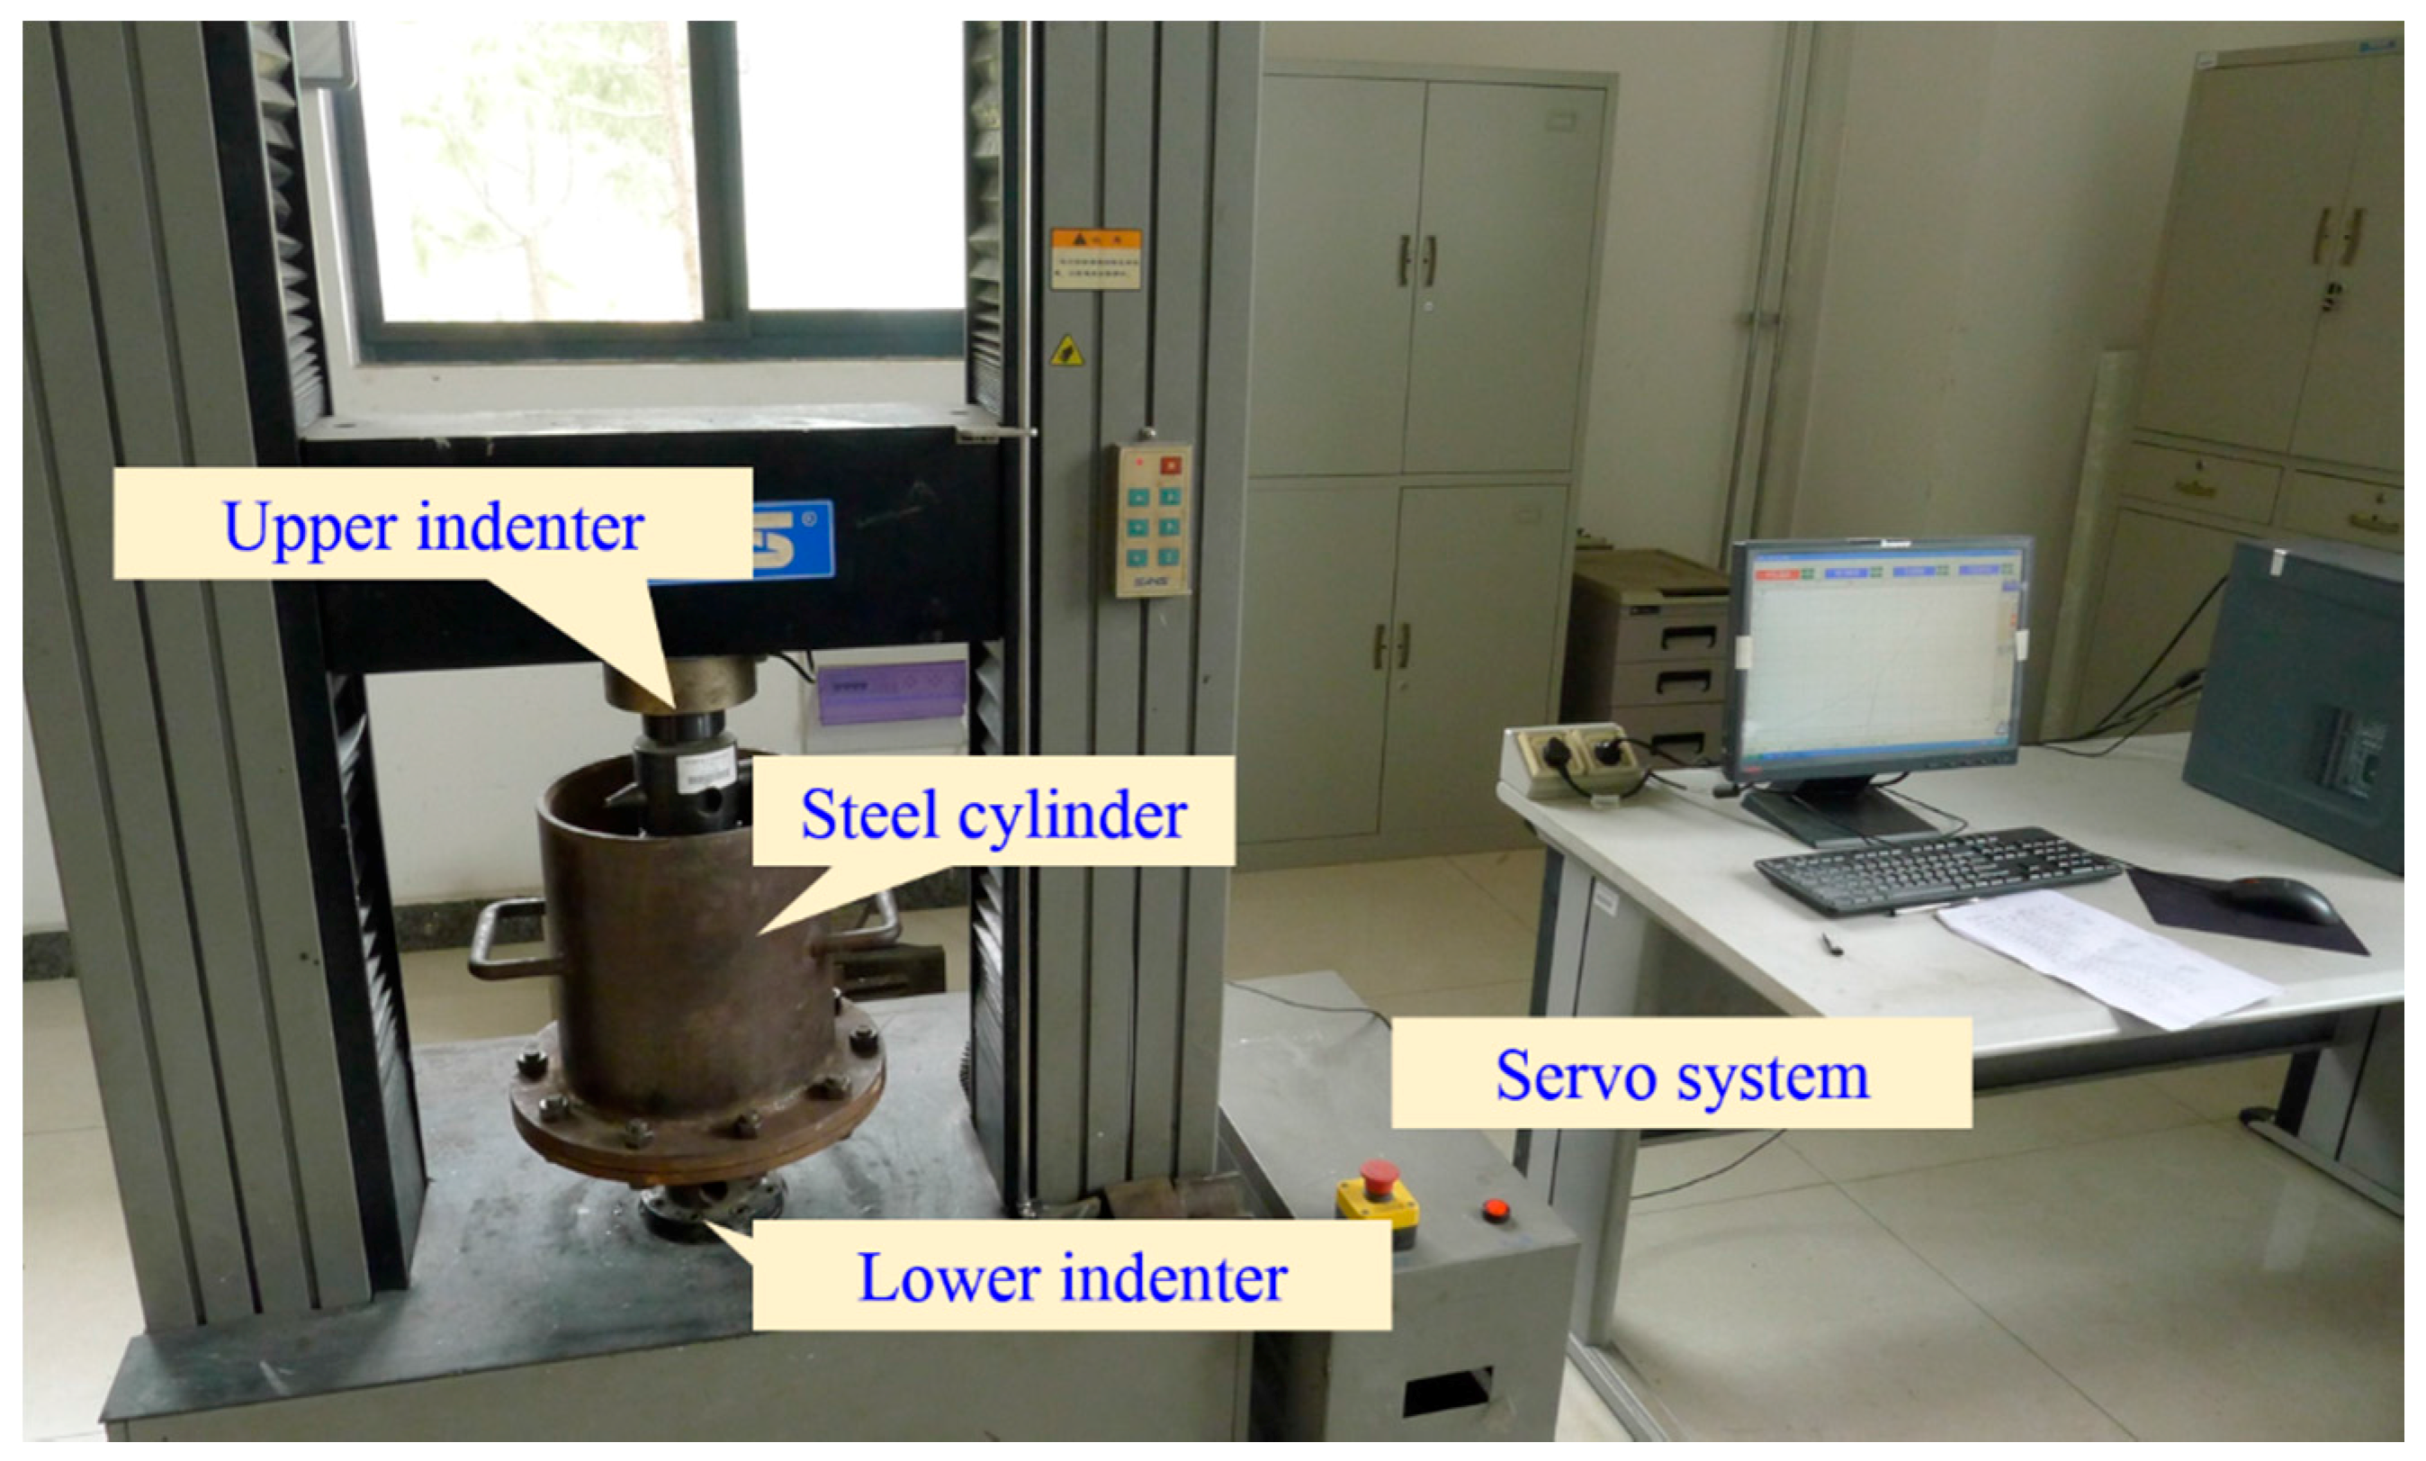
3.1. Tests of the Deformation Behavior of the Solid Backfill Body
3.2. Design of Solid Backfill Analogs for Different Backfilling Scenarios
4. Deformation Behavior of the Hard Roof under Different Backfilling Scenarios
4.1. Scenario 1: Roof-Controlled Backfilling Ratio of 0
- (1)
- In the initial phase of mining, the roof displayed little deformation. When the mining reached a distance of 60 m from the start line, the maximum displacement of the roof was only 0.11 m, and no obvious cracks were observed.
- (2)
- When the mining reached a distance of 127.5 m, obvious separation was observed between the hard roof and the No. 6 stratum—mudstone and sandstone interbedding; the maximum displacement in the vertical direction was 0.29 m. At a distance of 67 m from the start line, a crack about 14 m high occurred at the lower part of the hard roof. The crack did not penetrate through the roof.
- (3)
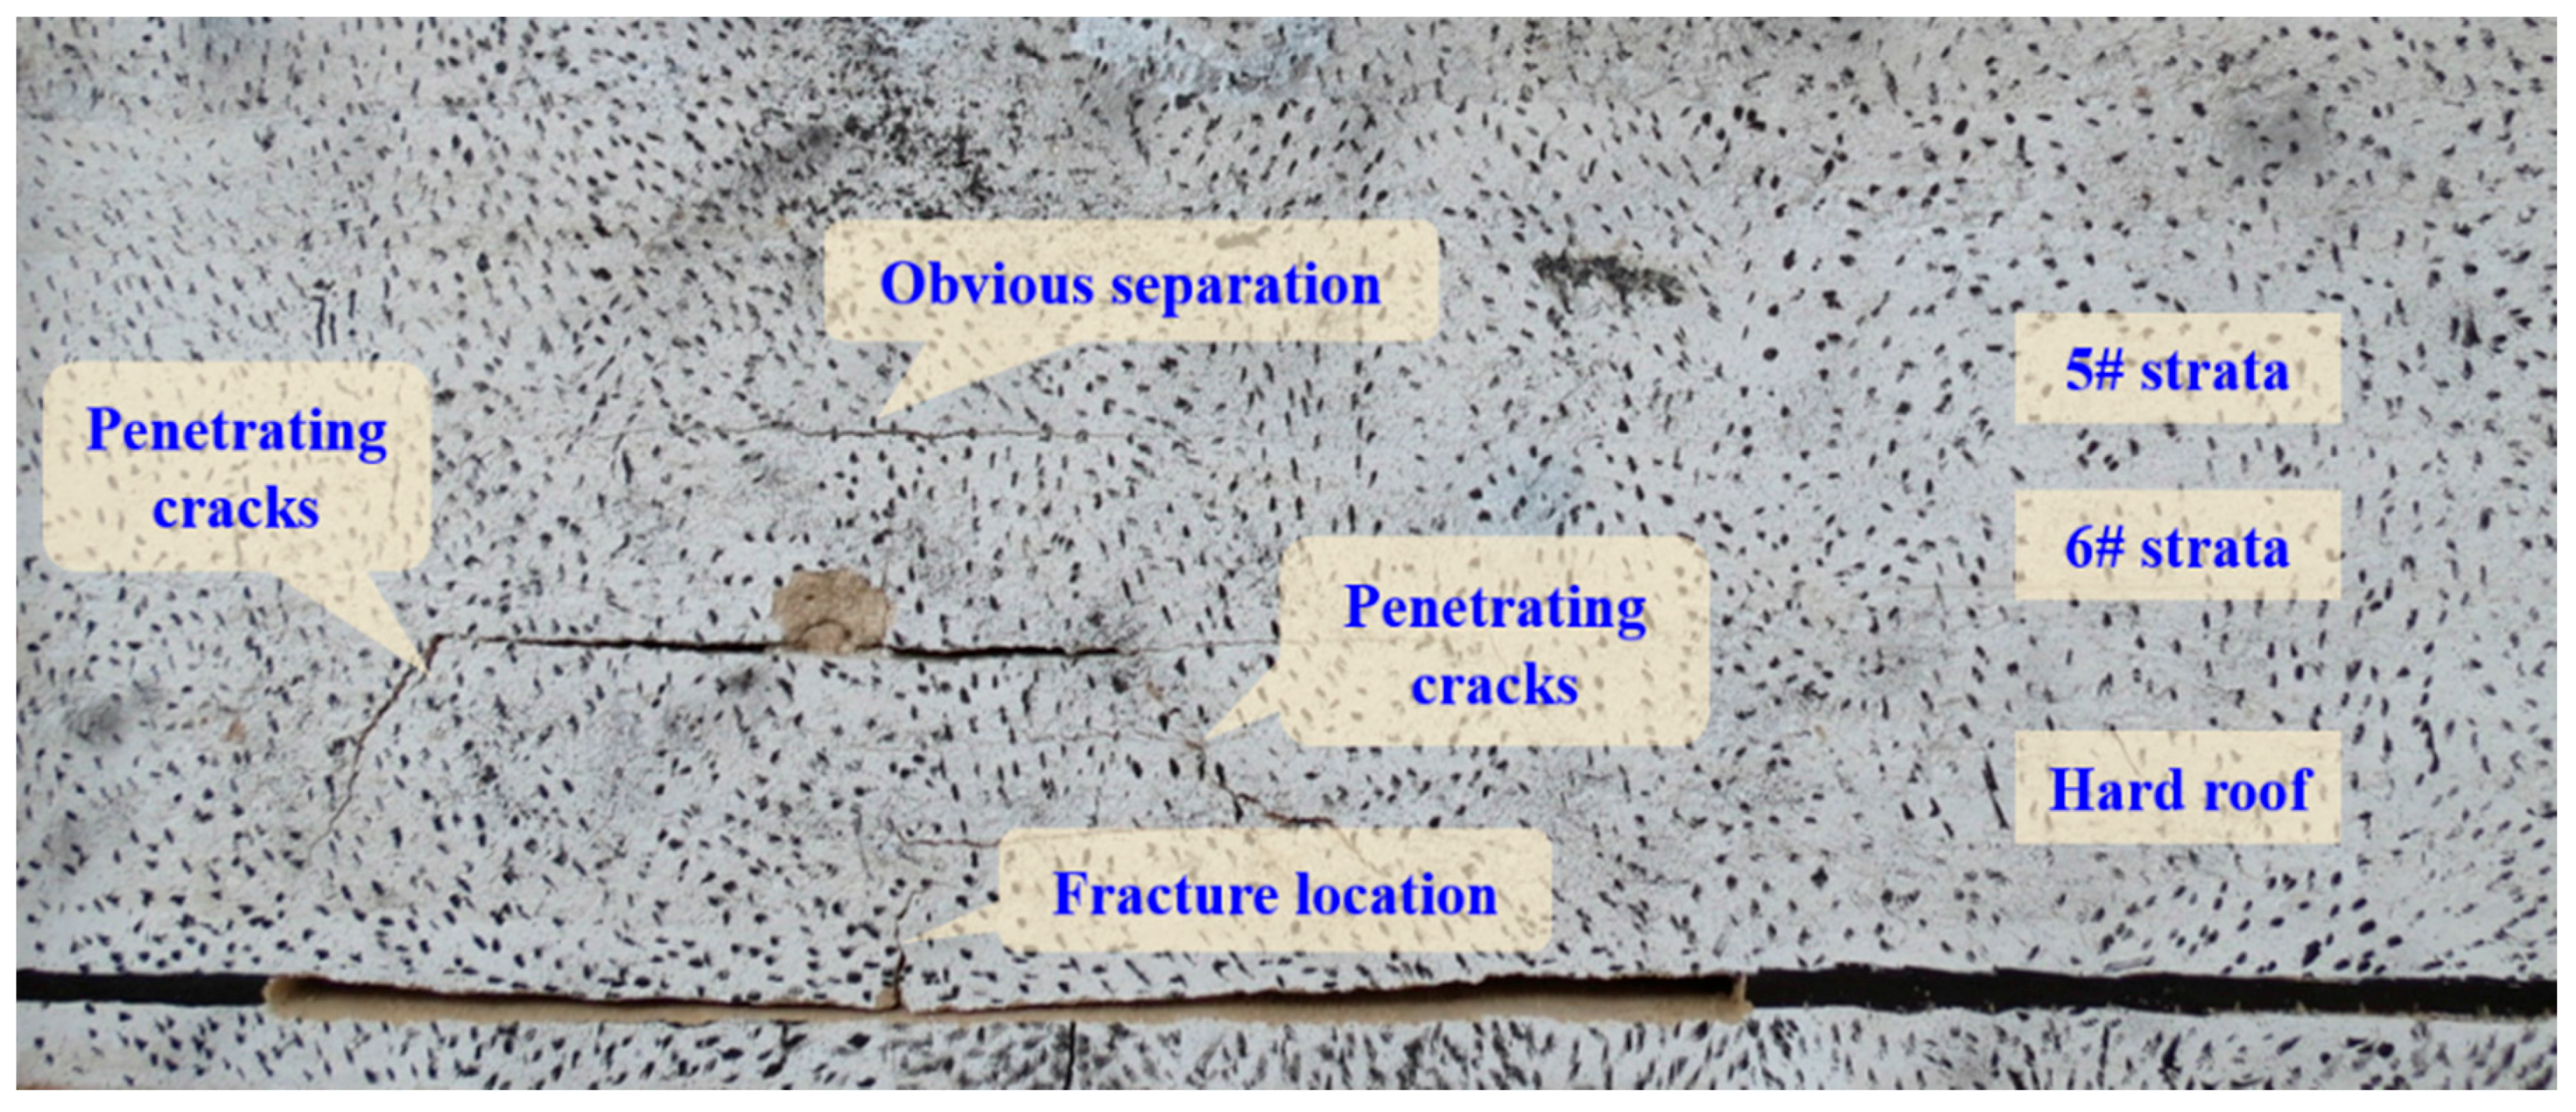
- When the mining reached a distance of 157.5 m, the hard roof experienced its initial fracture. Penetrating cracks occurred above the start line, above the middle of the mined-out area, and above the working face. The roof subsided by a maximum amount of 2.91 m. At this time, the No. 6 stratum subsided and was separated from the No. 5 stratum above, as shown in Figure 9.
- (4)
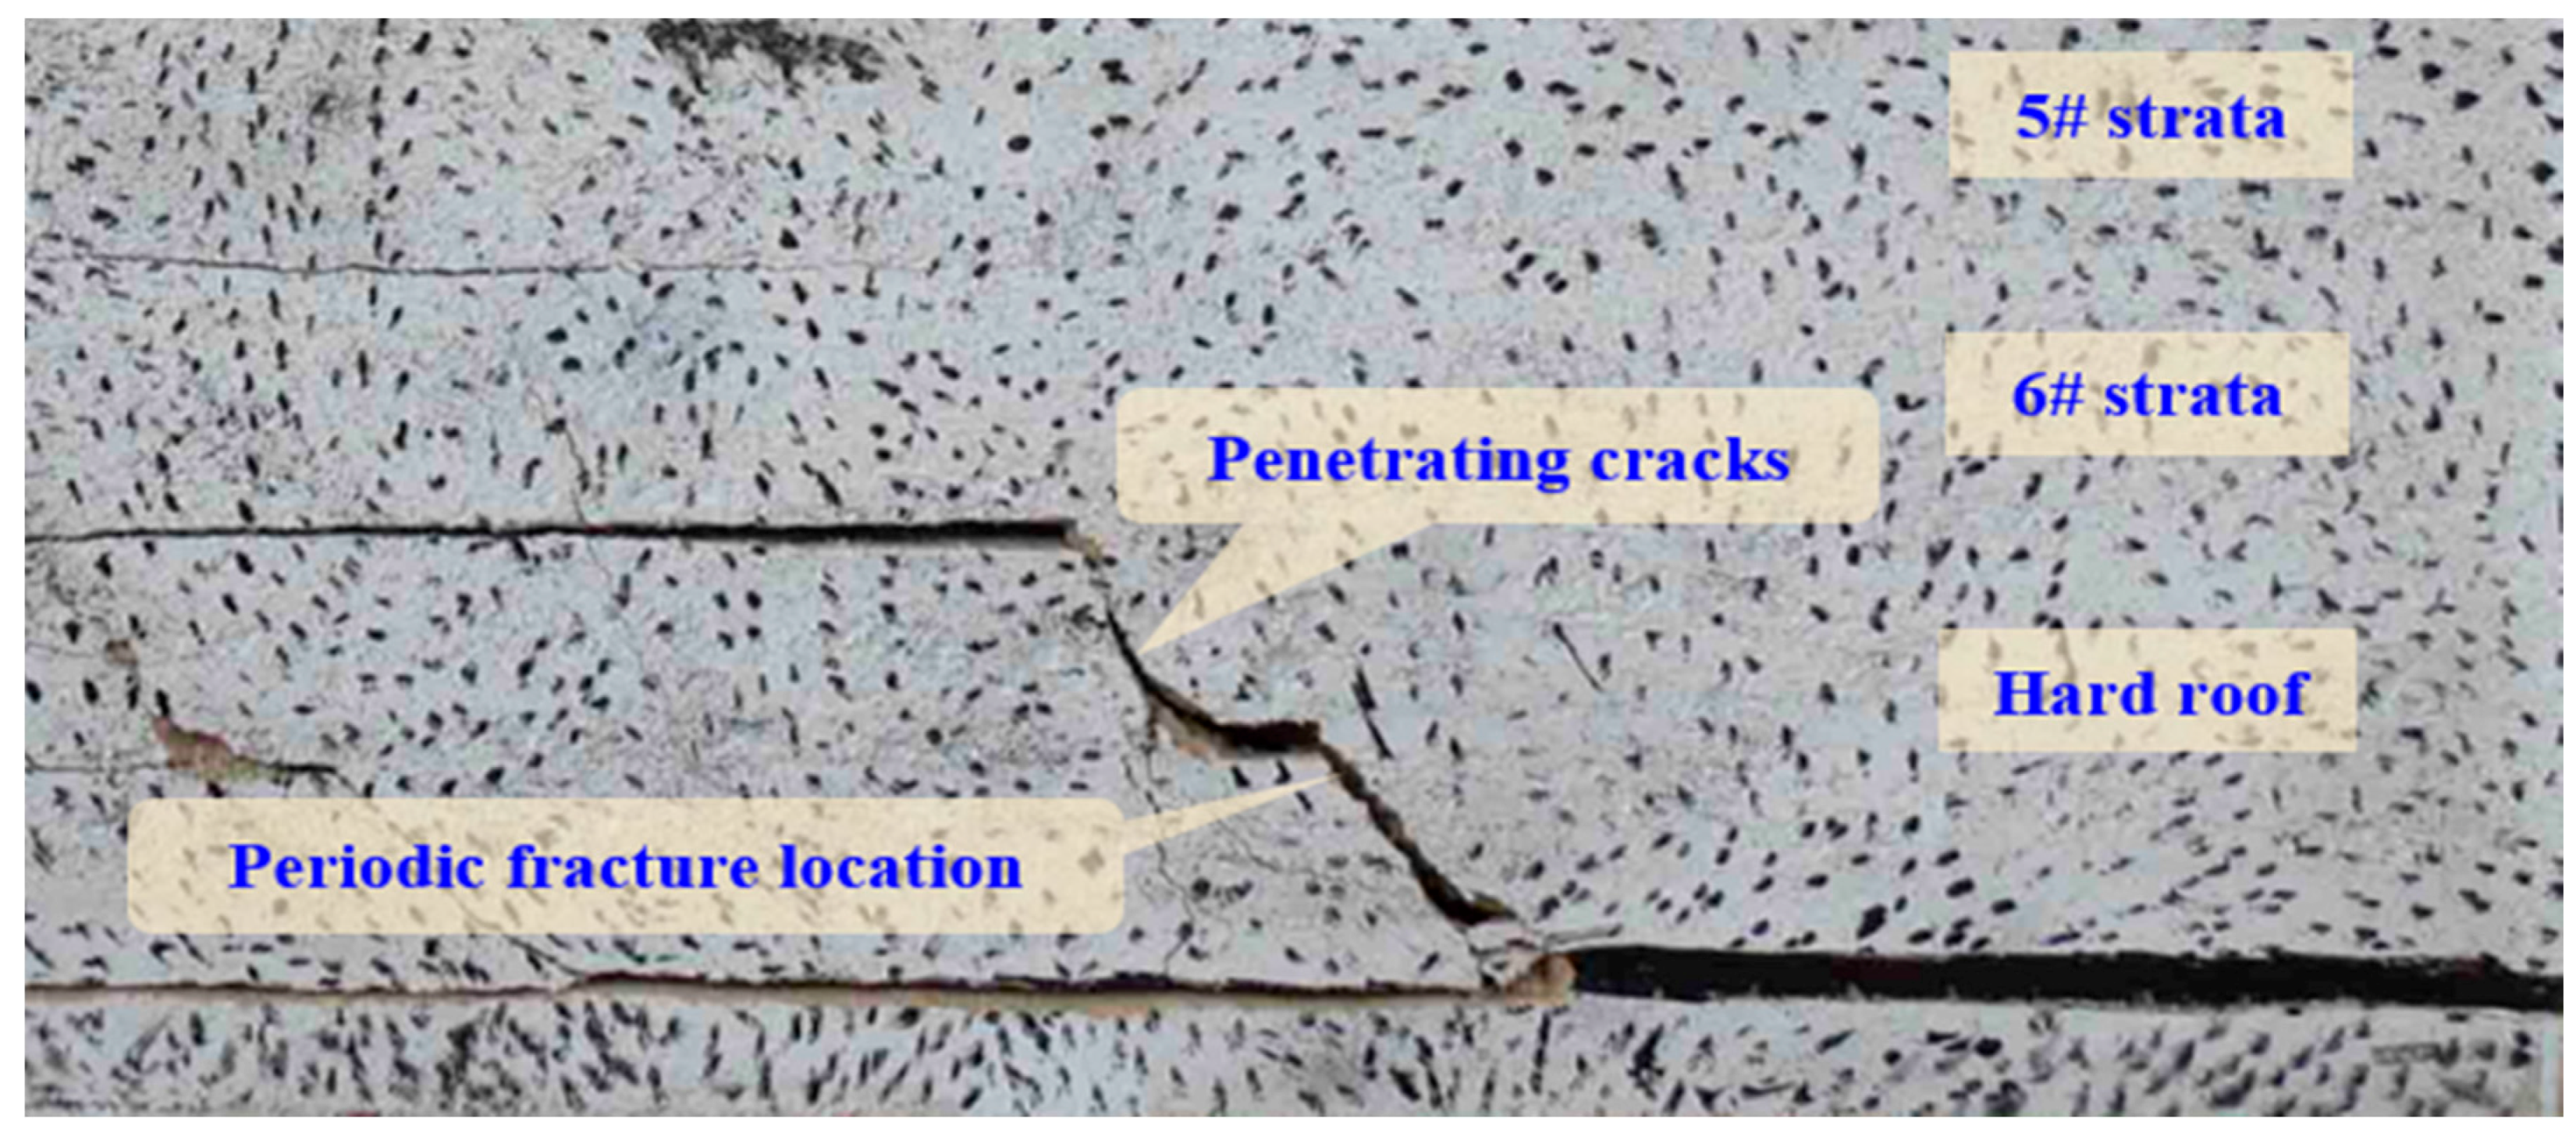
- When the mining reached a distance of 217.5 m, the hard roof experienced a periodic fracture, with a fracture interval of 60 m. The overlying strata were affected by the mining activities; the No. 5 stratum experienced a maximum subsidence of 2.2 m, as shown in Figure 10.
- (5)
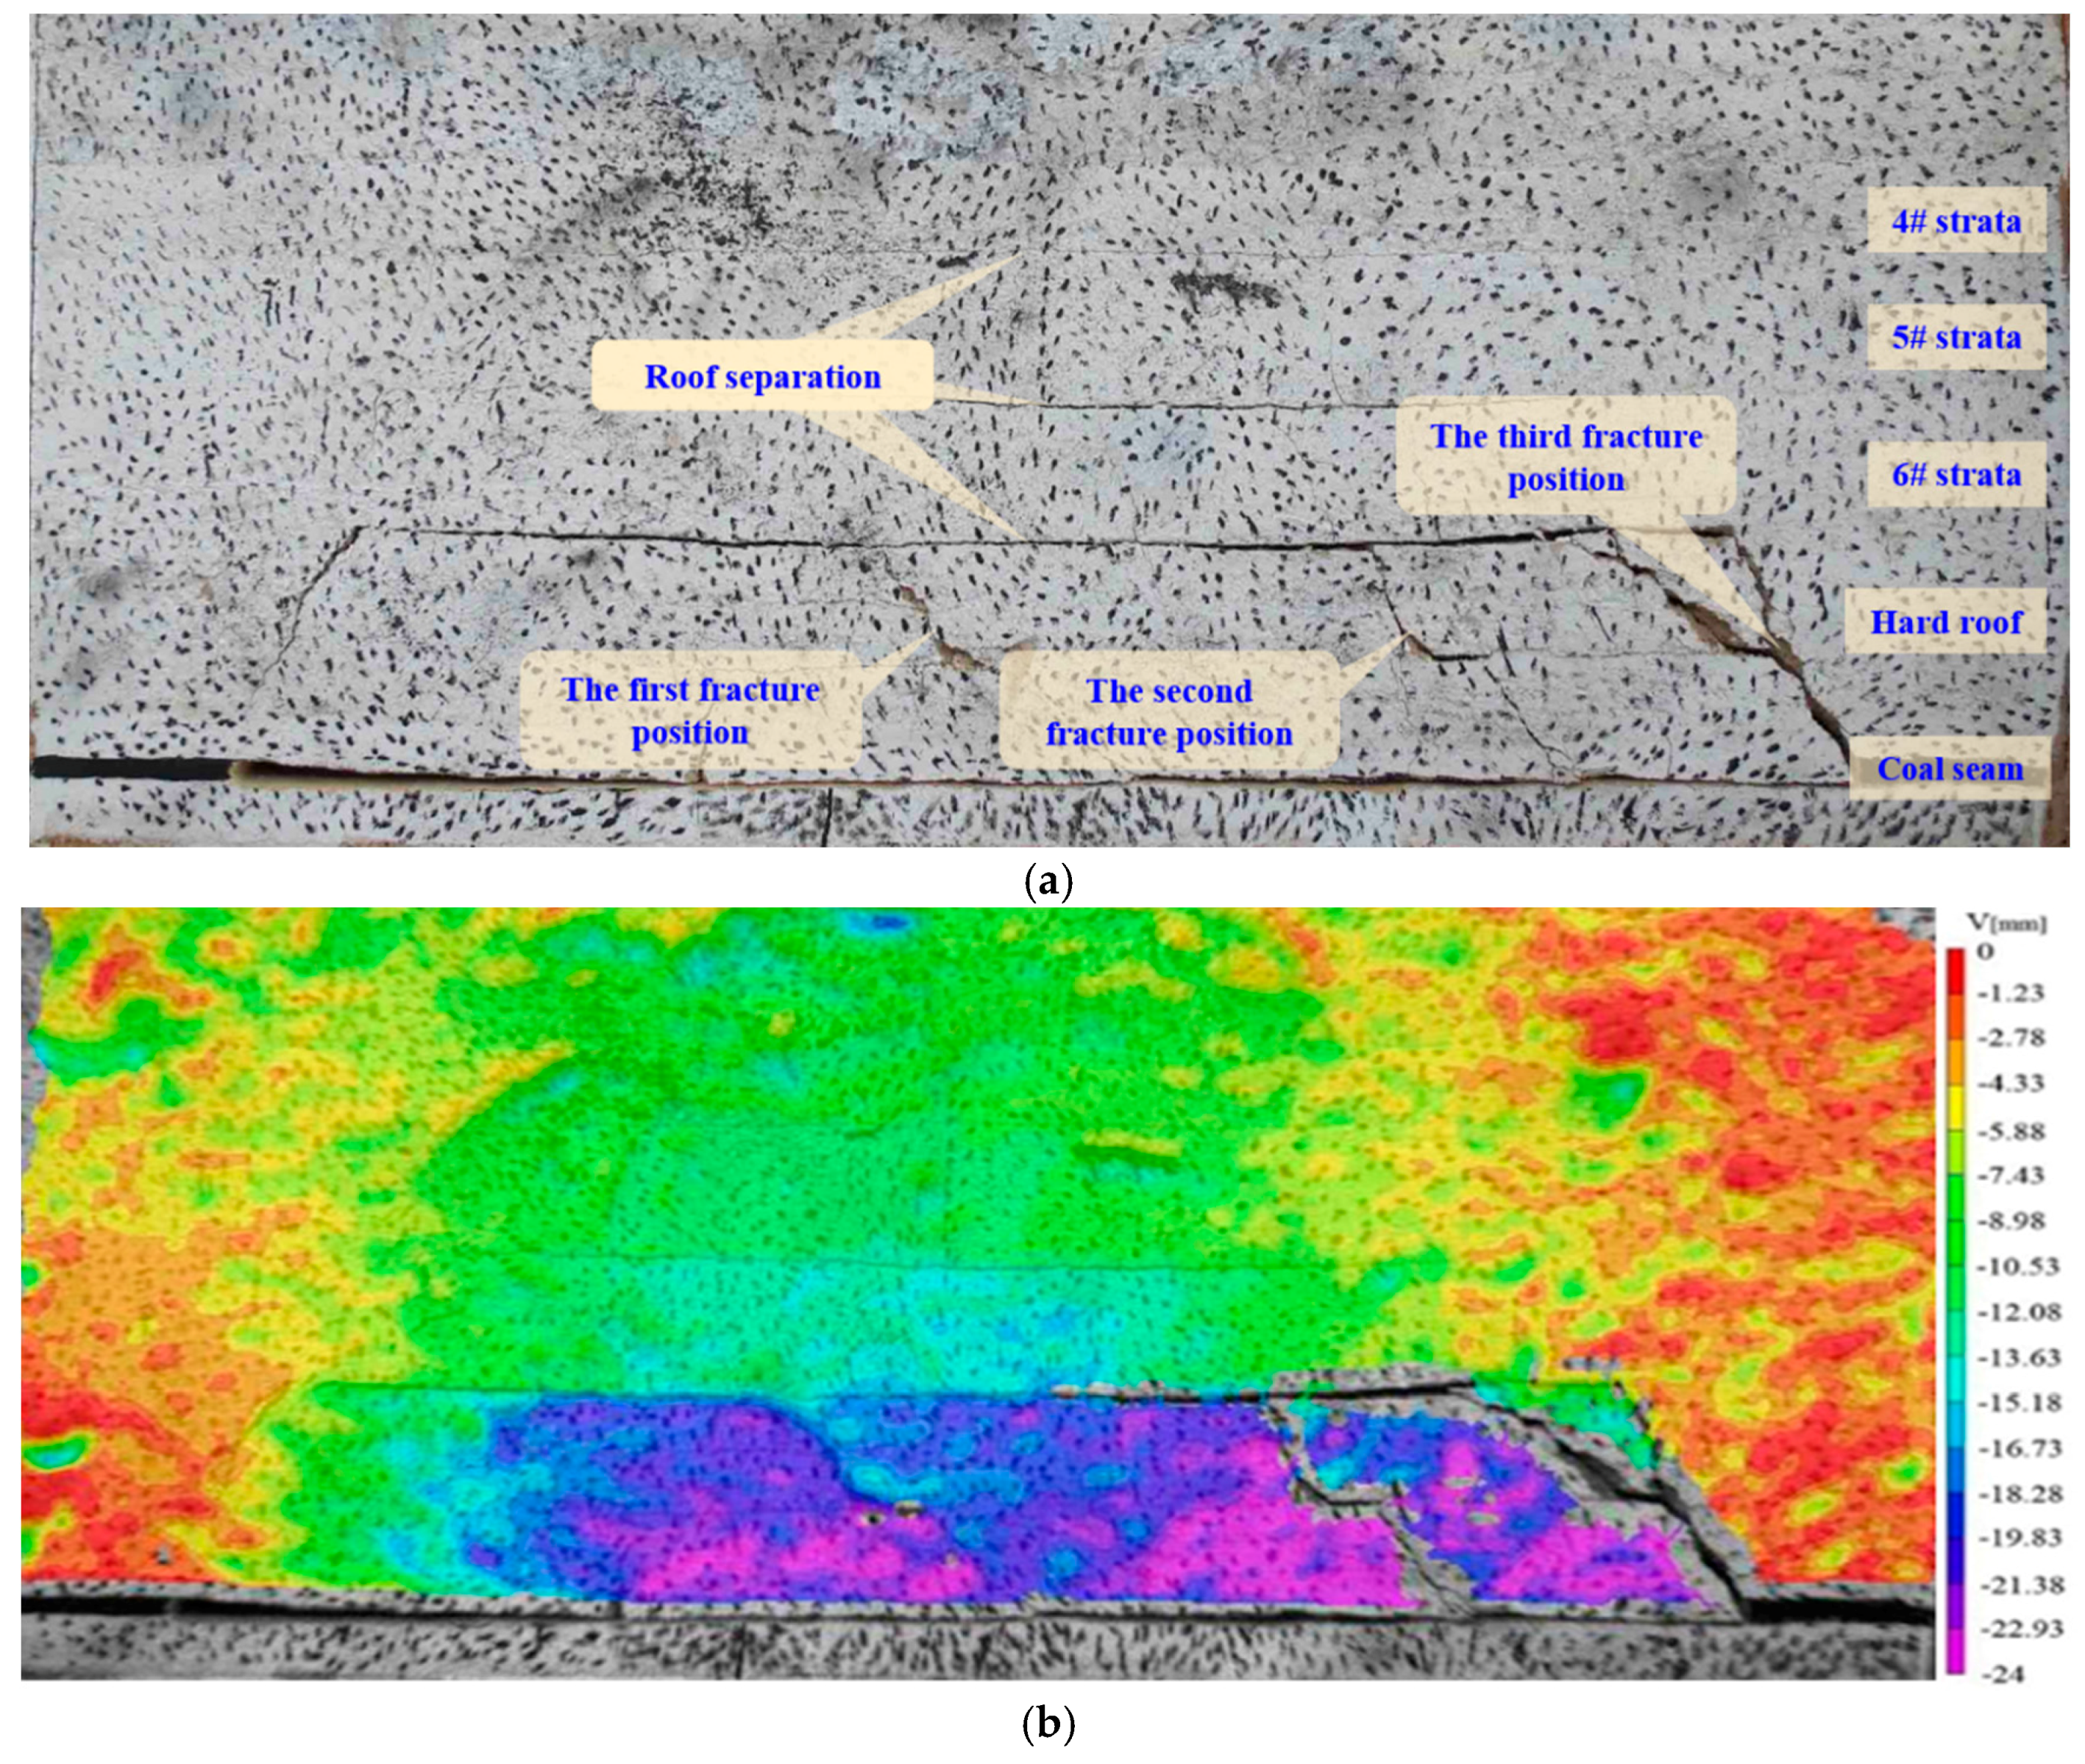
- When the mining reached a distance of 270 m (the stop line), a second periodic fracture occurred in the hard roof, with a fracture interval of 52 m. The hard roof subsided by a maximum amount of 3.42 m, and cracks were seen developing across the whole model height, as shown in Figure 11.
4.2. Scenario 2: Roof-Controlled Backfilling Ratio of 40%
- (1)
- Before the mining reached a distance of 135 m, the roof displayed some degree of deformation but did not show obvious cracks or separations.
- (2)
- When the mining reached a distance of 135 m, at a distance of 28 m from the start line, a crack about 11 m high occurred at the lower part of the roof. The crack did not penetrate through the roof. At this time, the roof subsided by a maximum amount of 0.51 m and was separated from the No. 6 stratum.
- (3)
- When the mining reached a distance of 165 m, the hard roof experienced its initial fracture. Obvious cracks were observed above the start line, above the middle of the mined-out area, and above the working face. Due to uneven laying of the model, the fracture of the roof was somewhat stratum-wise. Above the start line and middle of the mined-out area, cracks did not penetrate through the rock mass but developed from the vertical direction toward the horizontal direction. At this time the maximum subsidence of the roof was 2.41 m, as shown in Figure 12.
- (4)
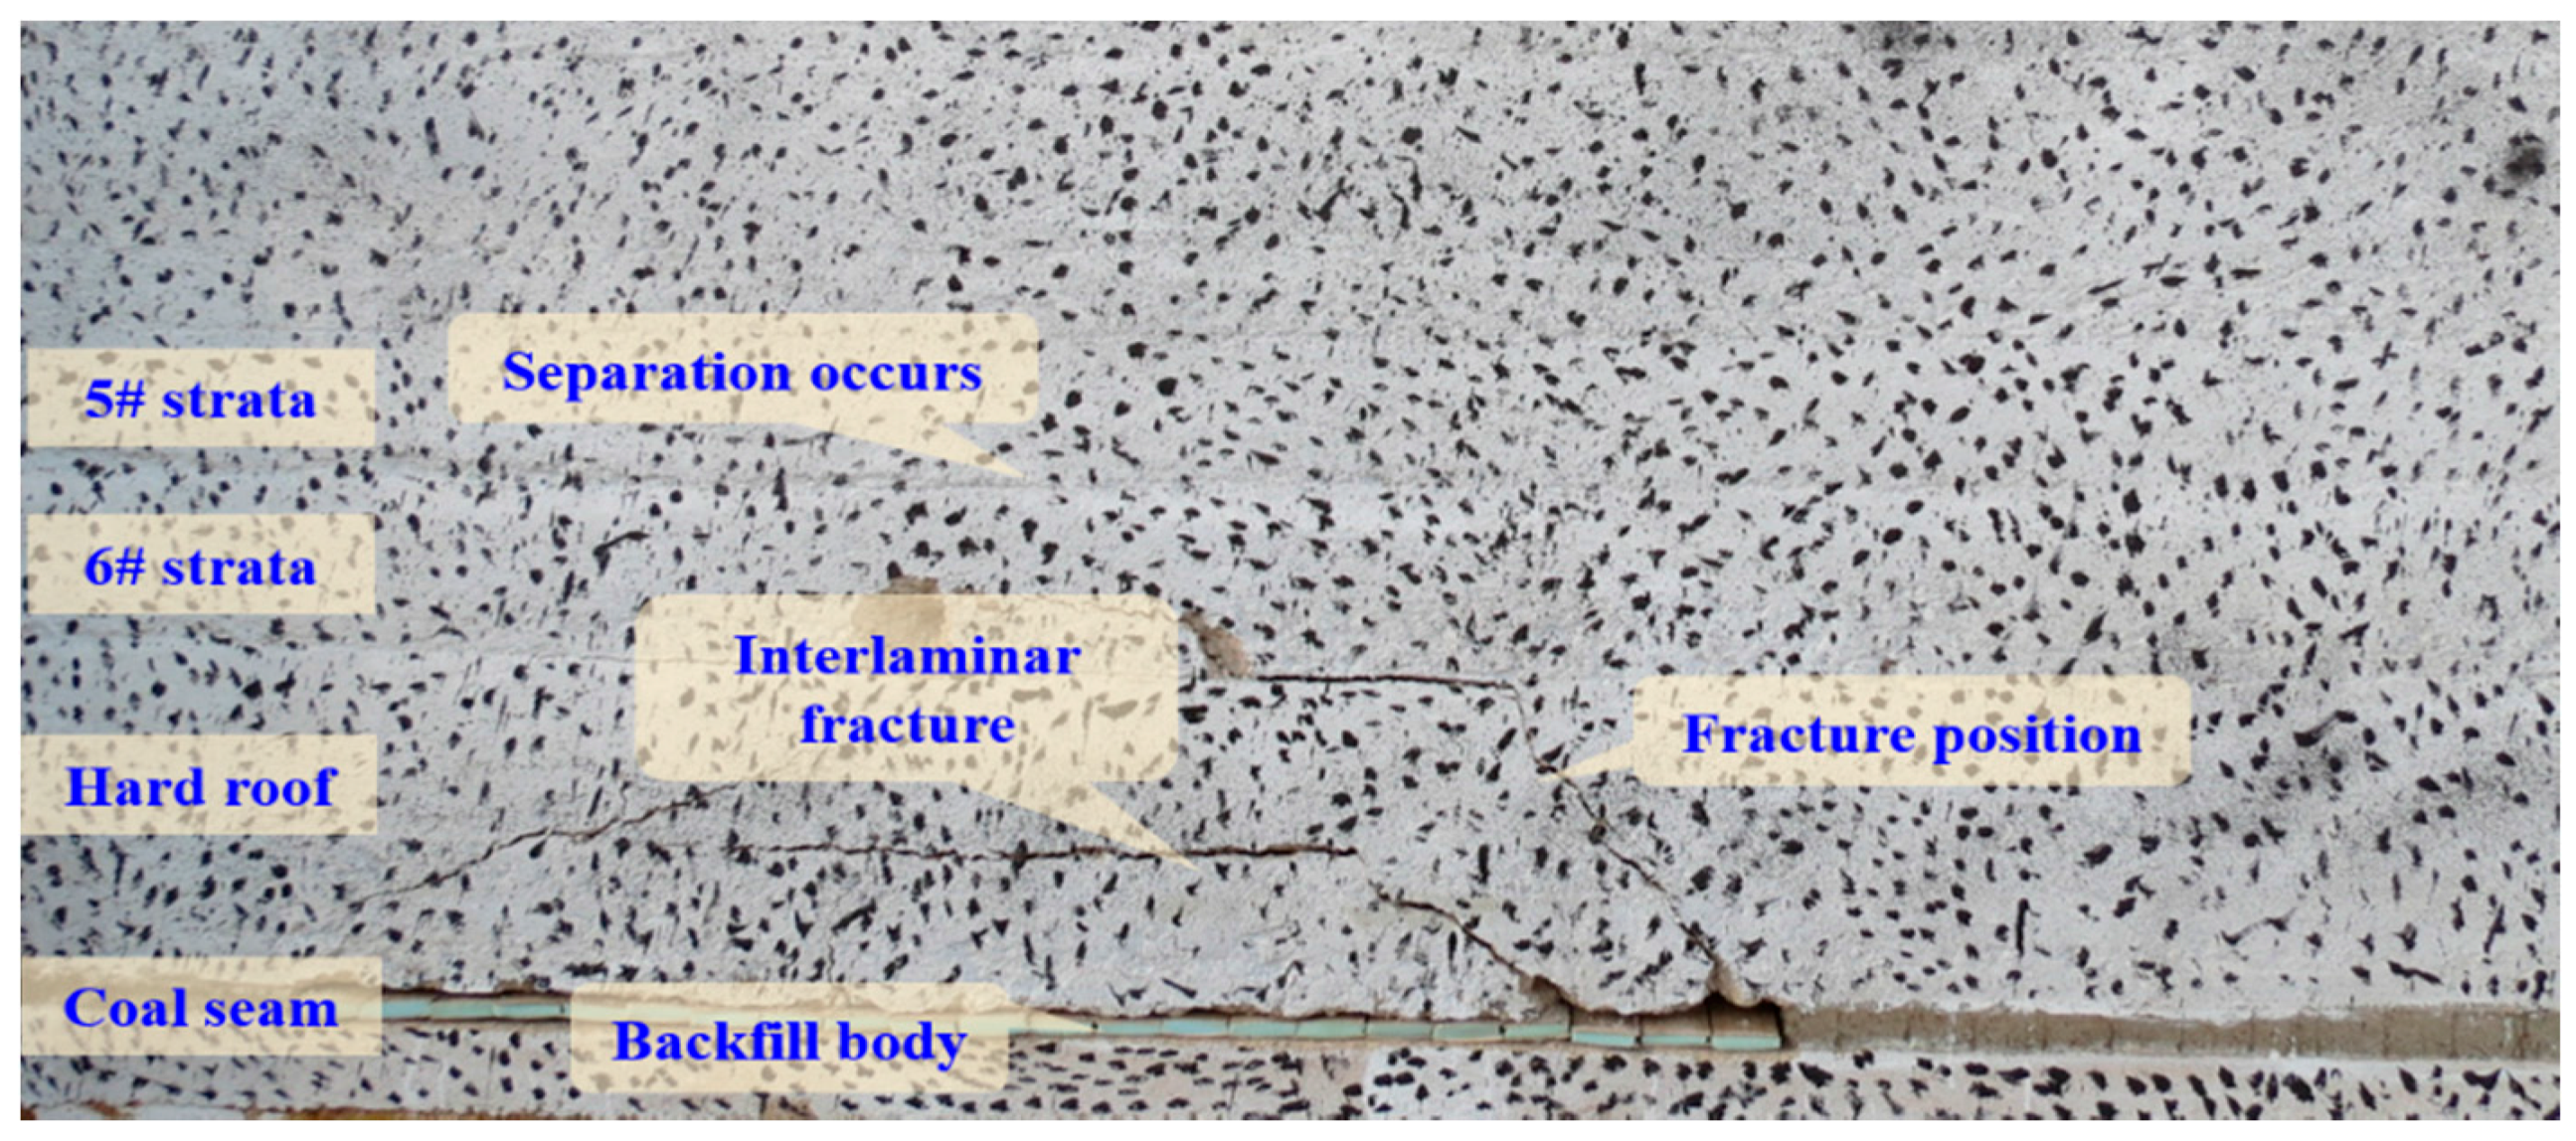
- When the mining reached a distance of 225 m, the hard roof experienced a periodic fracture, with a fracture interval of 60 m. The fractured roof weighed completely on the backfill body, and penetrating cracks occurred above the working face. At this time, the separations and cracks above the middle of the mined-out area gradually closed. The No. 6 stratum displayed vertical penetrating cracks and was separated from the No. 5 stratum, which also subsided by a maximum amount of 1.5 m, as shown in Figure 13.
- (5)
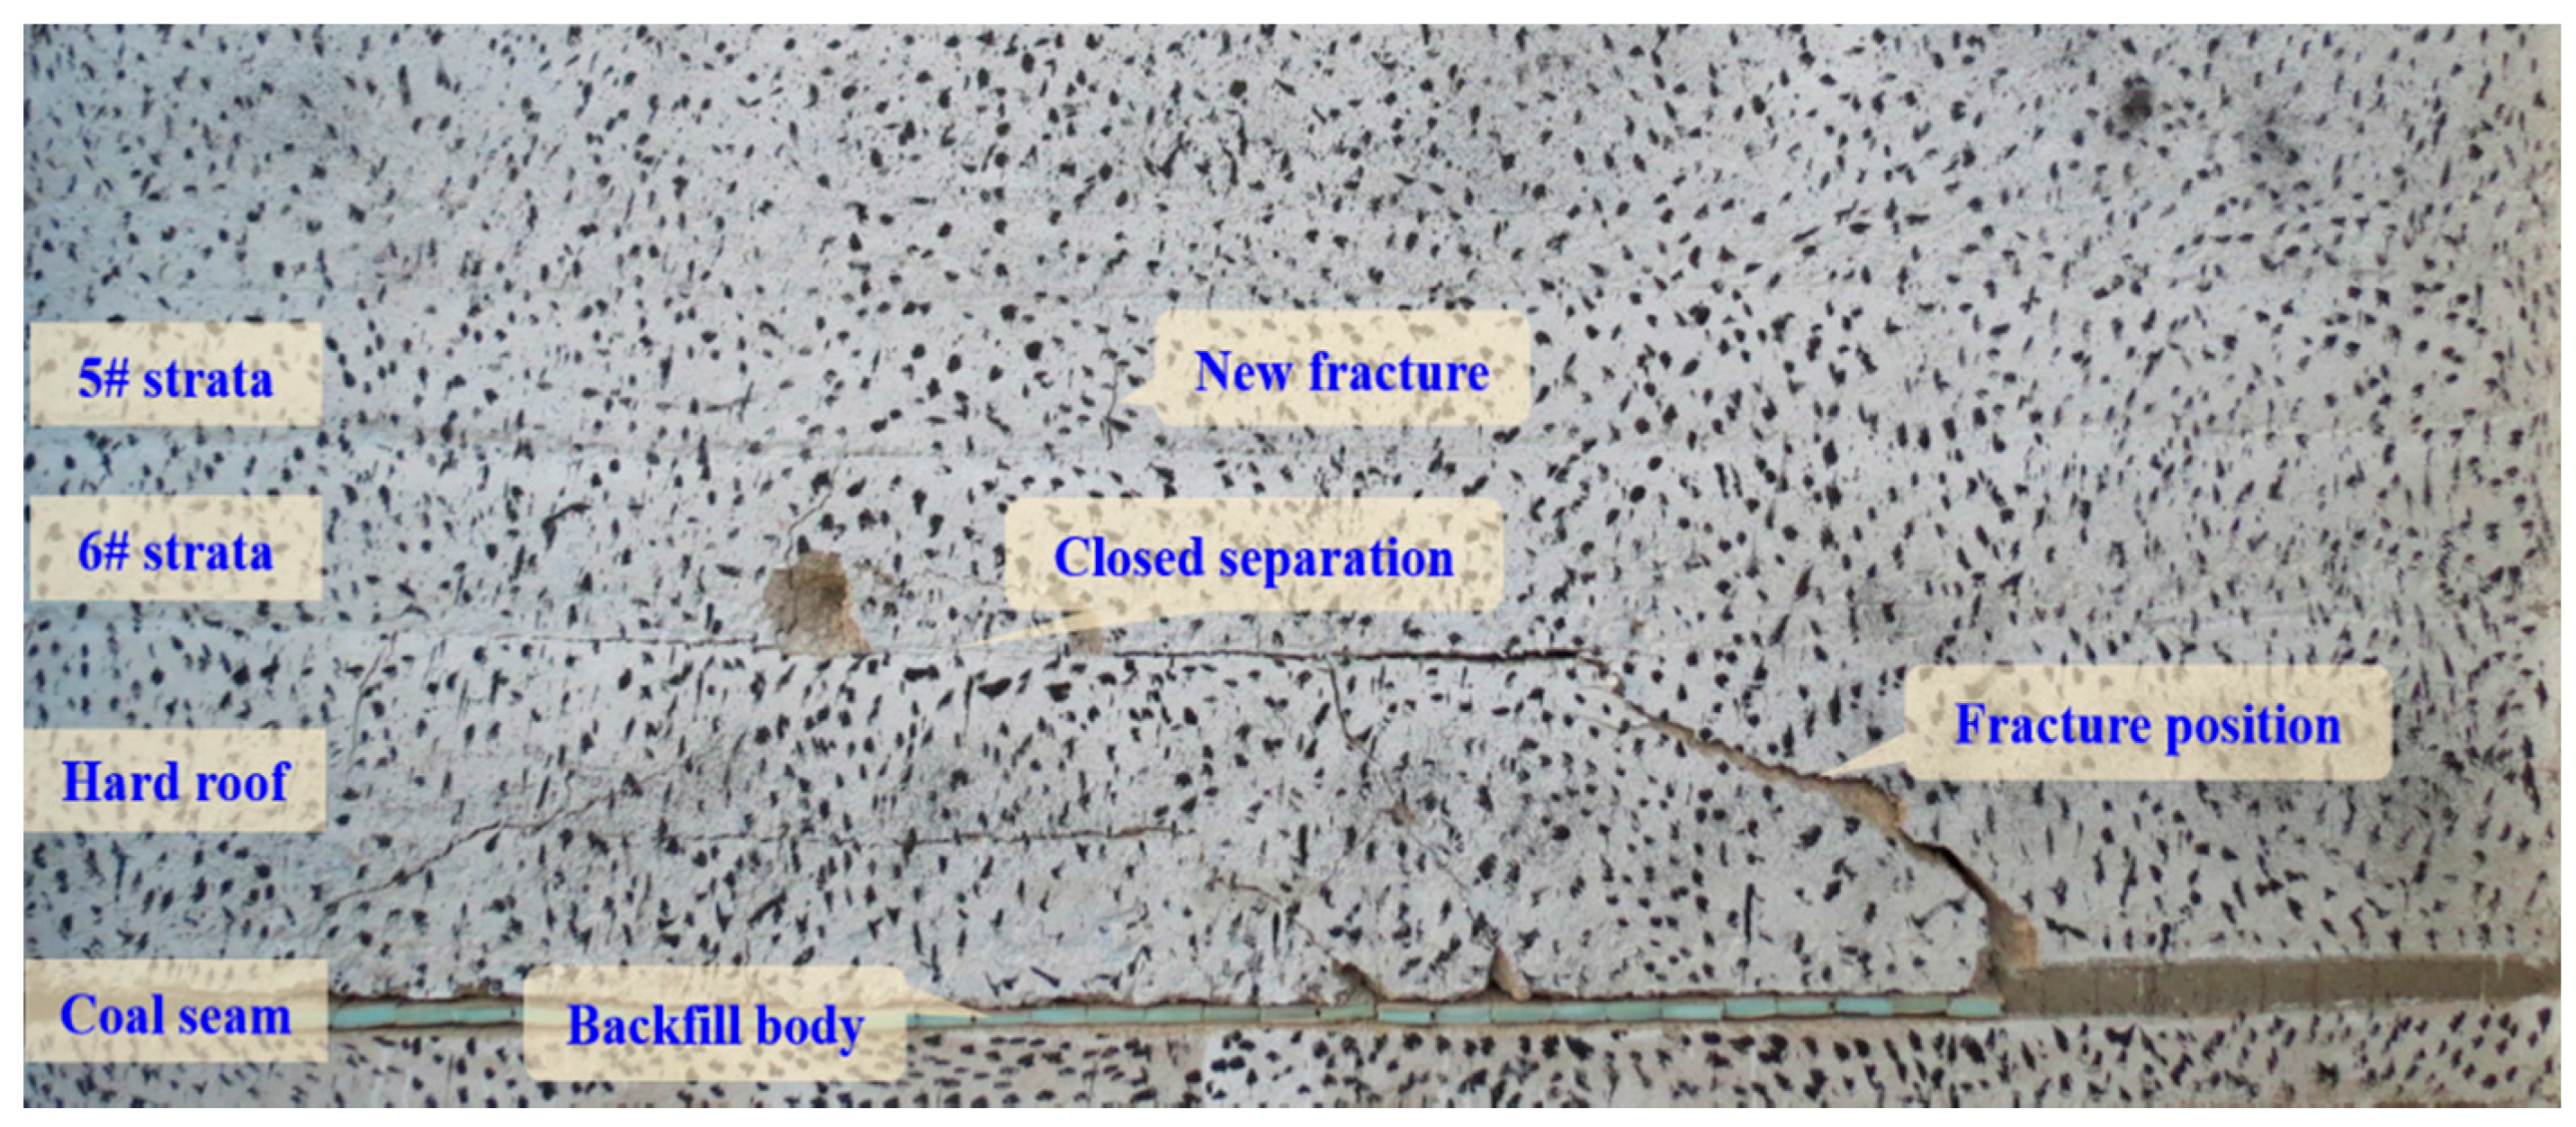
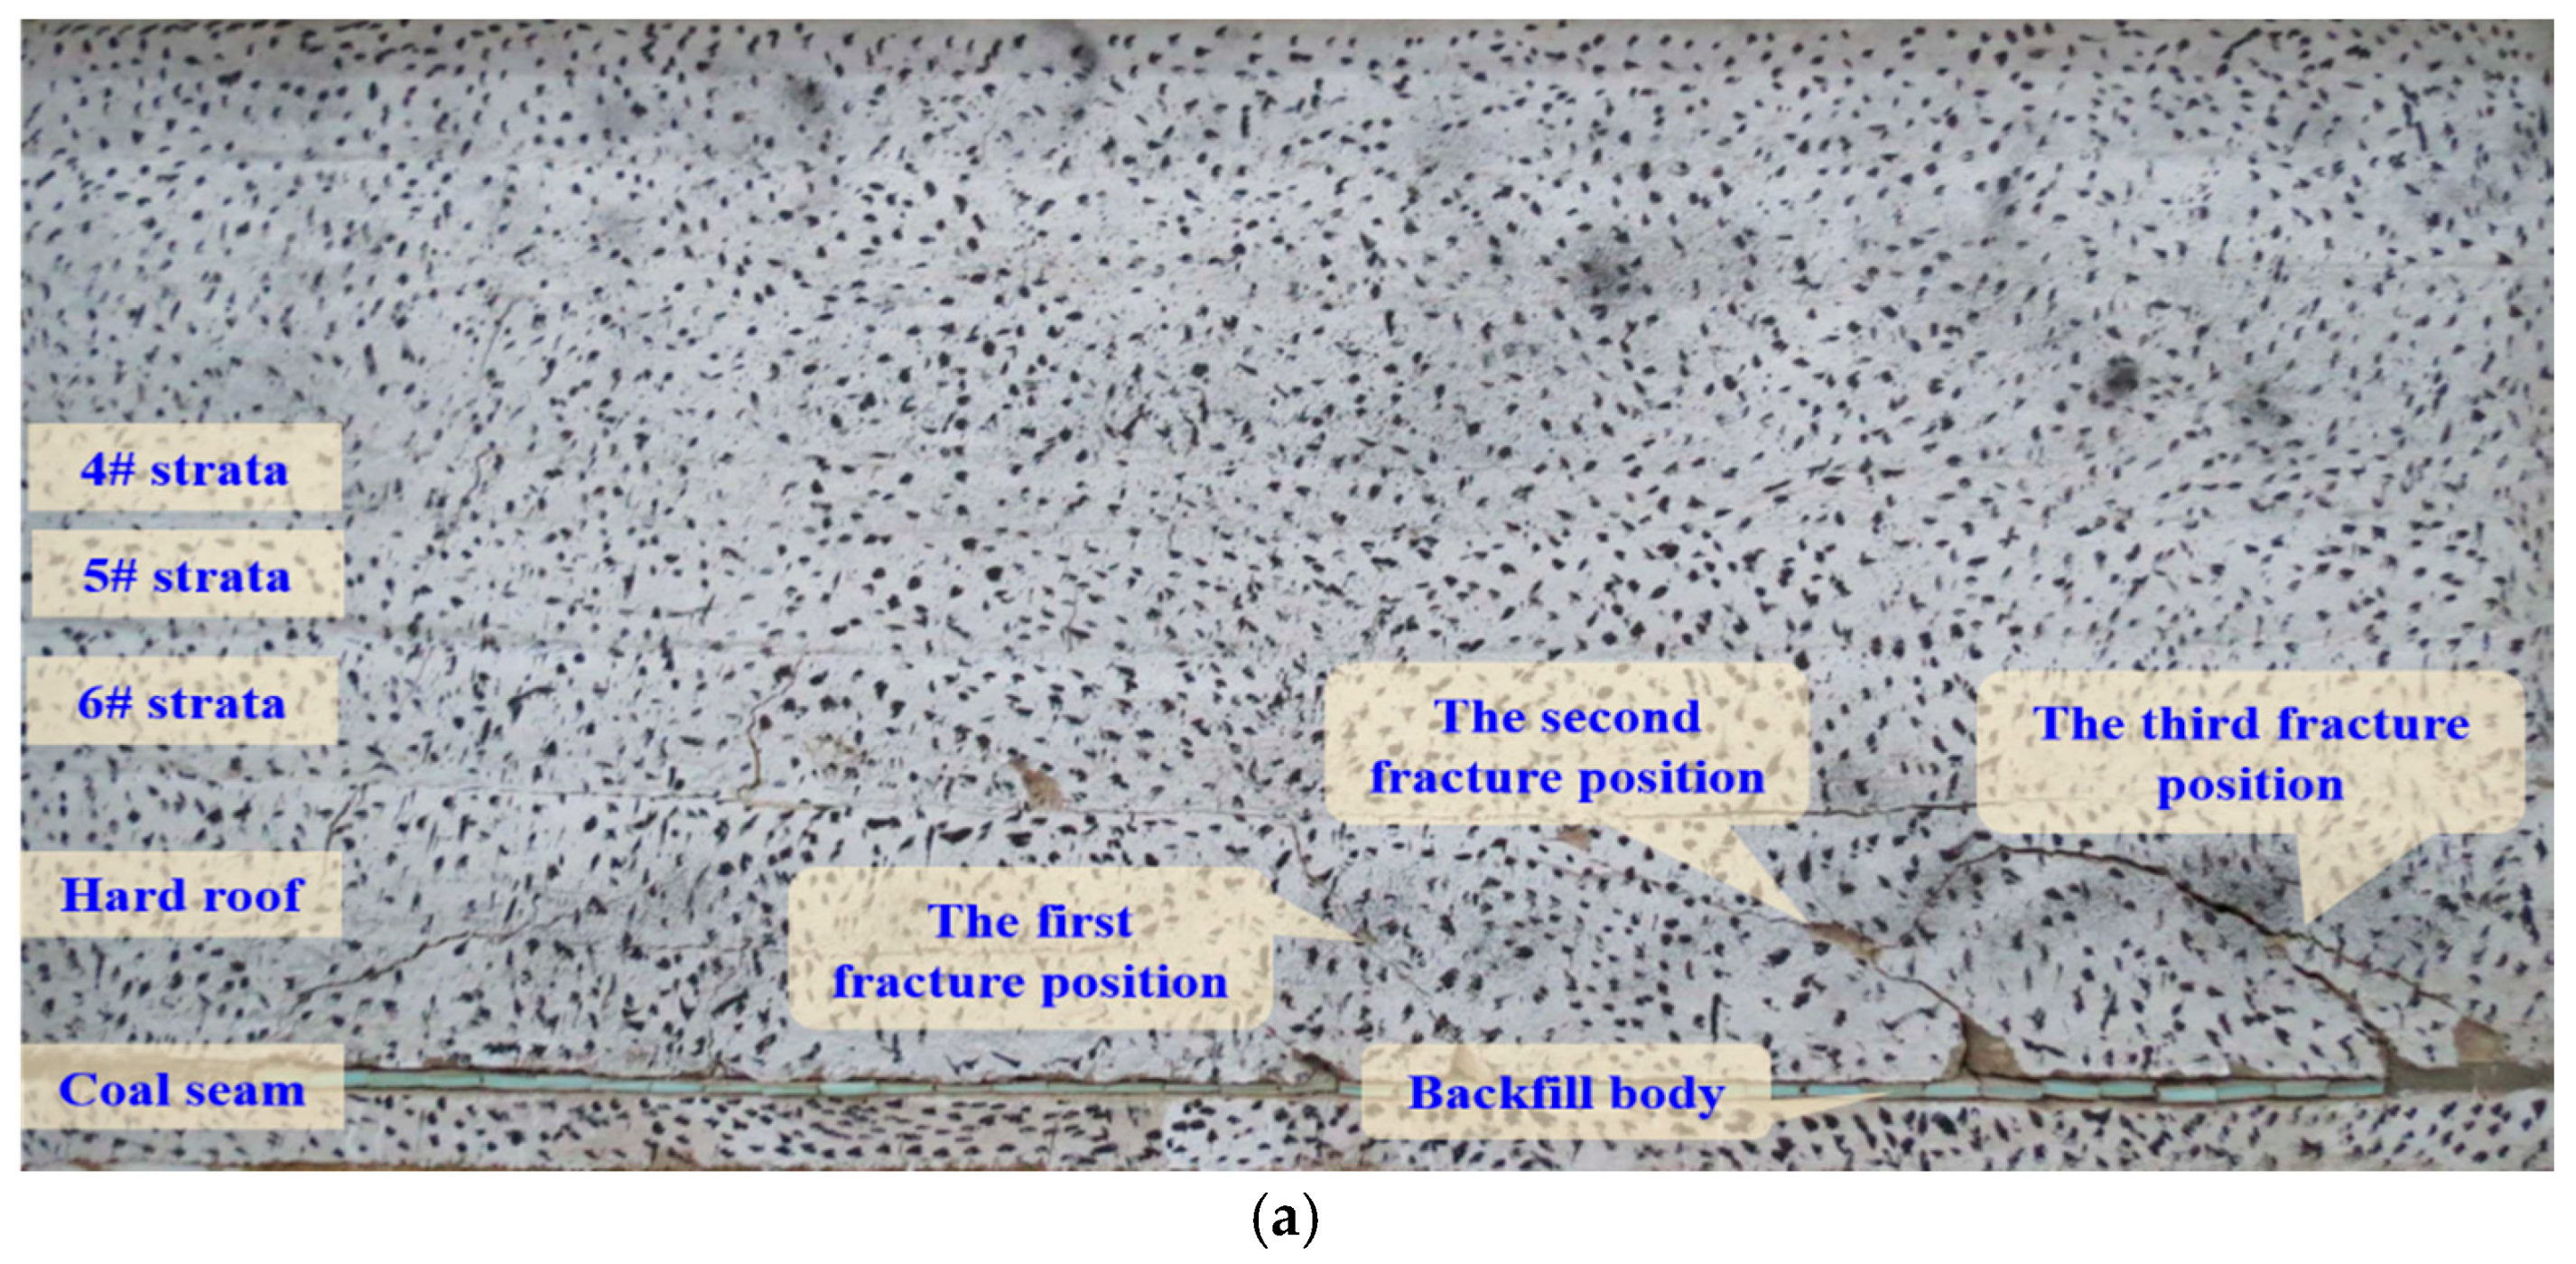
- When the mining reached a distance of 270 m (the stop line), a second periodic fracture occurred in the hard roof, with a fracture interval of 45 m. By this time cracks were developing across the entire model height, as shown in Figure 14.
4.3. Scenario 3: Roof-Controlled Backfilling Ratio of 82.5%
- (1)
- Before a distance of 150 m, the roof displayed successional curve subsidence with mining in the face. The maximum subsidence of the roof was only 0.13 m at a distance of 75 m.
- (2)
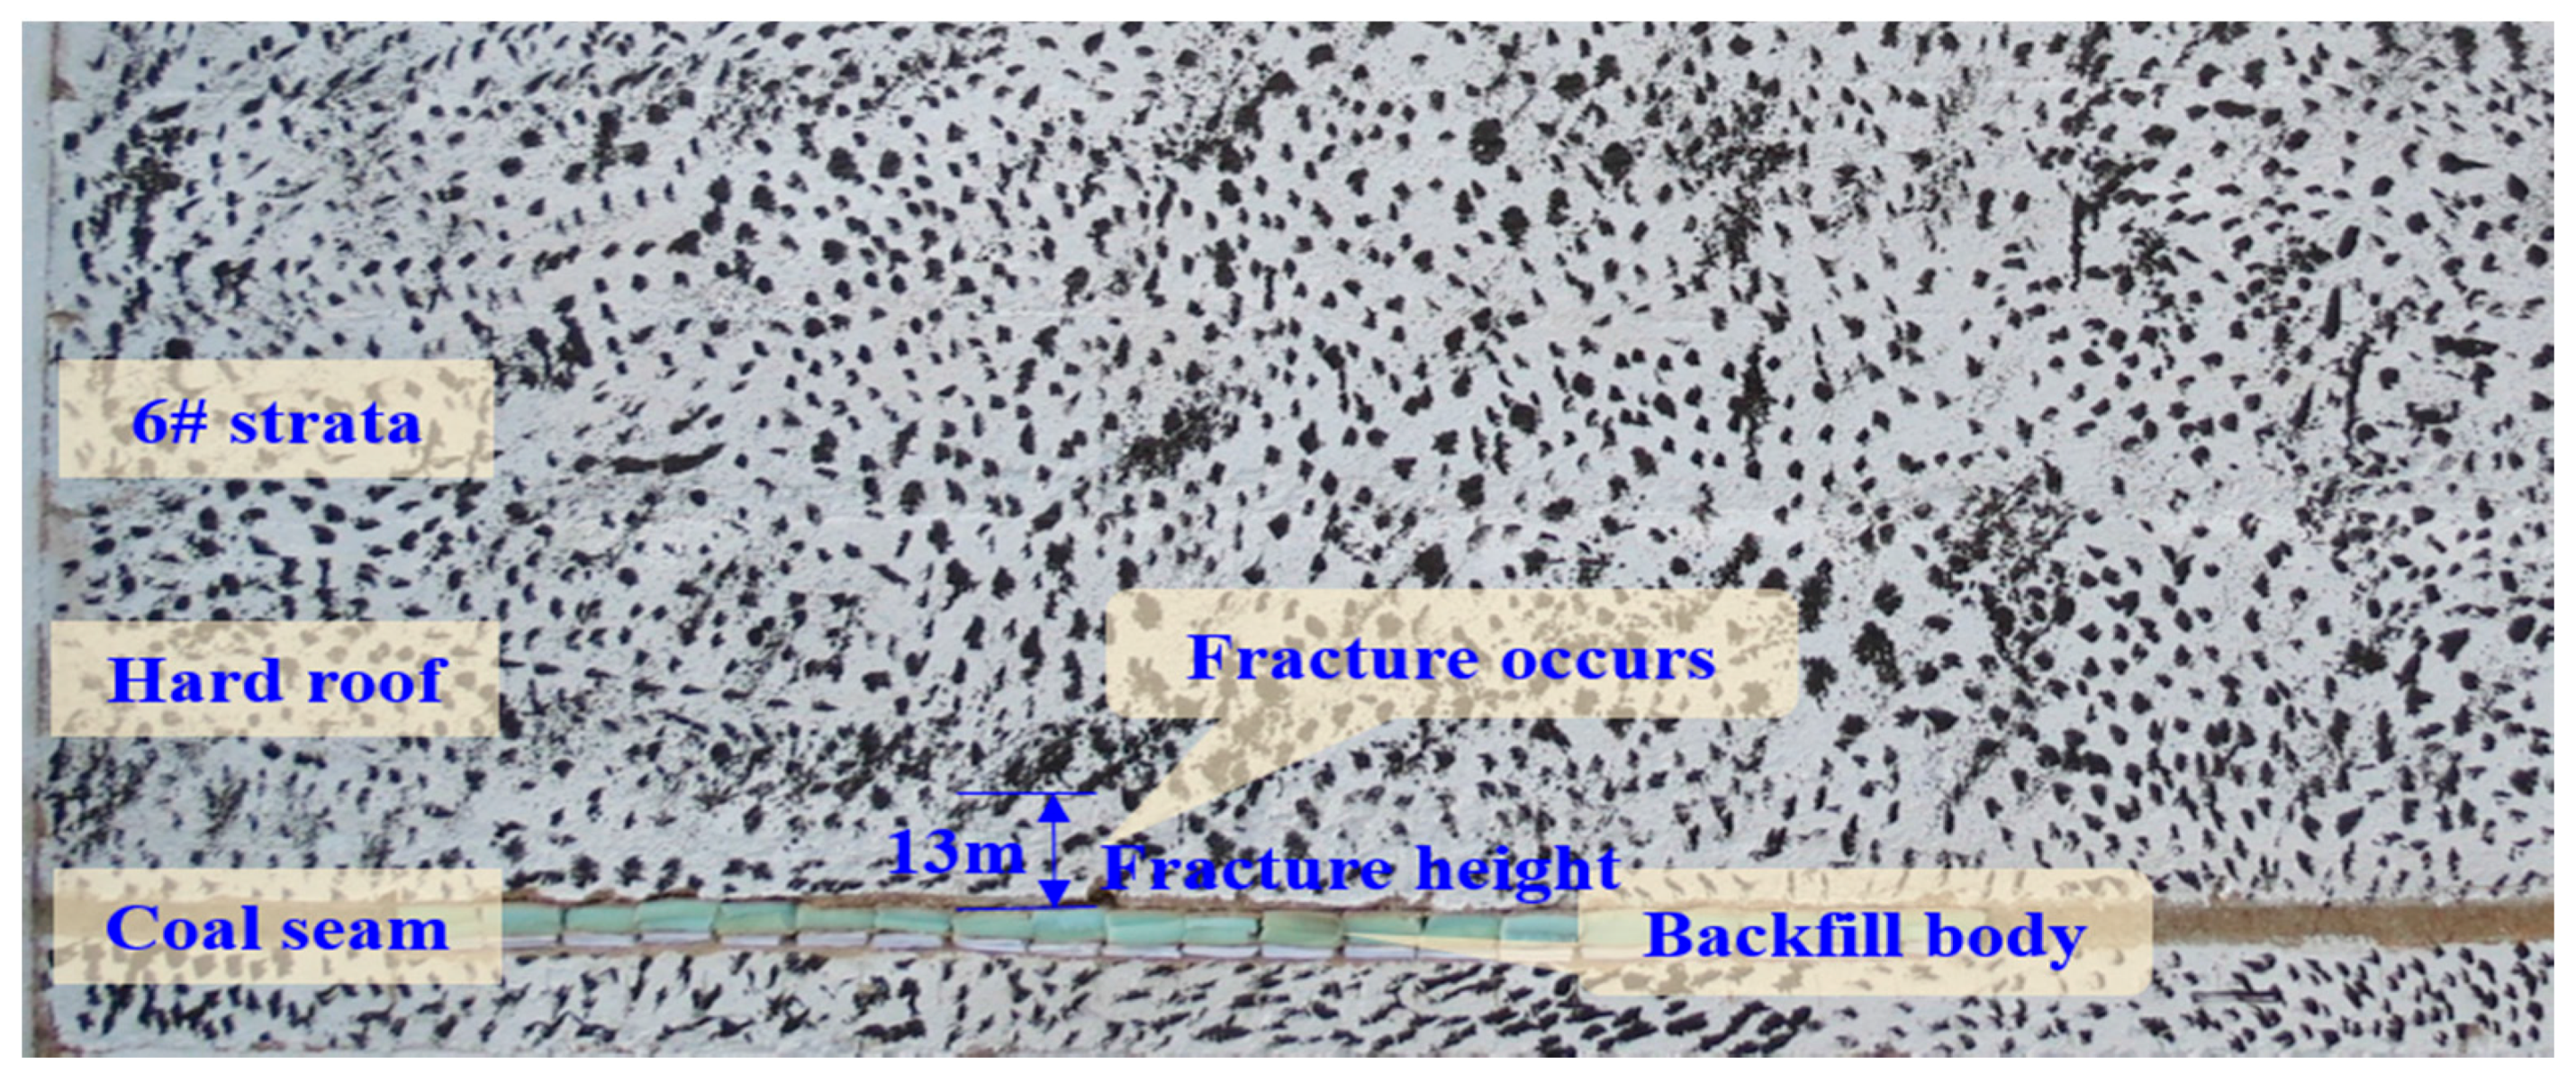
- When the mining reached a distance of 150 m, at a distance of 67 m from the start line, a crack about 13 m high occurred at the lower part of the roof. At this time the roof subsided by a maximum amount of 0.53 m, as shown in Figure 15.
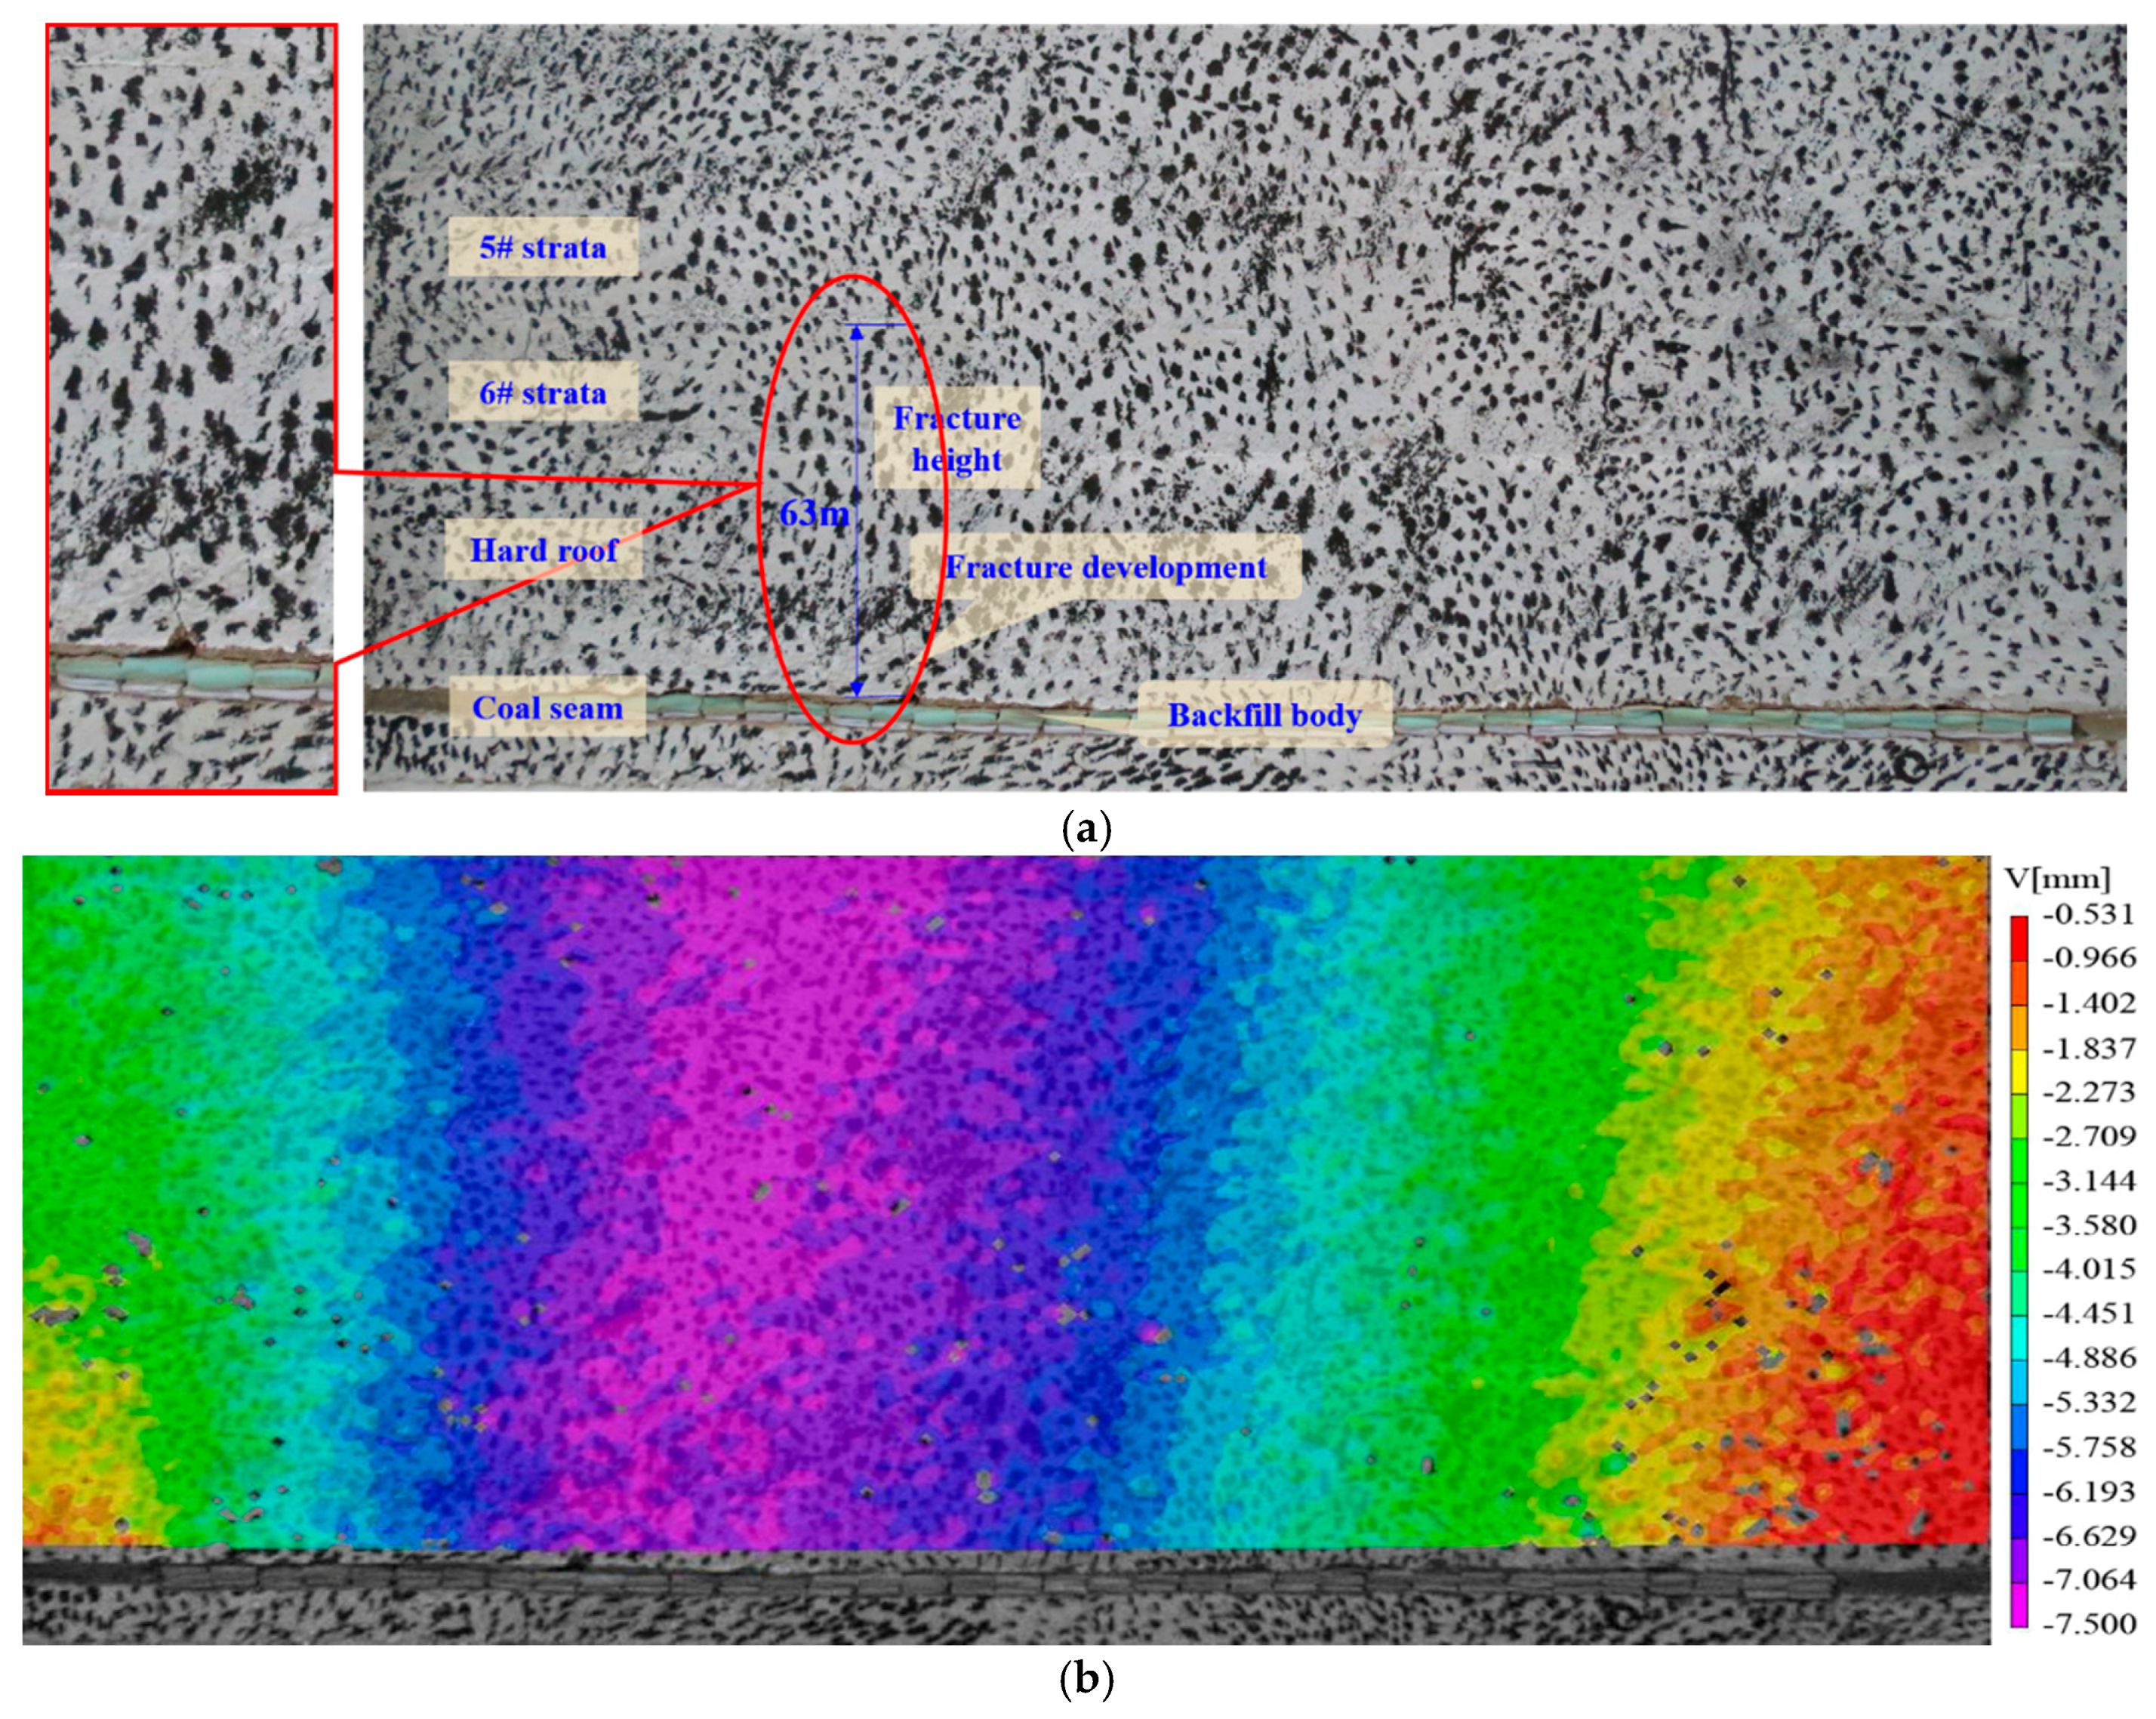
- (3)
- No obvious new cracks or separations occurred until the completion of mining in the working face. Once the deformation of the hard roof and the overlying strata had become stable, the existing crack developed to a height of 63 m, with the roof subsiding by a maximum amount of 1.13 m, as shown in Figure 16.
4.4. Scenario 4: Roof-Controlled Backfilling Ratio of 97%
- (1)
- Before a distance of 232.5 m, the roof only showed curve subsidence, with no obvious separations or cracks. The maximum subsidence of the roof was 0.43 m at a distance of 150 m.
- (2)
- When the mining reached a distance of 232.5 m, at a distance of 125.5 m from the start line, a crack about 10 m high occurred at the lower part of the roof. The crack did not penetrate through the roof. At this time the roof subsided by a maximum amount of 0.77 m.
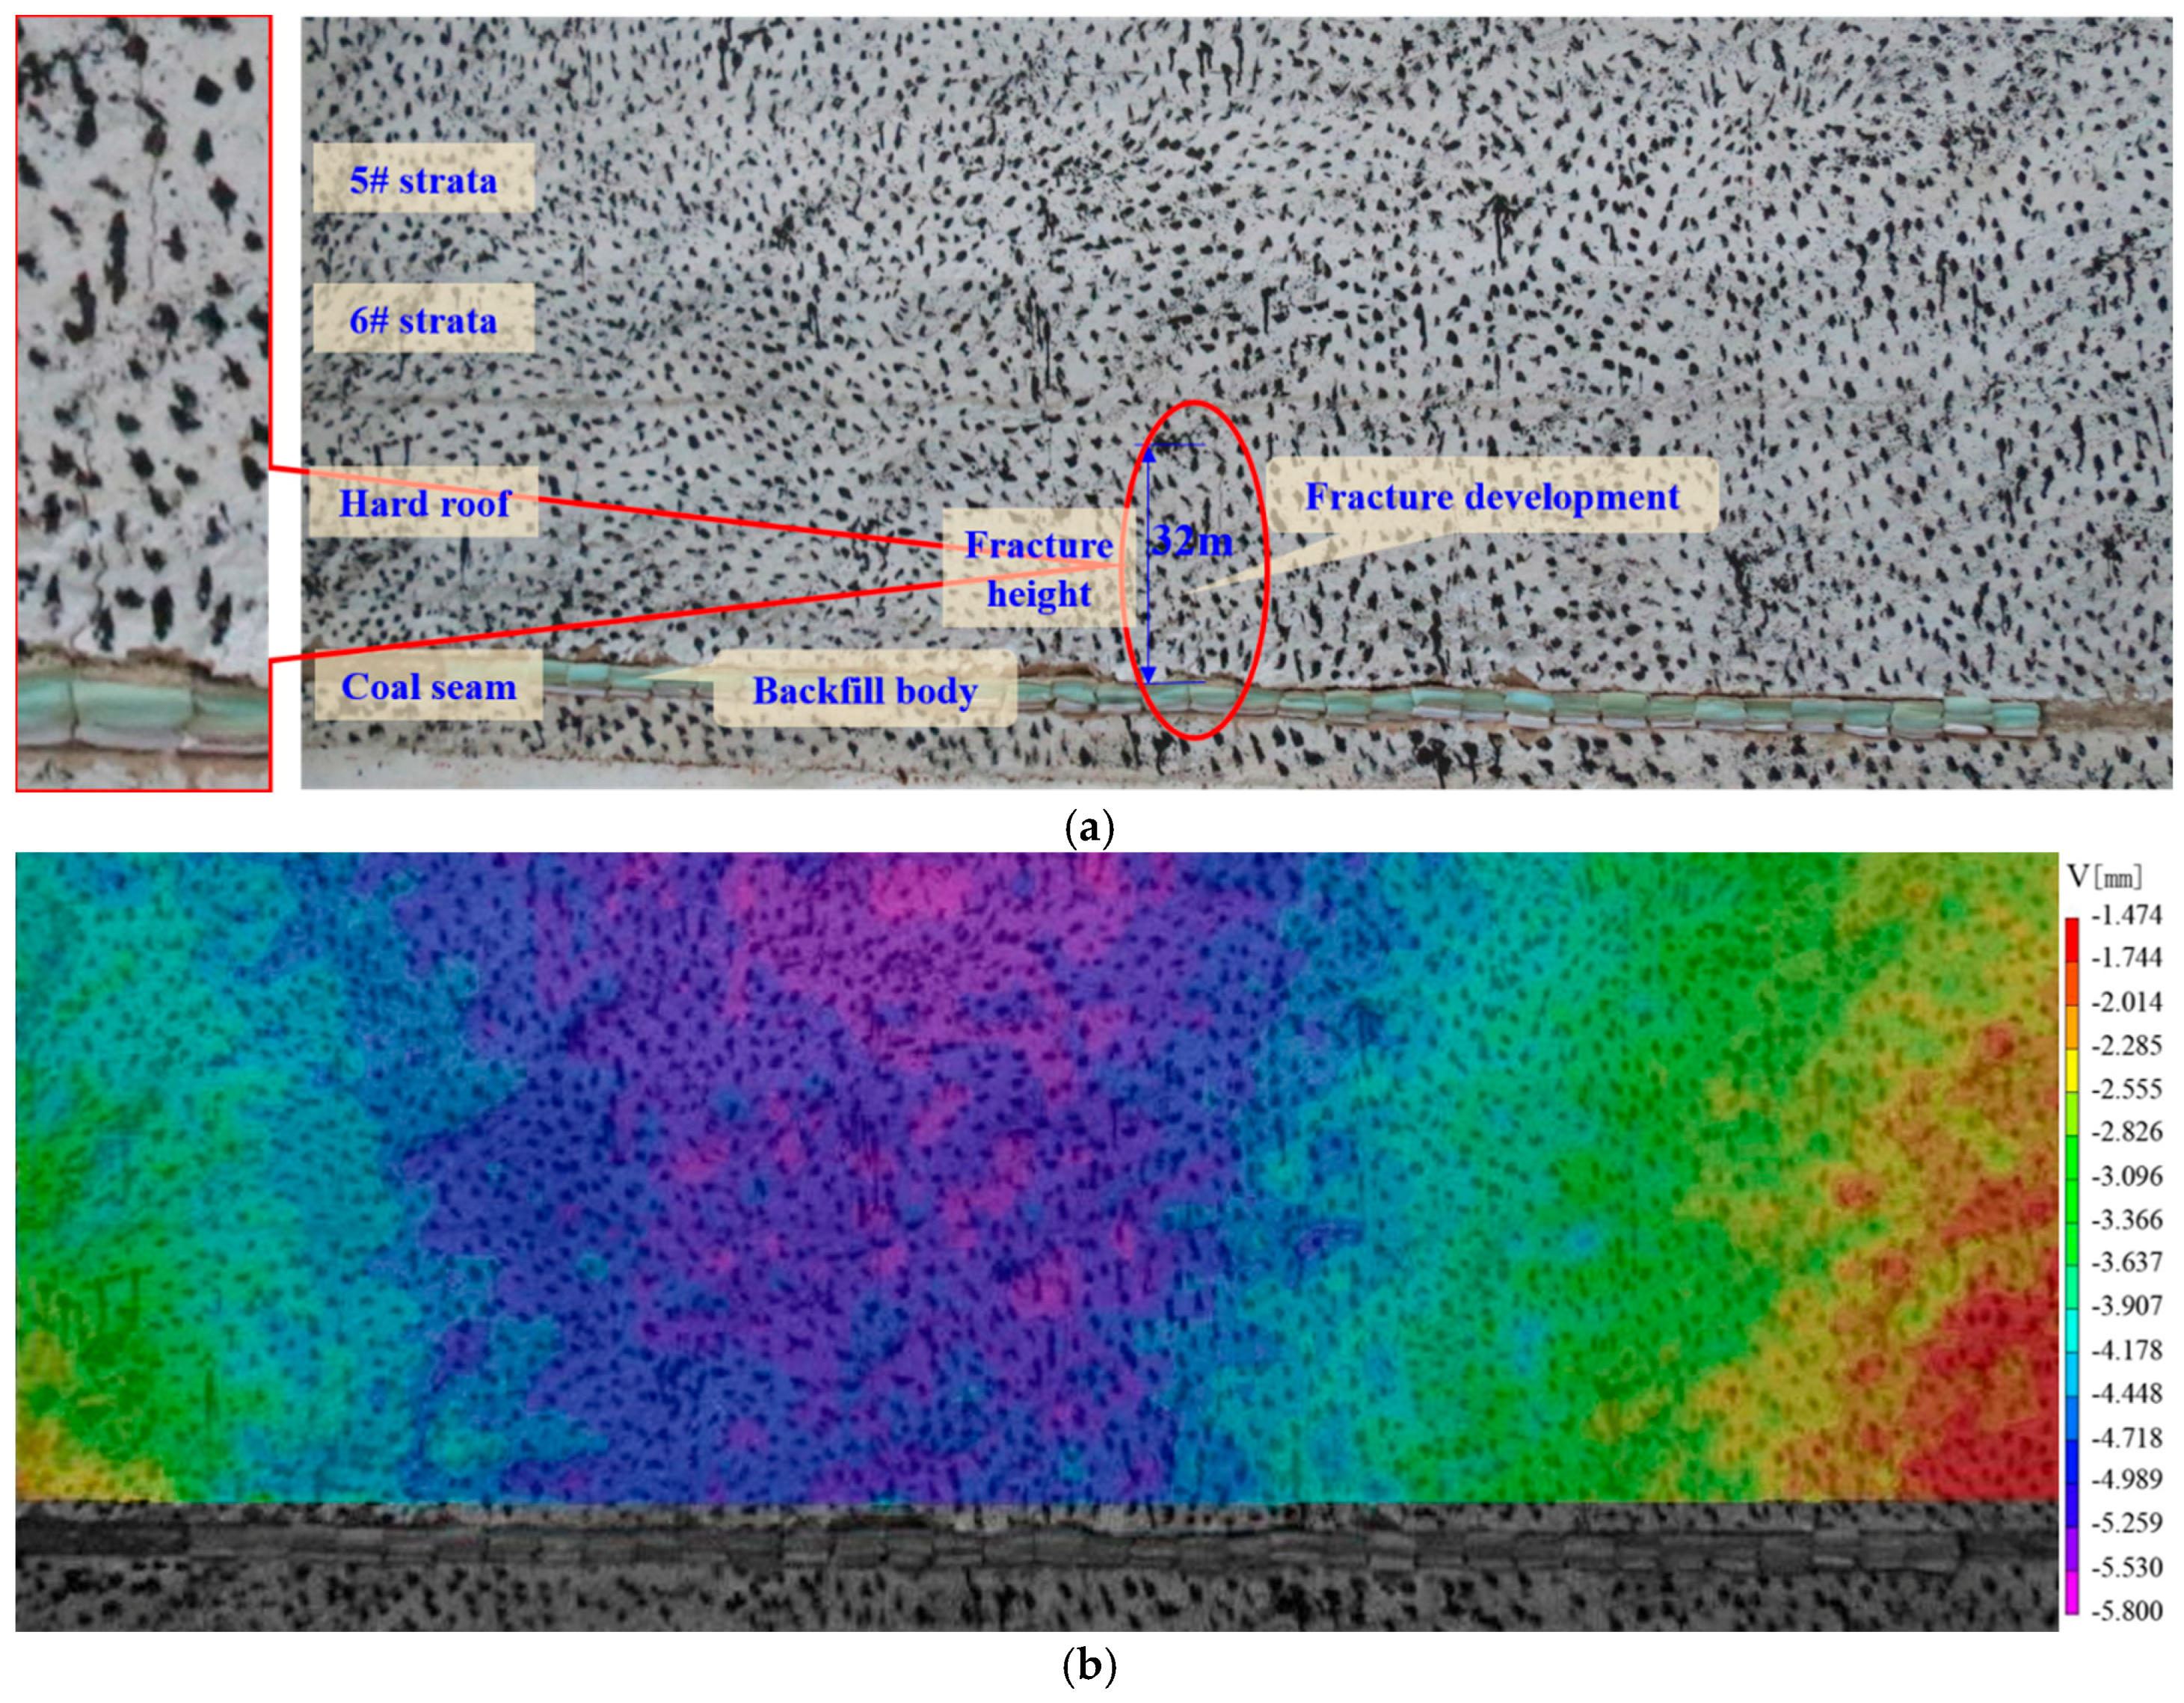
- (3)
- As the mining advanced, the crack developed higher, but no new cracks or separations developed. After the completion of mining in the working face, the existing crack grew to a maximum of 32 m but still did not penetrate through the roof. The maximum subsidence of the roof was 0.81 m, as shown in Figure 17.
5. Analysis of the Solid Backfill Body’s Performance in Controlling Deformation of the Hard Roof
5.1. Effect of the Solid Backfill Body on Roof Deformation
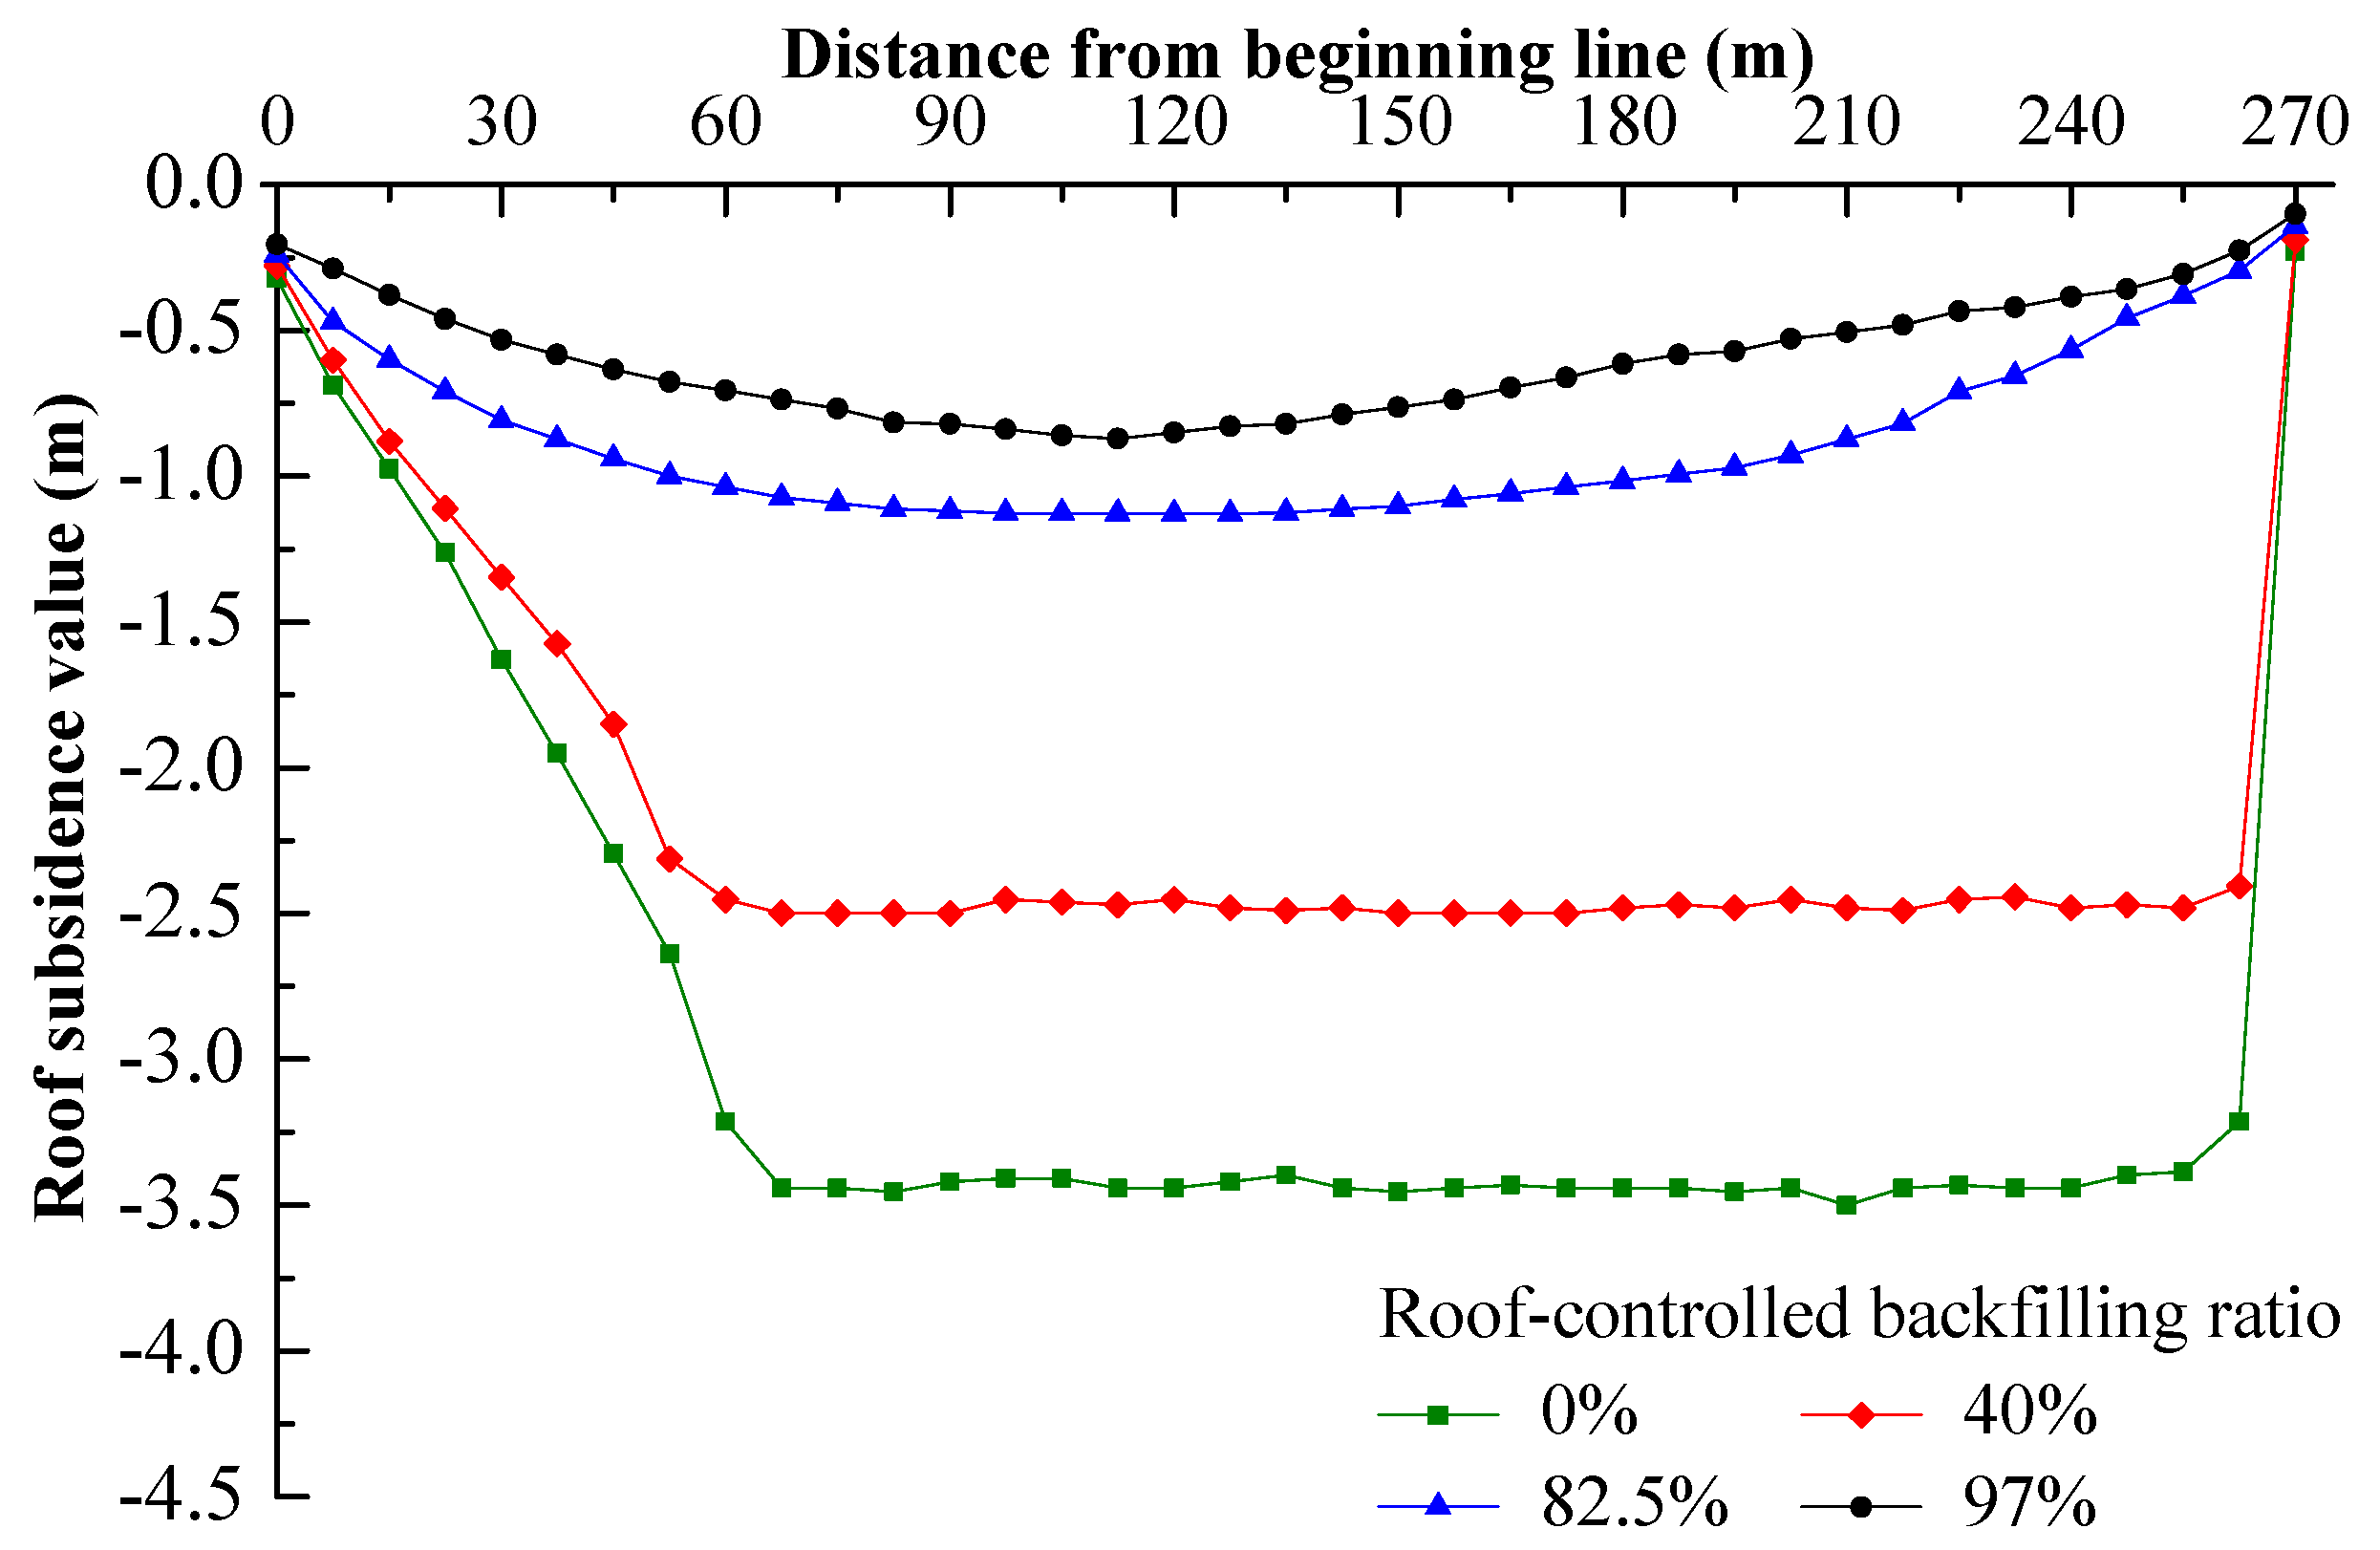
- (1)
- The maximum subsidence of the hard roof decreased with increasing roof-controlled backfilling ratio. When the roof-controlled backfilling ratio was 97% in comparison with the caving method (0%), the maximum subsidence of the hard roof dropped from 3.42 m to 0.81 m; a decrease of 76.3%. As the roof-controlled backfilling ratio increased, the maximum height of the cracks that developed decreased; the maximum was only 32 m for the scenario with a backfilling ratio of 97%.
- (2)
- When the roof-controlled backfilling ratios were 0% and 40%, the hard roof did not make contact with the backfill body prior to the occurrence of fractures, and displayed obvious initial and periodic fractures. Meanwhile, the mining distance between two fractures was only the distance of one cycle of mining. Due to the uneven laying of the rock strata and the error in the mining time, it was considered that the fracture intervals under these two scenarios were the same and that the mining distance at which the first roof crack appeared under both scenarios was also the same.
- (3)
- When the roof-controlled backfilling ratios were 82.5% and 97%, the hard roof maintained contact with the backfill body the entire time. As mining progressed along the working face, the roof displayed successional curve subsidence, but with no sudden fractures. Only one crack developed and the mining distance at which the crack appeared was 150 m and 232.5 m for ratios of 82.5% and 97%, respectively, compared to a distance of 127.5 m with the caving method.
5.2. Effect of the Solid Backfill Body on Distribution of Abutment Stress Ahead of the Face
- (1)
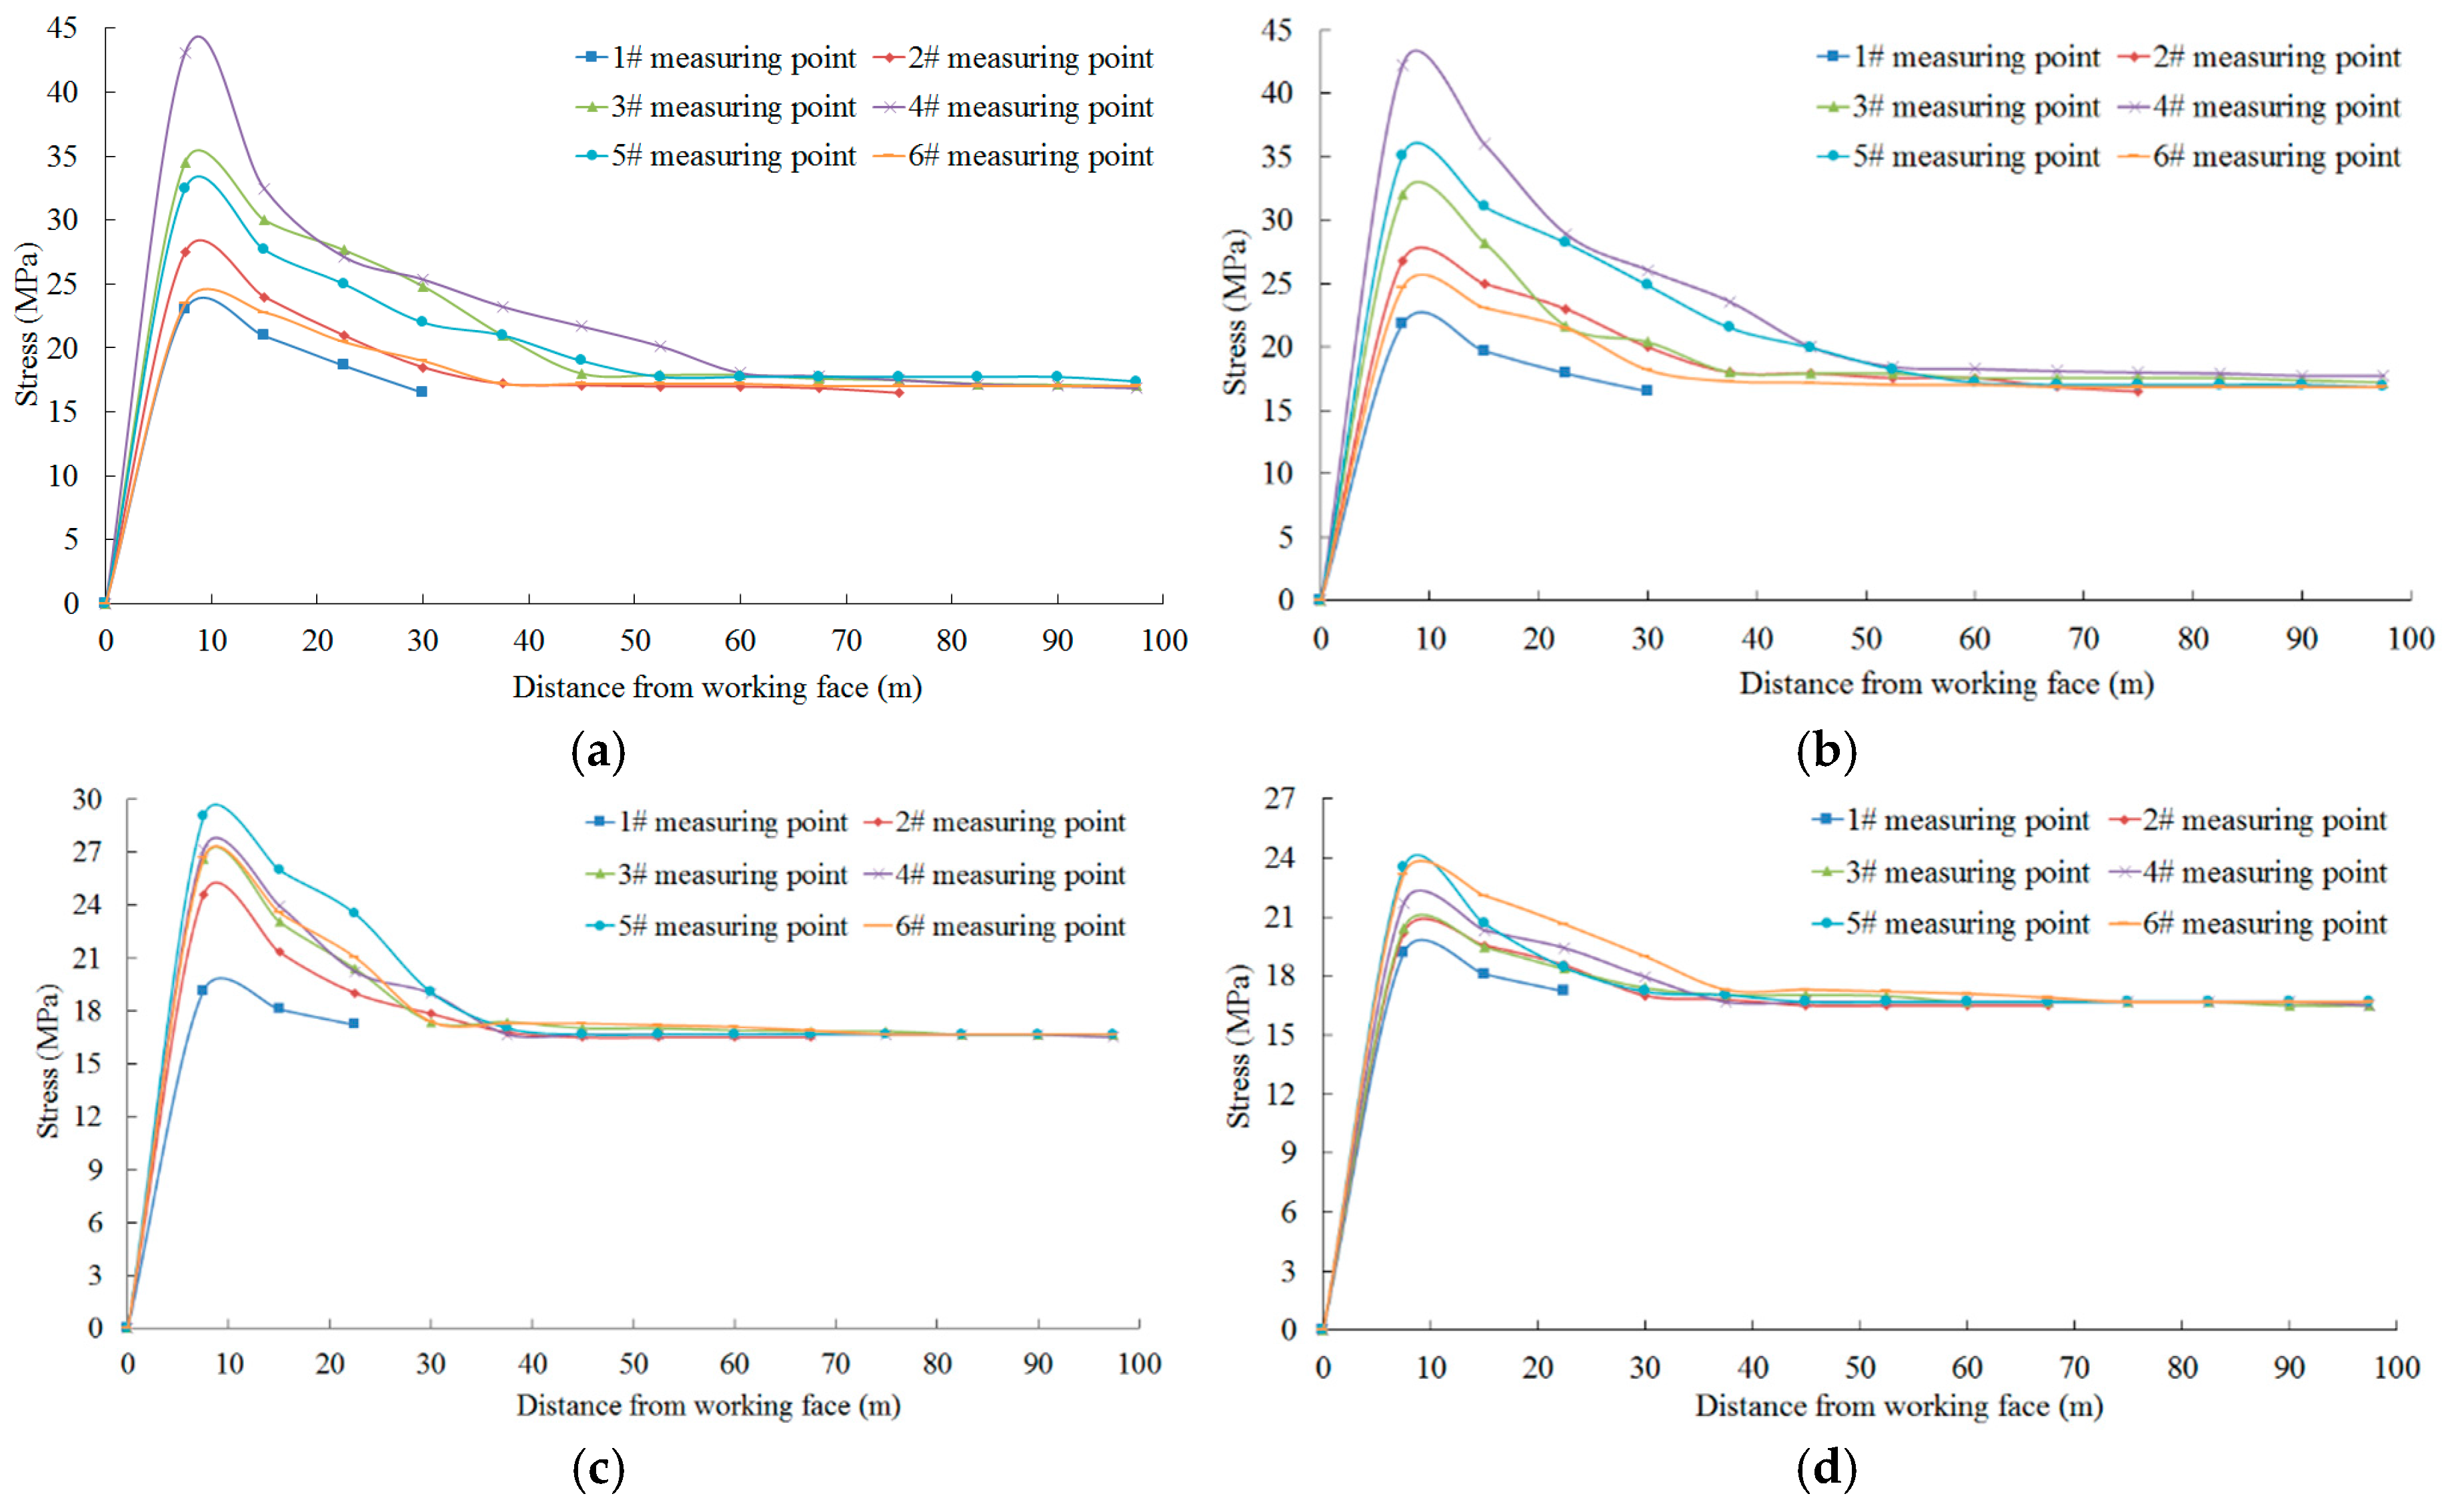
- When the backfilling ratio was 40%, the roof did not contact the backfill body prior to the occurrence of the fracture. The distribution of abutment stress ahead of the face under this scenario was basically the same as that under the caving method (backfilling ratio of 0%). The peak abutment stress ahead of the face reached approximately 43 MPa, with an impact range of about 45 m.
- (2)
- When the backfilling ratio reached 82.5% and 97%, the abutment stress ahead of the face decreased to 29 MPa and 23.5 MPa, respectively; a decrease of 32.7% and 45.5%, respectively, when compared to the caving method. The impact range also dropped significantly, reducing from 45 m to 30 m and 22.5 m with the backfilling ratios of 82.5% and 97%, respectively.
6. Analysis of Field Measurements
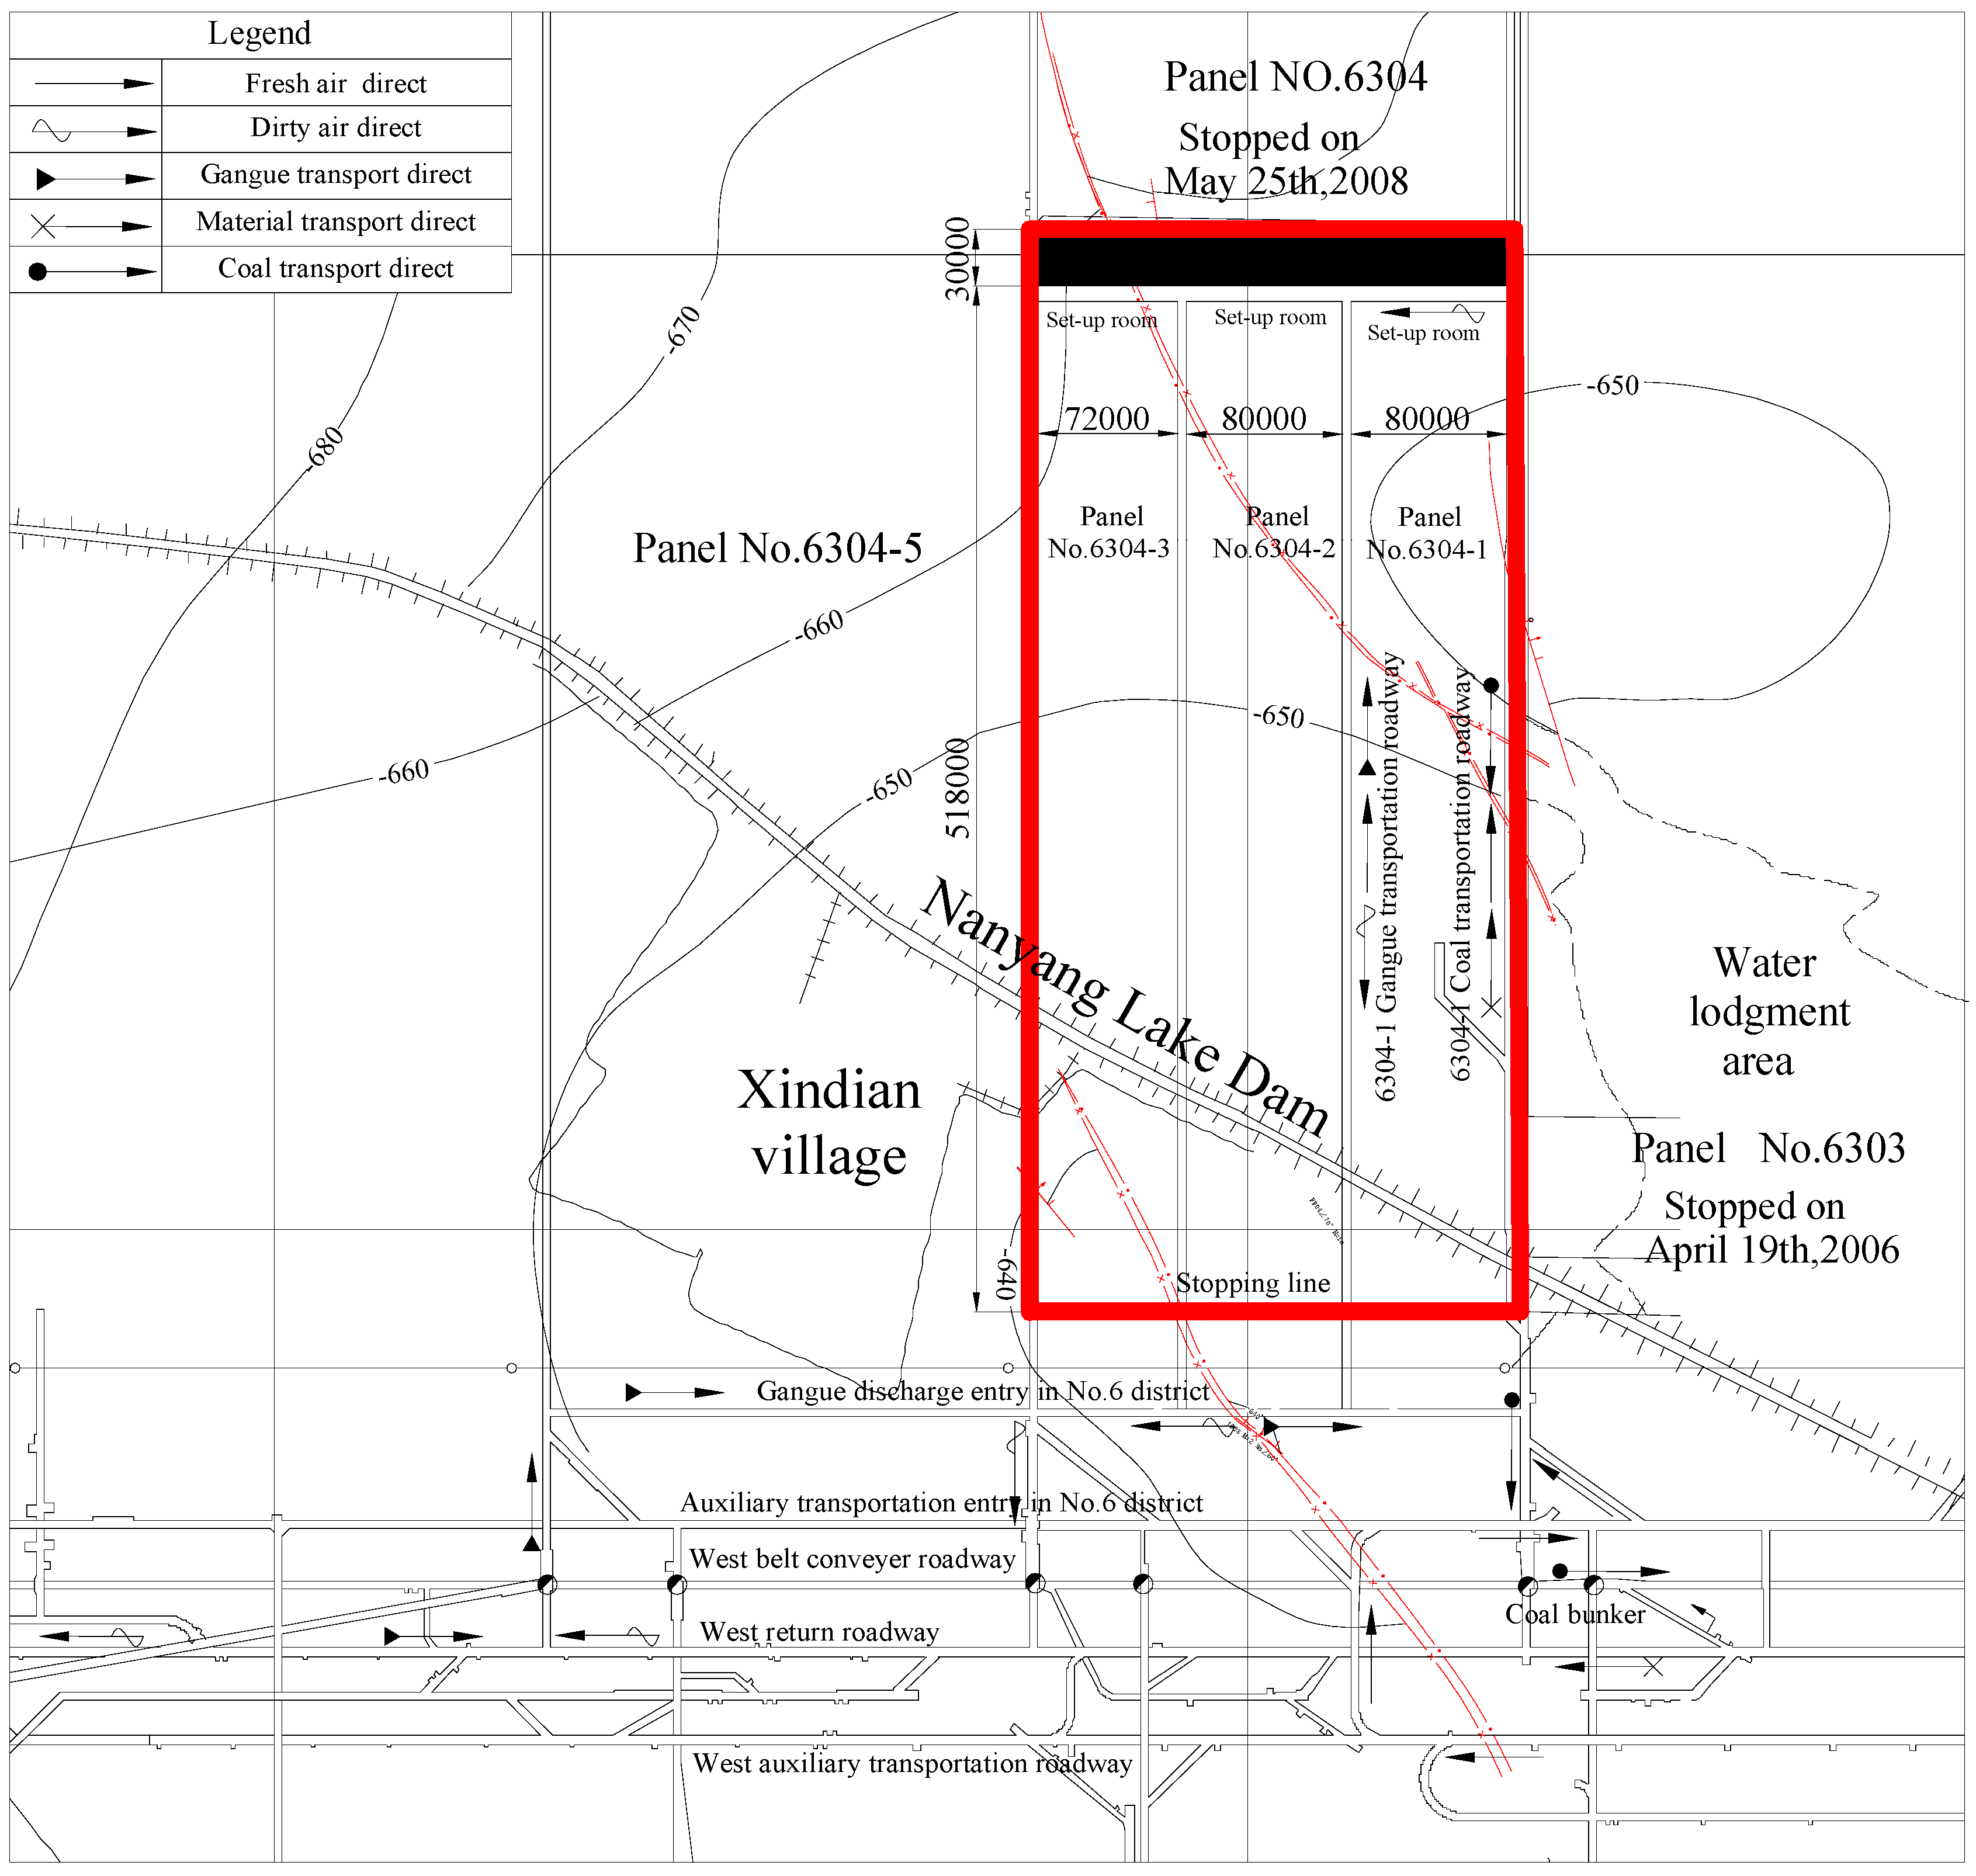
6.1. Mining and Geological Conditions of the Test Site
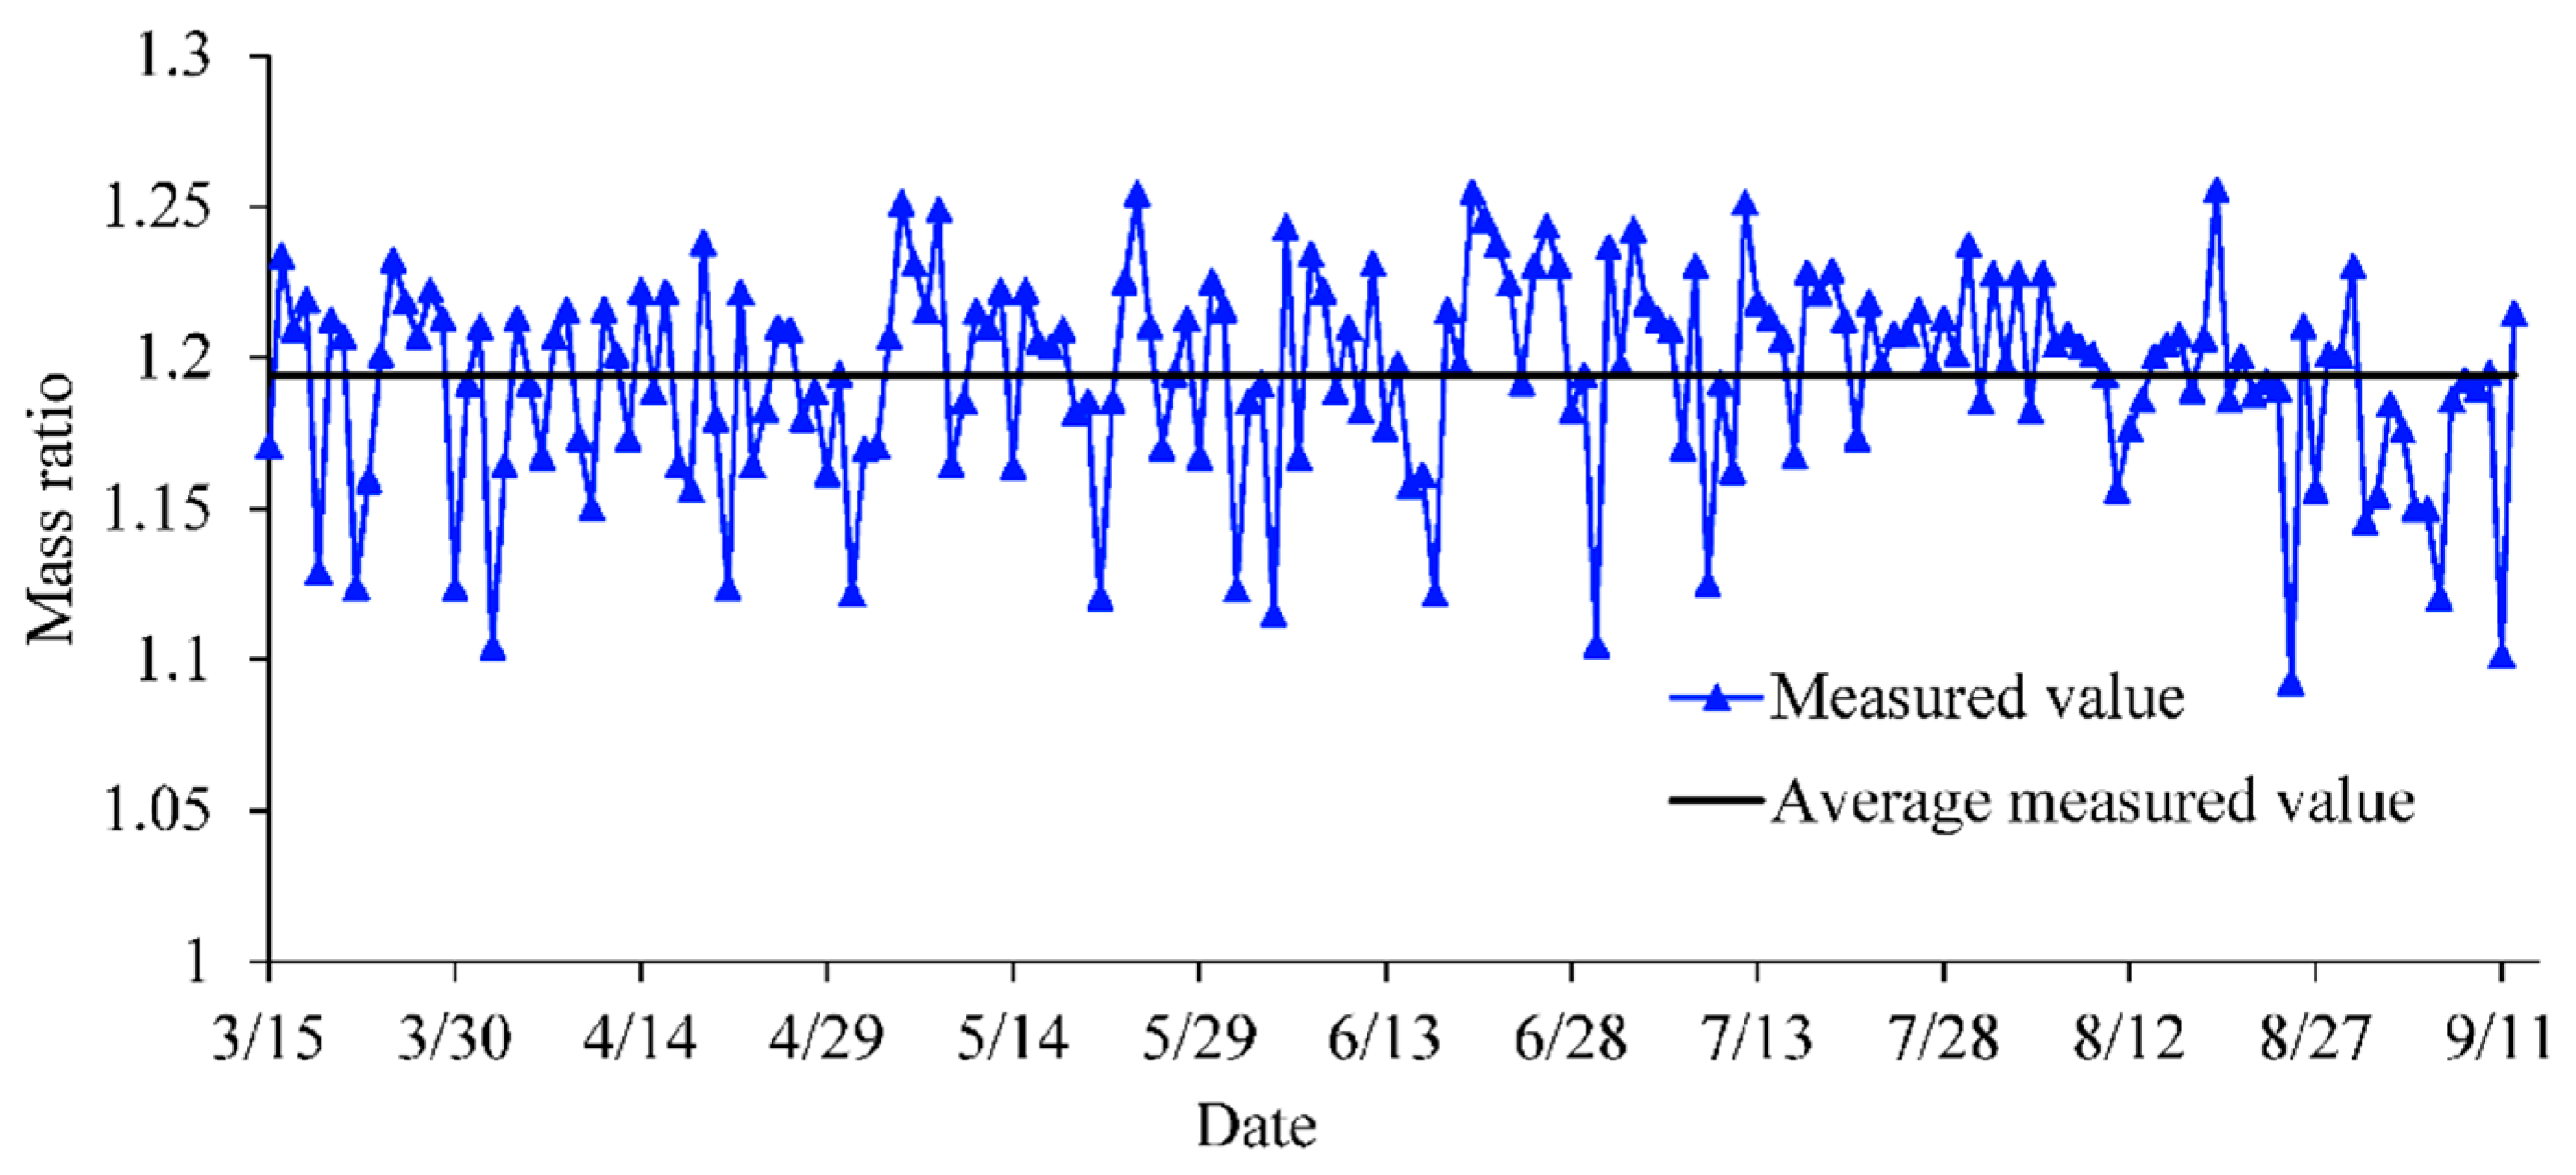
6.2. Measurement of the Ratio of Backfilled Mass to Mined Mass
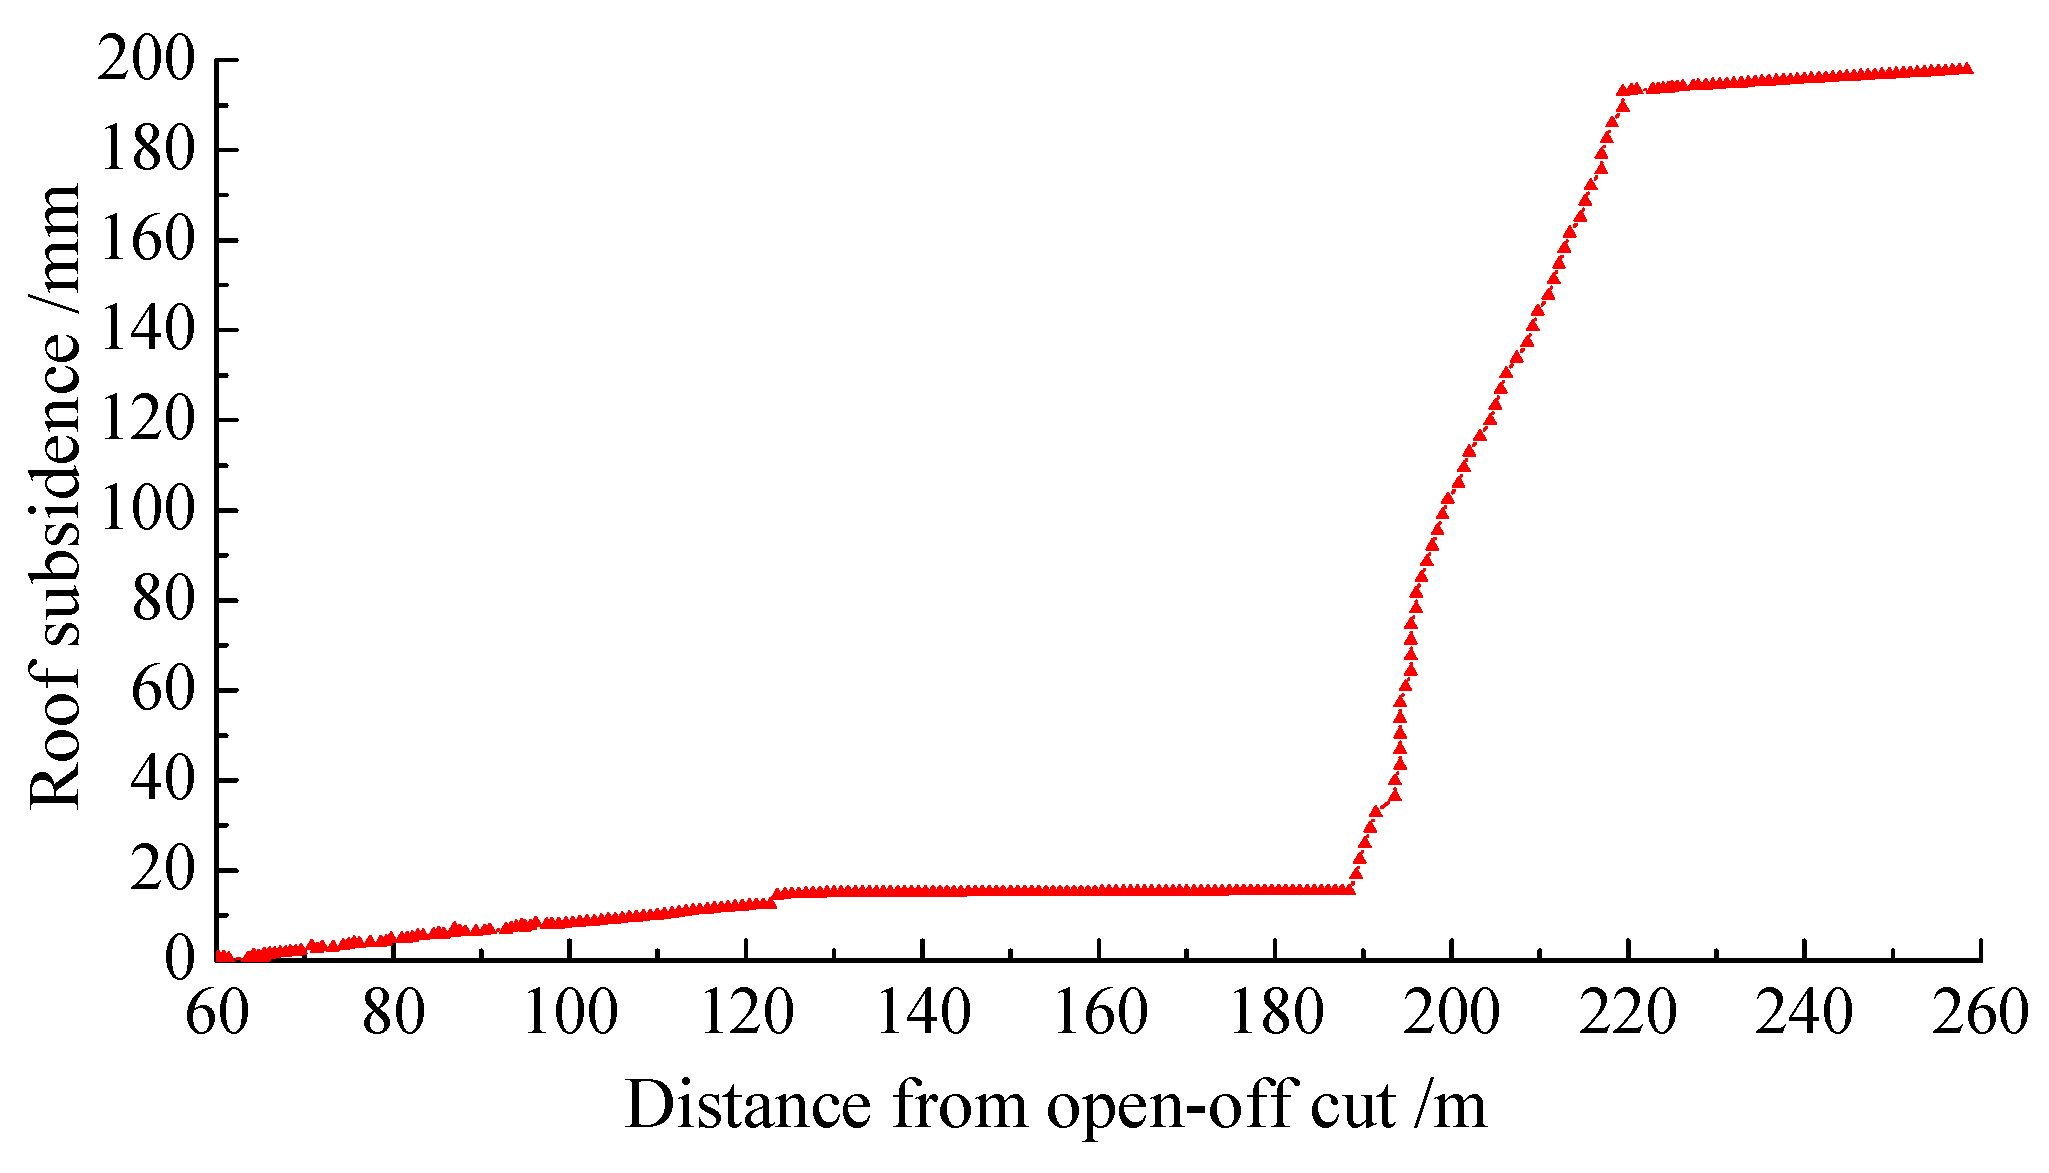
6.3. Measurement of Roof Subsidence
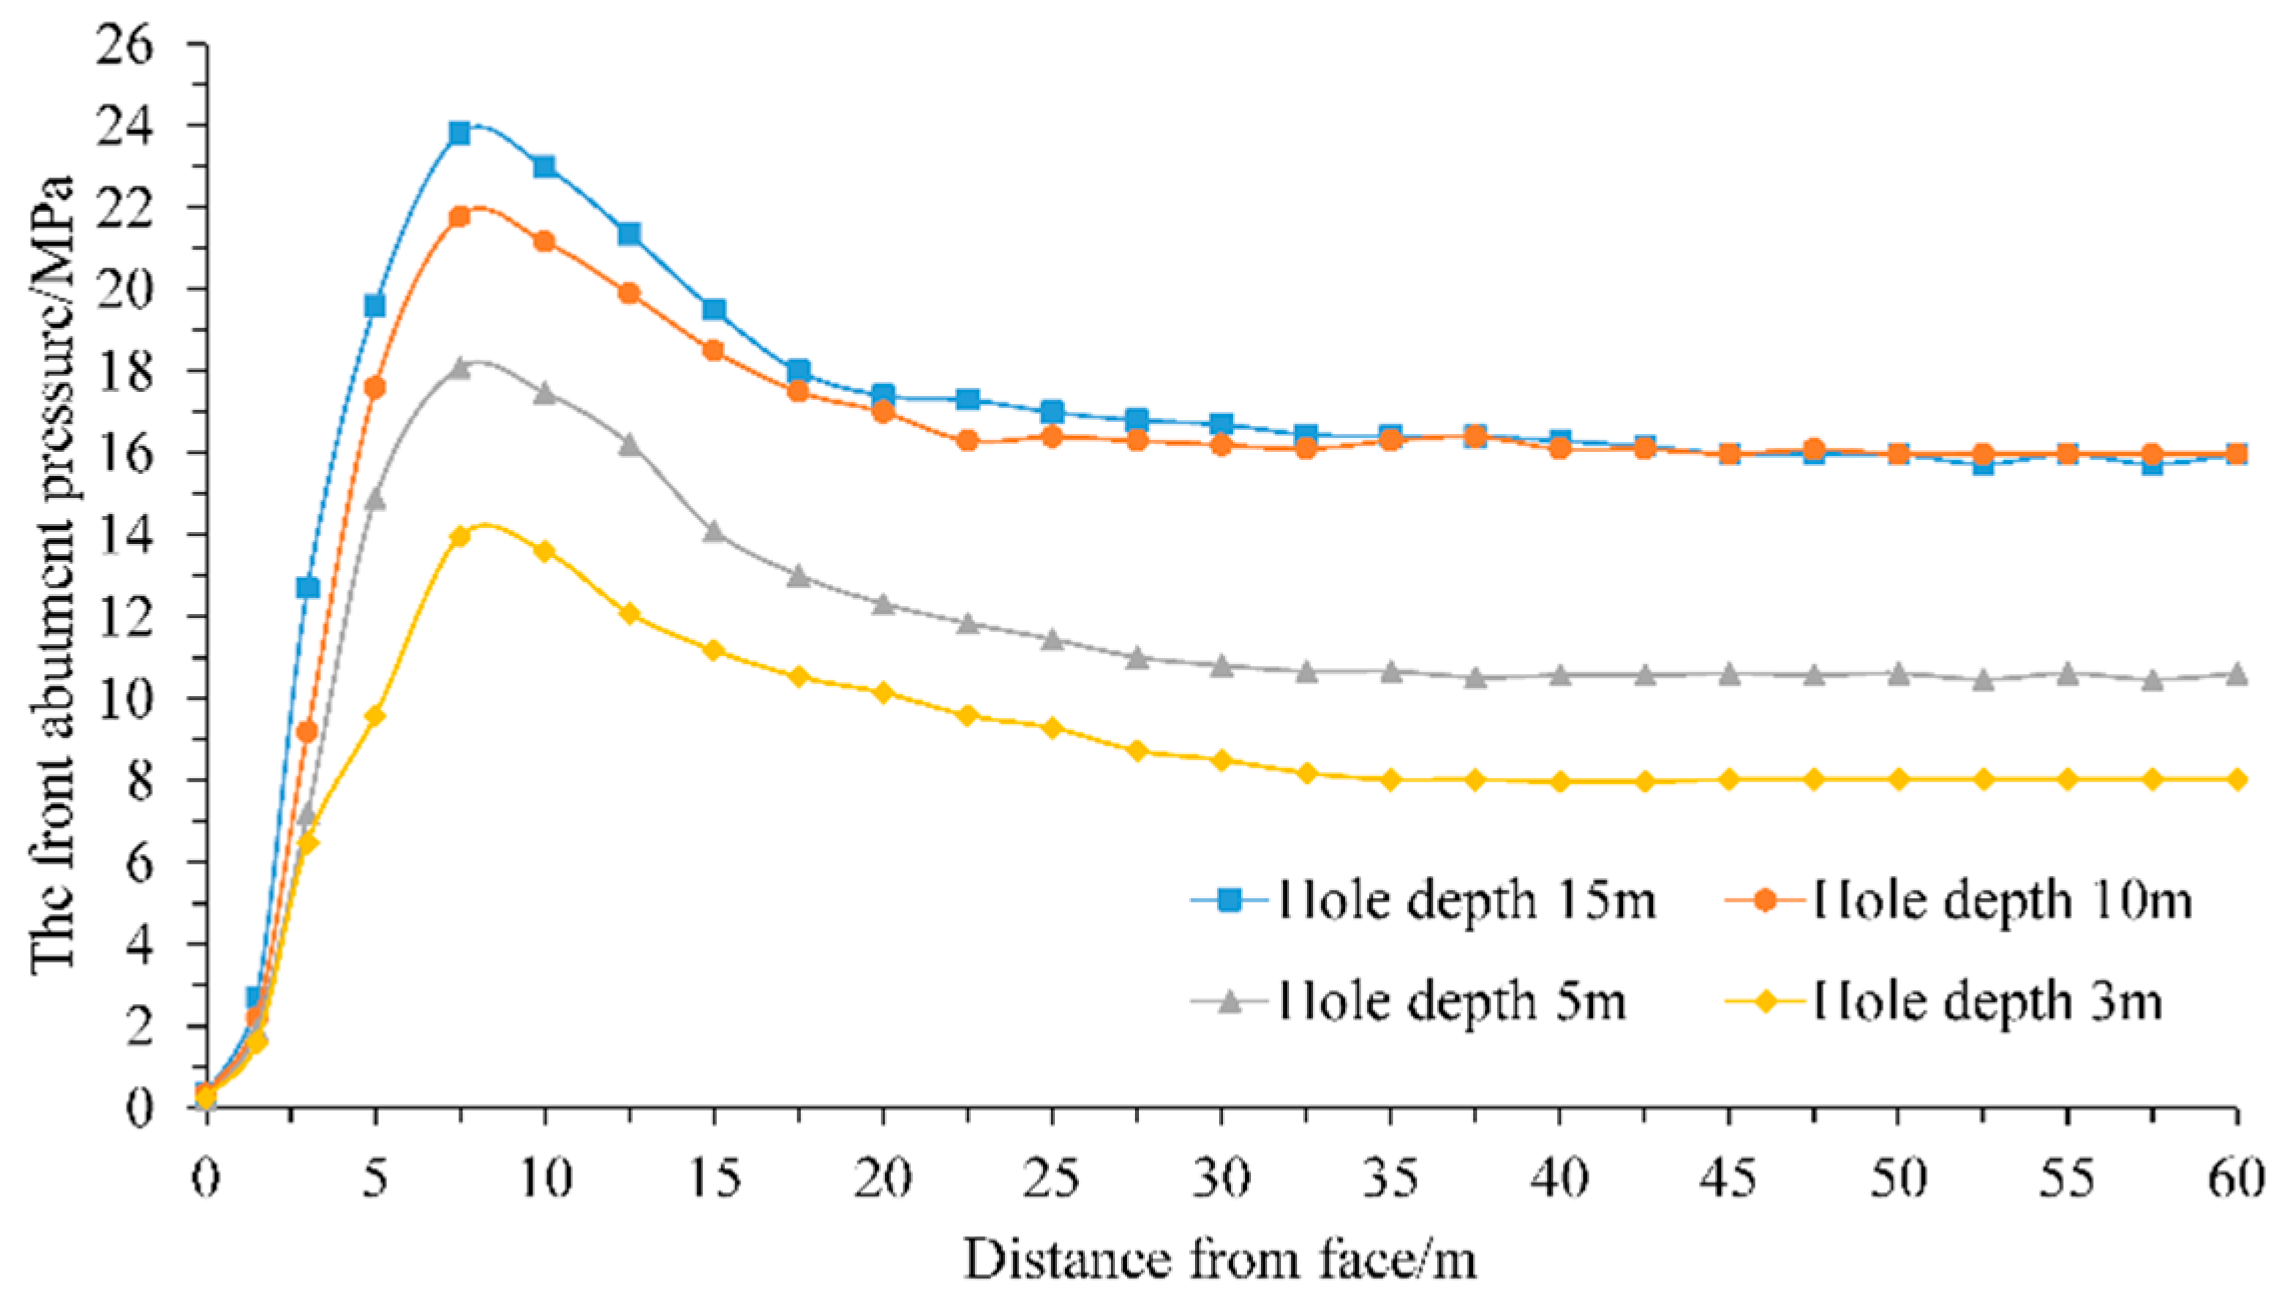
6.4. Measurement of Advanced Abutment Pressure
7. Conclusions
- (1)
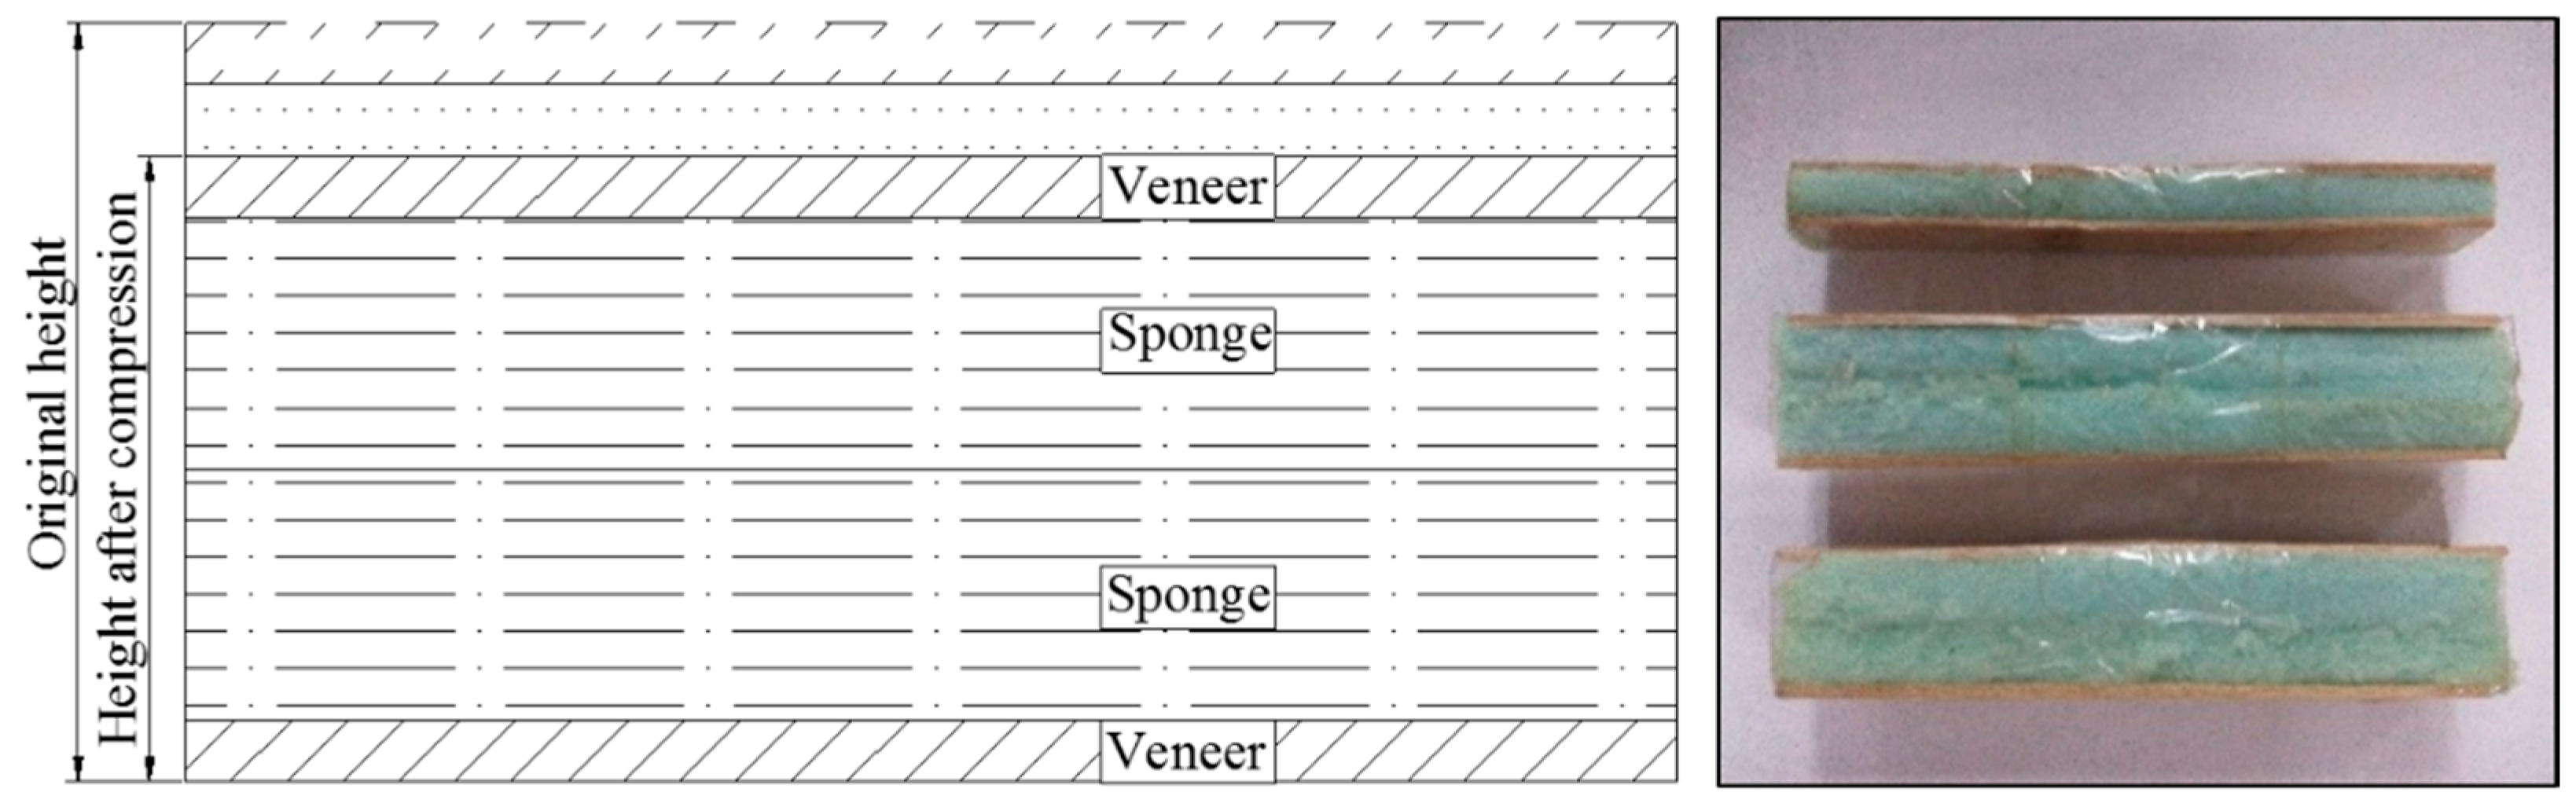
- By using similarity theory and test results of the mechanical properties of backfill materials, physical simulation experiments were performed for four scenarios of varying roof-controlled backfilling ratios (0%, 40%, 82.5% and 97%) to study the deformation behavior of the hard roof. A combination of pre-compressed sponges and paper was used as a backfill body analogue, which precisely simulated the deformation process that the backfill body experienced under the stress of the roof for each backfilling scenario.
- (2)
- The solid backfill body proved to be able to support the roof. With increasing roof-controlled backfilling ratio, the maximum subsidence of the roof and the maximum height of the developing cracks decreased. When the backfilling ratio reached 97%, the maximum subsidence of the hard roof was only 0.81 m; a decrease of 76.2% compared to that of the caving method, and the maximum height of the crack in relation to the coal seam was only 32 m.
- (3)
- When the backfilling ratio was 40%, the roof did not contact with the backfill body prior to the occurrence of the fracture. The backfill reduced the subsidence of the roof after the occurrence of the fracture, but the fracture interval and the abutment stress ahead of the face of the roof were almost the same as those seen with the caving method.
- (4)
- When the backfilling ratio reached 82.5% and 97%, the roof contacted fully with the backfill body prior to the occurrence of the fracture, and both the peak and the impact range of the abutment stress ahead of the face decreased. When the backfilling ratio reached 97%, the roof no longer fractured, the concentration coefficient of the abutment stress ahead of the face was only 1.42, and the impact range decreased to 22.5 m.
- (5)
- After adopting the solid backfilling mining method in Panel No. 6304-1 of the Jisan Coal Mine, the average value of the roof-controlled backfilling ratio φk reached 96.4%, and it is close to the fourth scheme (97%) in the physical similarity simulation.
Acknowledgments
Author Contributions
Conflicts of Interest
References
- Lin, C.; Deng, J.P.; Liu, Y.R.; Yang, Q.; Duan, H.F. Experiment simulation of hydraulic fracture in colliery hard roof control. J. Petrol. Sci. Eng. 2015, 138, 265–271. [Google Scholar]
- Zheng, Z.T.; Xu, Y.; Li, D.S.; Dong, J.H. Numerical analysis and experimental study of hard roofs in fully mechanized mining faces under sleeve fracturing. Minerals 2015, 5, 758–777. [Google Scholar] [CrossRef]
- Zhou, N.; Han, X.L.; Zhang, J.X.; Li, M. Compressive deformation and energy dissipation of crushed coal gangue. Powder Technol. 2016, 297, 220–228. [Google Scholar] [CrossRef]
- Fredericks, P.M.; Warbrooke, P.; Wilson, M.A. A study of the effect of igneous intrusions on the structure of an Australian high volatile bituminous coal. Org. Geochem. 1985, 8, 329–340. [Google Scholar] [CrossRef]
- Lu, C.P.; Liu, G.J.; Liu, Y.; Zhang, N.; Xue, J.H.; Zhang, L. Microseismic multi-parameter characteristics of rockburst hazard induced by hard roof fall and high stress concentration. Int. J. Rock Mech. Min. 2015, 76, 18–32. [Google Scholar] [CrossRef]
- Li, N.; Wang, E.Y.; Ge, M.C.; Liu, J. The fracture mechanism and acoustic emission analysis of hard roof: A physical modeling study. Arab. J. Geosci. 2015, 8, 1895–1902. [Google Scholar] [CrossRef]
- Wang, L.; Cheng, Y.P.; Xu, C.; An, F.H.; Jin, K.; Zhang, X.L. The controlling effect of thick-hard igneous rock on pressure relief gas drainage and dynamic disasters in outburst coal seams. Nat. Hazards 2013, 66, 1221–1241. [Google Scholar] [CrossRef]
- Hirata, A.; Kameoka, Y.; Hirano, T. Safety management based on detection of possible rock bursts by AE monitoring during tunnel excavation. Rock Mech. Rock Eng. 2007, 40, 563–576. [Google Scholar] [CrossRef]
- Zubelewicz, A.; Mróz, Z. Numerical simulation of rock burst processes treated as problems of dynamic instability. Rock Mech. Rock Eng. 1983, 16, 253–274. [Google Scholar] [CrossRef]
- Wang, Q.X.; Wang, H.; Qi, Z.Q. An application of nonlinear fuzzy analytic hierarchy process in safety evaluation of coal mine. Saf. Sci. 2016, 86, 78–87. [Google Scholar] [CrossRef]
- Zhang, J.X.; Li, B.Y.; Zhou, N.; Zhang, Q. Application of solid backfilling to reduce hard-roof caving and longwall coal face burst potential. Int. J. Rock Mech. Min. 2016, 88, 197–205. [Google Scholar] [CrossRef]
- Zhang, Q.; Zhang, J.X.; Huang, Y.L.; Ju, F. Backfilling technology and strata behaviors in fully mechanized coal mining working face. Int. J. Min. Sci. Technol. 2012, 22, 151–157. [Google Scholar] [CrossRef]
- Zhou, N.; Zhang, J.X.; An, B.F.; Zhang, Q.; Huang, Y.L.; Ju, F. Solid material motion law in vertical feeding system within fully mechanized coal mining and backfilling technology. Environ. Eng. Manag. J. 2014, 13, 191–196. [Google Scholar]
- Huang, Y.L.; Zhang, J.X.; An, B.F.; Zhang, Q. Overlying strata movement law in fully mechanized coal mining and backfilling longwall face by similar physical simulation. J. Min. Sci. 2011, 47, 618–627. [Google Scholar]
- Sun, W.; Wu, A.X.; Hou, K.P.; Yang, Y.; Liu, L.; Wen, Y.M. Real-time observation of meso-fracture process in backfill body during mine subsidence using X-ray CT under uniaxial compressive conditions. Constr. Build. Mater. 2016, 113, 153–162. [Google Scholar] [CrossRef]
- Wu, D.; Sun, G.H.; Liu, Y.C. Modeling the thermo-hydro-chemical behavior of cemented coal gangue-fly ash backfill. Constr. Build. Mater. 2016, 111, 522–528. [Google Scholar] [CrossRef]
- Zhang, J.X.; Zhou, N.; Huang, Y.L.; Zhang, Q. Impact law of the bulk ratio of backfilling body to overlying strata movement in fully mechanized backfilling mining. J. Min. Sci. 2011, 47, 73–84. [Google Scholar] [CrossRef]
- Zhou, N. Mechanism of Preventing Dynamic Hazards under Hard Roof by Solid Backfilling Technology. Ph.D. Thesis, China University of Mining and Technology, Xuzhou, China, 2014. [Google Scholar]
- Mohamed, M.A.H.; Christophe, D.; Farimeh, M. Improving short- and long-term stability of underground gypsum mine using partial and total backfill. Rock Mech. Rock Eng. 2010, 43, 447–461. [Google Scholar]
- Wu, D.; Cai, S.J.; Liu, Y.C. Effects of binder on suction in cemented gangue backfill. Mag. Concr. Res. 2016, 68, 593–603. [Google Scholar] [CrossRef]
- Zhang, Q.; Zhang, J.X.; Tai, Y.; Fang, K.; Yin, W. Horizontal roof gap of backfill hydraulic support. J. Cent. South Univ. 2010, 22, 3544–3555. [Google Scholar] [CrossRef]
- Zhang, Q.; Zhang, J.X.; Wu, X.G.; Huang, Y.L.; Zhou, N. Roof gap rationality research of backfilling-coal mining hydraulic support. J. China Coal Soc. 2013, 38, 1325–1330. [Google Scholar]
- Zhou, Y.J.; Chen, Y.; Zhang, J.X. Control principle and technology of final compression ratio of backfilling materials. J. Min. Saf. Eng. 2012, 29, 351–356. [Google Scholar]
- Huang, Y.L.; Zhang, J.X.; Zhang, Q.; Nie, S.J.; An, B.F. Strata movement control due to bulk factor of backfilling body in fully mechanized backfilling mining face. J. Min. Saf. Eng. 2012, 29, 162–167. [Google Scholar]


| Stratum Number | Lithology | Height | Compressive Strength | Material Mixture Ratio (kg) | |||||
|---|---|---|---|---|---|---|---|---|---|
| Actual (m) | Model (mm) | Actual (MPa) | Model (kPa) | Sand | Calcium Carbonate | Gypsum | Water | ||
| 1 | Fine sandstone | 14.27 | 95 | 56.16 | 224.60 | 94.52 | 7.09 | 16.54 | 14.77 |
| 2 | Mudstone | 24.14 | 161 | 23.53 | 94.10 | 159.90 | 27.98 | 11.99 | 24.98 |
| 3 | Fine sandstone | 19.45 | 130 | 51.96 | 207.80 | 120.78 | 20.13 | 20.13 | 20.13 |
| 4 | Silty sandstone | 24.20 | 161 | 37.92 | 151.65 | 160.30 | 20.04 | 20.04 | 25.05 |
| 5 | Mudstone | 27.75 | 185 | 25.29 | 101.14 | 201.05 | 14.36 | 14.36 | 28.72 |
| 6 | Sandstone and mudstone interbedding | 21.85 | 146 | 28.43 | 113.70 | 135.69 | 31.66 | 13.57 | 22.61 |
| 7 | Fine sandstone (hard roof) | 41.63 | 277 | 70.0 | 279.9 | 258.52 | 25.85 | 60.32 | 43.09 |
| 8 | Coal | 3.50 | 24 | 11.2 | 44.78 | 26.08 | 2.61 | 1.12 | 3.73 |
| 9 | Silty sandstone | 8.00 | 54 | 40.20 | 160.77 | 79.49 | 9.94 | 9.94 | 12.42 |
| Total | 184.79 | 1233 | - | - | 1236.33 | 159.66 | 168.01 | 195.5 | |
| Group | Roof-Controlled Backfilling Ratio | Actual Mining and Backfill State | Model Mining and Backfill State |
|---|---|---|---|
| 1 | 0 | Caving mining. | The height of mining is 24 mm, no backfill. |
| 2 | 40% | The height of mining is 3500 mm, the height of backfill is 1800 mm, no compaction. | The height of mining is 24 mm, the height of backfill is 12 mm, initial loading stress of backfill body is 0 MPa. |
| 3 | 82.5% | The height of mining is 3500 mm, the height of backfill is 3600 mm, no compaction. | The height of mining is 24 mm, the height of backfill is 24 mm, initial loading stress of backfill body is 0 MPa. |
| 4 | 97% | The height of mining is 3500 mm, the height of backfill is 3600 mm, compaction strength is 2 MPa. | The height of mining is 24 mm, the height of backfill is 24 mm, initial loading stress of backfill body is 8 kPa. |
| Group | Backfill Height (mm) | Layers of Sponge | Sponge Height after Fixed (mm) | Paper Thickness (mm) |
|---|---|---|---|---|
| 1 | 12 | 1 | 6 | 6 |
| 2 | 1 | 12 | 0 | |
| 3 | 2 | 6 | 6 | |
| 4 | 2 | 12 | 0 | |
| 5 | 3 | 12 | 0 | |
| 6 | 24 | 2 | 12 | 12 |
| 7 | 2 | 18 | 6 | |
| 8 | 2 | 24 | 0 | |
| 9 | 3 | 12 | 12 | |
| 10 | 3 | 18 | 6 | |
| 11 | 3 | 24 | 0 | |
| 12 | 4 | 18 | 6 | |
| 13 | 4 | 24 | 0 |
| Roof-Controlled Backfilling Ratio | Roof First Caving Span (m) | Roof Periodic Caving Span (m) | Mining Distance When Fracture First Occurs (m) | Maximum Height of Fracture (m) | Maximum Roof Subsidence (m) |
|---|---|---|---|---|---|
| 0% | 157.5 | 56 | 127.5 | Height of model | 3.42 |
| 40% | 165 | 52.5 | 135 | Height of model | 2.49 |
| 82.5% | 180 | None | 150 | 63 | 1.13 |
| 97% | None | None | 232.5 | 32 | 0.81 |
| Roof-Controlled Backfilling Ratio | Backfill Height (m) | Roof First Caving Span (m) | Peak Value of Advancing Abutment Pressure (MPa) | Maximum Stress Concentration Factor | Influence Range of Advancing Abutment Pressure (m) |
|---|---|---|---|---|---|
| 0 | 0 | 157.5 | 43.1 | 2.61 | 45.0 |
| 40% | 1.75 | 165 | 42.3 | 2.56 | 45.0 |
| 82.5% | 3.5 | 180 | 29.0 | 1.76 | 30.0 |
| 97% | 3.5 | None | 23.5 | 1.42 | 22.5 |
| Mine Area | Rock Category | Thickness/m | Rock Features |
|---|---|---|---|
| Main roof | Fine- and medium- grained sandstone | 41.63 | Gray–white, largely quartz, followed by feldspar and a small amount of dark and green minerals, f = 8–10 |
| Immediate roof | Mudstone | 0.0–1.02 | Brown–gray, containing many plant root fossils, f = 2–3 |
| Immediate floor | Aluminous mudstone | 0.0–3.20 | Light gray, smooth, containing plant fossil fragments, f = 2–3 |
| Main floor | Fine-grained sandstone | 5.85 | Light gray–dark gray, dense and hard, f = 6–8 |
© 2017 by the authors. Licensee MDPI, Basel, Switzerland. This article is an open access article distributed under the terms and conditions of the Creative Commons Attribution (CC BY) license (http://creativecommons.org/licenses/by/4.0/).
Share and Cite
Zhou, N.; Zhang, J.; Yan, H.; Li, M. Deformation Behavior of Hard Roofs in Solid Backfill Coal Mining Using Physical Models. Energies 2017, 10, 557. https://doi.org/10.3390/en10040557
Zhou N, Zhang J, Yan H, Li M. Deformation Behavior of Hard Roofs in Solid Backfill Coal Mining Using Physical Models. Energies. 2017; 10(4):557. https://doi.org/10.3390/en10040557
Chicago/Turabian StyleZhou, Nan, Jixiong Zhang, Hao Yan, and Meng Li. 2017. "Deformation Behavior of Hard Roofs in Solid Backfill Coal Mining Using Physical Models" Energies 10, no. 4: 557. https://doi.org/10.3390/en10040557
APA StyleZhou, N., Zhang, J., Yan, H., & Li, M. (2017). Deformation Behavior of Hard Roofs in Solid Backfill Coal Mining Using Physical Models. Energies, 10(4), 557. https://doi.org/10.3390/en10040557