Abstract
This article explores the effects of SiO2/Al2O3 ratios (S/A) on sintering characteristics and provides guidance for alleviating ash depositions in a large-scale circulation fluidized bed. Five synthetic coal ash (SCA) samples with different S/As were treated in a muffle furnace for 12 h at different temperatures (from 773 K to 1373 K, in 100 K intervals). The morphological and chemical results of the volume shrinkage ratio (VSR), thermal deformation analysis by dilatometer (DIL), scanning electron microscope (SEM), X-ray photoelectron spectrometer (XPS), and X-ray diffraction (XRD) were combined to describe the sintering characteristics of different samples. The results showed that the sintering procedure mainly occurred in the third sintering stage when the temperature was over 1273 K, accompanied with significant decreases in the VSR curve. Excess SiO2 (S/A = 4.5) resulted in a porous structure while excess Al2O3 (S/A = 0.5) brought out large aggregations. The other three samples (S/A = 1.5, 2.5, 3.5) are made up of an amorphous compacted structure and are composed of low fusion temperature materials (e.g., augite and wadsleysite.). Sintering temperatures first dramatically decrease to a low level and then gradually rise to a high level as S/A increases, suggesting that Al2O3-enriched additives are more effective than SiO2-enriched additives in alleviating depositions.
1. Introduction
Coal blending using coal slime or biomass in a large circulation fluidized bed (CFB, over 300 MW) is widely utilized for its environmental and economic benefits. Meanwhile, because of high ash content, fine particle size, and good mechanical properties, the fly ash of CFB can be applied as alternative raw materials for construction materials (e.g., cement and geopolymer) [1,2,3]. However, ash deposition on the surface of the cyclone separator or the heat exchanger is an operational obstacle in combustion, which can adversely affect equipment performance. Previous studies have shown that ash fusion temperature (AFT) is a key factor in determining the progress of coal combustion, gasification, fluidization, and deposition [4]. Ash depositions formed at various ash fusion temperatures always differ in chemical composition. Researchers have established that ash deposition can be alleviated by changing chemical compositions through blending ash with proper additives [5,6,7,8,9]. Therefore, it is important to investigate the relationship between ash fusion temperatures and chemical compositions in order to better understand the deposition mechanism and the necessary operational adjustments.
Previous studies have shown that ash deposition rates depend on multiple factors, including flue gas velocity, ash composition, ash particle size, atmosphere, and operating temperatures [10,11,12]. Traditionally, the ash melting process is described by four temperatures: initial deformation temperature (IDT), softening temperature (ST), hemispherical temperature (HT), and flow temperature (FT) [13,14]. These four temperatures are determined by the macroscopic change in the cone shape, according to ISO 1995:540. Researchers have explored the microscopic morphological variations compared to different temperatures (300–1873 K) and they have categorized the deformation progress into three stages: sintering stage, primarily fusion stage, and free fluid stage [15,16]. Furthermore, most researchers agree that the operation temperature should be above FT [17,18]. However, the operation temperature of the circulation fluidized bed is 1073–1373 K, which is lower than FT and falls under the sintering stage. Previous studies have also showed that coal ash sintering is one of the dominant mechanisms of operational problems in the fluidized bed [19]. Few prior studies have focused on the sintering stage when the temperature is below FT; therefore, it is necessary to invest the sintering characteristics of coal ash.
However, some researchers have focused on exploring the effects of chemical composition on the deposition characteristics of coal ash. Earlier studies have explored the influence of components on ash fusibility or viscosity [20,21,22], but not much data is available on sintering characteristics. It has been concluded that high SiO2/Al2O3 ratios (S/As) and low concentrations of basic oxides account for the high ash fusion temperatures of most Australian bituminous coal ashes [23]. Recent related literature has established ash chemical compositions under either an oxidizing atmosphere or a reductive atmosphere, based on Jincheng coal, Xiaolongtan (XLT), and Huolinhe (HLH) coal, respectively [24,25]. However, the complex chemical compositions of industrial coal ashes bring obstacles in quantitatively exploring the role of individual components. Liu B simplified the industrial coal ashes as synthetic coal ashes (SCA) for quantitatively controlling ash composition [26]. Although other researchers have adopted this simplification and found it to be satisfactory [27], the effects of individual oxides on morphology and chemical compositions need to be explored more specifically.
The purpose of this paper is to investigate the effects of S/As on sintering characteristics through various experimental conditions conducted in a muffle furnace. SCA samples with various S/As were treated at different temperatures. The morphologic and chemical results of VSR, XRD, XPS, SEM, and DIL were combined to explore the sintering characteristics of SCA versus temperatures and S/As. The results of this study will offer guidance for the design, modification, and operation of CFB.
2. Experimental Apparatus and Procedures
2.1. Synthetic Coal Ash Samples Preparation
As shown in Table 1, the chemical compositions of the synthetic coal ash was determined by the industrial fly ash of CFB (300 MW) burning coal blending with coal slime, located in Huaibei Linhuan Power Station, Anhui, China. In order to explore the effects of SiO2/Al2O3 ratios (S/A) on sintering characteristics and provide guidance for alleviating ash depositions in large scale CFB, we assembled five SCA samples mixed with SiO2-Al2O3-CaO-Fe2O3-MgO. The individual content is presented in Table 1 on a m% basis. As shown, Sample (3) contains similar chemical composition with the industrial sample (0) while the other four samples (1,2,4,5) are utilized as the contrastive sample by adjusting SiO2/Al2O3 ratios. Since the furnace desulfurization is conducted in CFB by adding CaO into the feeding system, the basic/acid ratio (B/A) of CFB fly ash is higher than that of the conventional combustion. These mixed SCA samples were molded into a 4 × 4 × 12 mm cuboid sample before sending the sample for further analysis. This preparation of SCA samples is deemed satisfactory, since the properties of coal ashes at high temperatures might be similar to the properties of synthetic ashes composed of primary oxides [22].

Table 1.
Chemical compositions of synthetic coal ash (SCA).
2.2. Volume Shrinkage Ratio (VSR) Test
In order to create a complete reaction, the cuboid samples were treated in a muffle furnace for 12 h under various temperatures (ranging from 773 K to 1373 K, in intervals of 100 K). The temperature of the muffle furnace is below 1473 K and the accuracy of it is ±20 K. Volume shrinkage ratio (VSR) represents the ratio between volume variation (ΔV) and pre-reaction volume (Vpre) of the cuboid samples, as is shown in Equation (1).
The VSR was examined by self-design filling method which consists of the following steps. First, an empty square crucible was completely filled with Al2O3 powders. The mass of the square crucible combined with the powders was recorded as . Second, the same crucible was completely filled with a cuboid sample and a moderate amount of Al2O3 powders and the total mass of the sample, crucible and powders were documented as . Third, the mass of the sample was recorded as . Fourth, after treating in the furnace and cooling down, the same square crucible was completely filled with a sintered sample and moderate amount of Al2O3 powders and the total mass of the sintered sample, crucible, and powders were recorded as . Lastly, the mass of sintered sample was documented as . The mass was tested on an electronic balance with an accuracy of 0.001 g. In order to reduce experimental errors, the square crucible was treated in the furnace at 1373 K before each run to avoid shape and density change. Further, the crucible was filled to the same scale with the same Al2O3 powders and this operation repeated five times each run. The effective mass was the average value of five measurements.
As described above, is composed of 3 part: , and . Similarly, is also composed of 3 part: , and . Particularly, takes over the same volume space as the pre-reaction cuboid sample while takes over the rest volume space of the square crucible.
Equation (2) plus Equation (4) and then minus Equation (3), yield Equation (5).
Thus, the volume of the pre-reaction cuboid sample () can be determined by Equation (6).
Similarly, the volume of the post-reaction sample () can be determined by Equation (7).
Equations (6) and (7) are substitute into Equation (1), yielding Equation (8).
Finally, VSR can be determined by measurable mass ratio instead of volume ratio.
2.3. Sintering Temperature Test
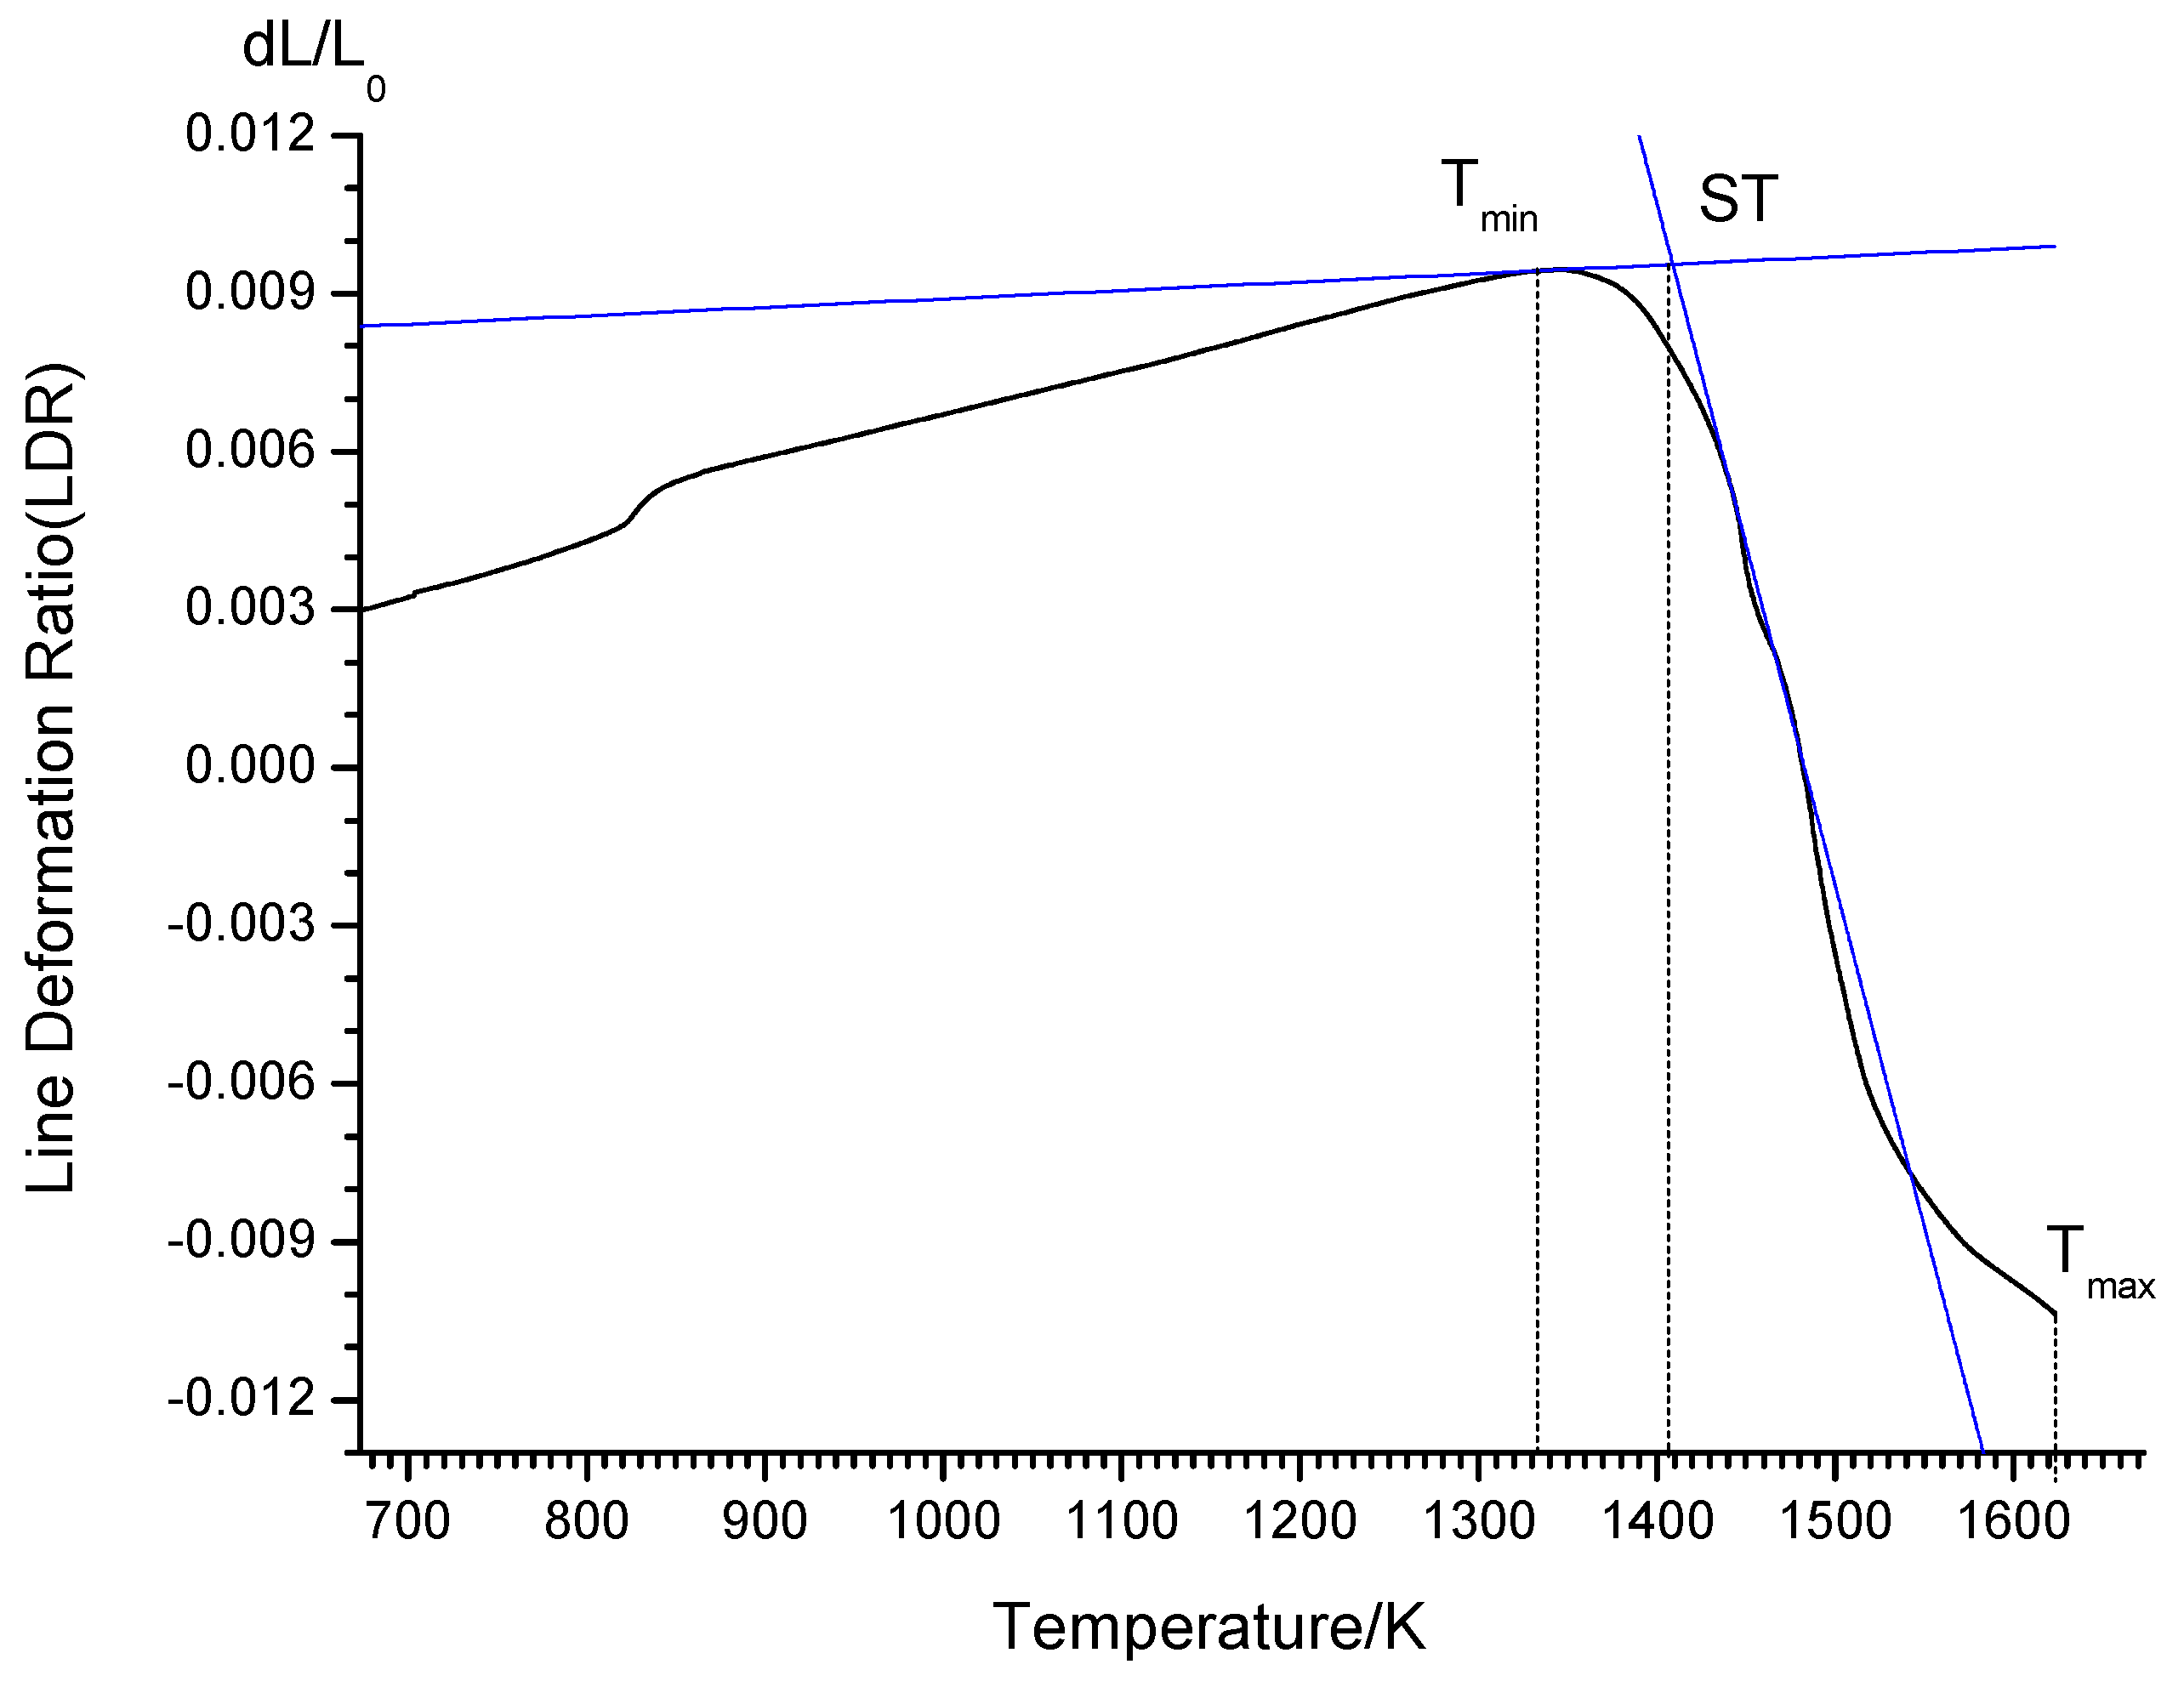
Sintering temperature tests were carried out in a horizontal pushrod dilatometer (NETZSCH 402C). The system was equipped with a SiC furnace, allowing measurements to be carried out at temperatures up to 1573 K. Measurements were taken with an aluminum sample holder and pushrod with a 0.20 N force. Dilatometry was carried out using a high temperature pushrod dilatometer in a dry nitrogen (gas flow 50 mL/min) atmosphere with a mass spectrometer. The same cuboid specimens (4 × 4 × 12 mm) were investigated with heat rates of 5 K/min. The line deformation ratio (LDR) was plotted against time, as shown in Figure 1. The ash sintering temperature (ST) is defined as the abscissa of the intersection of two tangent lines in the curve. In this article, five cuboid specimens with different S/As were tested with a dilatometer to achieve sintering temperatures.
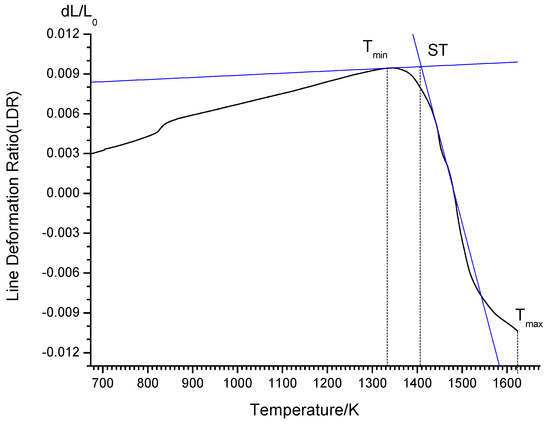
Figure 1.
Definition of sintering temperature (ST) in line deformation ratio (LDR) curve.
2.4. Instrumental Analysis
After reacting in a muffle furnace at 1373 K, the sintered cuboid samples that were produced were sent for morphology analysis via a scanning electron microscope (SEM, XL30, Philips, Amsterdam, The Netherlands). Meanwhile, an X-ray photoelectron spectrometer (XPS, INCA300, OXFORD, Oxford, UK) was used to identify the element compositions in sintered SCA specimens.
The sintered specimens were ground into powders of less than 10 µm before sending them for further detections. The mineral compositions of sintered SCA samples were determined using X-ray diffraction (TTRAX3, RIGAKU, Japan) with a scanning rage of 3° to 75°. The XRD curves were analyzed using the computer software package MDI Jada 5.0.
3. Results and Discussion
3.1. Sintering Characteristics at Various Temperatures
3.1.1. Volume Shrinkage Ratio (VSR) Variations at Various Temperatures
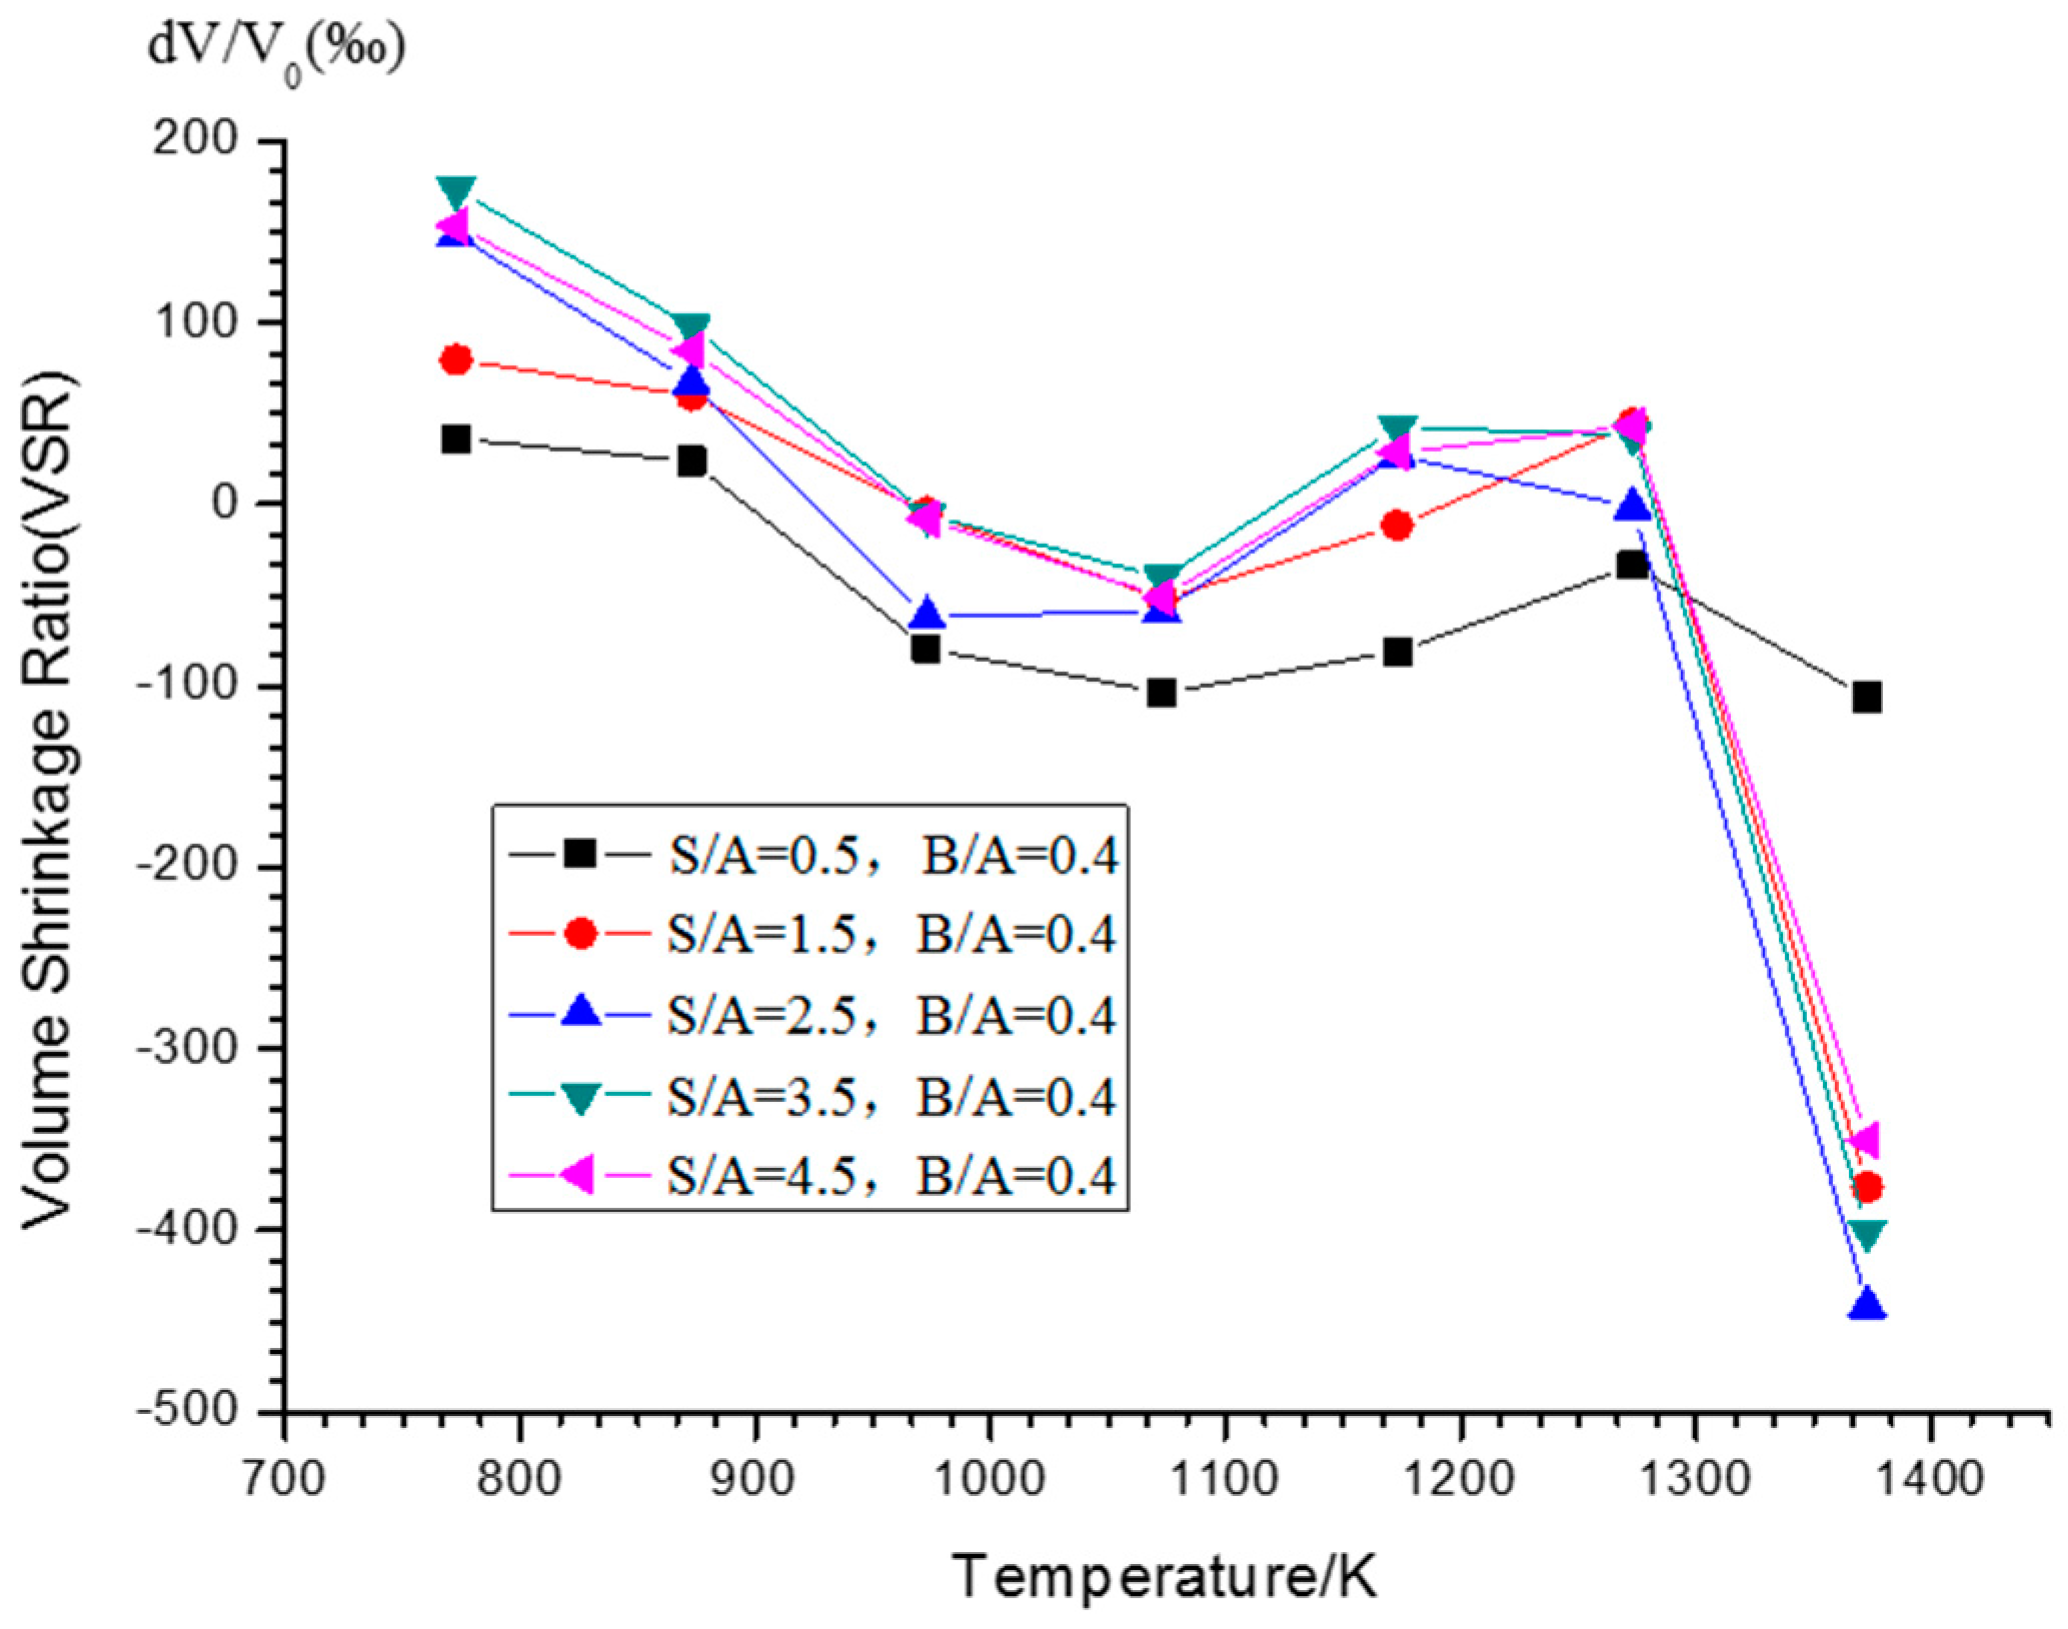
The cuboid samples were kept in a muffle furnace for 12 h at constant temperatures, that were in 100 K intervals ranging from 773 K to 1373 K. Then the volume shrinkage ratio (VSR) was determined by the self-design filling method, as described in the experiment section. Figure 2 plots the volume shrinkage ratios (VSR) of five different SCA samples against various temperatures. The VSR of each sample gradually decreases as the temperature increases, and at the same time the volume of the samples decreases. When the temperature surpasses 1073 K, the VSR of each sample shows a slight increase in the curve, suggesting that the volume of the samples has expanded. There is a slight decrease when the temperature surpasses 1173 K, suggesting that the volume of the samples shrink. When the temperature surpasses 1273 K, the VSR of each sample shows a dramatic decrease except the low S/A ones (S/A = 0.5, 1.5). This exception is because of the low thermal expansion coefficient of large aggregations that are mainly composed of Al2O3 enriched materials. Two turning points are obviously observed when the temperature is close to 1073 K or above 1273 K in the VSR curve. This is because of the cataclasm of large agglomerations at 1073 K and sintering reactions at 1273 K. Morphological details are displayed in Section 3.2. Although the expansion or shrinkage differs in extent among the various samples, the change in VSR followed a consistent trend at the different temperatures. Therefore, one representative sample (S/A = 2.5, B/A = 0.8) was picked to explore the variations in morphology among the different specimens.
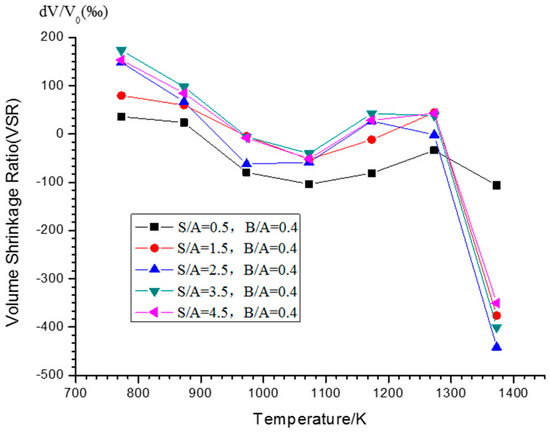
Figure 2.
Volume shrinkage ratio (VSR) varies at different temperatures.
3.1.2. Morphology Variations versus Different Temperatures
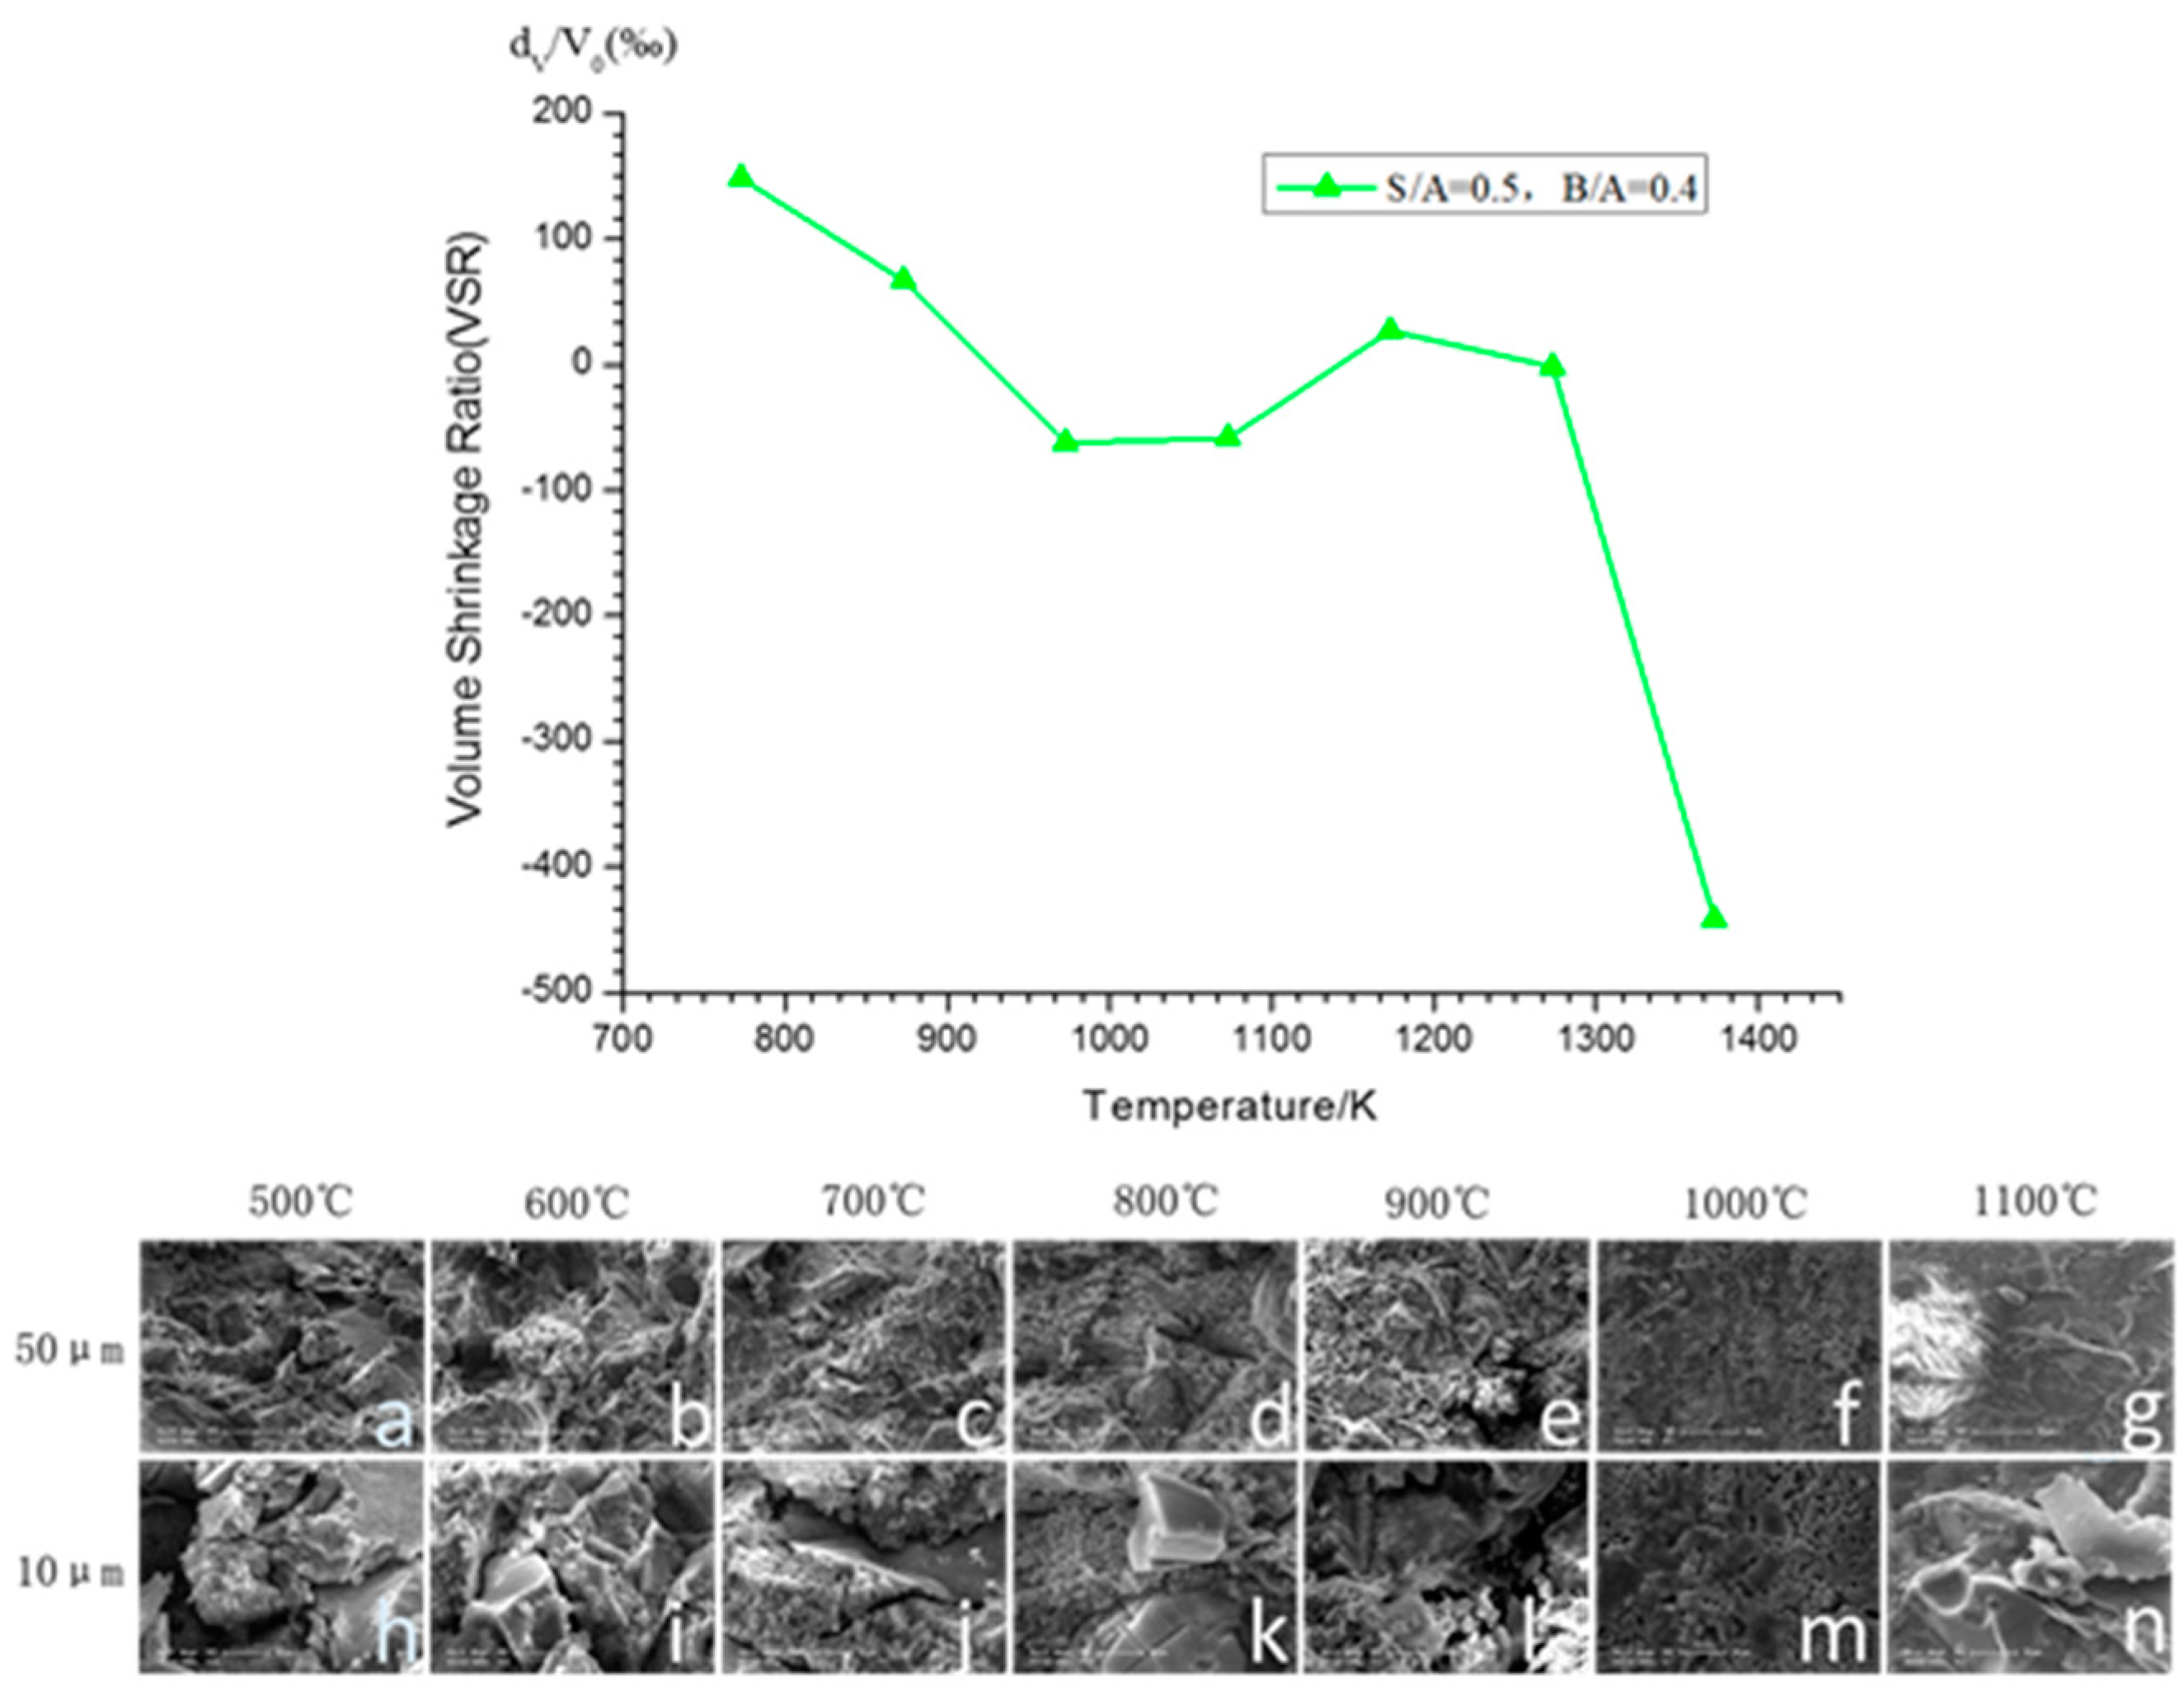
Figure 3 depicts the VSR and morphology of the representative sample (S/A = 0.5, B/A = 0.8) at various temperatures. As shown in the Figure, the VSR curve first decreases as the temperature increases and the porous structure can be detected in Figure 3h,i. This is because of the evaporation and transition of dissociative water [28]. As the temperature increases, the porous structure is significantly reduced, as shown in Figure 3j,k. During this period, the small particles are transferred by a thermophoresis force to fill the void between the large agglomerates, which accounts for the volume shrinkage of these samples. As the temperature increases further and the porous structure reappears, as is shown in Figure 3l,m. Meanwhile, Figure 3k,l show that the large agglomerates are broken into small particles. When the temperature surpasses 1273 K, the uniform porous structure is present as shown in Figure 3m. Finally, as shown in Figure 3n, the uniform porous structure turns into a dense amorphous group, resulting in a dramatic decrease in the VSR curve.
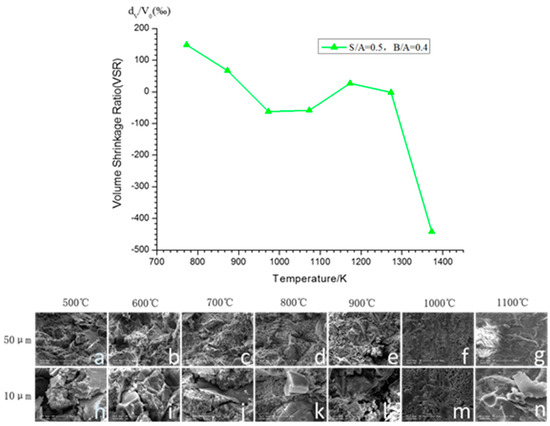
Figure 3.
VSR and morphology of SCA samples (S/A = 0.5, B/A = 0.8) at various temperatures.
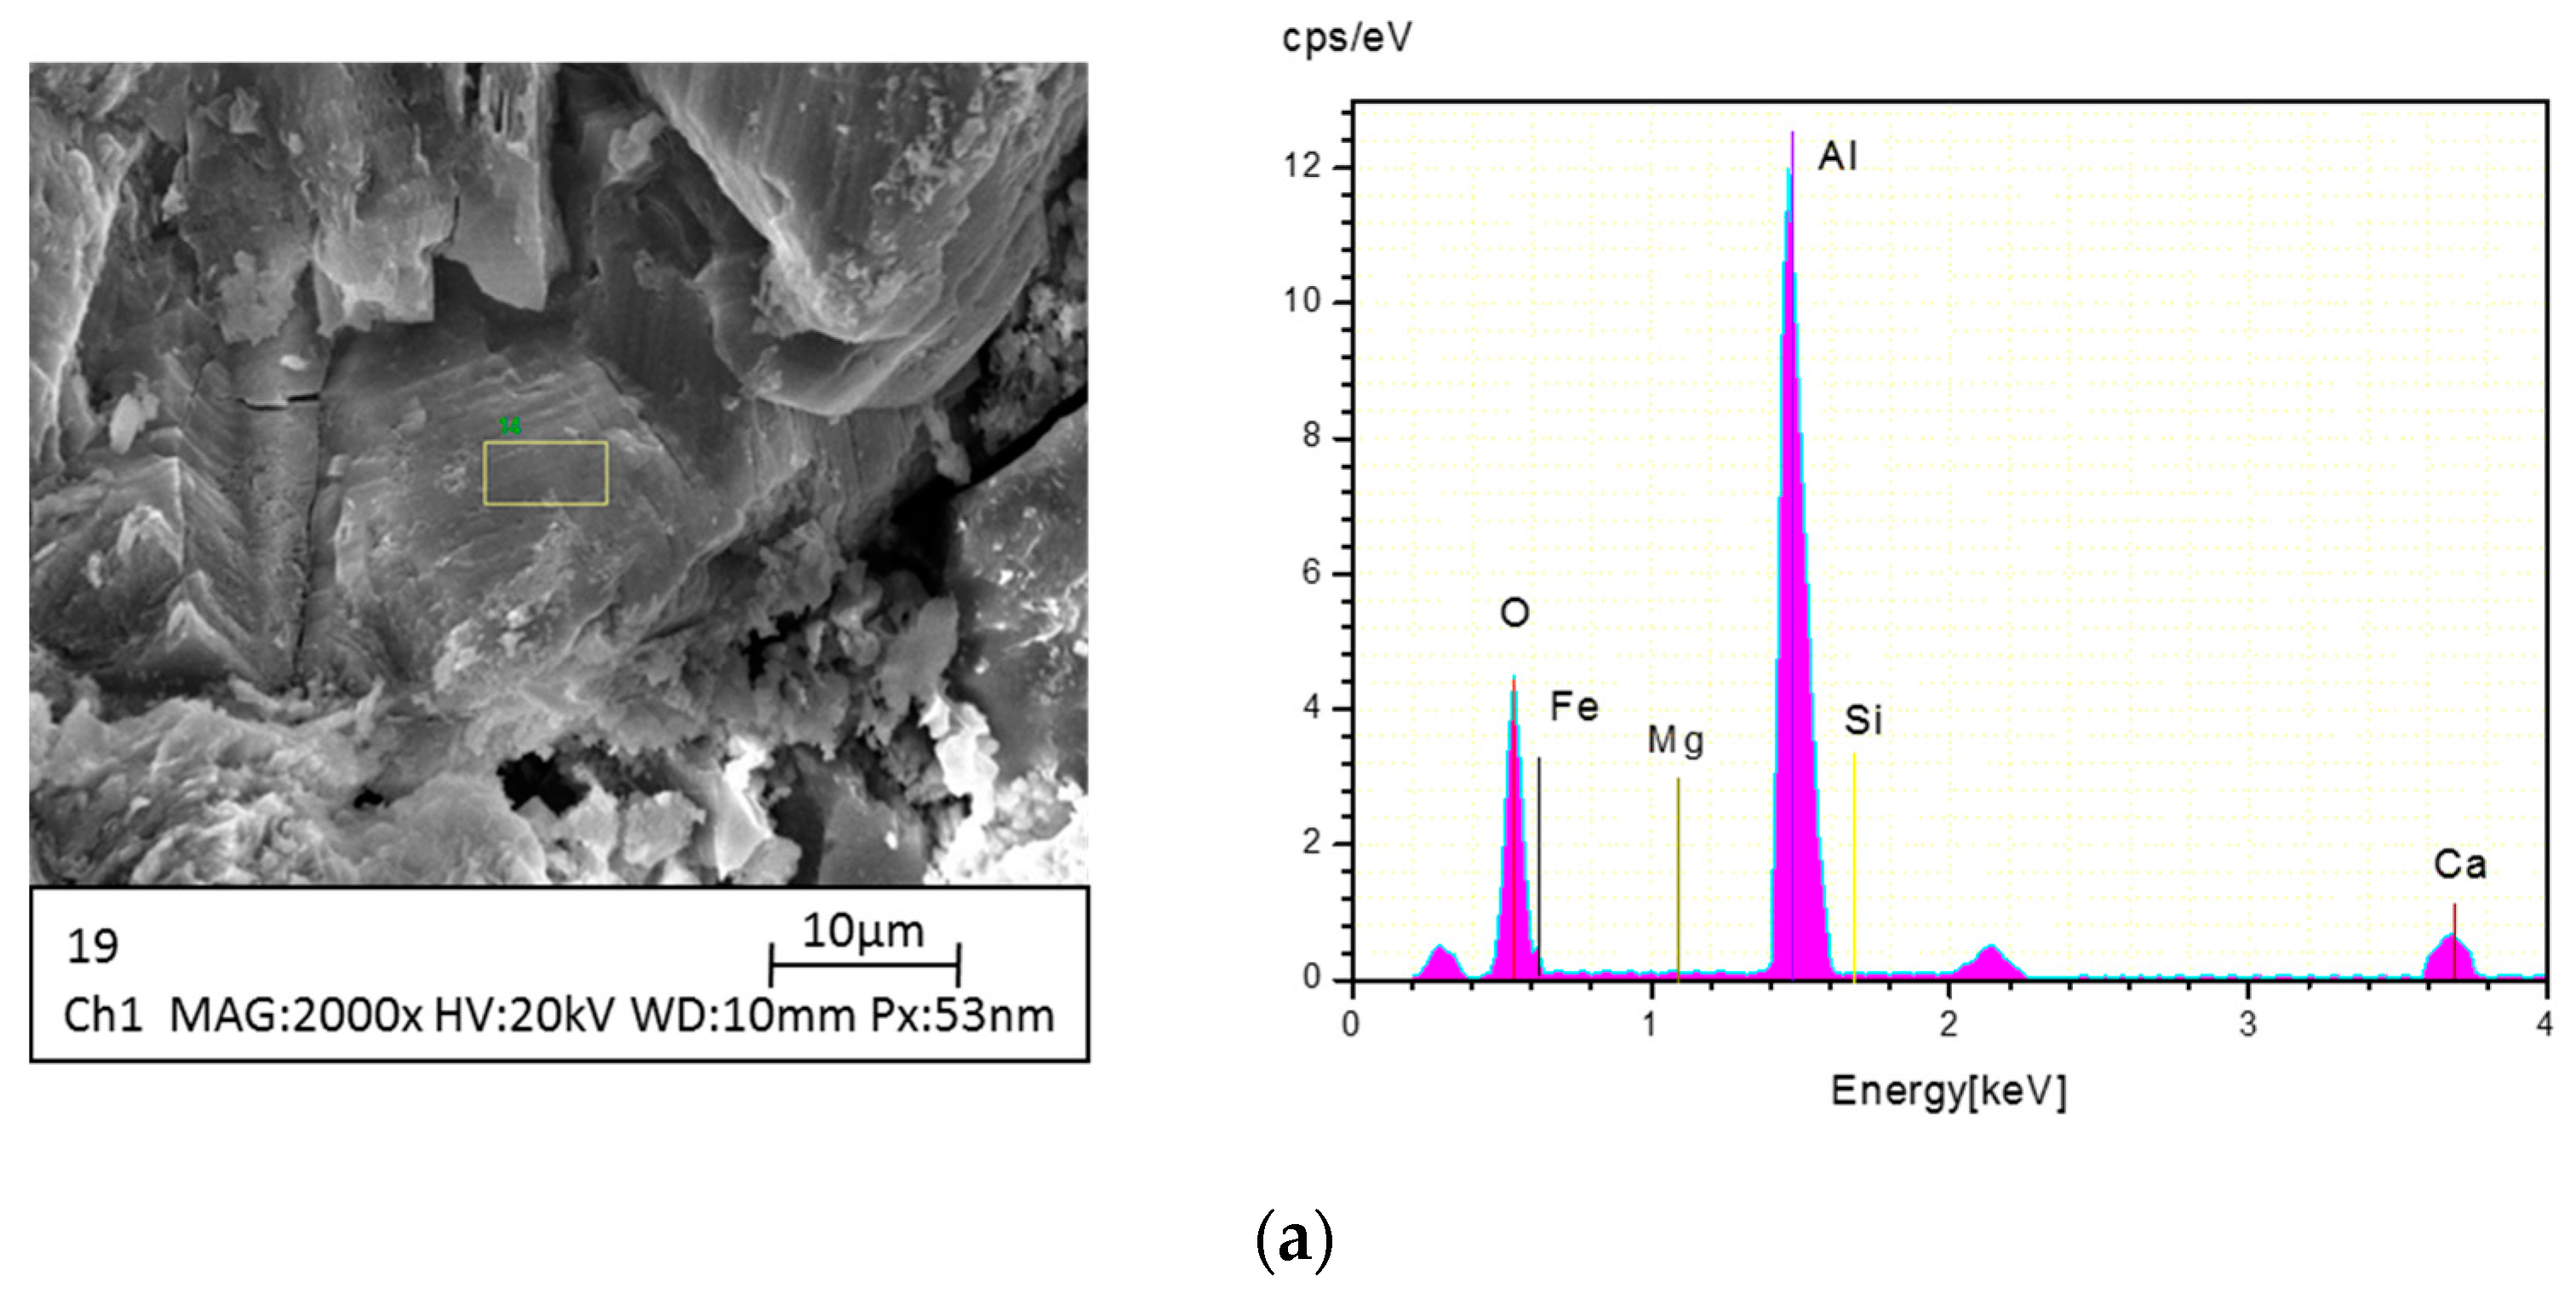
Figure 4 establishes the chemical compositions of the large agglomerates and discrete particles, which are detected by XPS. The large agglomerates are referred to as Al2O3 while the small particles are regarded as Ca-Al-Si eutectics, as shown in Figure 4a,b, respectively. The large agglomerates are broken into small particles, resulting in the reappearance of the porous structure. However, the resurgence of the porous structure is quite different from the former low temperature structure shown in Figure 3h or Figure 3i. The high temperature porous structure occurs because of Al2O3 has a chemical reaction with other oxides or eutectics to generate Ca-Al-Si-O eutectics while the low temperature structures are mainly formed by physical evaporation and transition. The cataclasm of large agglomerations and the reappearance of the porous structure accounts for the first turning point in the VSR curve.
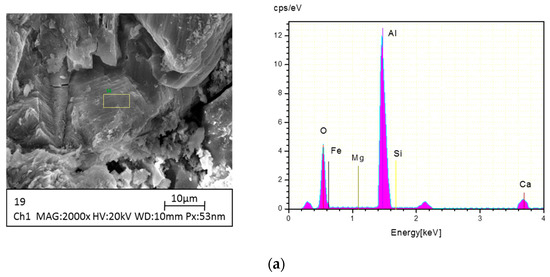
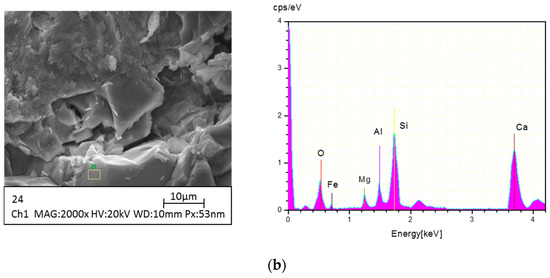
Figure 4.
SEM photos and elemental compositions of different structures at various temperatures: (a) the large agglomerates in sintered SCA sample (S/A = 2.5, B/A = 0.8) at 1073 K; (b) discrete particles in sintered SCA sample (S/A = 2.5, B/A = 0.8) at 1073 K.
As is described above, the morphologic characteristics agree with the VSR changing trend. Further, the heating processes are categorized into three stages by temperature, according to the trend in VSR change and morphology:
- Physical reaction dominant stage (temperature below 973 K). During this period, the volume of the samples shrinks as the temperature increases, following the disappearance of the porous structure. Further, physical reactions, such as dissociative water evaporation and particle transition, play a key role in the volume of the cuboid samples.
- Expanding stage (temperature ranges from 973 K to 1273 K). During this period, the volume of the samples expands as the temperature elevates, accompanied by the reappearance of the porous structure. This stage has also been referred to as the beginning stage of sintering by Wenjia Song [16]. At the same time, eutectics and oxide react with large agglomerations, lancinating large agglomerations into discrete particles.
- Sintering stage (temperature above 1273 K). During this period, the volume of the samples shrinks dramatically, with the production of the amorphous compact structure. Meanwhile, chemical compositions and intermediate products react violently with each other.
3.2. Sintering Characterization versus Different S/As
3.2.1. Volume Shrinkage Ratio (VSR) Variations versus Different S/As
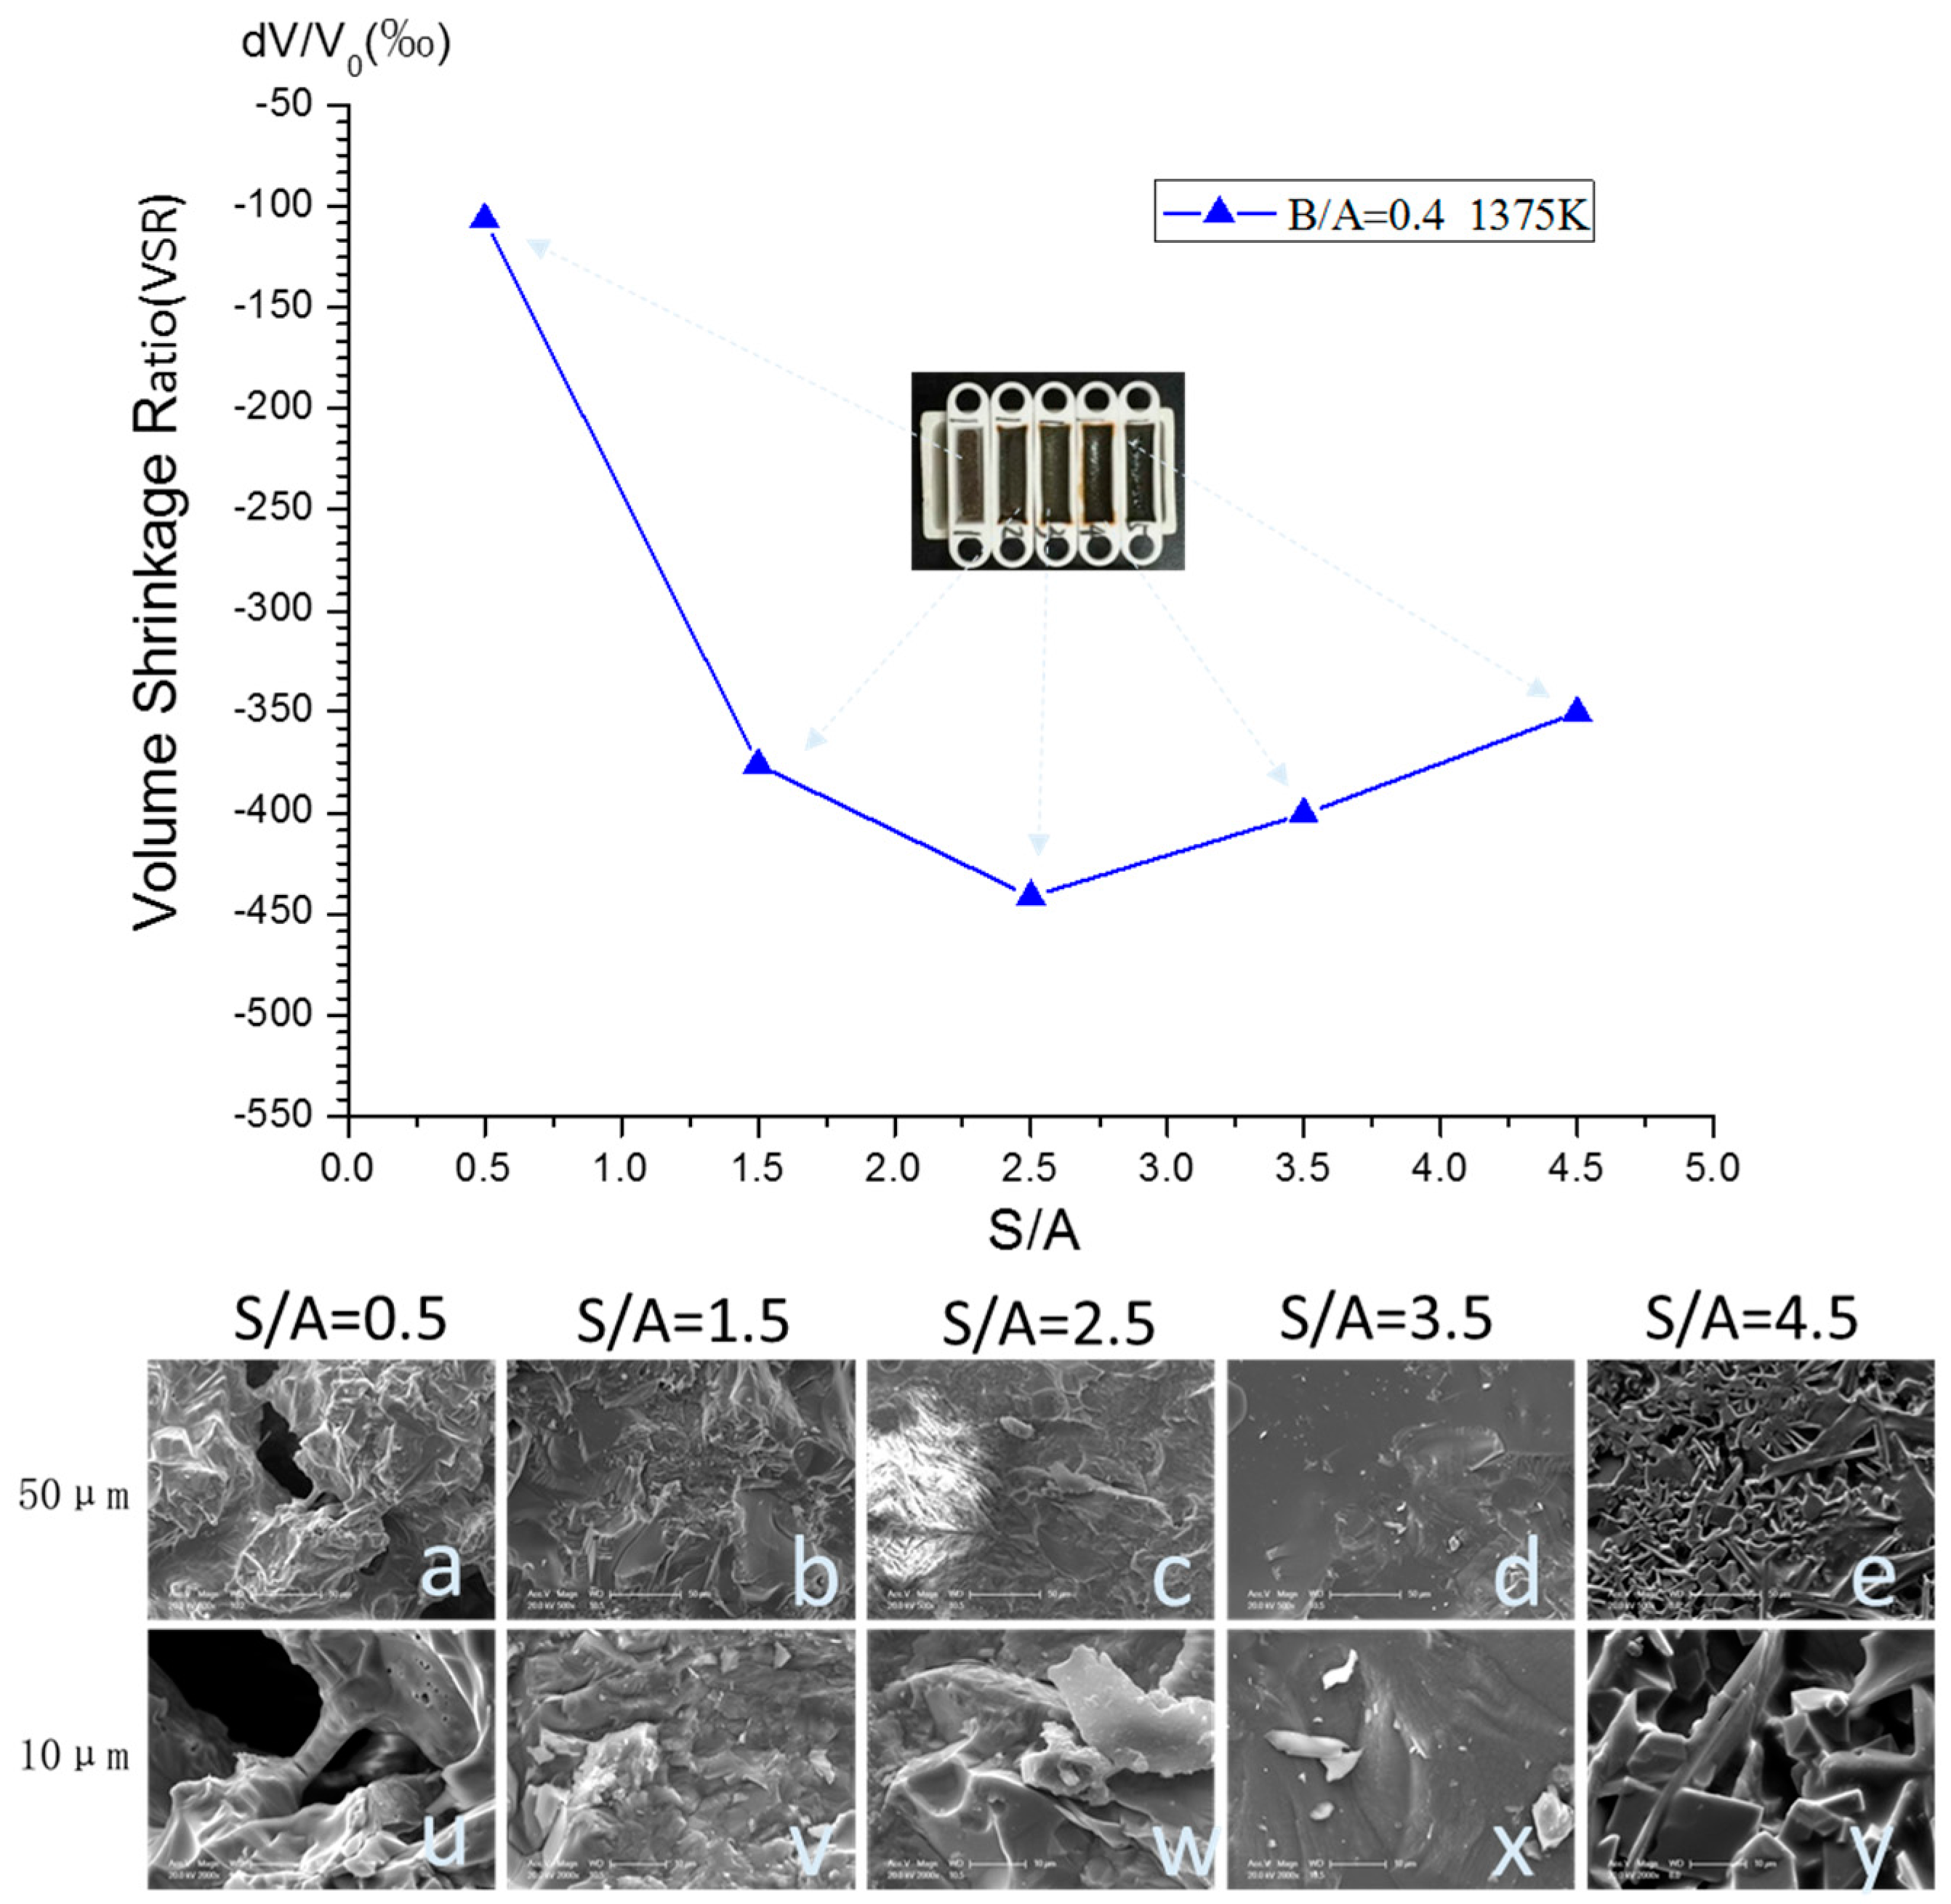
As has been stated, the sintering process mainly takes place in the third sintering stage, at temperatures over 1273 K. Therefore, the VSR and morphology of five sintered samples with various S/As are displayed in Figure 5, which were kept in a muffle furnace for 12 h at 1373 K. When the S/A is small (S/A = 0.5), the large agglomerations dominate the structure of the sintered specimens. The porous structure is obviously detected in Figure 5a,u, which accounts for the slight shrinkage of the low S/A sample in the VSR curve. As S/A increases (S/A = 1.5, 2.5, 3.5), as is shown in Figure 5b–d,v–x, amorphous dense agglomerations are clearly observed. This is because the acid and basic oxide can react with each other to form low melting eutectics, such as augite, wadsleysite, and calcium magnesium iron silicate. This phenomenon will be explored in the next section. Although the porous structure has nearly disappeared, distinctions can be observed in Figure 5v–x. The large agglomerations skeleton can be hazily observed in Figure 5v while the dense amorphous structure can be viewed clearly in Figure 5x. As S/A further increases (S/A = 4.5), as is shown in Figure 5y, the porous structure reappears, which accounts for the gradual rise at the end of the VSR curve.
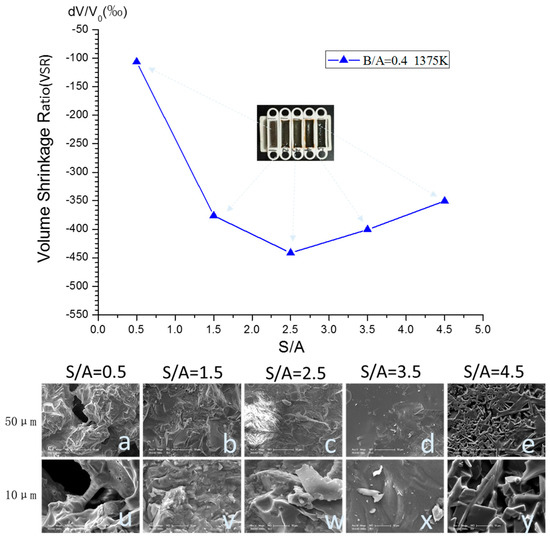
Figure 5.
VSR and morphology of SCA sintered samples (B/A = 0.8, 1373 K) at different S/As.
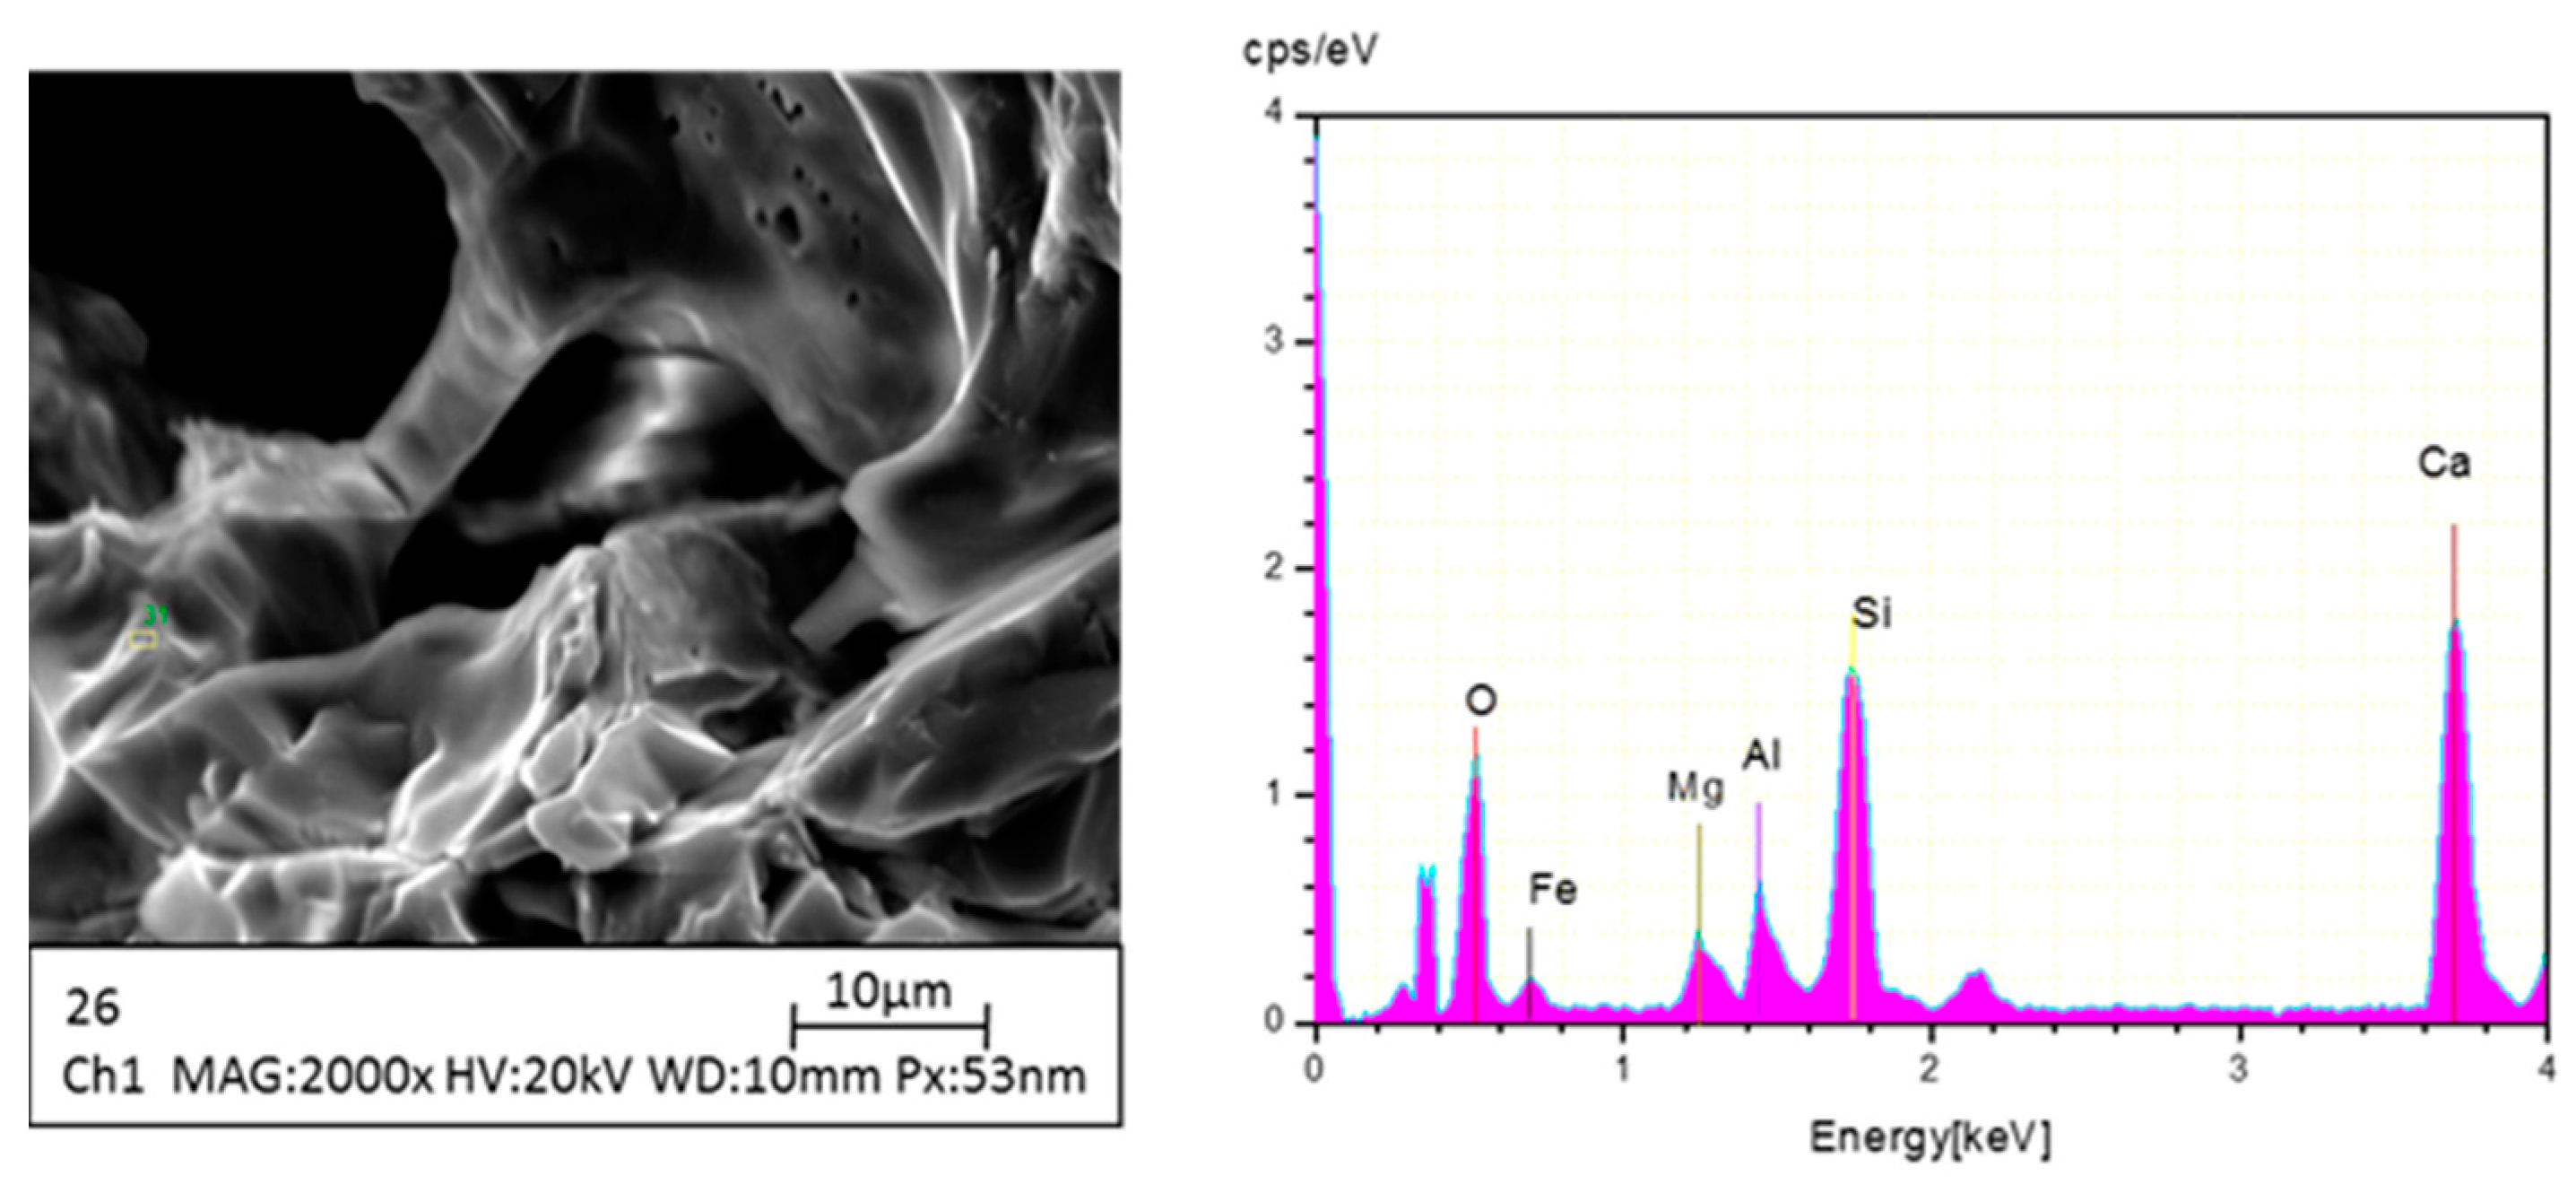
As shown in Figure 5a,u, the large agglomerations adhere to each other with small shot rod adhesives. Figure 6 establishes the chemical compositions of the shot rod adhesives. It is observed that the adhesives are mainly composed of Ca-Si-Al-O eutectics. These eutectics have low fusion temperatures; therefore, they would liquefy when the temperature is over 1273 K. The liquefied materials flow to the vacuum spaces among large agglomerations, acting as an adhesive to hold the shape of samples. As S/A increases, if there is enough SiO2, it would produce more liquid eutectics and then these liquid eutectics would completely fill the vacuum space, resulting in a dense amorphous structure, as shown in Figure 5b–d,v–x. Since the micro structures of these three samples (S/A = 1.5, 2.5, 3.5) are almost unanimous, their VSRs show the same degree, as depicted in the VSR curve in Figure 5.

Figure 6.
Chemical compositions of adhesives among large agglomerations.
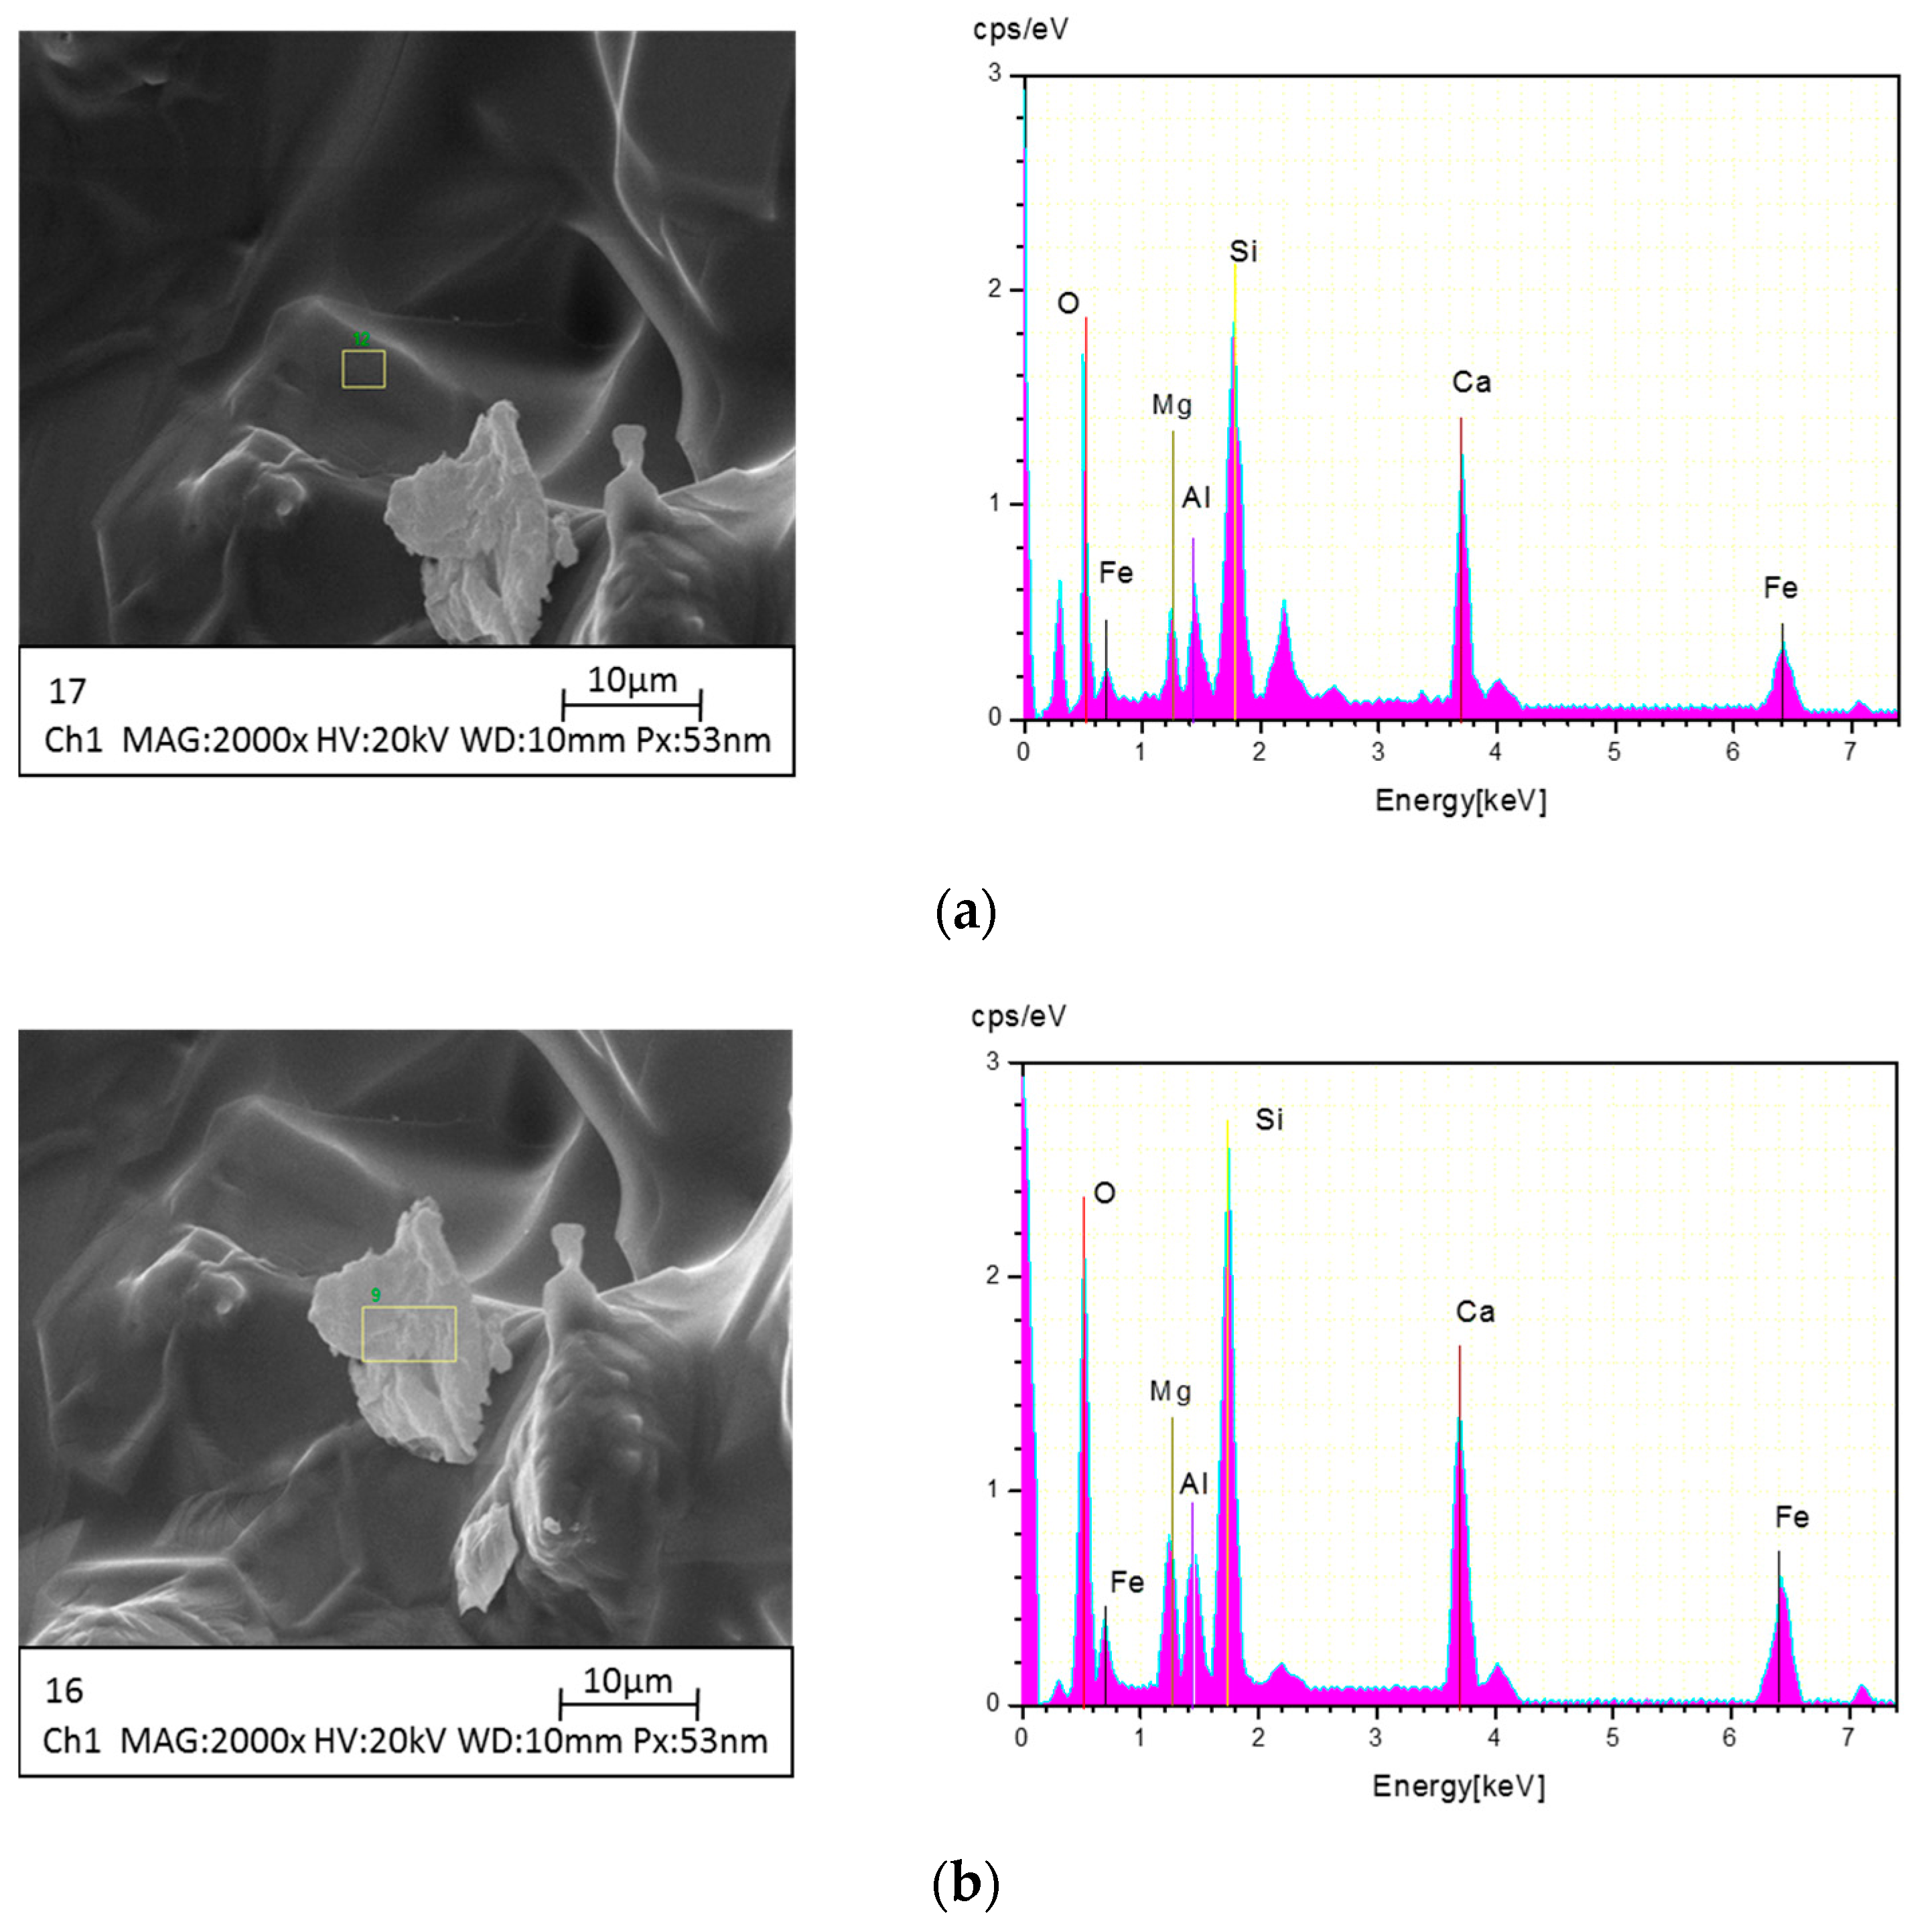
Figure 7 illustrates the chemical composition of the dense amorphous structure and discrete materials. It can be observed that both the dense amorphous structure and the discrete materials are composed of Ca-Al-Fe-Mg-Si-O eutectics. This is consistent with Liang Wang’s result that the iron bearing compound hematite is quick to react with quartz and aluminum silicates to product iron silicates and iron aluminum silicates at low temperatures, which exist in the form of dense amorphous structure [29]. Comparing Figure 6 with Figure 7, it is deduced that, the Al2O3 enriched large agglomerations can obstruct the formation of Ca-Al-Fe-Mg-Si-O eutectics, which will be explained in the following section.

Figure 7.
Chemical compositions of dense amorphous structure and discrete materials: (a) dense amorphous structure; (b) discrete materials.
Figure 8 establishes the morphology and chemical compositions of a sintered sample (S/A = 4.5, 1373 K). The cubic crystal and slender rod crystal twist around each other, dominating the structure of the entire sample. As is shown, few agglomerations were observed while the vacuum space repeated. As is shown in Figure 8a, the slender rod crystal is mainly composed of Ca-Al-Si-O eutectics while the cubic crystal is mainly composed of Ca-Si-O silicates. When Figure 8 is compared with Figure 7, it can be deduced that the excess SiO2 prevents the Ca-Si-O silicates and Ca-Al-Si-O eutectics to forming Ca-Al-Fe-Mg-Si-O eutectics. Further evidence of this is given in the next section.
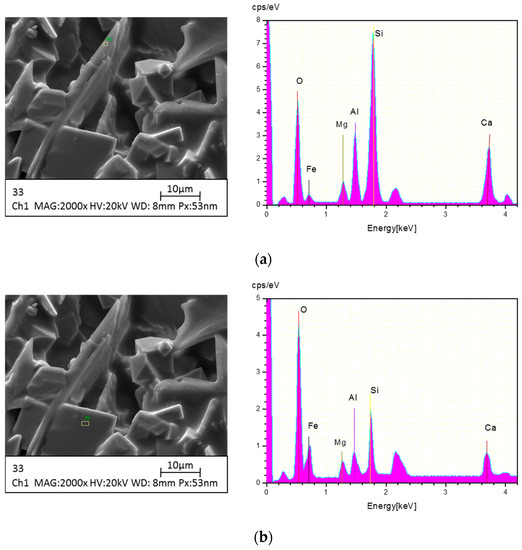
Figure 8.
Chemical compositions of different micro structures: (a) slender rod crystal; (b) cubic crystal.
3.2.2. XRD Graph of SCA at Various Temperatures
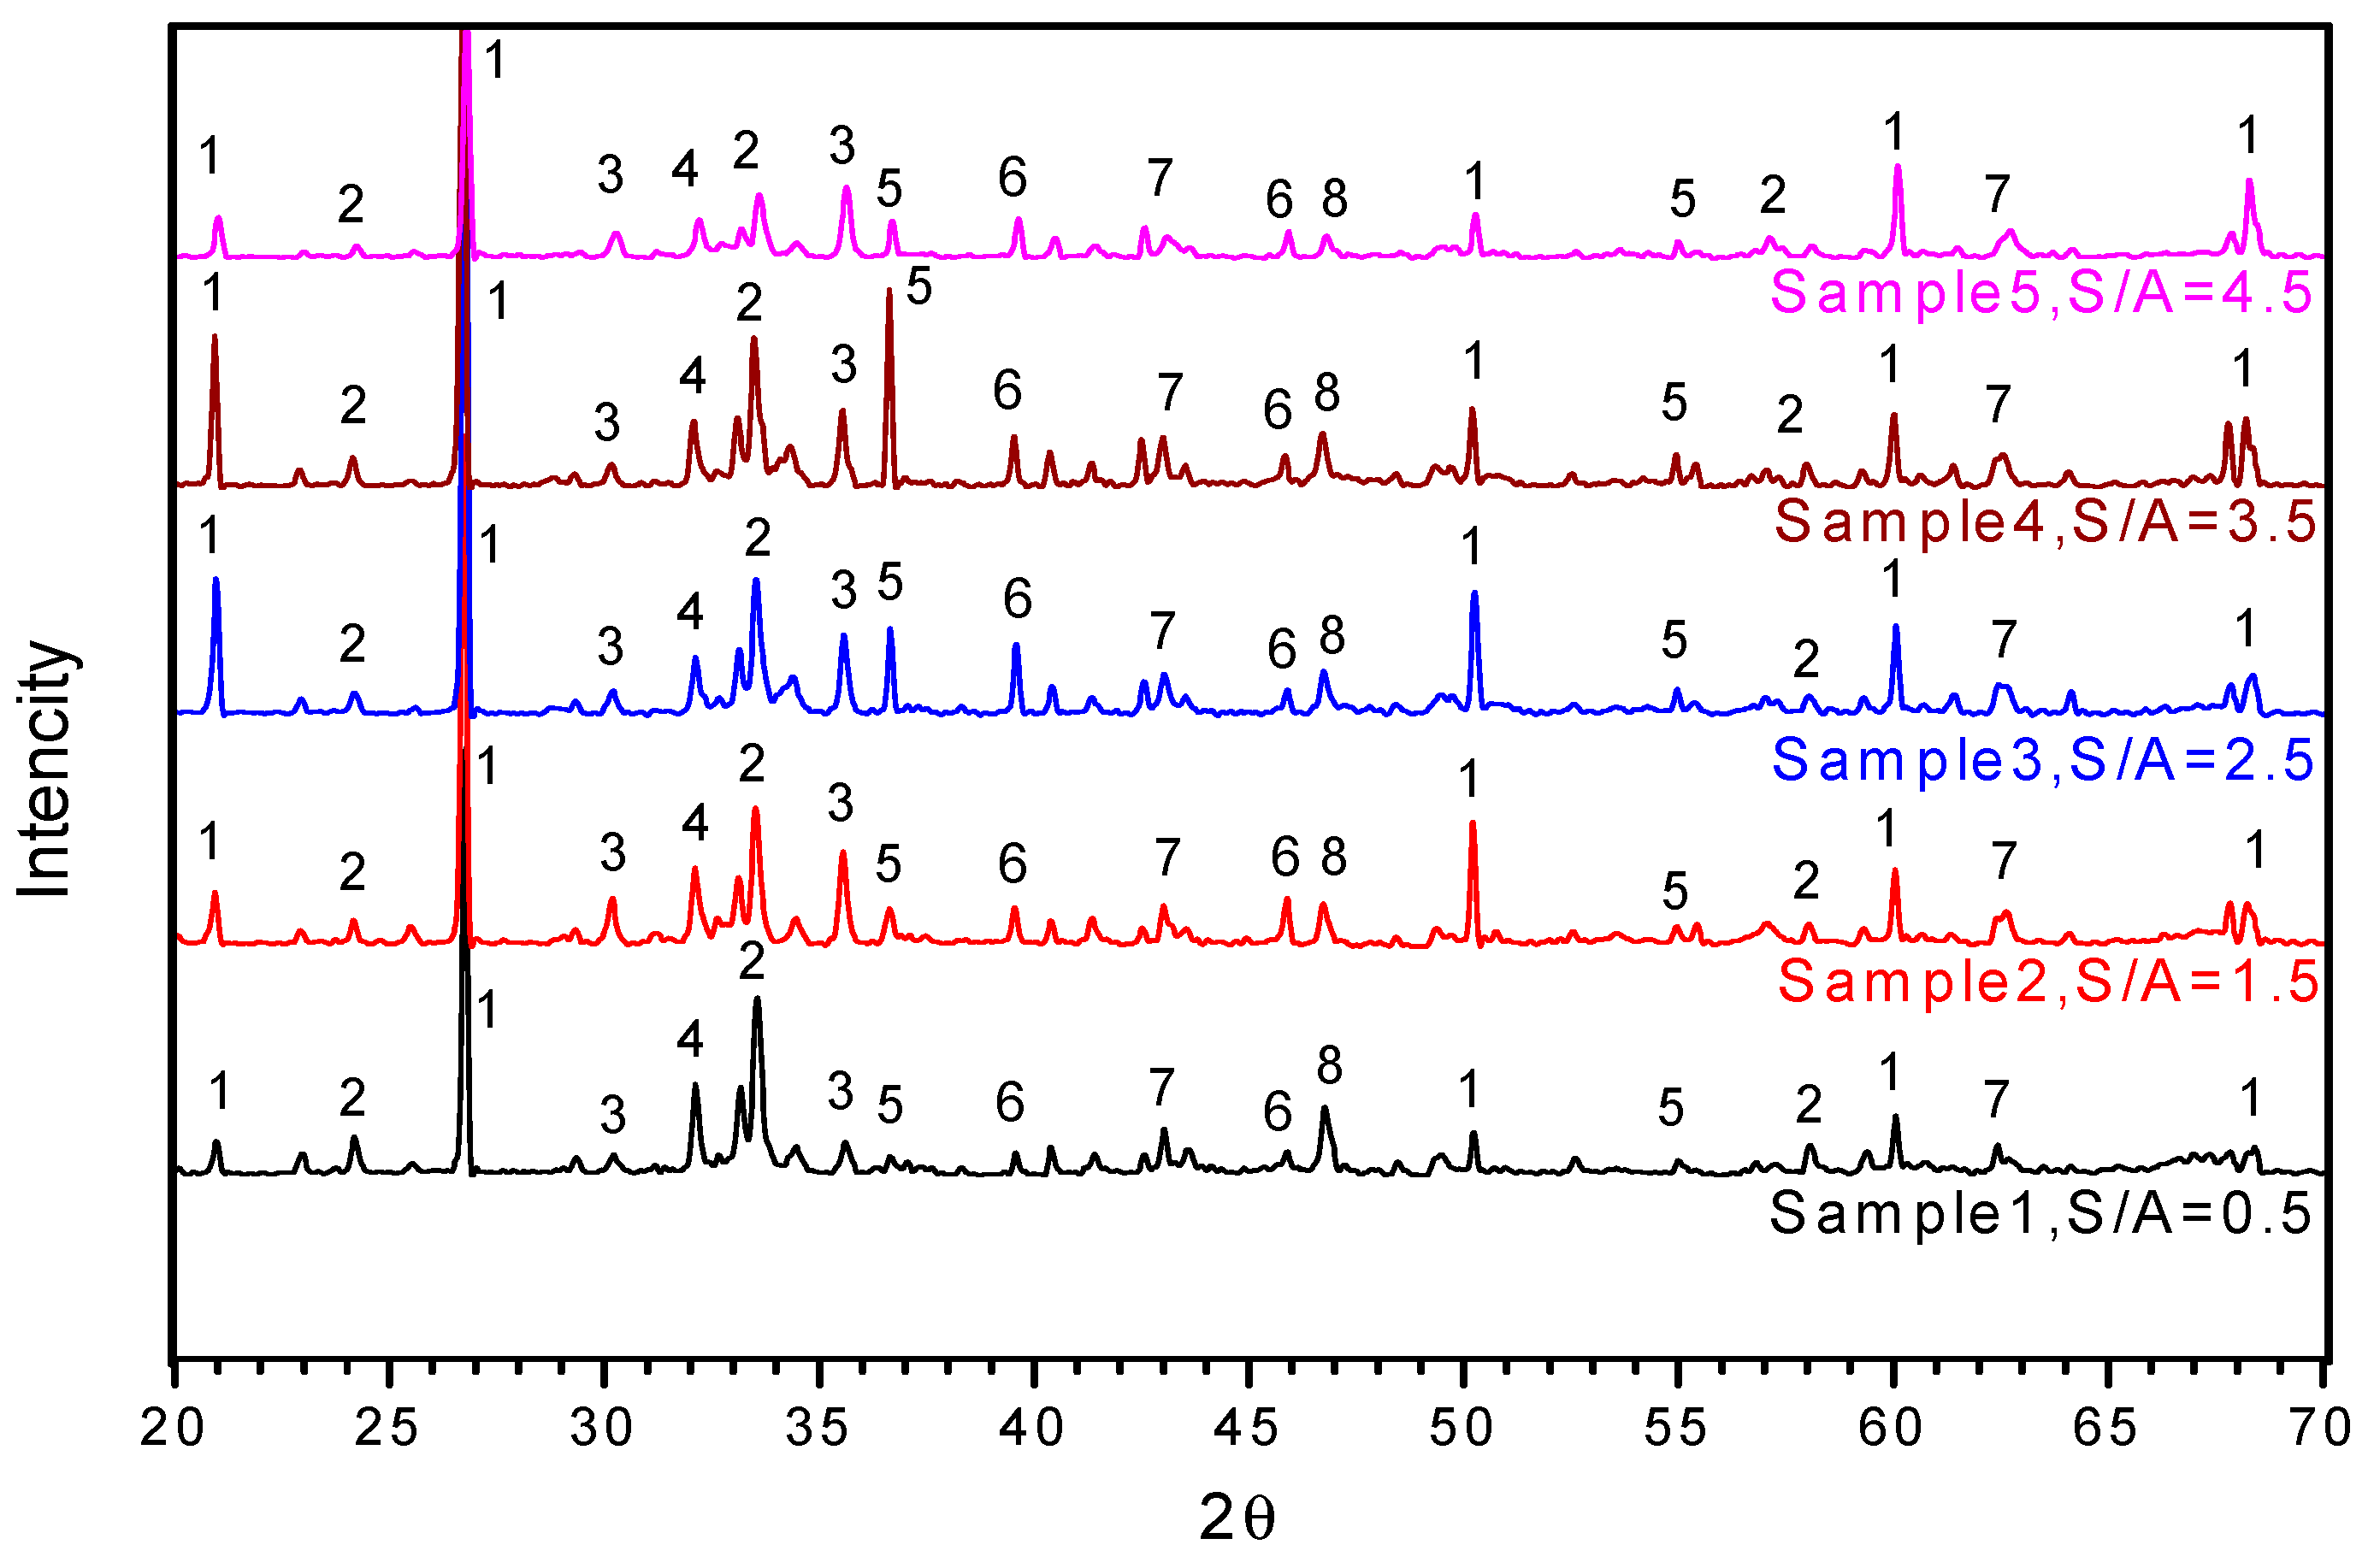
XRD graphs of different sintered SCA samples at 1373 K are established in Figure 9. Numbers 1–7 represent quartz, calcium magnesium iron silicate, augite, calcium silicate, wadsleyite, aluminum oxide, and magnesia, respectively. The chemical components of sintered specimens have been determined by the chemical compositions of SCA and the same experimental conditions, thus each species of eutectics exists in every graph. However, distinctions can be detected among peak heights of different species, especially augite, calcium magnesium iron silicate, and wadsleyite, which qualitatively represent various relative contents of each species existing in various specimens. It is obvious that the peak heights of each component of Sample 1 (S/A = 0.5) and Sample 5 (S/A = 4.5) are lower than the others, as shown in Figure 9. This is because of the effects of excess Al2O3 and SiO2, as described previously. However, the Al2O3 and SiO2 mechanisms that affect the formation of eutectics are quite different. Al2O3, existing as large aggregations, as shown in Figure 5, has strong polarity and obstructs the formation of low melting eutectics [30], such as calcium silicate and calcium magnesium iron silicate. SiO2, in the form of cubic crystal and slender rod crystals, obstructs the formation of low melting eutectics by twining around the large aggregations and separating the active components and products, as shown in Figure 5y. Excess Al2O3 and SiO2 both account for the porous morphology structure, as is documented in the previous section, although the mechanism is different. The biggest distinction among the other three samples is the peak height of wadsleysite (5), as shown in Figure 9. This is due to the strong polarity of excess Al2O3 that obstructs the formation of wadsleysite (5). The products of calcium magnesium iron silicates (2), augite (3), wadsleysite (5), and other eutectics that are conducted by the interactions among acid oxide, basic oxide, and intermediate products, account for the amorphous dense morphology structure. The XRD results are in good agreement with the morphologic and chemical composition results.
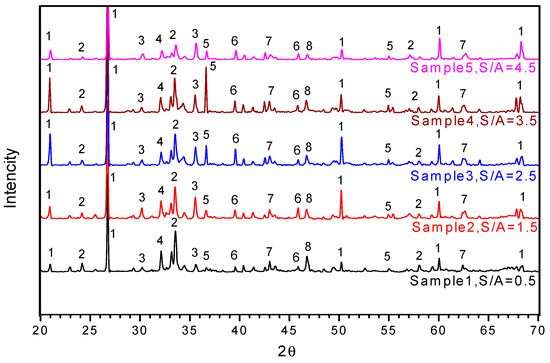
Figure 9.
XRD graphs of SCA versus various S/As at 1373 K: 1-quartz 2-calcium magnesium iron silicate 3-augite 4-calcium silicate 5-wadsleysite 6-aluminium oxide 7-magnesium.
3.2.3. Sintering Temperature of SCA Samples versus Different S/As
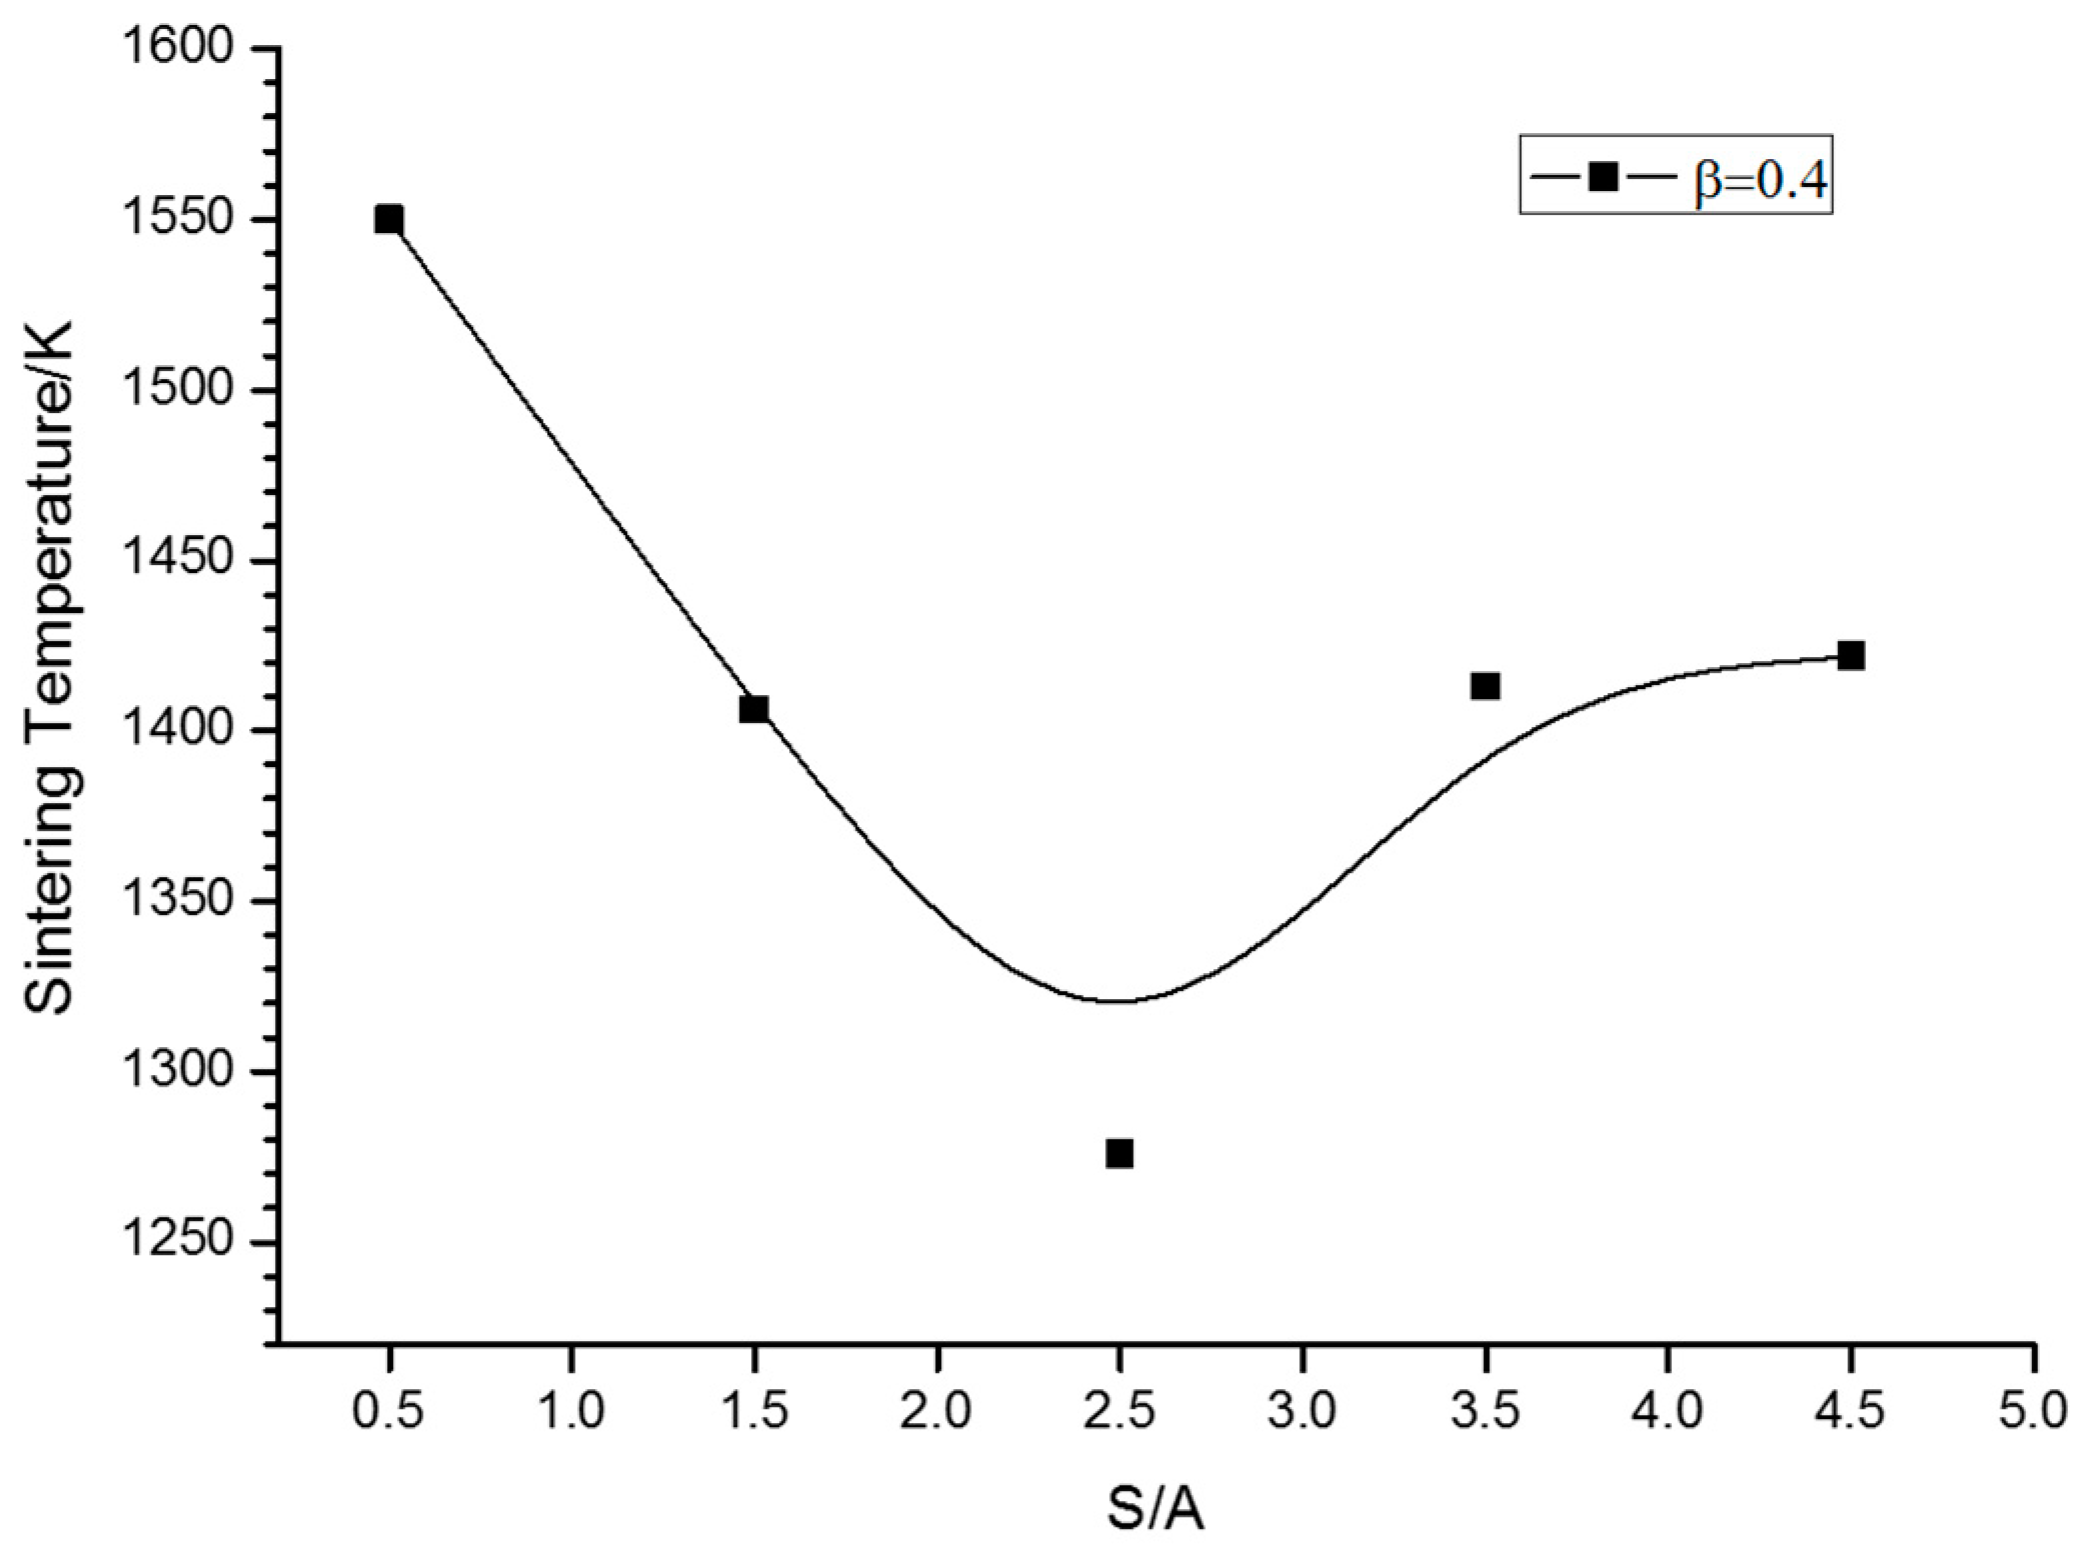
In order to further explore the effects of S/As on sintering characteristics of SCA, the sintering temperatures of these five specimens were tested by dilatometer (NETZSCH DIL 402C). As is shown in Figure 10, the sintering temperature significantly decreases to a low level at first, and then gradually rises to a high level with the increase of S/As. This trend of sintering temperature is consistent with the VSR curve in Figure 5. As is shown, the sintering temperatures measured by DIL are 40 K higher than those determined by the VSR curve. This is due to differences during the heating processes. The former ones were heated continuously with a heating rate of 5 K/min in DIL while the latter ones were kept at a constant temperature in a muffle furnace. The complete reactions require a set period of time; thus, the sintering temperature tested by DIL is higher than the temperature determined by VSR.
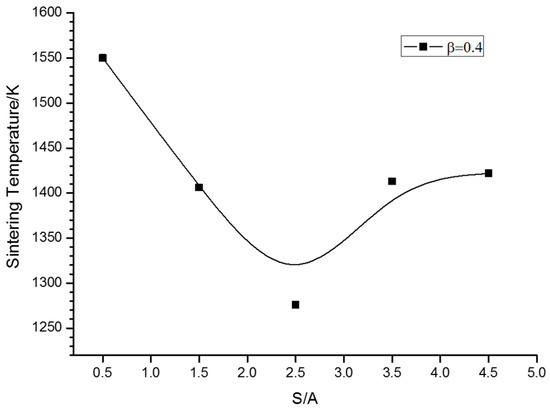
Figure 10.
Sintering temperature of SCA samples versus different S/As.
When S/A is low (S/A = 0.5), the samples are constituted of large agglomerates and composed of Al2O3 enriched refractory materials. The strong polarity of the Al2O3 enriched materials and the obstructed formation of low melting eutectics [30] account for the highest sintering temperature. When S/As are appropriate (S/A = 1.5, 2.5, 3.5), the samples have an amorphous dense structure and low melting eutectics. Thus, the sintering temperatures are lower than the lowest S/A temperature. When S/A is high (S/A = 4.5), the samples are constituted by a cubic crystal and slender rod crystal and composed of eutectics and SiO2 enriched materials. Since SiO2 is itself a refractory material with a high melting point, the sintering temperature of the high S/A sample is rather high.
The ST curve provides guidance for the operation of the CFB boiler. The dramatic decrease at the beginning of the curve suggests that adding Al2O3 enriched materials would significantly elevate the sintering temperature, alleviating the ash depositions. The gradual increase in the end of the curve indicates that adding SiO2 enriched materials would not make a difference. Considering the variety of different coals and the complexity of the chemical composition of each ash, more ST data will be used to improve future models.
4. Conclusions
In this work, five synthetic coal ashes were prepared as a mixture of SiO2-Al2O3-MgO-Fe2O3-CaO to quantitatively analyze the complex process of physical reactions, expansion, and sintering. Samples with various S/A ratios were treated in a muffle furnace at different temperatures (from 773 K to 1373 K, at a 100 K interval) for 12 h to achieve sintered samples. The results of VSR, DIL, SEM, XPS, and XRD comprehensively describe the morphological and chemical characteristics of sintered samples.
Using the VSR changing trend and morphology, the shrinkage process is categorized into three stages at different temperatures: physical reaction dominated stage, expanding stage, and sintering stage. The sintering procedure mainly occurred in the third sintering stage. During this period, the sample volume shrinks dramatically, at the same time that an amorphous compact structure is produced. Meanwhile, chemical compositions and intermediate products violently reacted with each other.
There is great variation in the results of sintering characteristics in S/A ratios during the sintering stage. Excess SiO2 (S/A = 4.5) results in a porous structure while excess Al2O3 (S/A = 0.5) brings out large aggregations. The other three samples (S/A = 1.5, 2.5, 3.5) have an amorphous compacted structure and are composed of low fusion temperature materials (e.g., augite and wadsleysite). Sintering temperatures first dramatically decrease to a low level and then gradually rise to a rather high level as S/A increases, suggesting that Al2O3 enriched additives are more effective than SiO2 enriched additives in alleviating depositions.
Acknowledgments
This work is supported by the National Natural Science Foundation of China (No. 51376171), and the National Key Basic Research Program (No. 2010CB227300) founded by MOST (Ministry of Science and Technology).
Author Contributions
All authors contributed to this work. Hongwei Hu is the first author. Hongwei Hu designed the study and participated in the experiments and writing the manuscript. Kun Zhou and Kesheng Meng conceived and designed the experiments; Lanbo Song analyzed the data and contributed to selecting the analysis tools. The project was supervised by Qizhao Lin.
Conflicts of Interest
The authors declare no conflict of interest.
References
- Tekin, I. Properties of NaOH activated geopolymer with marble, travertine and volcanic tuff wastes. Constr. Build. Mater. 2016, 127, 607–617. [Google Scholar] [CrossRef]
- Messina, F.; Ferone, C.; Colangelo, F.; Cioffi, R. Low temperature alkaline activation of weathered fly ash: Influence of mineral admixtures on early age performance. Constr. Build. Mater. 2015, 86, 169–177. [Google Scholar] [CrossRef]
- Ferone, C.; Liguori, B.; Capasso, I.; Colangelo, F.; Cioffi, R.; Cappelletto, E.; Di Maggio, R. Thermally treated clay sediments as geopolymer source material. Appl. Clay Sci. 2015, 107, 195–204. [Google Scholar] [CrossRef]
- Ni, J.; Zhou, Z.; Yu, G.; Liang, Q.; Wang, F. Molten slag flow and phase transformation behaviors in a slagging entrained-flow coal gasifier. Ind. Eng. Chem. Res. 2010, 49, 12302–12310. [Google Scholar] [CrossRef]
- Wang, L.; Skreiberg, Ø.; Becidan, M.; Li, H. Investigation of rye straw ash sintering characteristics and the effect of additives. Appl. Energy 2016, 162, 1195–1204. [Google Scholar] [CrossRef]
- Wang, L.; Skreiberg, Ø.; Becidan, M. Investigation of additives for preventing ash fouling and sintering during barley straw combustion. Appl. Therm. Eng. 2014, 70, 1262–1269. [Google Scholar] [CrossRef]
- Rushdi, A.; Sharma, A.; Gupta, R. An experimental study of the effect of coal blending on ash deposition. Fuel 2004, 83, 495–506. [Google Scholar] [CrossRef]
- Shen, M.; Qiu, K.; Zhang, L.; Huang, Z.; Wang, Z.; Liu, J. Influence of coal blending on ash fusibility in reducing atmosphere. Energies 2015, 8, 4735–4754. [Google Scholar] [CrossRef]
- Selvakumaran, P.; Lawerence, A.; Bakthavatsalam, A.K. Effect of additives on sintering of lignites during CFB combustion. Appl. Therm. Eng. 2014, 67, 480–488. [Google Scholar] [CrossRef]
- Dawoud, B.; Amer, E.; Gross, D. Experimental investigation of an adsorptive thermal energy storage. Int. J. Energy Res. 2007, 31, 135–147. [Google Scholar] [CrossRef]
- Luan, C.; You, C.; Zhang, D. An experimental investigation into the characteristics and deposition mechanism of high-viscosity coal ash. Fuel 2014, 119, 14–20. [Google Scholar] [CrossRef]
- Namkung, H.; Xu, L.H.; Shin, W.C.; Kang, T.J.; Kim, H.T. Study on deposition tendency of coal ash under various gasification environments through DTF. Fuel 2014, 117, 1274–1280. [Google Scholar] [CrossRef]
- Magdziarz, A.; Dalai, A.K.; Koziński, J.A. Chemical composition, character and reactivity of renewable fuel ashes. Fuel 2016, 176, 135–145. [Google Scholar] [CrossRef]
- Wang, L.; Becidan, M.; Skreiberg, Ø. Sintering behavior of agricultural residues ashes and effects of additives. Energy Fuels 2012, 26, 5917–5929. [Google Scholar] [CrossRef]
- Pang, C.H.; Hewakandamby, B.; Wu, T.; Lester, E. An automated ash fusion test for characterisation of the behaviour of ashes from biomass and coal at elevated temperatures. Fuel 2013, 103, 454–466. [Google Scholar] [CrossRef]
- Song, W.; Hess, K.U.; Damby, D.E.; Wadsworth, F.B.; Lavallée, Y.; Cimarelli, C.; Dingwell, D.B. Fusion characteristics of volcanic ash relevant to aviation hazards. Geophys. Res. Lett. 2014, 41, 2326–2333. [Google Scholar] [CrossRef]
- LI, H.; Yoshihiko, N.; Dong, Z.; Zhang, M. Application of the FactSage to predict the ash melting behavior in reducing conditions. Chin. J. Chem. Eng. 2006, 14, 784–789. [Google Scholar] [CrossRef]
- Wu, X.; Zhang, Z.; Chen, Y.; Zhou, T.; Fan, J.; Piao, G.; Kobayashi, N.; Mori, S.; Itaya, Y. Main mineral melting behavior and mineral reaction mechanism at molecular level of blended coal ash under gasification condition. Fuel Process. Technol. 2010, 91, 1591–1600. [Google Scholar] [CrossRef]
- Matjie, R.H.; Li, Z.; Ward, C.R.; French, D. Chemical composition of glass and crystalline phases in coarse coal gasification ash. Fuel 2008, 87, 857–869. [Google Scholar] [CrossRef]
- Ilyushechkin, A.Y.; Hla, S.S.; Roberts, D.G.; Kinaev, N.N. The effect of solids and phase compositions on viscosity behaviour and TCV of slags from Australian bituminous coals. J. Non-Cryst. Solids 2011, 357, 893–902. [Google Scholar] [CrossRef]
- Song, W.J.; Tang, L.H.; Zhu, X.D.; Wu, Y.Q.; Zhu, Z.B.; Koyama, S. Effect of coal ash composition on ash fusion temperatures. Energy Fuels 2010, 24, 182–189. [Google Scholar] [CrossRef]
- Hurst, H.J.; Novak, F.; Patterson, J.H. Viscosity measurements and empirical predictions for fluxed Australian bituminous coal ashes. Fuel 1999, 78, 1831–1840. [Google Scholar] [CrossRef]
- Patterson, J.H.; Hurst, H.J. Ash and slag qualities of Australian bituminous coals for use in slagging gasifiers. Fuel 2000, 79, 1671–1678. [Google Scholar] [CrossRef]
- Jing, N.; Wang, Q.; Cheng, L.; Luo, Z.; Cen, K. The sintering behavior of coal ash under pressurized conditions. Fuel 2013, 103, 87–93. [Google Scholar] [CrossRef]
- Ji, S.; Li, F.; Wang, T.; Li, Z.; Fang, H.; Huang, J.; Fang, Y. Investigation on the sintering behaviors of low-temperature lignite ashes. J. Therm. Anal. Calorim. 2014, 1311–1320. [Google Scholar] [CrossRef]
- Liu, B.; He, Q.; Jiang, Z.; Xu, R.; Hu, B. Relationship between coal ash composition and ash fusion temperatures. Fuel 2013, 105, 293–300. [Google Scholar] [CrossRef]
- Xuan, W.; Whitty, K.J.; Guan, Q.; Bi, D.; Zhang, J. Influence of isothermal temperature and cooling rates on crystallization characteristics of a synthetic coal slag. Fuel 2014, 137, 193–199. [Google Scholar] [CrossRef]
- Selvakumaran, P.; Bakthavatsalam, A.K. Effect of chemical composition of ash on sintering of lignites in circulating fluid bed combustion and successful operation of large CFBC boilers. Appl. Therm. Eng. 2015, 85, 135–147. [Google Scholar] [CrossRef]
- Liang, W.; Geir, S.; Johan, E.H.; Morten, G.G. Sintering characteristics of sewage sludge ashes at elevated temperatures. Fuel Process. Technol. 2012, 96, 88–97. [Google Scholar]
- Zhao, B.; Zhang, Z.; Wu, X. Prediction of coal ash fusion temperature by least-squares support vector machine model. Energy Fuels 2010, 24, 3066–3071. [Google Scholar] [CrossRef]


© 2017 by the authors. Licensee MDPI, Basel, Switzerland. This article is an open access article distributed under the terms and conditions of the Creative Commons Attribution (CC BY) license ( http://creativecommons.org/licenses/by/4.0/).