Abstract
Increasing the penetration levels of renewable energy sources (RESs) in microgrids (MGs) may lead to frequency instability issues due to intermittent nature of RESs and low inertia of MG generating units. On the other hand, presence of electric vehicles (EVs), as new high-electricity- consuming appliances, can be a good opportunity to contribute in mitigating the frequency deviations and help the system stability. This paper proposes an optimal charging/discharging scheduling of EVs with the goal of improving frequency stability of MG during autonomous operating condition. To this end, an efficient approach is applied to reschedule the generating units considering the EVs owners’ behaviors. An EV power controller (EVPC) is also designed to determine charge and discharge process of EVs based on the forecasted day-ahead load and renewable generation profiles. The performance of the proposed strategy is tested in different operating scenarios and compared to those from non-optimized methodologies. Numerical simulations indicate that the MG performance improves considerably in terms of economy and stability using the proposed strategy.
1. Introduction
Microgrids (MGs) are a part of distribution systems that include several means of distributed generation (DG), renewable energy sources (RESs), storage devices and controllable loads and have the capability to operate either in connected or isolated mode [1,2]. During islanded operation, due to low inertia of MG and intermittent nature of RESs such as wind and solar, there might be some frequency deviations beyond the acceptable range. Thus, an islanded MG requires specific primary and secondary frequency control schemes, in order to maintain power balance between generation and load and restore frequency to the nominal value [3]. Moreover, MG requires sufficient spinning reserve provided by DG units or energy storage systems (ESSs) to keep power balance during islanded operation [4]. With increasing penetration level of EVs and considering that they are available most of the times in a day, they can play the role of ESSs in a way to alter their energy consumption/production level under the vehicle-to-grid (V2G) concept and exchange the power with the grid [5]. Thus, with V2G capability, EVs can provide ancillary services for the grid, such as frequency regulation [5], load levelling [6,7] and spinning reserve [8]. With the application of a well-designed energy management system (EMS), EVs can act as an effective solution to compensate the uncertain behaviour of RESs. On the other hand, EVs without any proper management strategy could cause a number of issues such as energy losses, overloads, and voltage and frequency fluctuations [9]. Different methods have been used in recent literature to manage EVs’ charging and discharging process to facilitate ancillary services in the presence of RESs [10,11]. The role of EVs in primary frequency response and in the presence of renewable energies was investigated in [5] for the Great Britain power system. By considering three EV charging strategies, it was shown that a proper EV charging strategy is effective in primary frequency response and can stabilize the grid frequency when is needed. In [12], with regard to the randomness of renewable energy generation, the operation of EVs in the MG was scheduled to minimize cost of charging. Moreover, economic incentives for EV owners to compensate the wind forecast uncertainties were provided in [13]. Coordination of EVs and minimization of the penalty cost associated with wind power imbalances was studied in [14]. Authors in [15] presented an aggregated primary frequency control model, where a participation factor, based on the state-of-charge (SOC), was used to determine the droop characteristic. It was investigated that EVs can effectively improve the system frequency response due to their ability to participate in primary reserves. The work in [16] performed a comparative study in order to evaluate benefits of EVs providing primary frequency control in an islanded system with high penetration of RESs. A control strategy was also presented in [17] in order to provide active participation of EVs for load frequency response purposes. In the same study, the SOC of EVs was managed by using a smart charging strategy in order to obtain a scheduled charging level requested by an EV owner. In a similar manner, Ref. [18] provided frequency regulation to the power grid using EVs with an effective pricing policy, and Ref. [19] presented a frequency control method considering both EVs and controllable loads.
When an MG enters an isolated mode due to loss of the main grid or a blackout/fault, it necessitates appropriate control and management schemes such that both the economical and stability targets are achieved. In this regard, this paper proposes an EV energy management scheme for MG autonomous operation based on local frequency measurements such that EVs will contribute. The participation of EVs will contribute to the frequency stability of the MG in off-grid times. The proposed control strategy is intended to manage EVs’ charging and discharging process considering cost signal and the demand not supplied by renewable resources () in order to keep the power balance within the MG. The major contributions of this paper are summarized as follows:
- Developing a stability margin index considering variability of load and renewable resources generation to attain the electricity cost signal to manage EVs’ charging and discharging process.
- Application of a new EV power controlling (EVPC) scheme to improve frequency stability of an islanded MG.
- Maximize the MG operator’s profit and minimize total emission of generating units.
The remainder of this paper is organized as follows. The EV power controlling (EVPC) scheme is discussed in Section 2. The problem of techno-economic optimization of the MG is formulated in Section 3. The simulation results and discussion are expressed in Section 4 and the conclusion is drawn in Section 5.
2. EV Power Controlling (EVPC) Scheme
2.1. MG Energy Management and Control
The stochastic behavior of RESs might cause inevitable concerns for the reliable operation of an islanded-MG. Any power fluctuation in such energy resources may lead to imbalance between load and generation, and, as a result, the frequency may deviate from its nominal value. On the other hand, an appropriate EV energy management strategy can respond to system frequency deviation and thus provide primary frequency regulation. EVs can supply (absorb) energy to (from) the network considering two possible operating modes: grid to vehicle (G2V) mode (charge and absorb power) and V2G mode (discharge and inject power to the network). Thus, from the MG operator’s point of view, EVs can act both as load and generation. EVs participate in frequency control to charge in low load or high generation hours and discharge during high load or low renewable generation hours. In order to measure the power mismatch between demand and renewable resources generation, an indicator is introduced here as demand not supplied by renewable sources () and defined as below:
where and are total demand and generation of renewable resources in period t, respectively. In an isolated MG without energy storage, should be supplied by dispatchable generators (DGs). The difference between the maximum installed capacity of DG units and stands for the spinning reserve capacity of MG. Here, the normalized value of this capacity is defined as stability margin index (SMI):
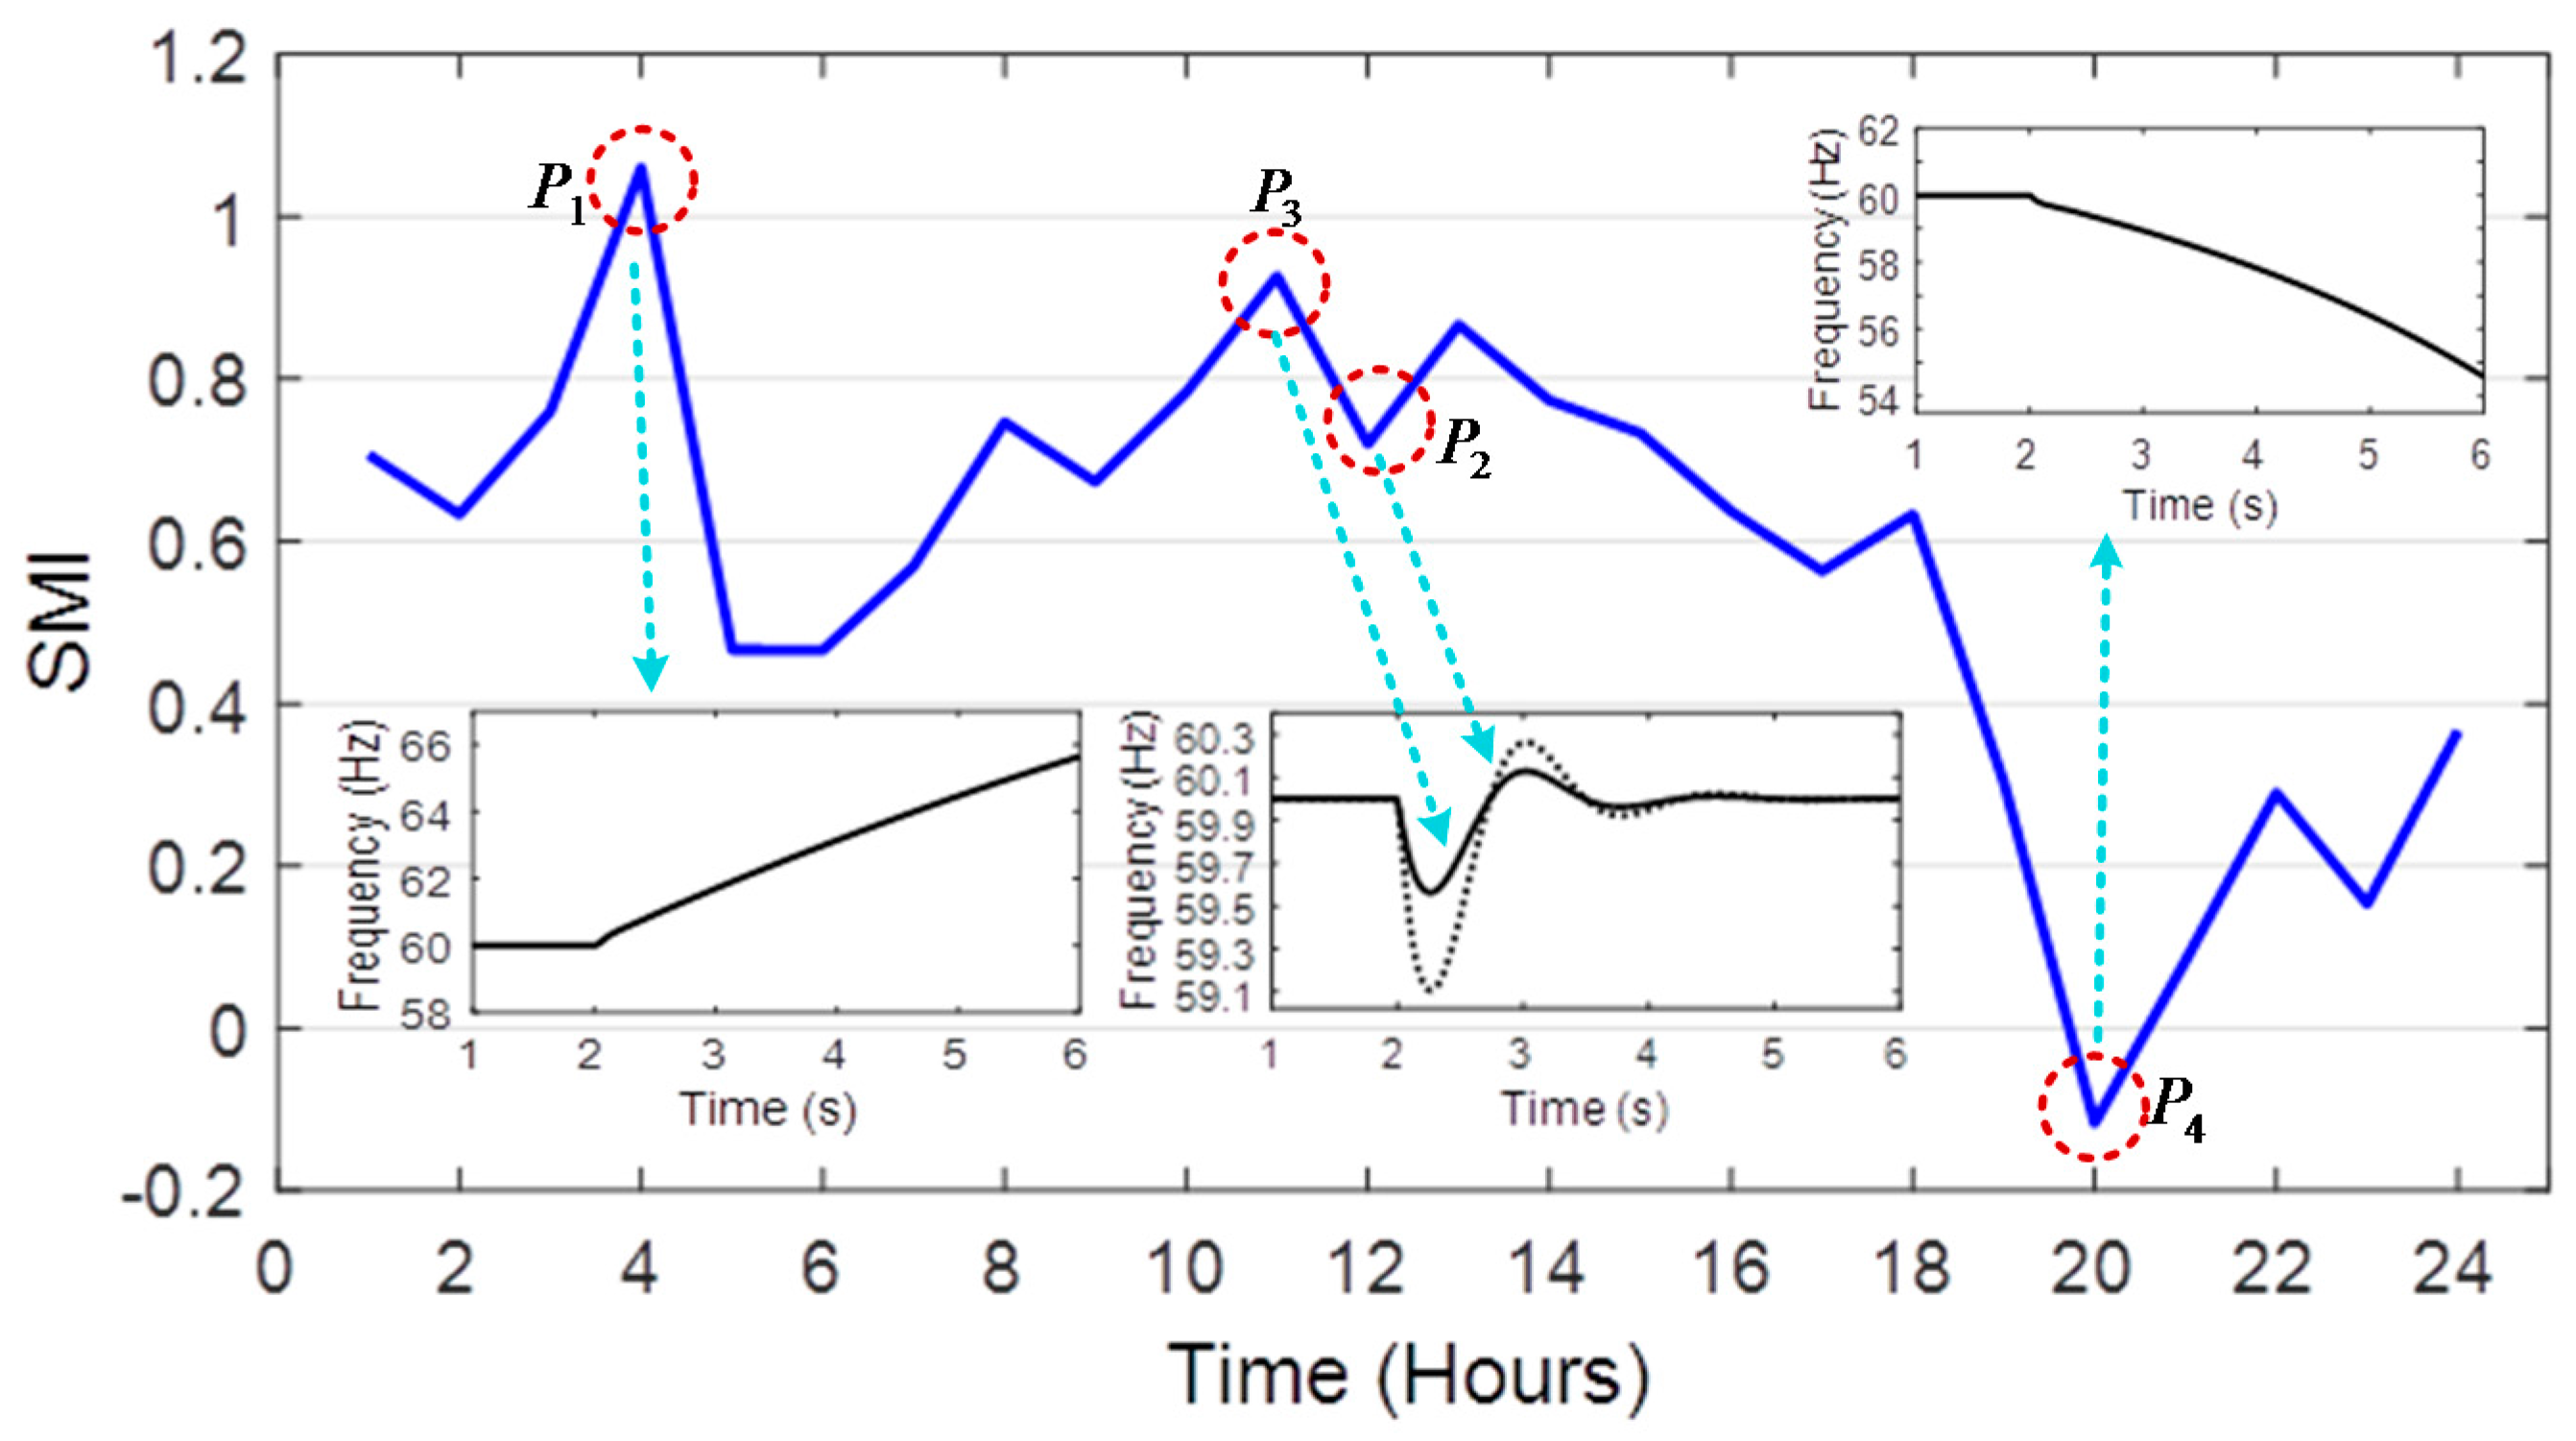
The SMI index value at each time period depends on the installed capacity of DG units, output power of renewable resources and customers’ demand. As an illustrative example, the variation of SMI during 24 h of a given day is shown in Figure 1. When the total demand is supplied by renewable resources, SMI value is 1 and it is zero if is equal to the total installed capacity of DGs. If the generated power of RESs is more than the total demand, then SMI will be more than 1 (e.g., point in Figure 1). In this case, as it can be observed, the system frequency is unstable, and, in order to keep frequency within its nominal value, dump load (DL), which is comprised of a set of three-phase resistors connected in series, is used in order to be activated to absorb that excess power. Moreover, if a portion of load is supplied by RESs, the SMI index takes a value between 0 and 1. In this case, the system frequency remains within its nominal values, but its variation differs in various points of SMI. For example, as it can be observed from Figure 1, the frequency at points and has different variations but is still in the accepted range. Furthermore, when SMI value is less than zero (i.e., point in the system frequency drops, thus it is required to inject power to the network (for example, by discharging of EVs)). In the next step, SMI is applied to obtain electricity buying and selling prices for EVs’ energy management.
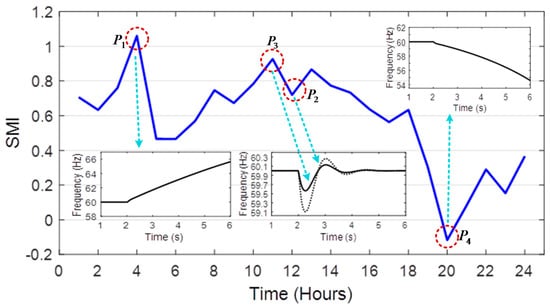
Figure 1.
A typical stability margin index (SMI).
The cost signal should follow the SMI index in such a way to encourage EV owners to charge or discharge their vehicles for keeping the power balance of the system and improving the frequency. Thus, cost signal should track the SMI trend with considering the range of electricity buying price (EBP) and electricity selling price (ESP) obtained from electricity market. On the other hand, the maximum (minimum) value of electricity price represents the highest (lowest) value of SMI. Other prices are fitted between these two limitations based on the values of SMI with the application of numerical analysis.
2.2. EVPC Structure
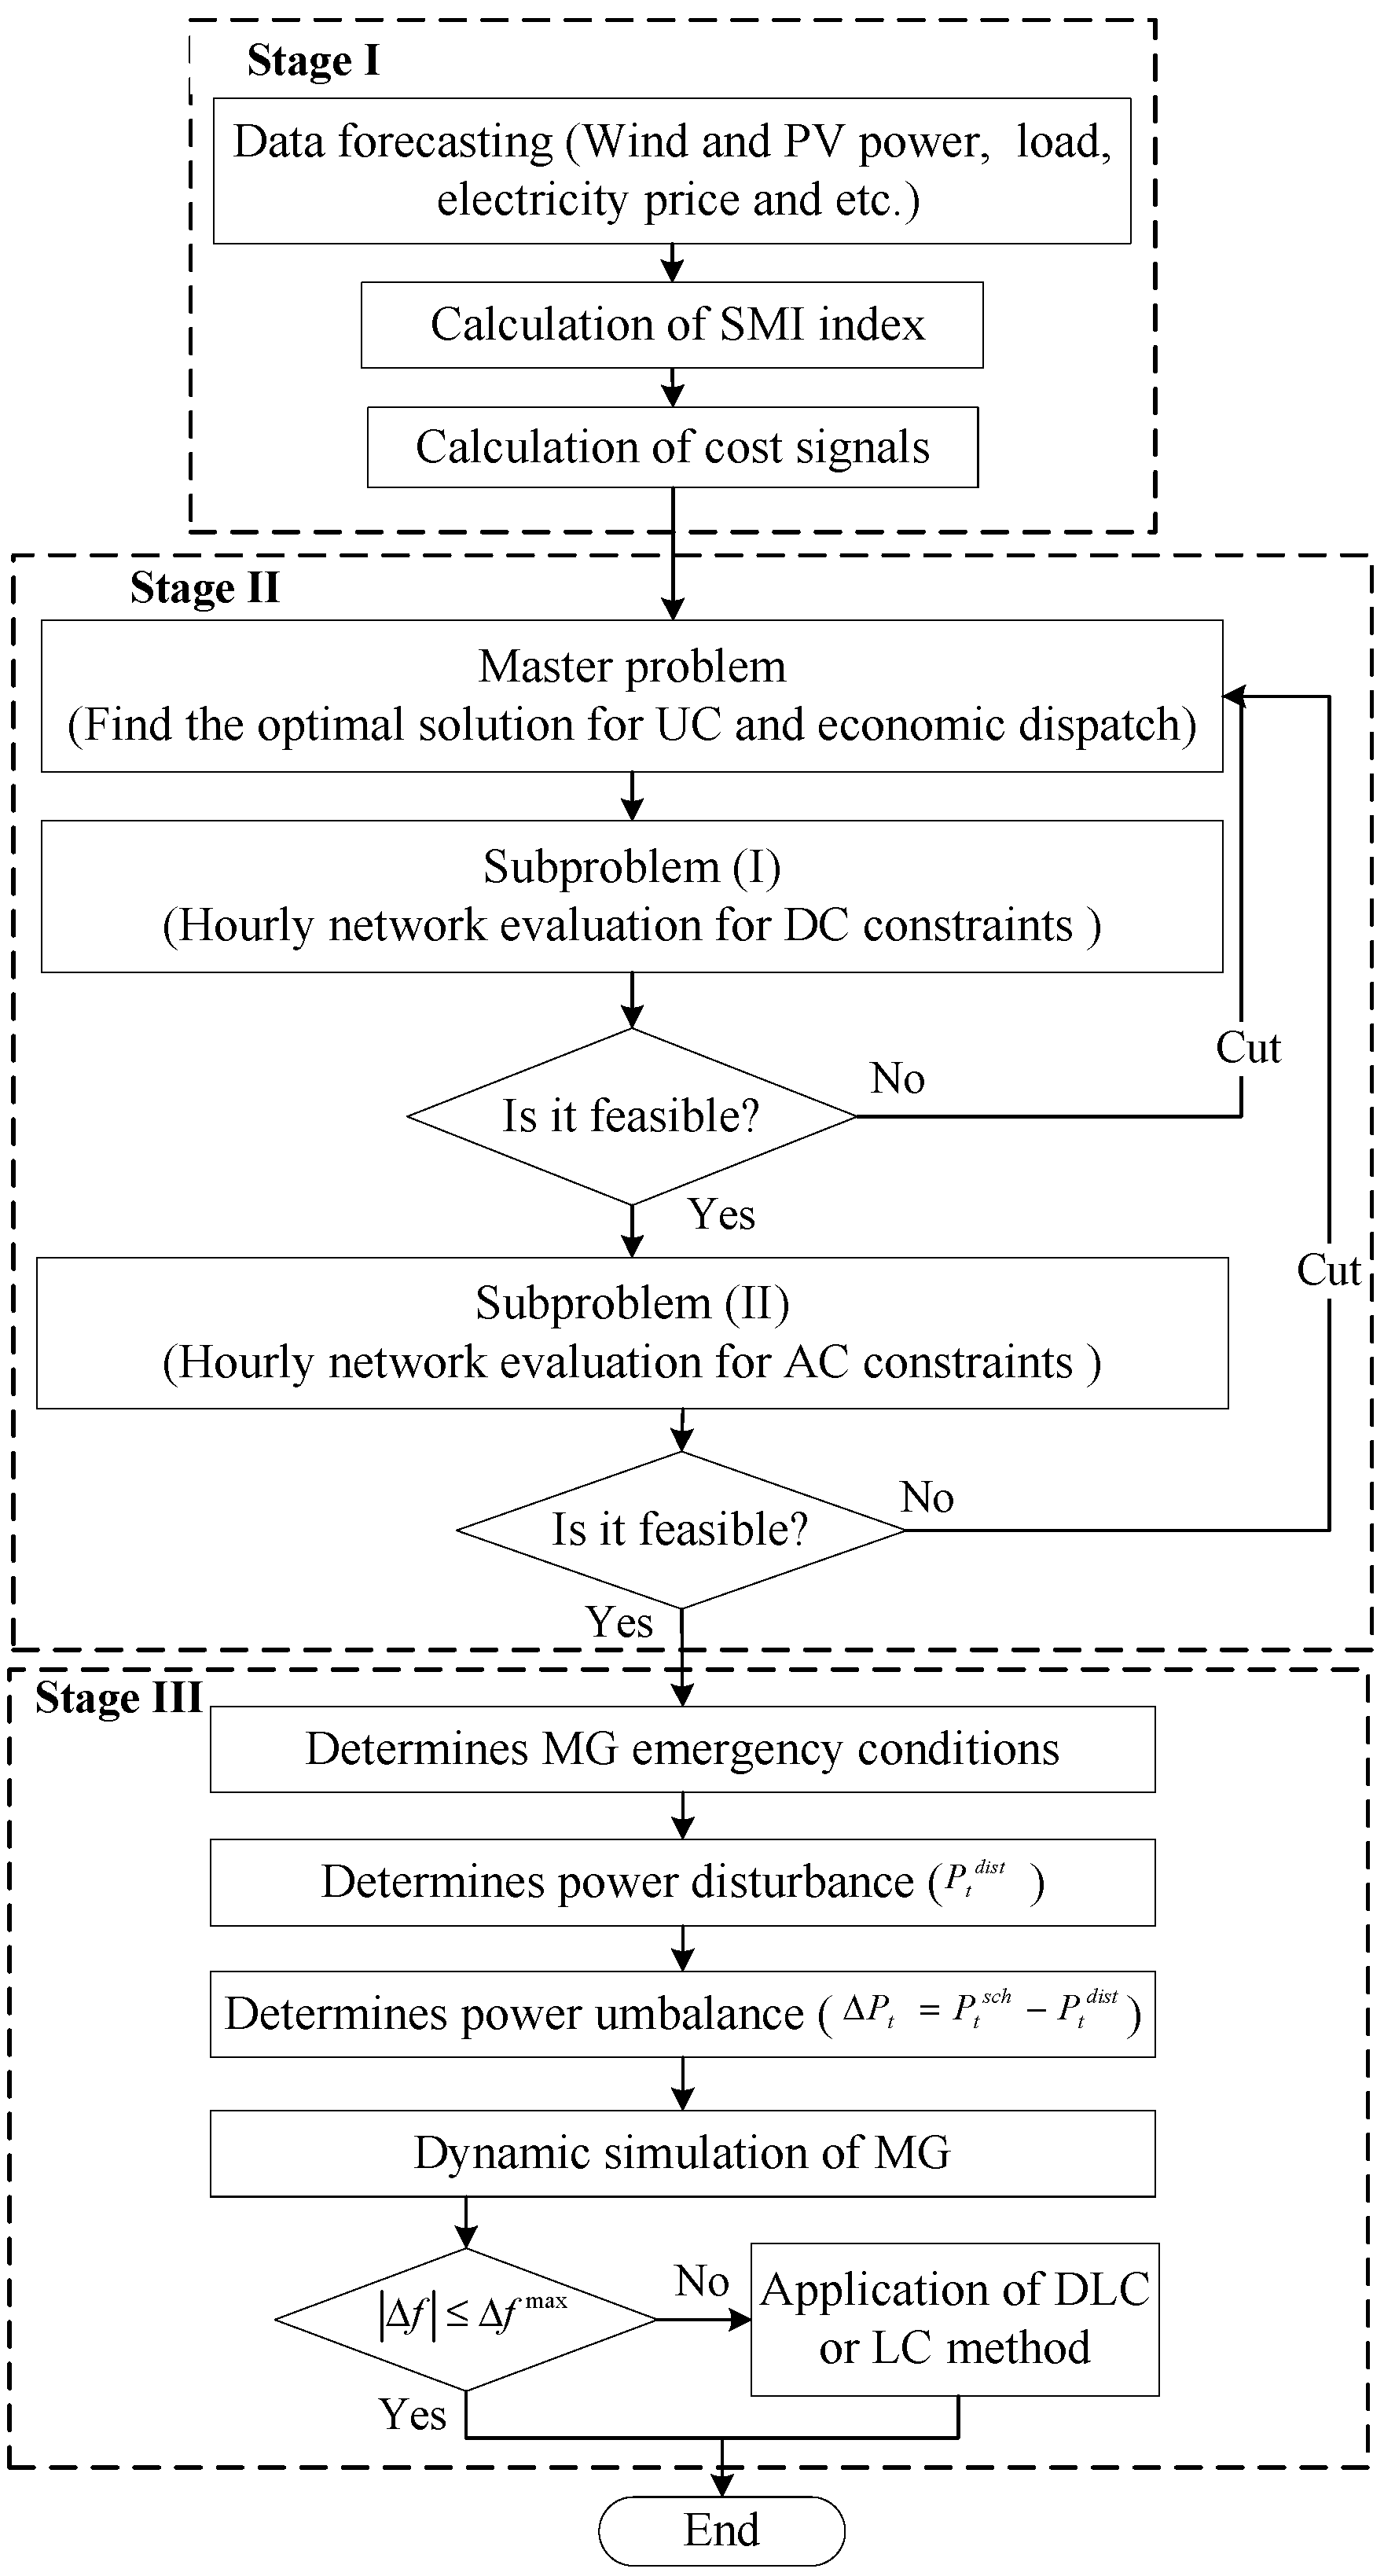
In calculating the payments to (by from) the MG operator when EVs are charged (discharged), EBP (ESP) value is introduced to reflect both the wholesale electricity prices and domestic tariffs [20]. Generally, once an EV is connected to the MG, it will be charged and thus has to pay for the consumed energy based on the EBP. However, when it discharges, it receives payments based on the ESP for providing the service. The high level of ESP is considered as a high electricity selling price (HESP), and, here, it is set at 85% of the maximal ESP. Moreover, the high level of EBP is considered as high electricity buying price (HEBP), and it is set at 60% of the maximal EBP. In the islanding operation mode of MG, the major goal is to keep the system power balance and, consequently, to limit frequency variations within the allowed range. Considering the same objective, this paper presents an EVPC scheme as an energy management strategy in order to manage the participation of EVs in charging/discharging process with considering the intermittent behavior of renewable resources. Figure 2 shows the algorithm of an EVPC scheme for optimal scheduling of the MG, and it includes three stages. In the first stage, the difference between day-ahead load and the forecasted power of renewable resources would be calculated to obtain stability margin index and the electricity cost signal that are utilized for managing the power of EVs. This stage includes the following parts:

Figure 2.
Algorithm of the electric vehicle power controller (EVPC) scheme for optimal scheduling of the microgrid (MG).
- Forecasted load and output powers of RESs (wind and solar); it is assumed that the day-ahead load demand and renewable generations are determined.
- Index calculation part; in this block, SMI is calculated using Labels (1) and (2).
- Price calculation part; the electricity prices are obtained based on SMI index.
In the second stage, an optimal scheduling of the generating units is done to match the demand for the scheduling horizon properly through a unit commitment algorithm and optimal power flow procedure by considering system’s objectives and constraints (technical and security).
In the third stage, the MG emergency operation is determined and the frequency behavior is evaluated. Since, the MG is operating in islanded mode, the power unbalance () will result from the changes in loads or generation. The emergency active power of unit i at the certain time t (), is defined as:
where is the reserve capacity of unit i at time period t, and is the total available generation reserve at time period t.
The demand load, EV power and the generation emergency dispatch are applied as inputs to the MG dynamic model, in order to evaluate the energy balance within the MG for a given period and the expected frequency deviation in the event of a disturbance. Based on the dynamic model results, if the MG does not have enough reserve capacity, it is necessary to exploit emergency load curtailment (LC). Moreover, DL is applied when RESs’ generated power is high and a portion of it is not consumed.
2.3. Coordination of EVs Operation with EVPC
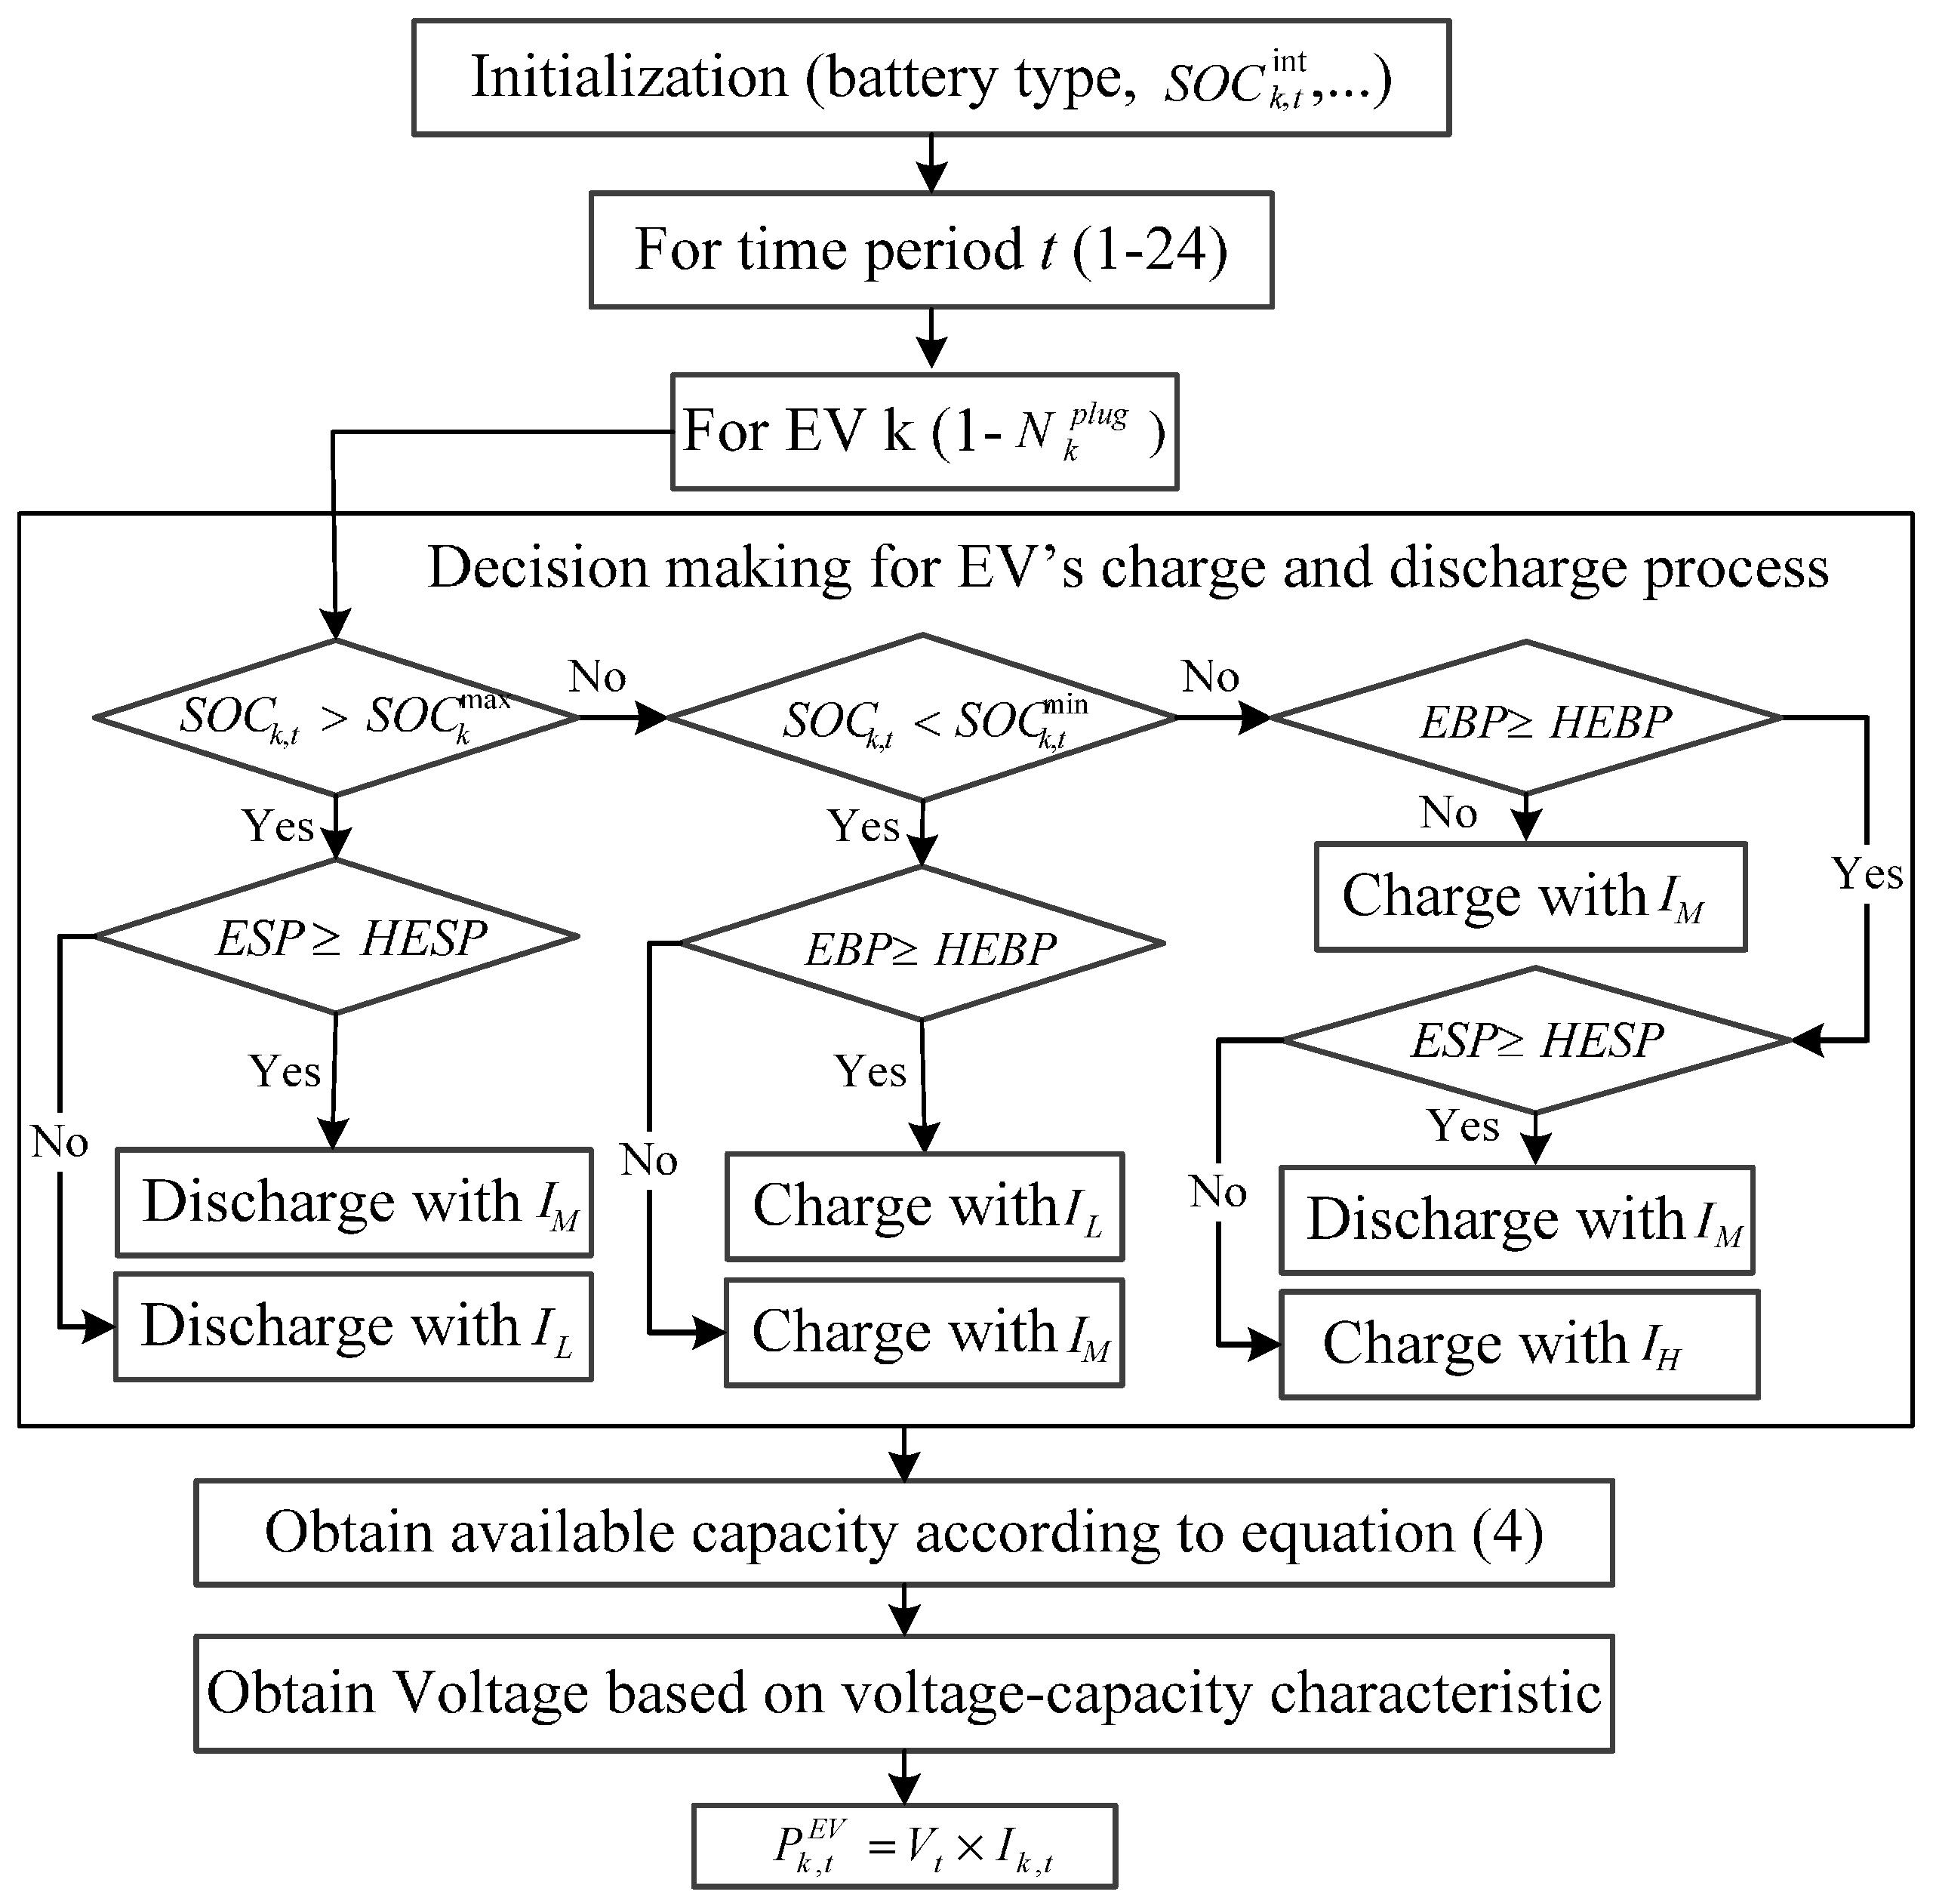
Different types of charge and discharge of EVs are considered based on electricity cost signal and their SOC when plugged in: charging with high current (), charging/discharging with medium current () and low current (). The flowchart of delivered power of EV k is depicted in Figure 3. The transacted power of each EV would be obtained based on its initial conditions such as SOC and the calculated EBP and ESP based on SMI index. The relationship between SOC of EV k and the charge/discharge current is obtained from (4) [9]:
where , and are the current, plugged-in time (in seconds) and the available capacity of the battery. Since most EV companies use lead acid batteries for their vehicles, here, this kind of technology is also adopted. The voltage against released capacity at different discharge/charge currents for a lead-acid battery is extracted from [20].

Figure 3.
Flowchart of delivered power of electric vehicle (EV) k.
In addition, in idle or driving mode, there is no power transaction between EV and the MG, but the stored energy might decrease depending on the length of its daily travel () and its energy consumption per km (). Each EV comes back to the parking lot after driving km and its SOC at the entrance of parking lot () is obtained as following:
where is the SOC at the start of a day trip.
The value of EV SOC at time t is obtained with respect to the amount of its initial SOC, charge/discharge energy (when it is connected to the grid) and the energy decreased due to its travelling. On the other hand, SMI index at time t would be calculated from the previously-mentioned equations. With considering both SOC and SMI indexes, the charge/discharge process would be determined. In other words, if EV is connected, the value of current that EV absorbs (injects) from (to) the network would be found. Then, the voltage would be obtained based on the voltage-current characteristic of the battery. Thus, with the obtained voltage and current, the transacted power between EV and the network would be captured. This process repeats at each time t.
3. Problem Formulation
In order to investigate techno-economic valuation and optimization of the proposed strategy in the MG, a multi-objective optimization problem is formulated with several objectives.
3.1. Objective Function
In the proposed multi-objective problem, three objectives are considered as the MG operator’s profit () maximization, and minimization of the total emission () as well as the cost corresponding to frequency deviation of the MG (). The total MG operator’s profit is formulated as:
The first line of Label (6) represents the MG operator’s revenue from selling energy to the consumers. The second line stands for the fuel cost of generation units and the start-up/shut-down costs. The third line denotes the costs associated with energy provided from the wind turbine (WT) and photovoltaic (PV) units. Here, it is assumed that the MG operator is not the owner of the renewable resources and is only responsible for the scheduling of the renewable units in the MG, so he should pay for energy provided by WT and PV. Finally, the last line expresses the costs associated with charge and discharge of EVs.
The second objective is to minimize the MG pollutants’ emissions generated by DG units that consist of CO2, NOx and SO2:
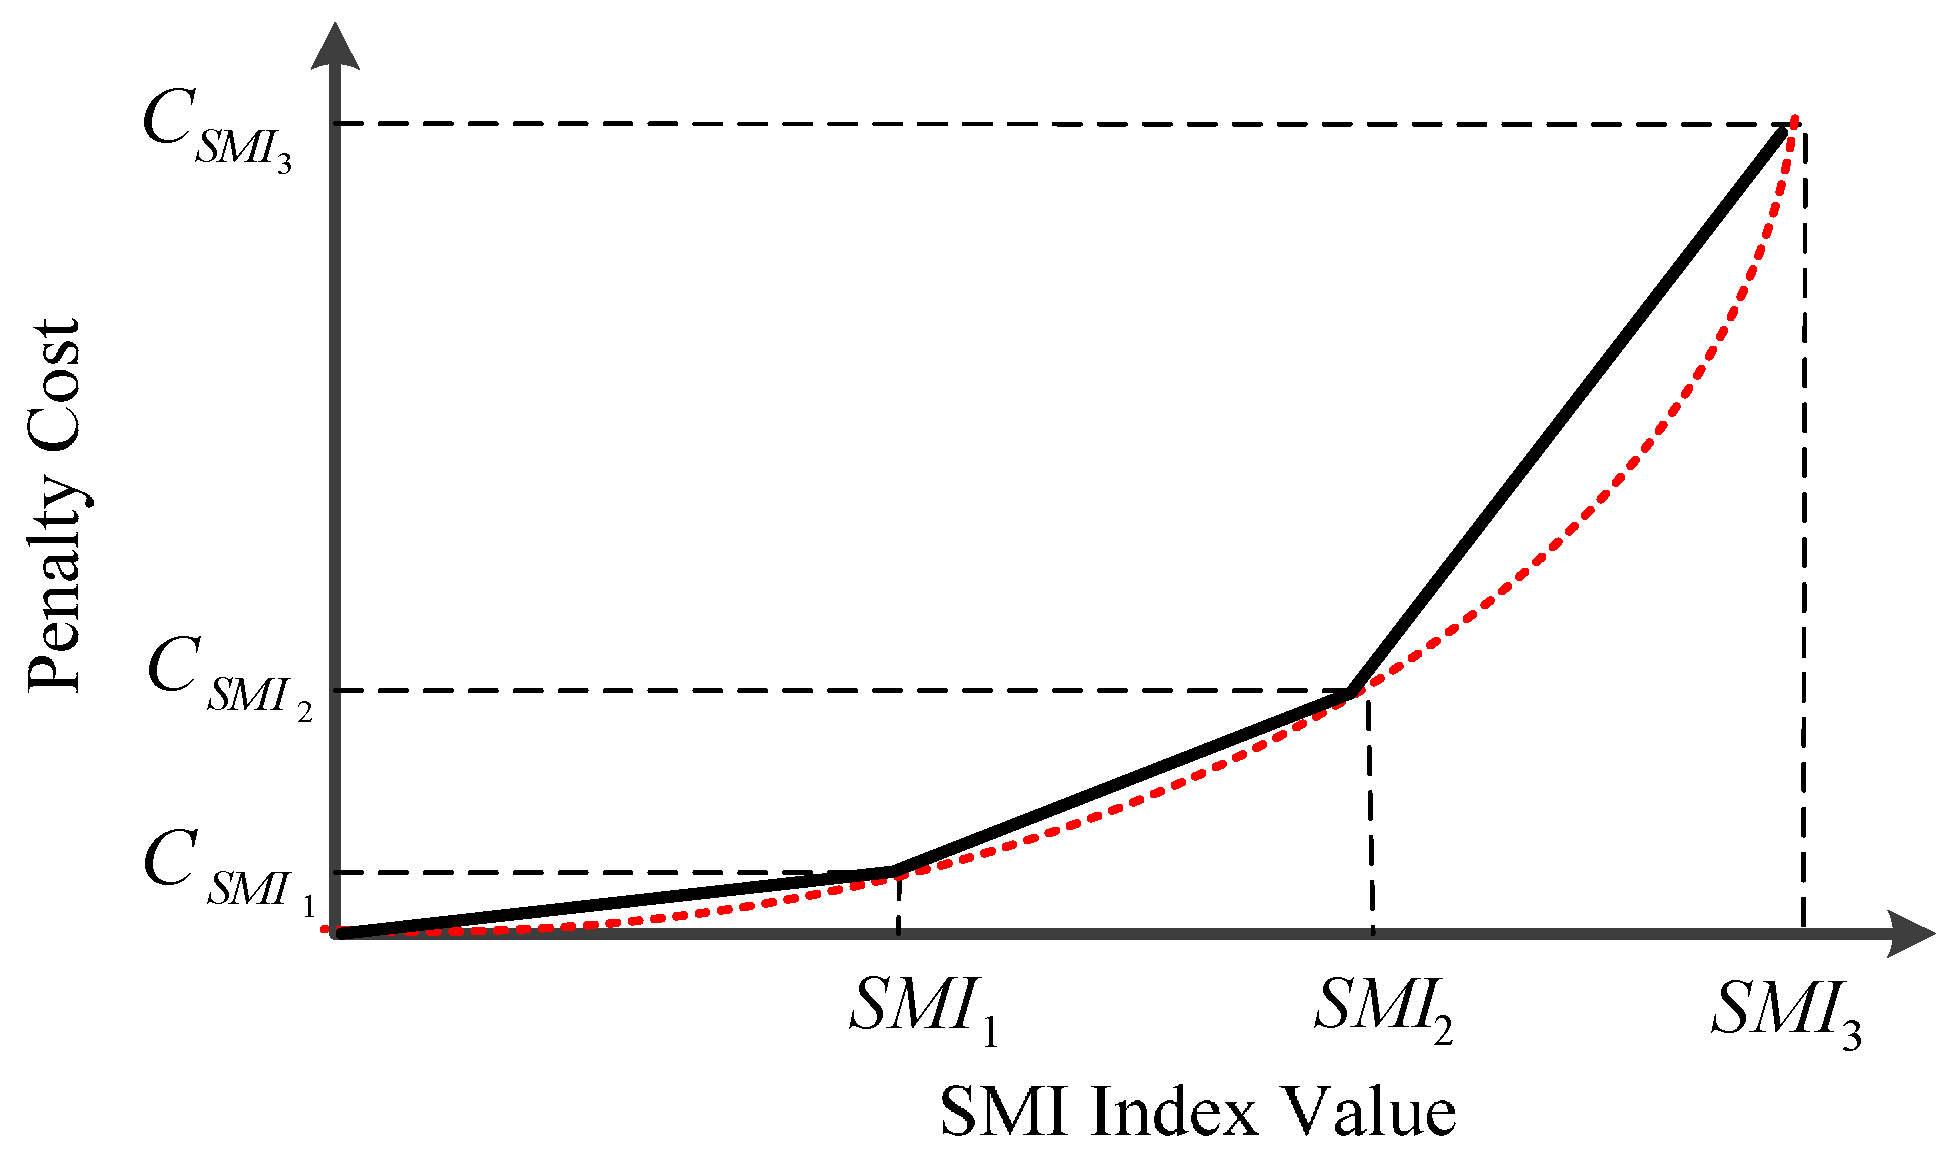
The cost corresponding to MG frequency deviation should be minimized during scheduling horizon, which can be considered as a quadratic function of SMI as shown in Figure 4.
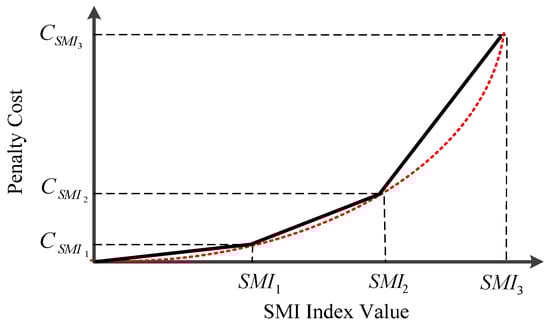
Figure 4.
Piecewise linear cost curve of frequency deviation for an hour.
The piecewise linear model for one period is represented as the following:
where vm,t is the slope of segment m in linearized total penalty cost and NS(i) is the number of segments. In addition, ut is a binary variable, equal to 0 if SMI has its expected limitation value (system stability is not at risk); otherwise, it is 1.
3.2. Mixed-Objective Function
Considering the above-mentioned objectives, the mixed-objective optimization problem can be developed as follows:
where , and are weighting factors of the objective functions , and , respectively, and is the emission penalty factor in terms of £/kg. In the proposed weighted-sum model, the weighting factors can be set based on a multiple-criteria decision analysis (MCDA) done by the MG operator.
3.3. Constraints
The mentioned optimization problem is solved subject to the constraints as follows:
- Demand–supply balance equation: the balance between the total active power production and consumption in both grid-connected and isolated modes of MG is presented as:The left-side of Label (11) corresponds to the total available power in the MG at time period t including the expected WT and PV generation, the scheduled discharged power from EVs, the power of DG units and the exchanged power with the utility. In addition, the right side of Label (11) represents the total load and the power fed to the EVs.
- EVs constraints: Equations (12) and (13) define the power bounds for both EVs charging and discharging processes:where and are charging and discharging power of kth EV. In addition, and are maximum charging and discharging power of kth EV, respectively.
- Power generation capacity: Active power output of a generation unit should be bounded within a range as follows:
4. Simulation Results and Discussion
4.1. Case Study
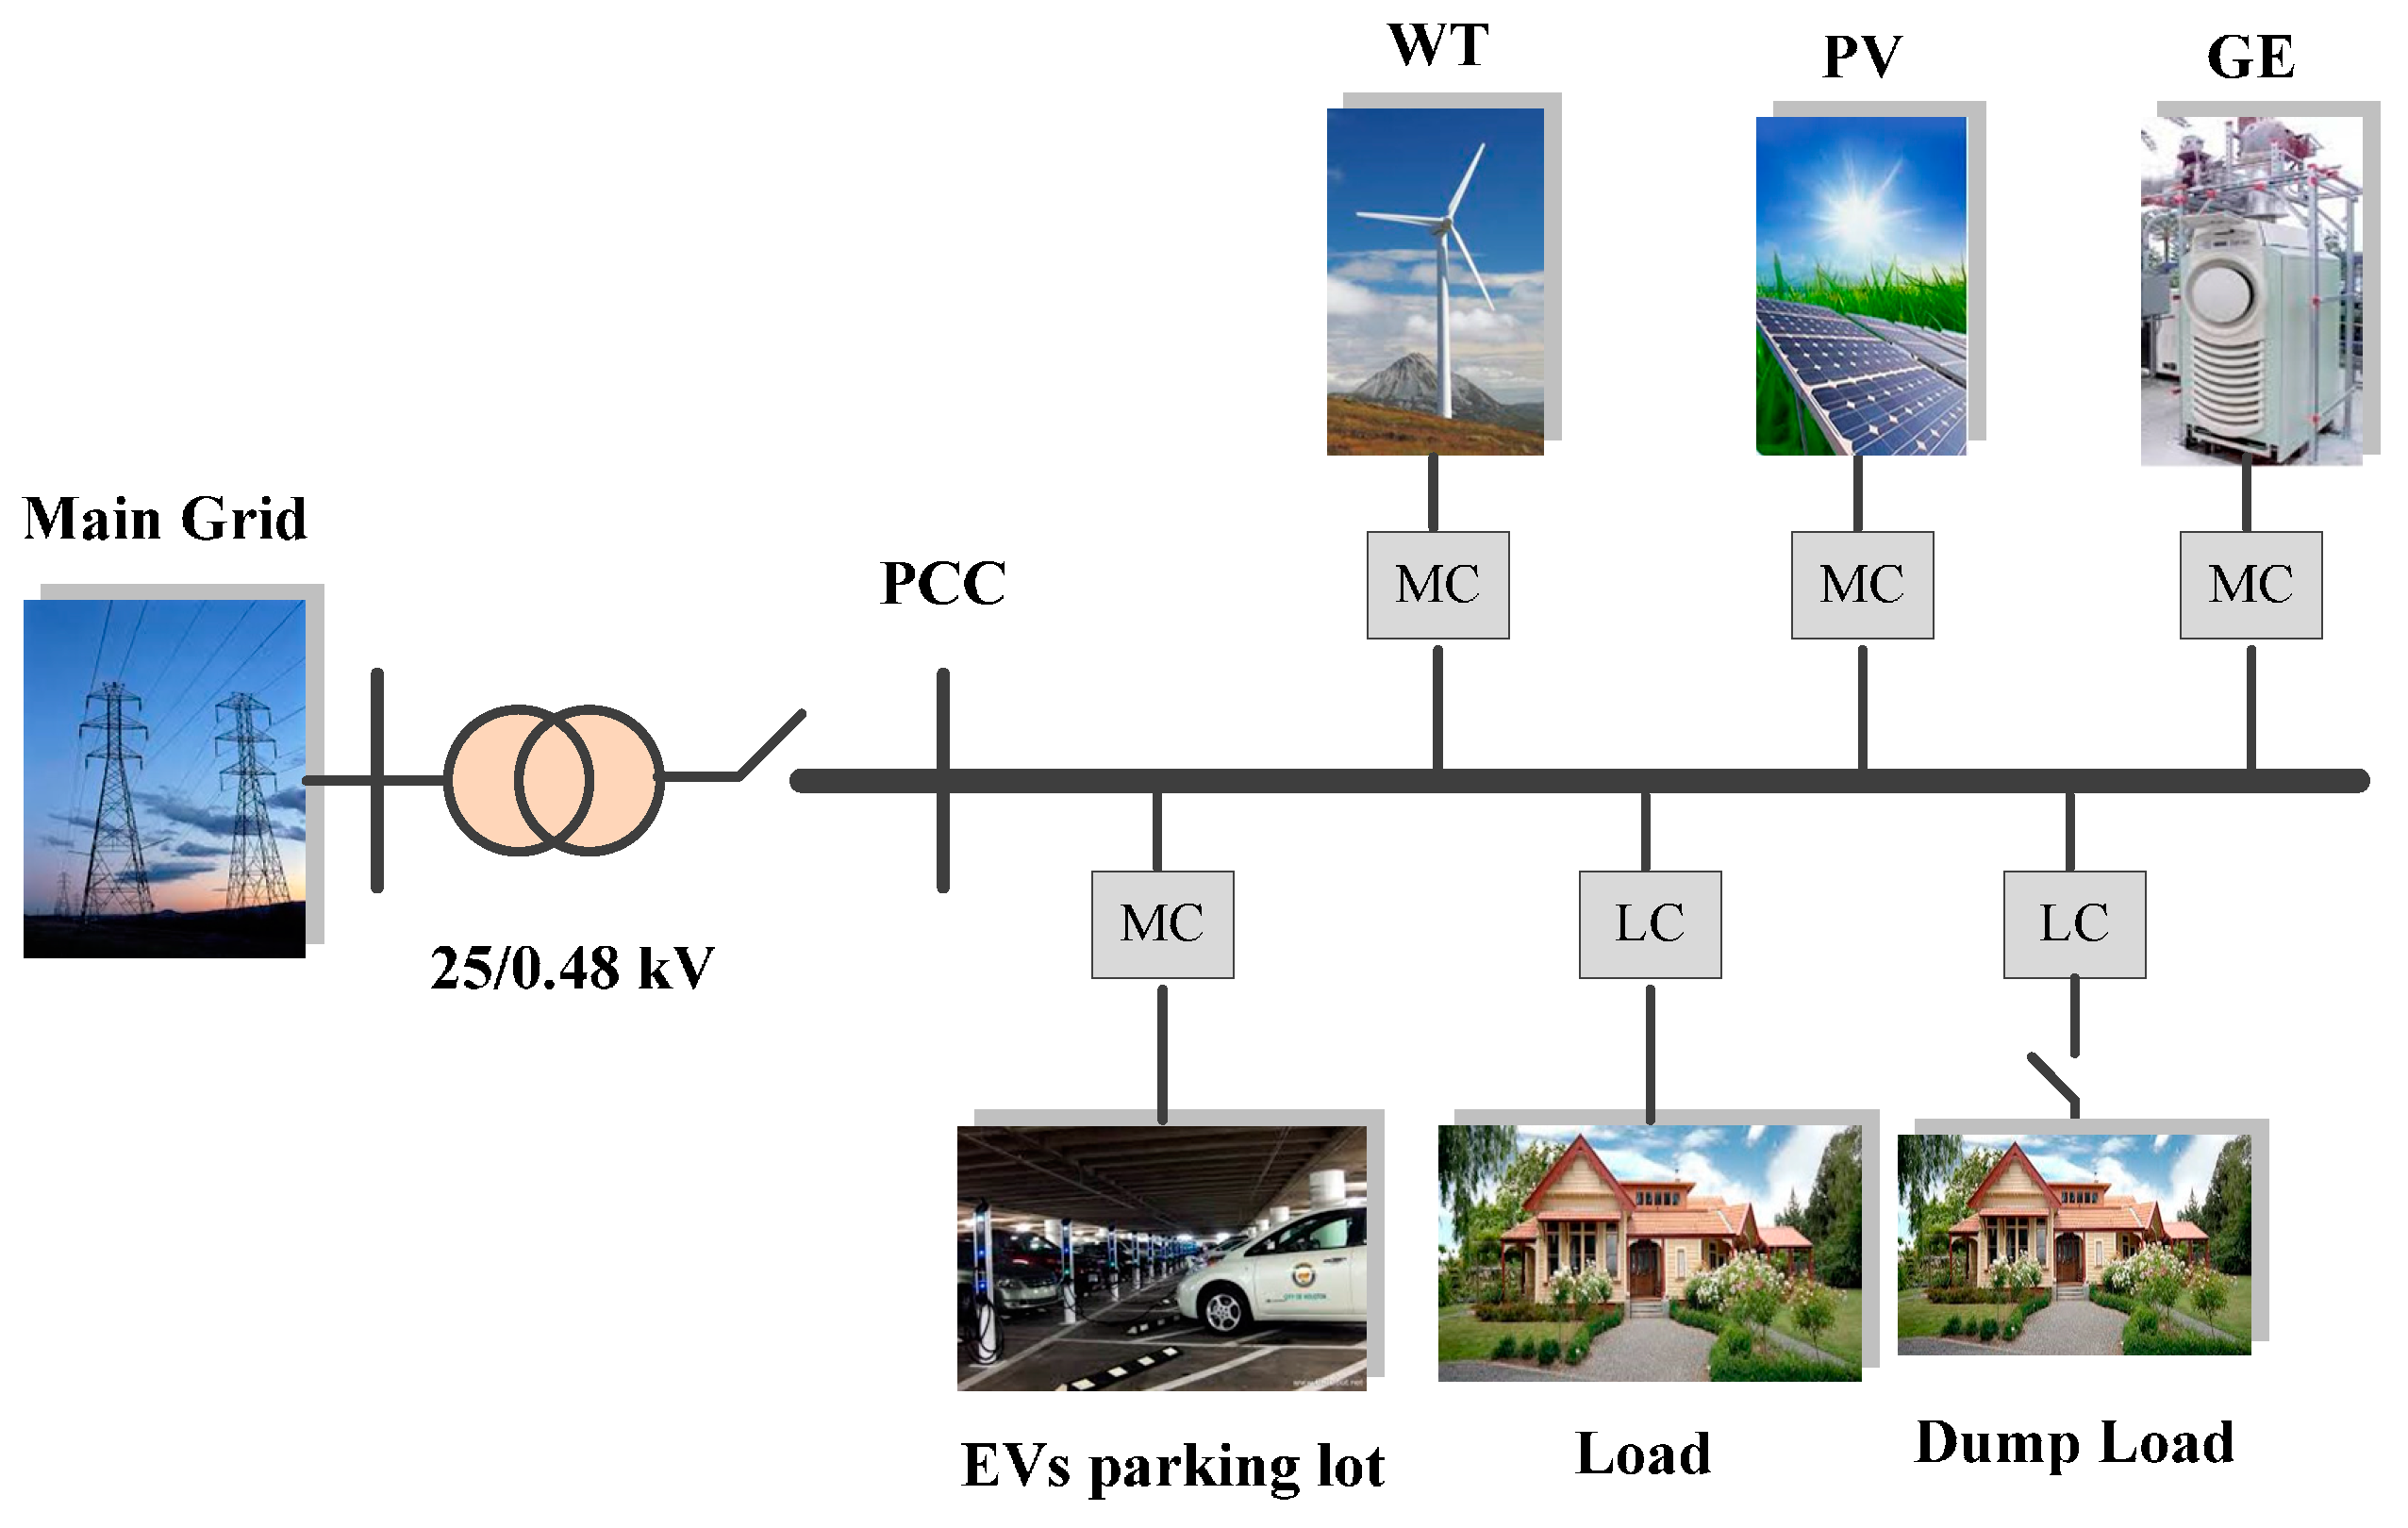
The considered MG test system shown in Figure 5 is used to demonstrate the effectiveness of the proposed strategy. The test system includes a PV plant and a WT unit as renewable resources, a diesel engine as a DG, EVs and loads. Moreover, a dump load bank is considered for dumping the surplus energy produced by the RESs’ units in isolated mode operation. Based on an economical assessment performed by HOMER Pro®, the optimal design of MG’s sources (installation capacities of resources) is obtained for a region in the east of Iran (32.8649° N, 59.2262° E). With respect to this assessment and considering the technical constraints, the installed capacity of PV, WT and DG are calculated as 300 kW, 375 kVA and 300 kVA, respectively.
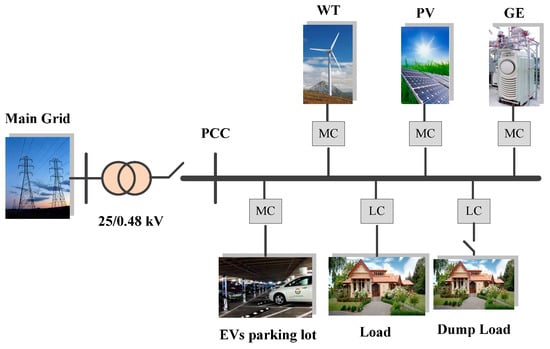
Figure 5.
Single line diagram of the examined MG.
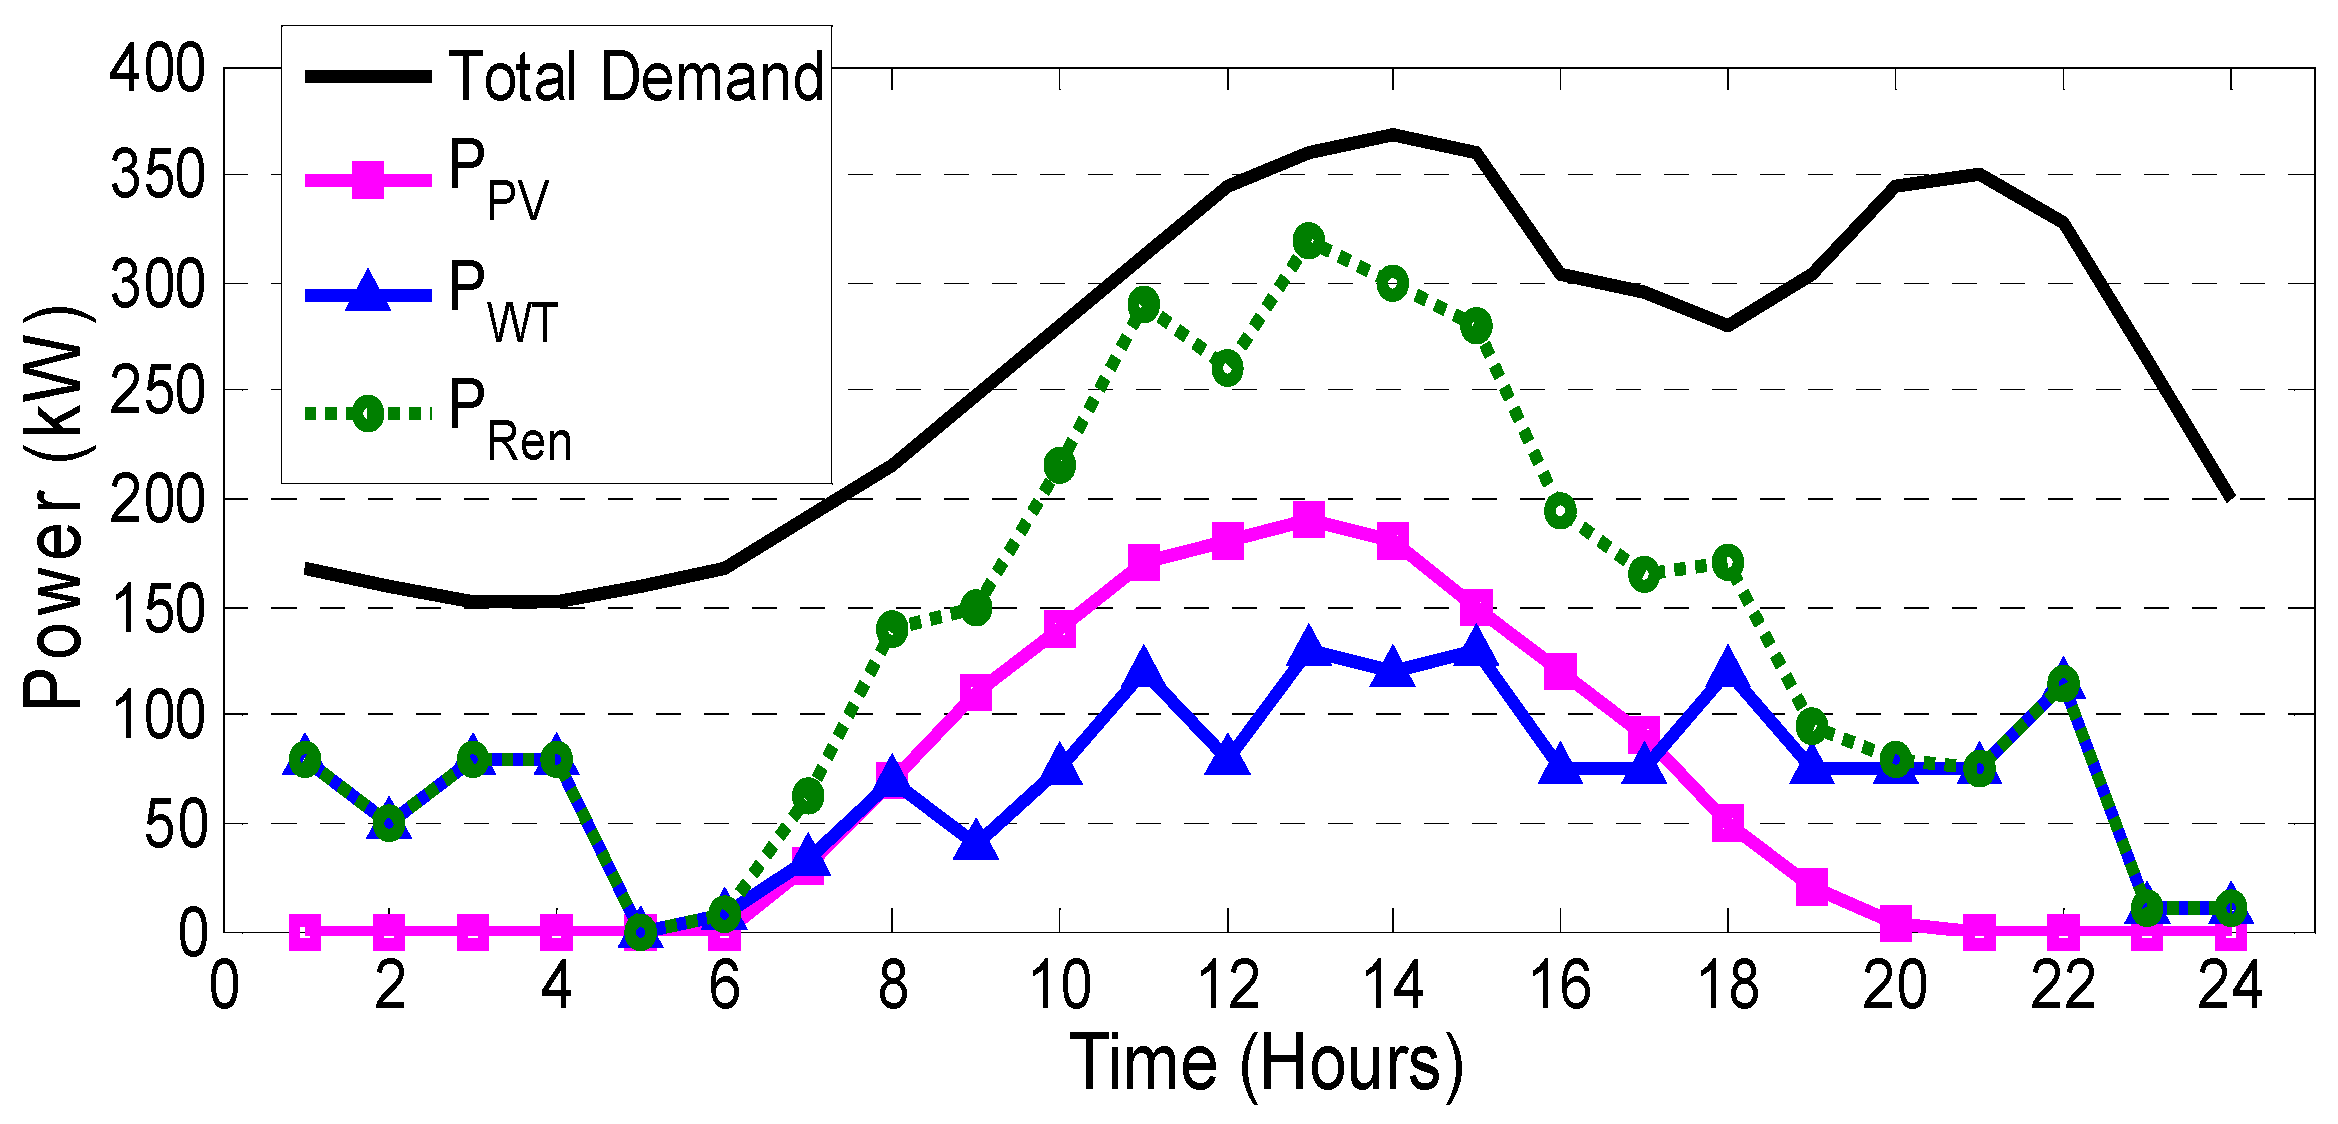
The forecasted load, output power of WT, PV and the summation power of WT and PV () in a typical day are depicted in Figure 6. It is also assumed that there are 100 EVs plugged into two different parking lots (in residential and office buildings) and their arrival times are modeled based on a Gaussian distribution with = 19 and = 10 [21].
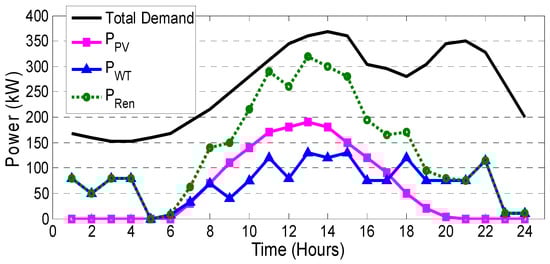
Figure 6.
Forecasted demand and renewable generations in a typical day on an hourly basis.
Here, the minimum and maximum limit of are considered as 40% and 90% of the total battery capacity, respectively [22]. The connected EVs are assumed to be charged at different current ratings (i.e., 2, 10 or 30 Ampere), and to be discharged either with 2 or 10 Ampere [23].
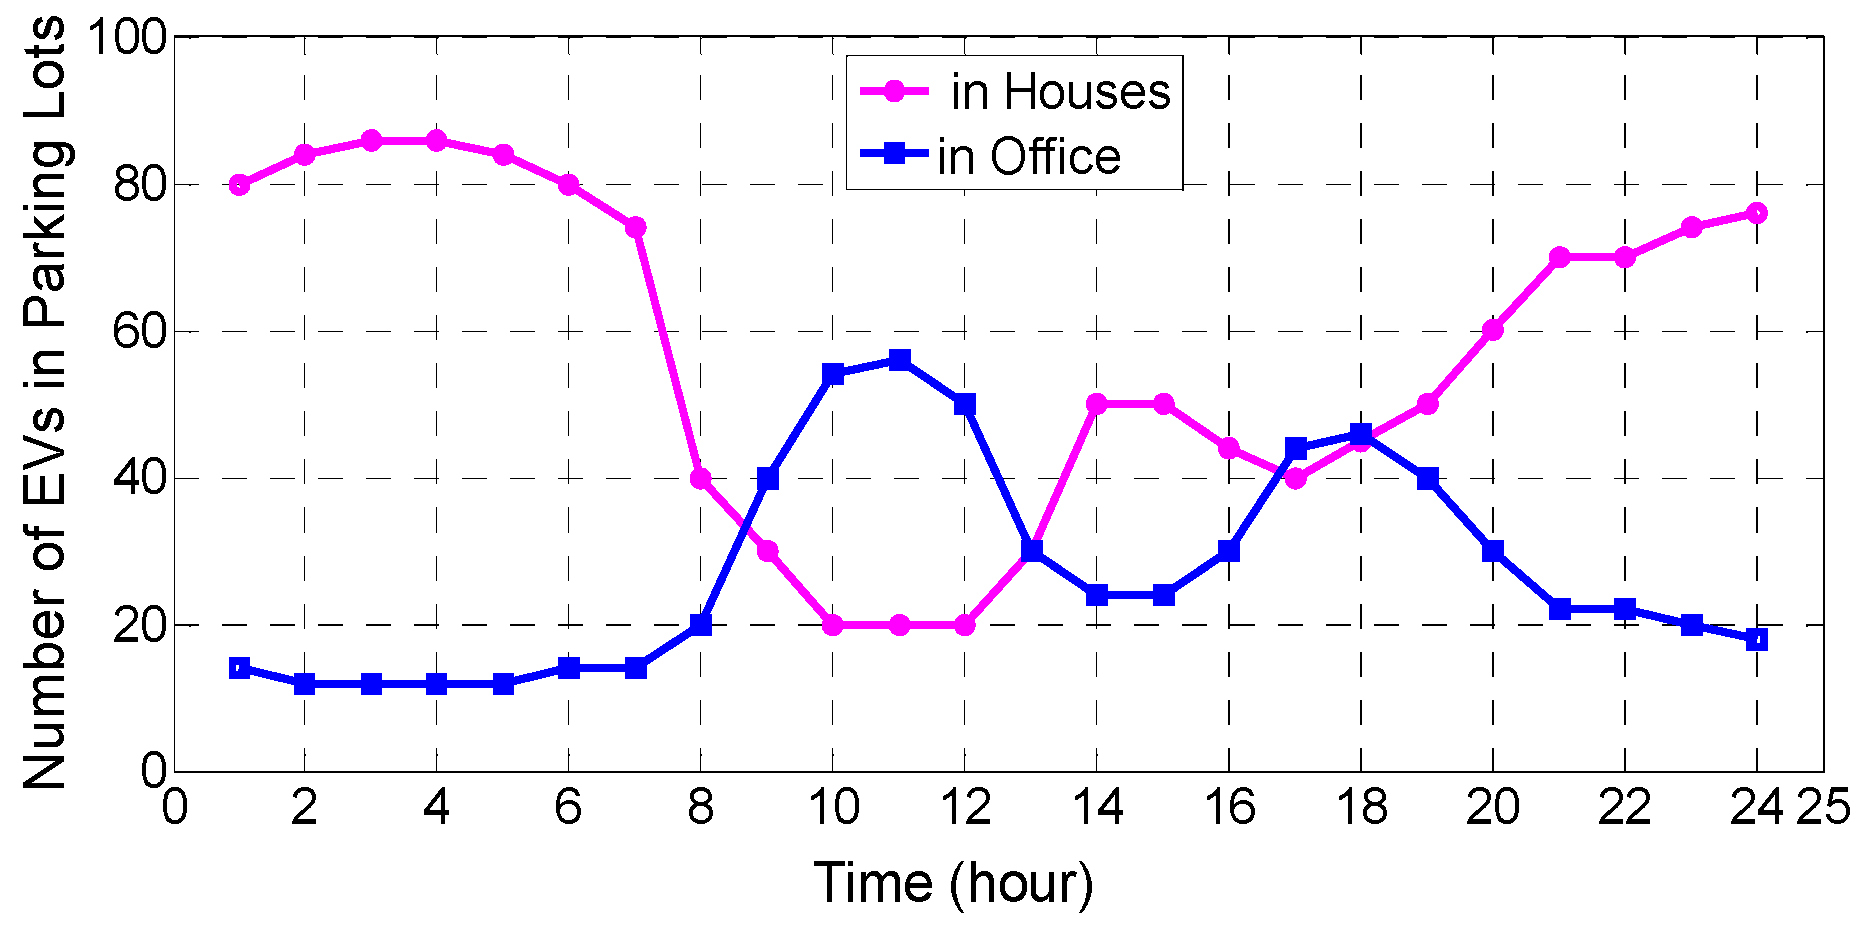
Moreover, it is assumed that the charge/discharge processes in both parking lots is the same and the number of EVs in each parking lot is evaluated based on the available profiles depicted in Figure 7. Due to EVs travelling, the number of EVs in both parking lots is a percentage of the total number of EVs.
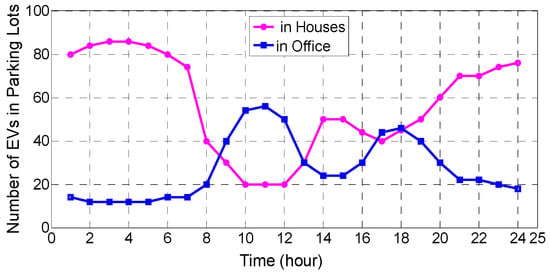
Figure 7.
Number of EVs in the house and office parking lots.
4.2. EVs Charge/Discharge Process with/without EVPC
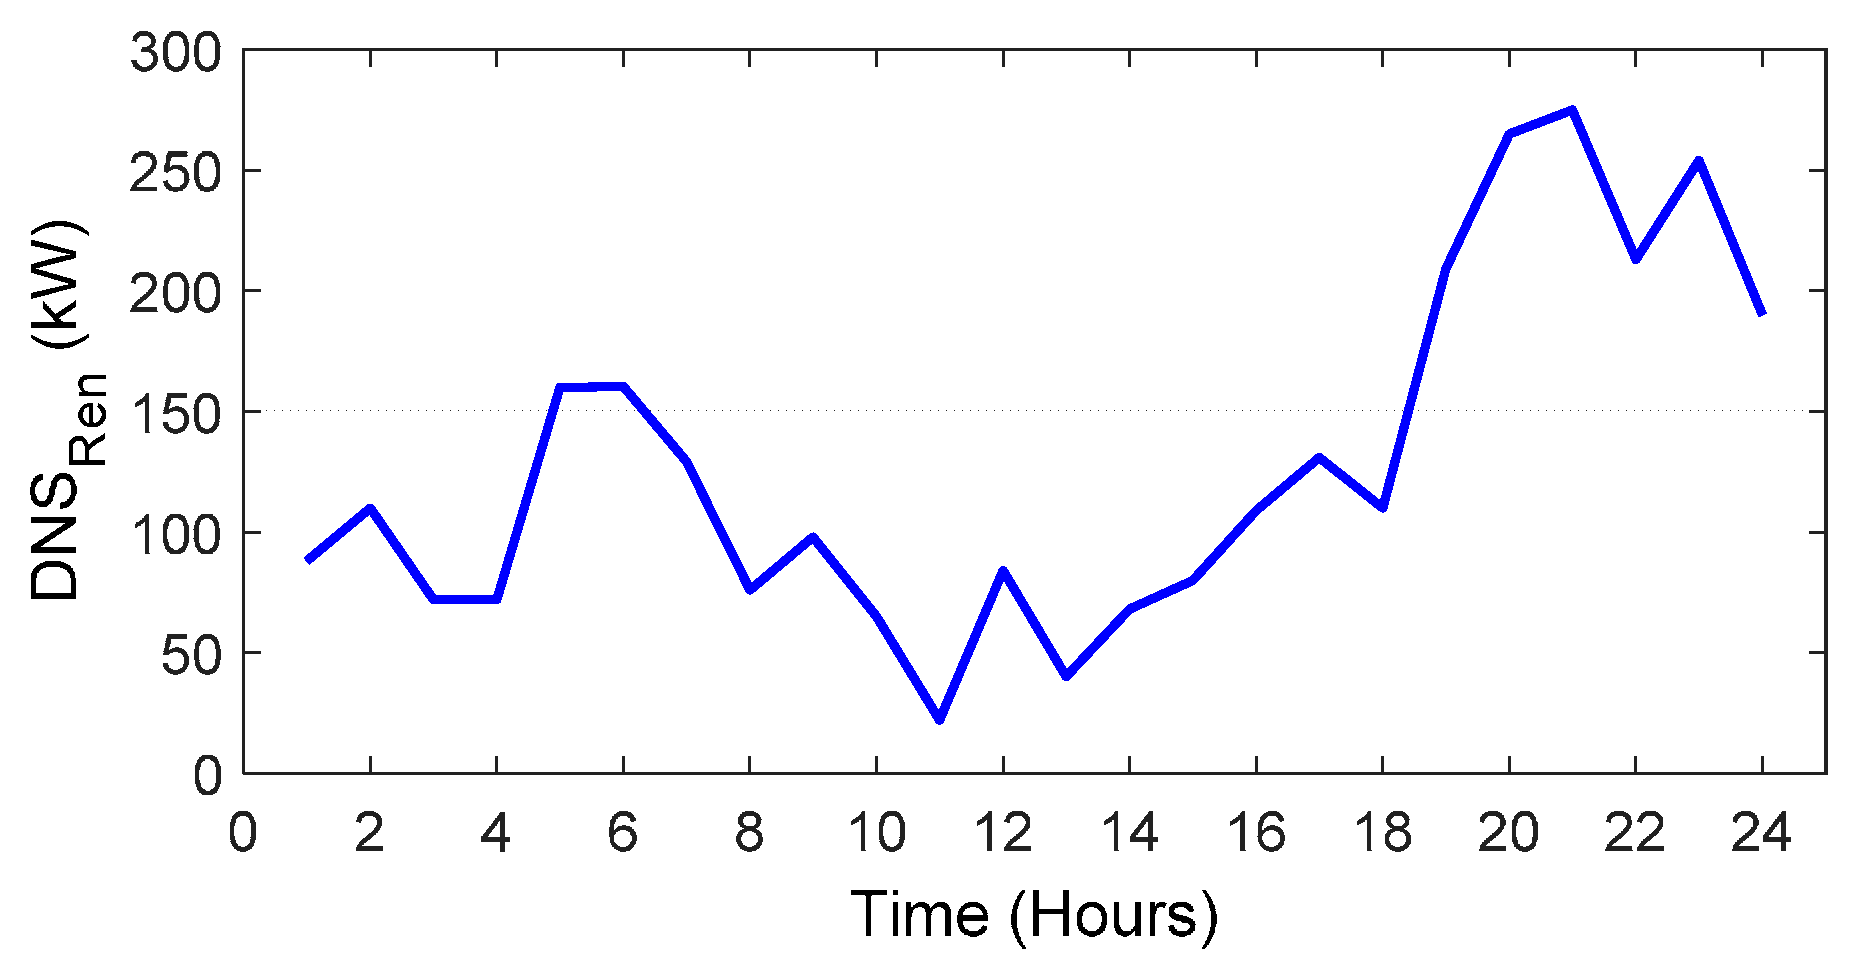
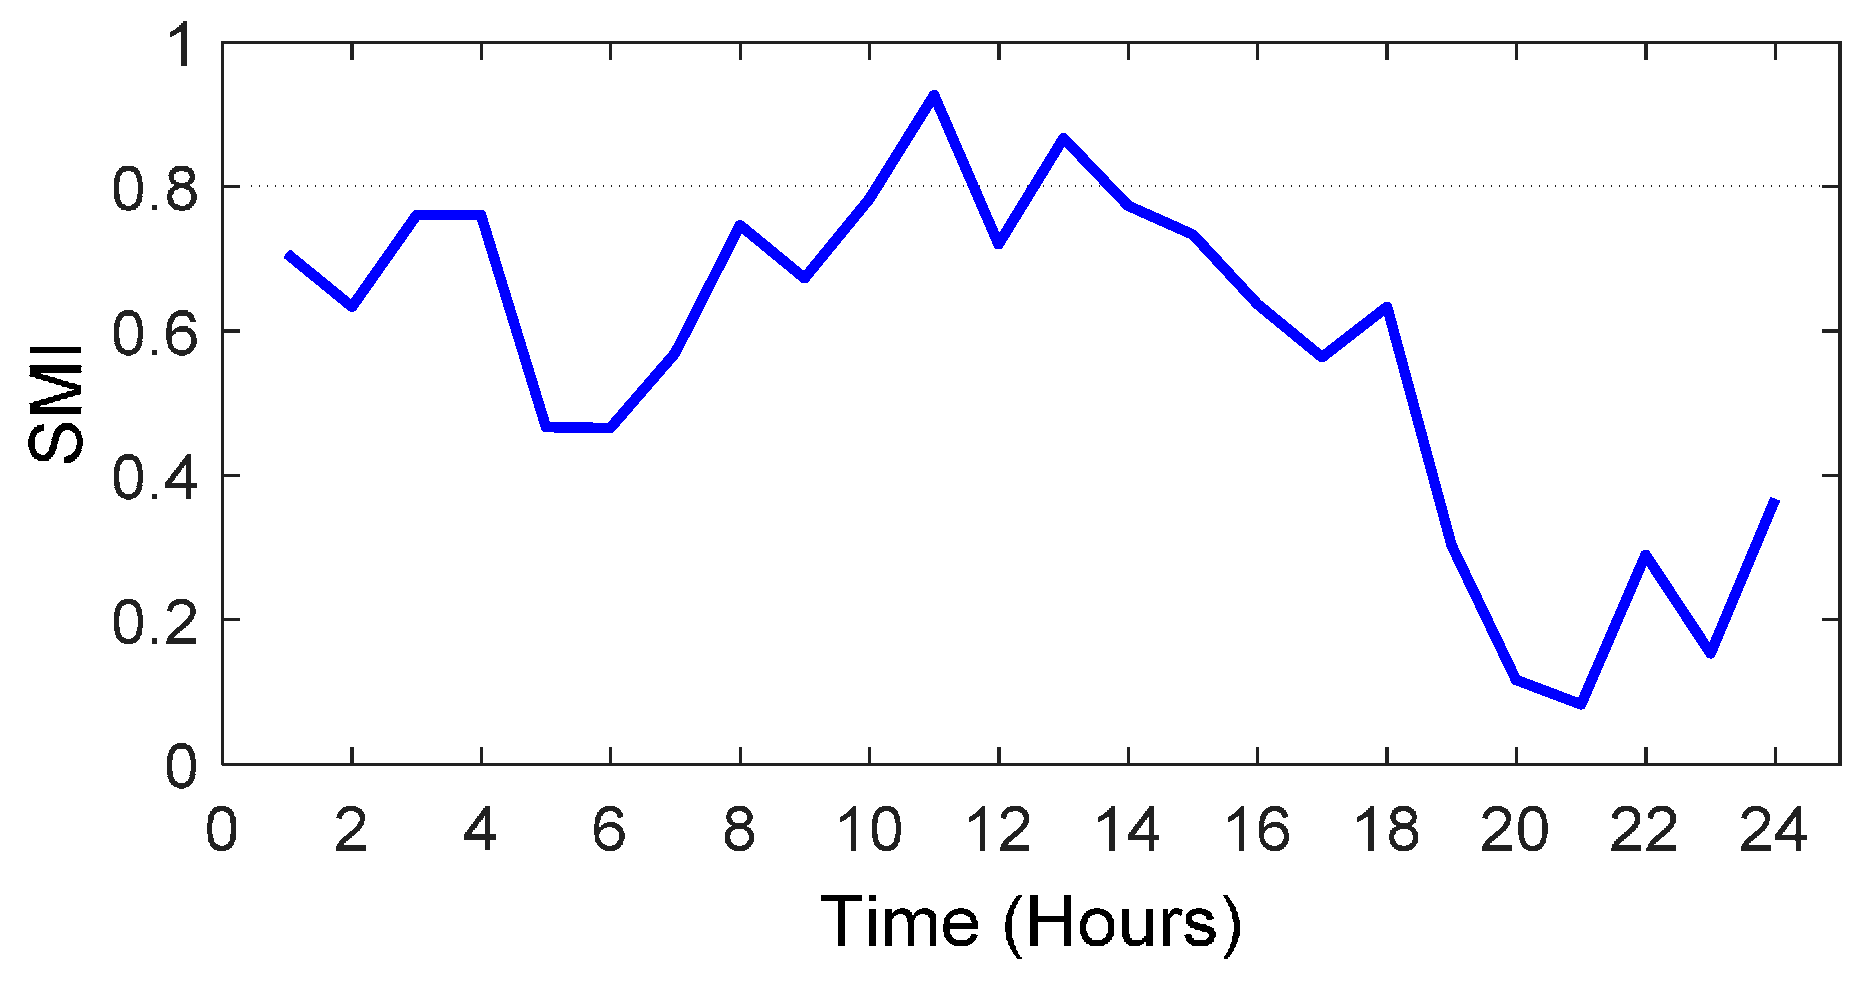
Based on the explanation in Section 2, the and SMI index over the 24-h horizon are achieved in the under study system that are shown in Figure 8 and Figure 9, respectively. To obtain the cost signal based on the SMI index, the minimum and maximum values of SMI correspond with the minimum and maximum values of cost signal in the wholesale market with the application of numerical analysis. The other values of cost signal should remain in this range in such a way to follow the SMI index. It should be noted that this cost signal is applied in the isolated mode by the MG operator, but in the connected mode, the MG operator is a price taker and the cost signal of the wholesale market is used for EV management.
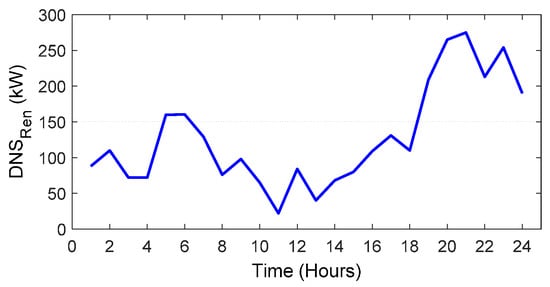
Figure 8.
The demand not supplied by renewable resources () of MG over the 24-h horizon.
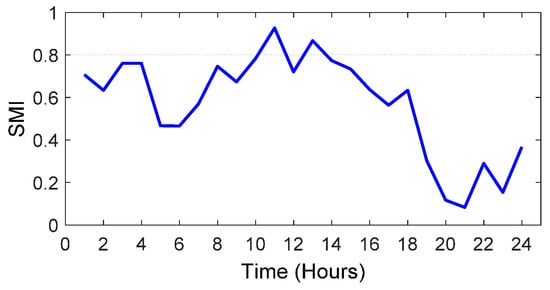
Figure 9.
SMI over the 24-h horizon.
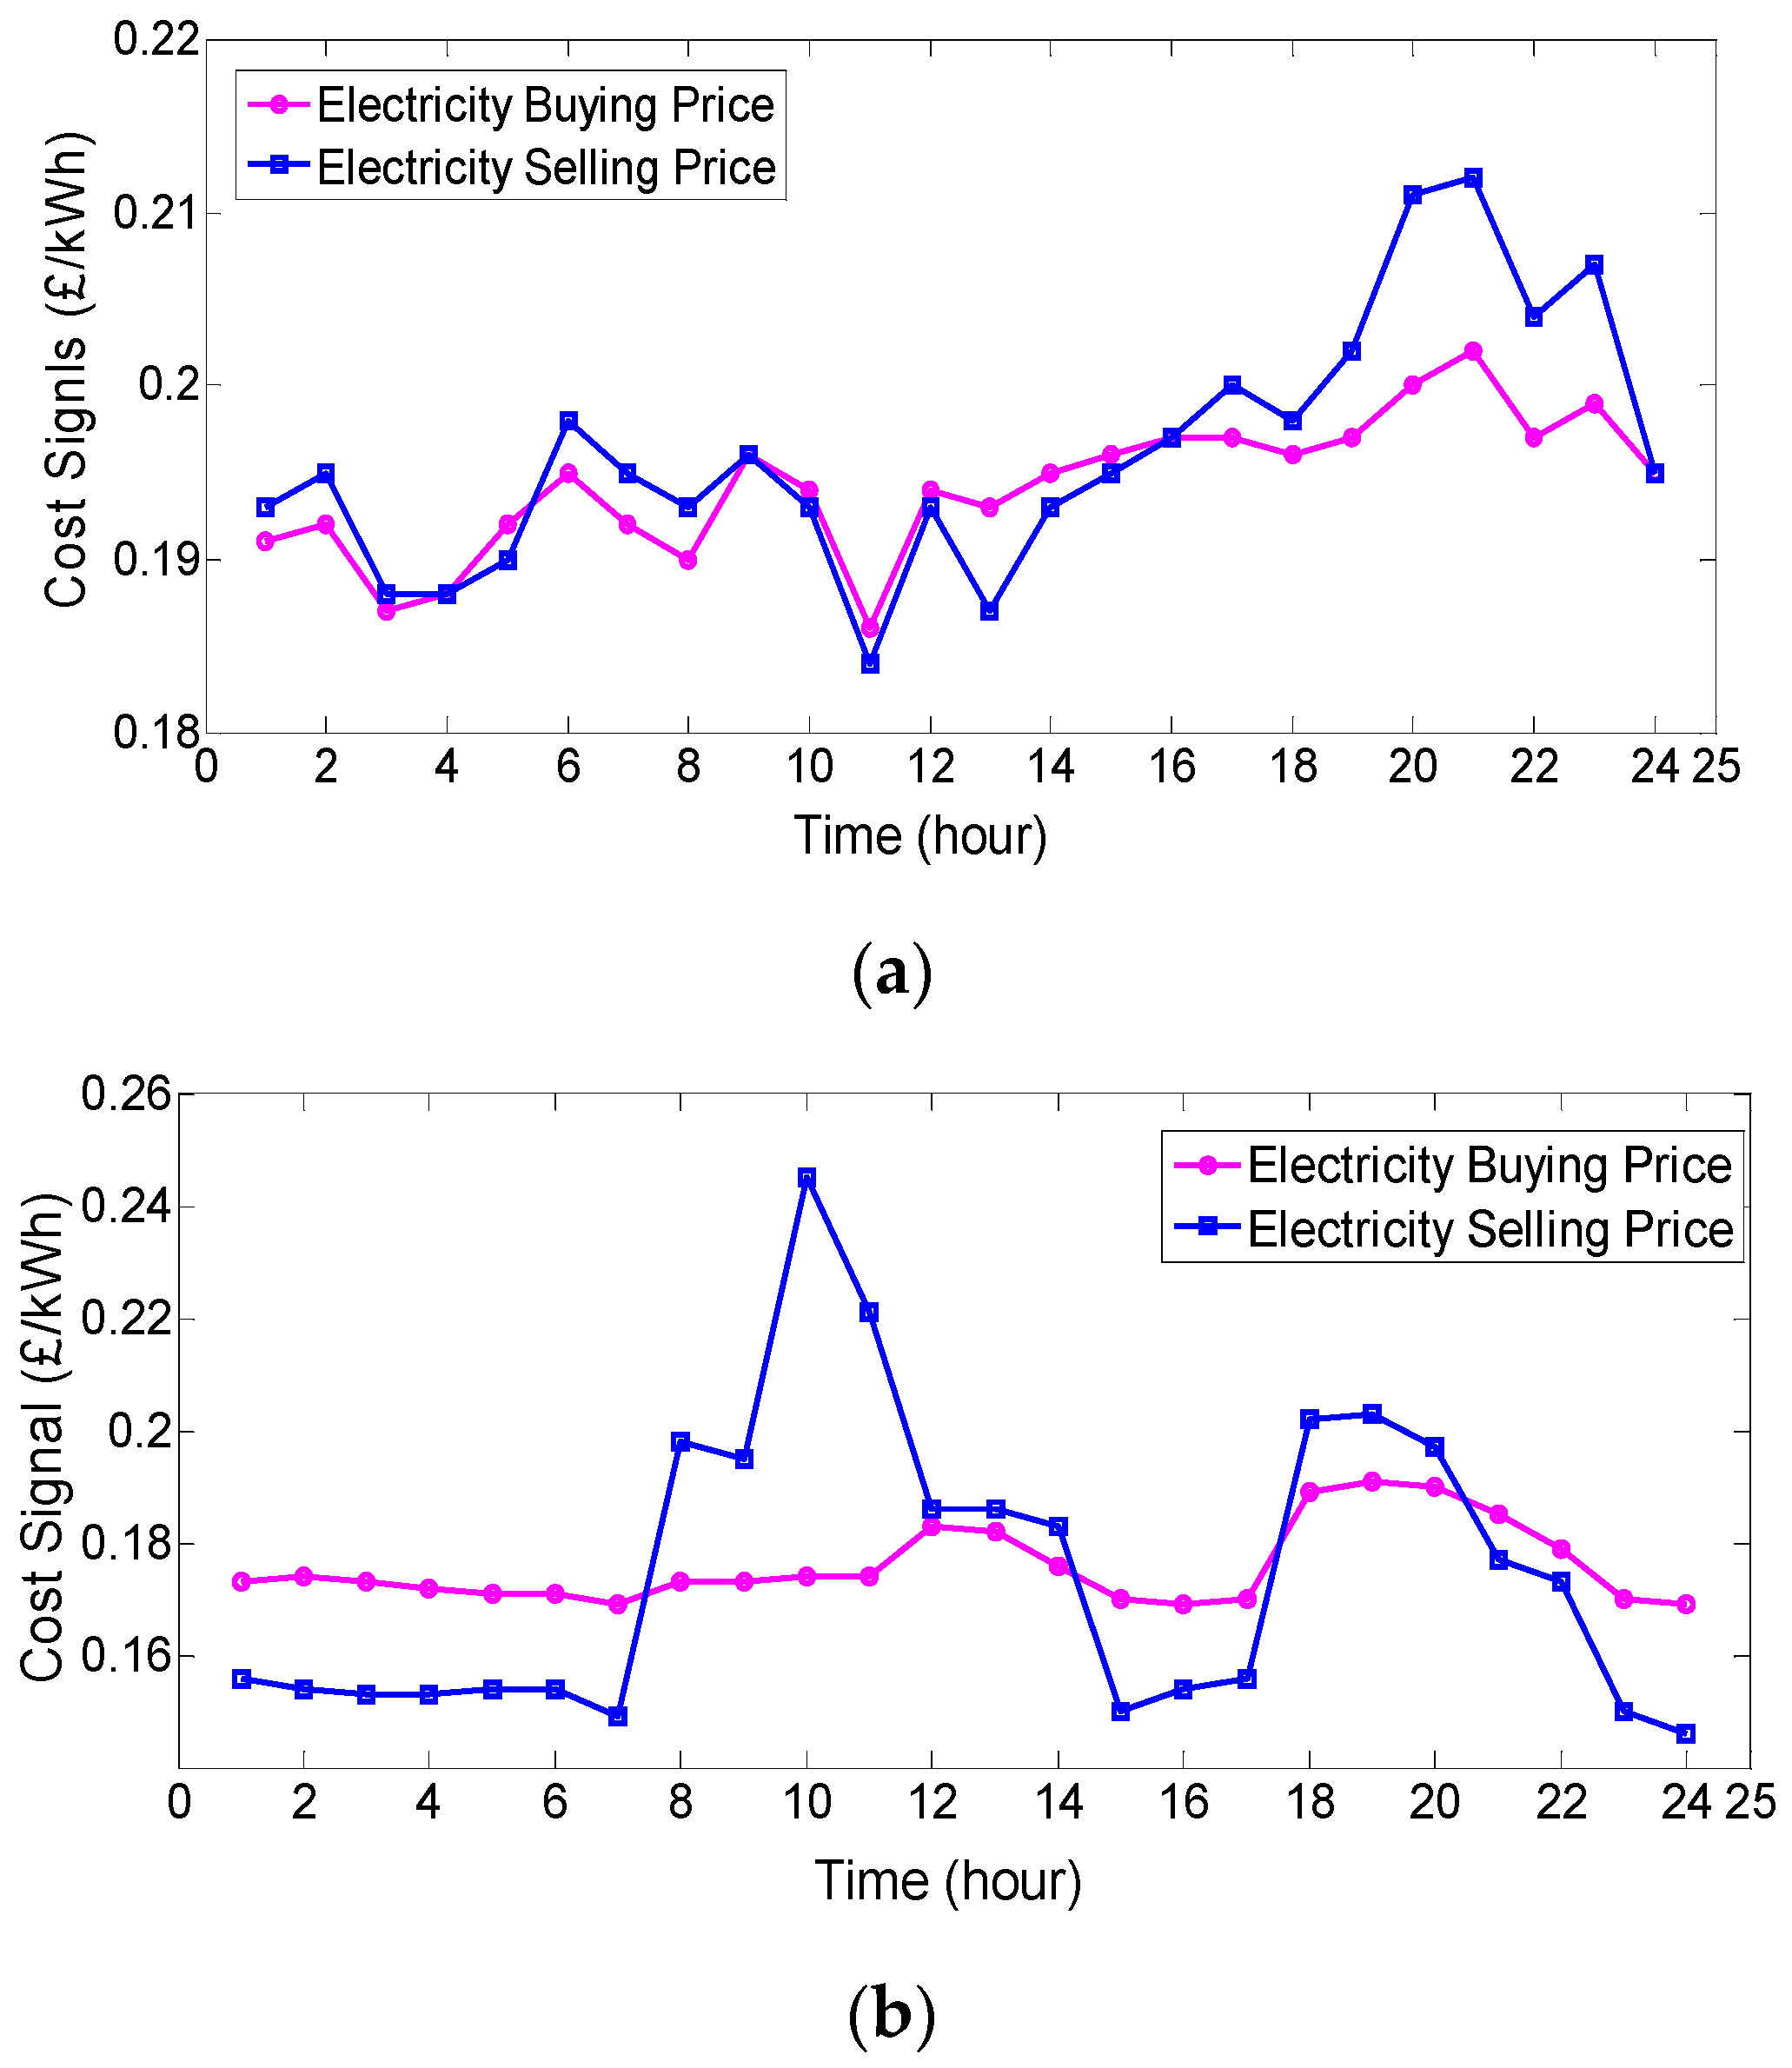
In this case, as shown in Figure 10a, the minimum electricity buying and selling prices are 0.186 and 0.184 (£/kWh), and maximum electricity buying and selling prices are 0.202 and 0.212 (£/kWh), respectively. Figure 10b shows the day-ahead electricity selling and buying prices as adopted from [24]. As can be seen, the minimum electricity buying and selling prices are set to 0.169 and 0.149 (£/kWh), while the maximum electricity buying and selling prices are considered as 0.191 and 0.245 (£/kWh), respectively. This cost signal is used to be compared with the numerical results of the proposed signal. The exchanged power between EVs and the MG with/without EVPC in each time interval is shown in Figure 11 for a typical day.
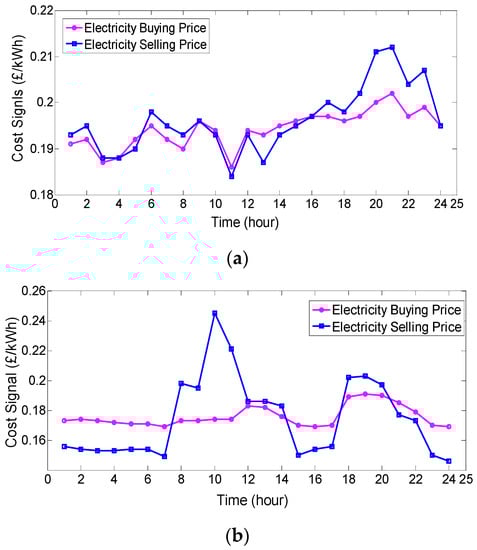
Figure 10.
Electricity buying/selling price (a) based on power mismatch between load and (b) extracted from [23].

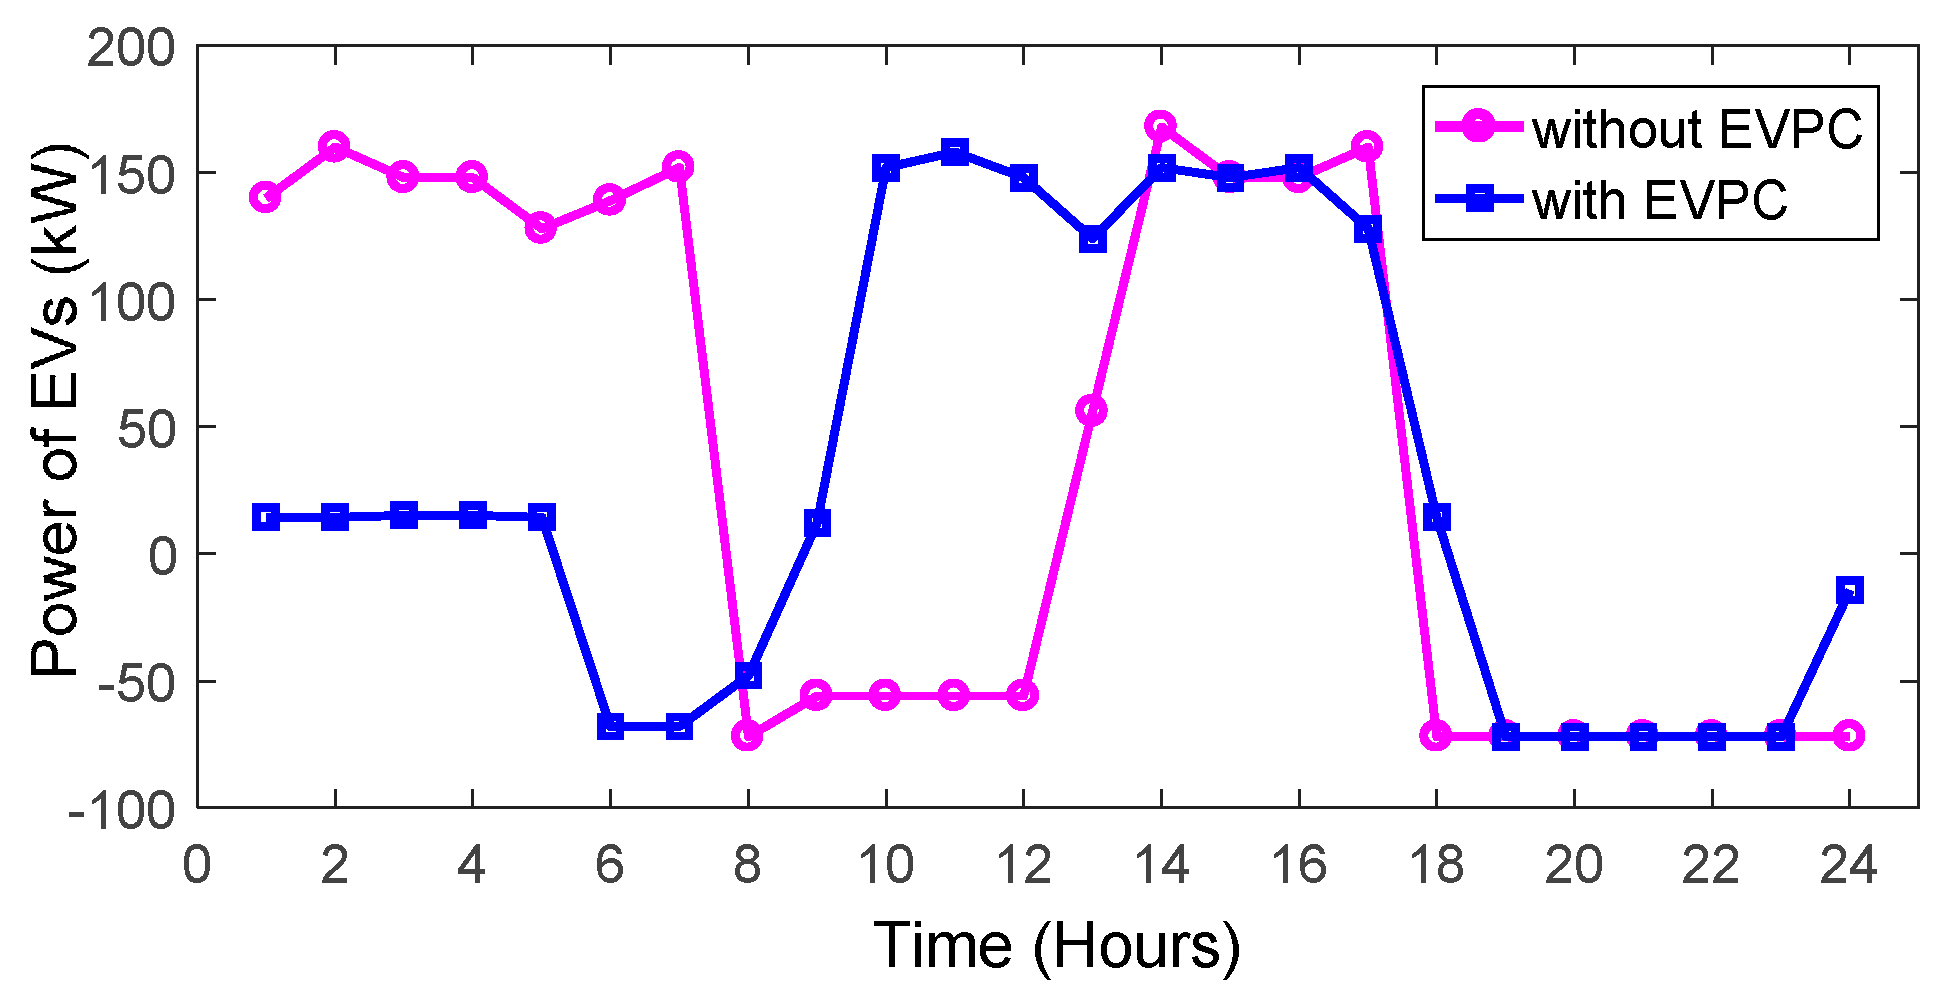
Figure 11.
The exchanged power between EVs and the MG with/without EVPC.
4.3. Frequency Stability Analysis with/without EVPC
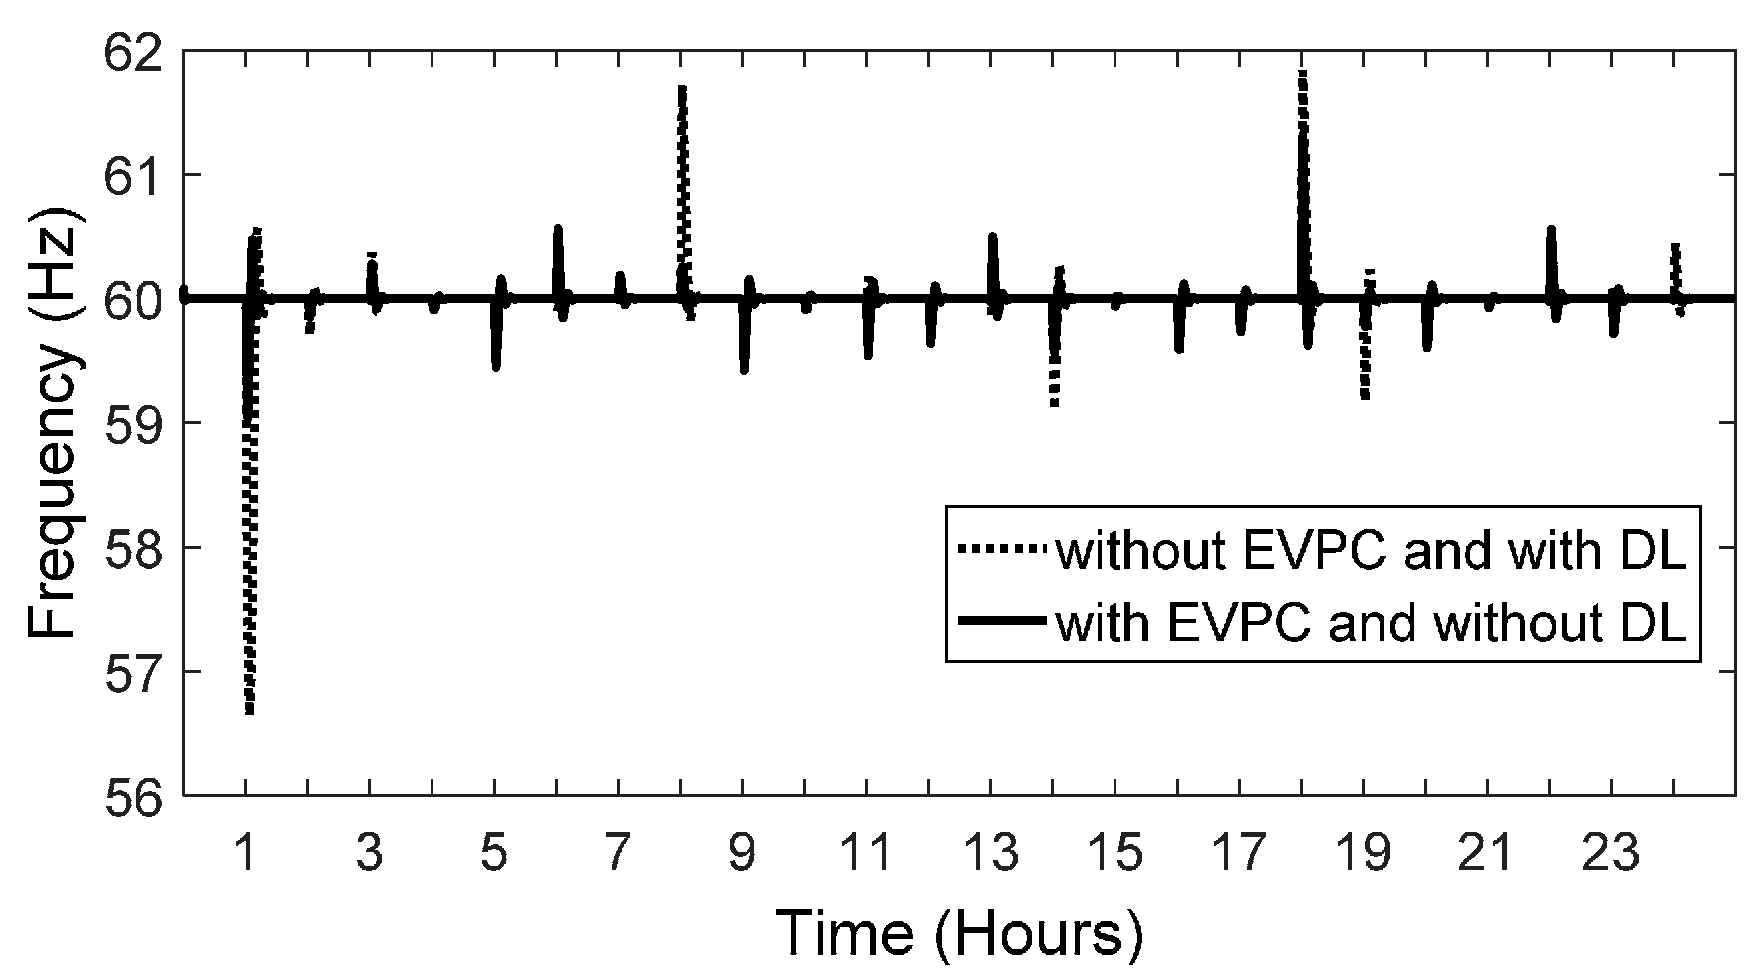
To investigate the effect of EVPC on the MG frequency stability, it is assumed that at time 1:00, the MG switches into isolated mode and remains in this mode during the scheduling horizon. Due to a fault occurrence in the upstream at time 1:00, the MG switches into the isolated mode. In isolated mode, MG frequency response is studied in two cases. In the first case, EVs do not participate in load frequency control, while, in the second one, EVs contribute in the MG frequency regulation. Figure 12 shows the MG frequency variations in two cases.
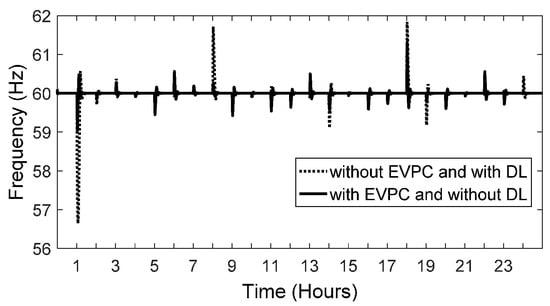
Figure 12.
Frequency variation in two cases over a 24-h horizon.
Comparison of the two cases shows that the application of EVPC results in a lower frequency deviation. As can be seen in the same figure, with EVPC, frequency varies in the range between 59 and 61.4 Hz; however, without it, the frequency drops to less than 57 Hz when the MG enters the isolated mode. As can be observed from Figure 13, the minimum value of SMI occurs at 6:00. It can be shown that, at this time, the system is in the critical condition without the application of EVPC.
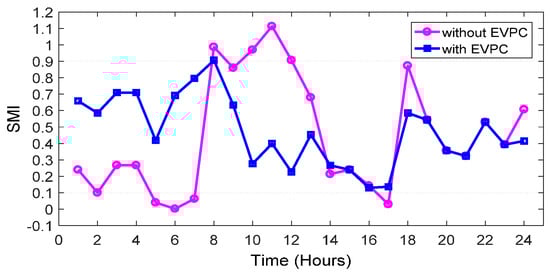
Figure 13.
Variation of SMI with and without EVPC.
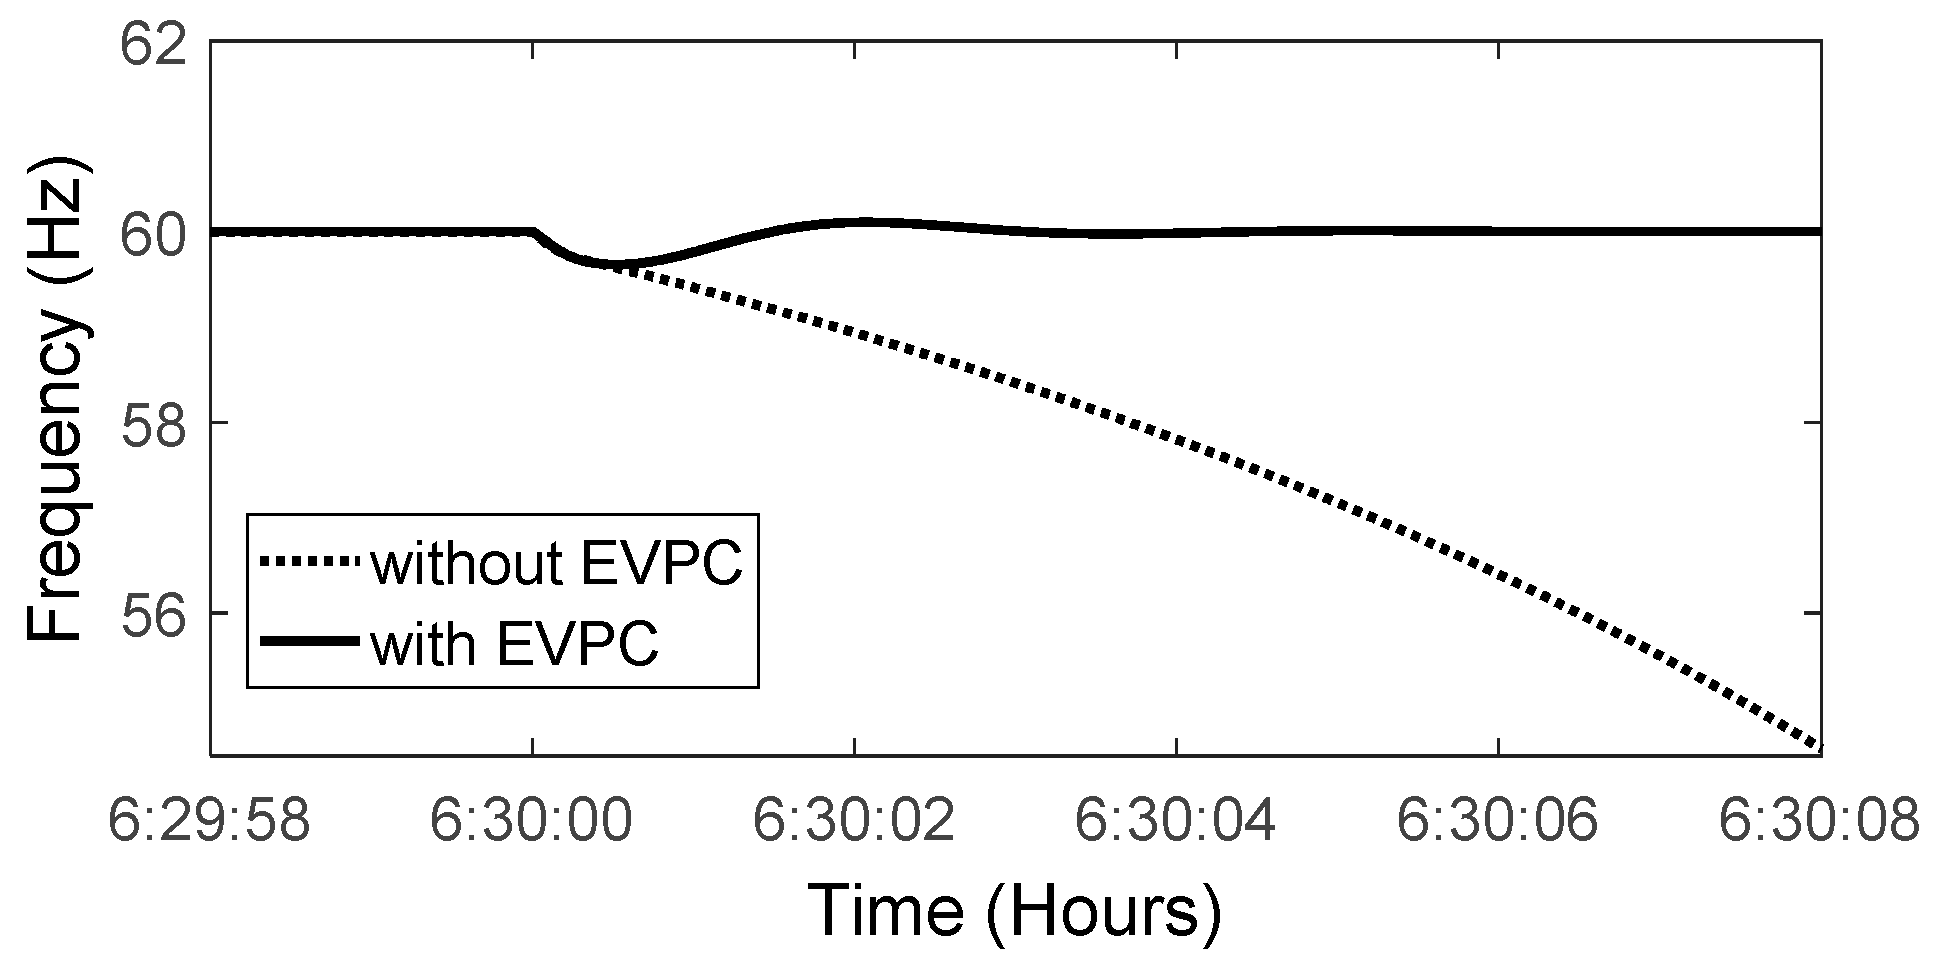
During islanded operation, due to low inertia of MG and intermittent nature of RESs and load, there might be some frequency deviations beyond the acceptable range. As depicted in Figure 14, due to a sudden load change of 20 kW at 6:30, the system frequency becomes unstable without EVPC. At this time, EVs are charged 140 kW without EVPC; however, with the application of that, they are discharged at the rate of 68 kW/h. In fact, when the load demand increases suddenly, the amount of reserve reduces. In this condition, generation of RESs is very low (7 kW) and so EVs’ high charging leads to frequency drop. However, with the application of EVPC, due to a low amount of reserve and the SMI index, EVs assist in the discharge process and the system obtains a proper margin for its reserve and, consequently, frequency remains within its limitation. It should be mentioned that, without EVPC, the frequency instability occurs at 11:00 due to surplus energy produced by RESs.
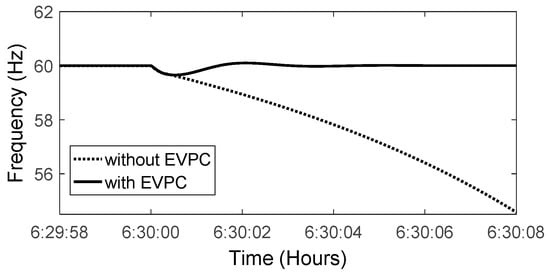
Figure 14.
Frequency variation at 6:00 (SMI is in its lowest value).
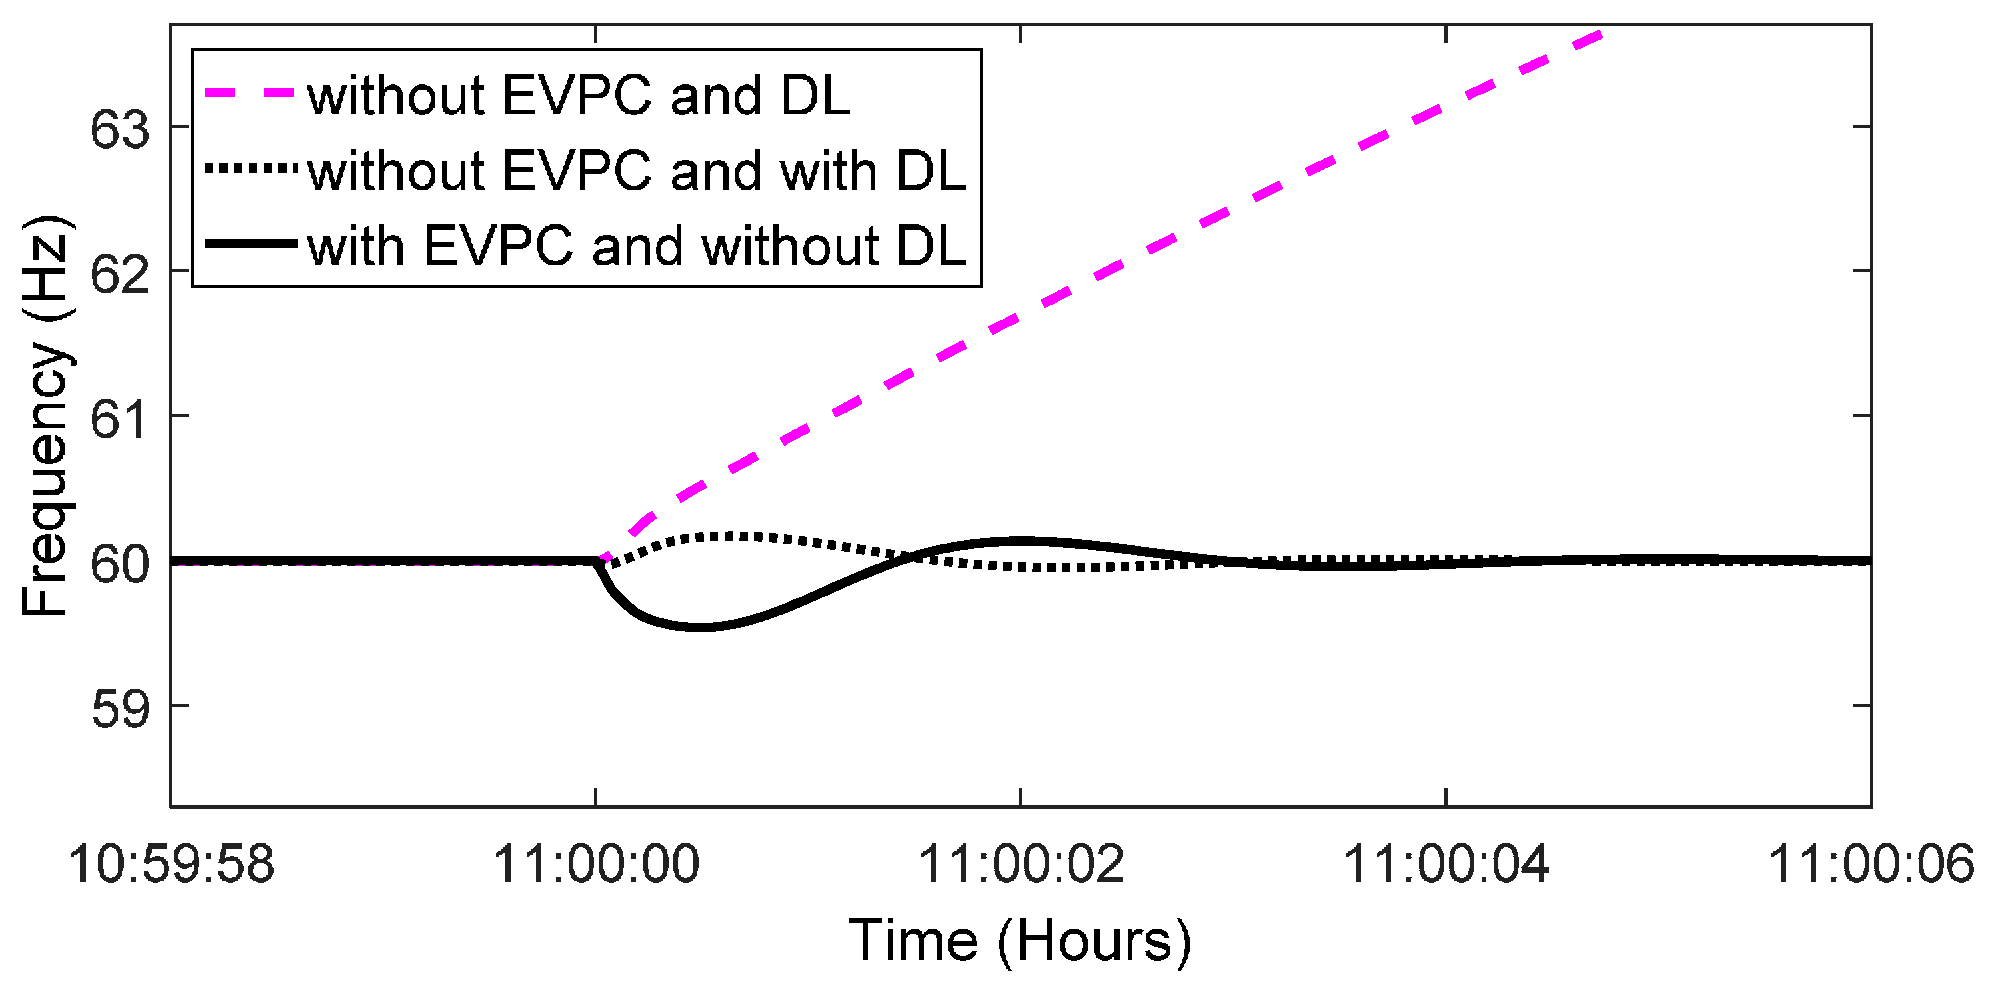
In order to assess fluctuation of frequency accurately, the frequency deviation with and without EVPC is shown in Figure 15. At this time, without the EVPC scheme, EVs are discharged up to 56 kW and with EVPC EVs are charged 142 kW, accordingly. On the other hand, with EVPC, EVs are charged with lower power and frequency variation is less than the other case where there is no EVPC.
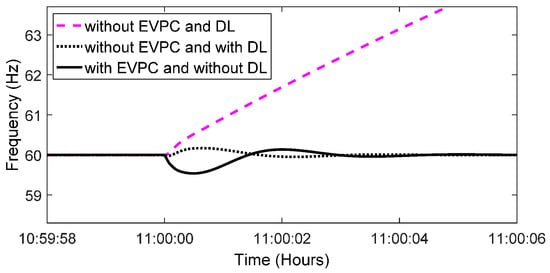
Figure 15.
Frequency variation.
Thus, the value of SMI without EVPC is more than 1 and the system is unstable at 11:00. However, with the application of DL, frequency remains within its expected value. In this case, DL consists of a bank of resistive loads each with a consumption level of 1.75 kW (up to 175 kW). As it can be observed from Figure 16, to keep the system power balance at 11:00, 30 kW of DL activated. Thus, with the application of DL in the case without EVPC, the system remains stable at all times.
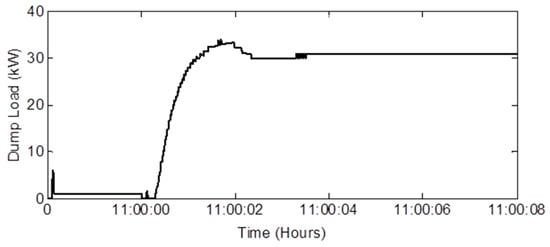
Figure 16.
Dump load activation at 11:00.
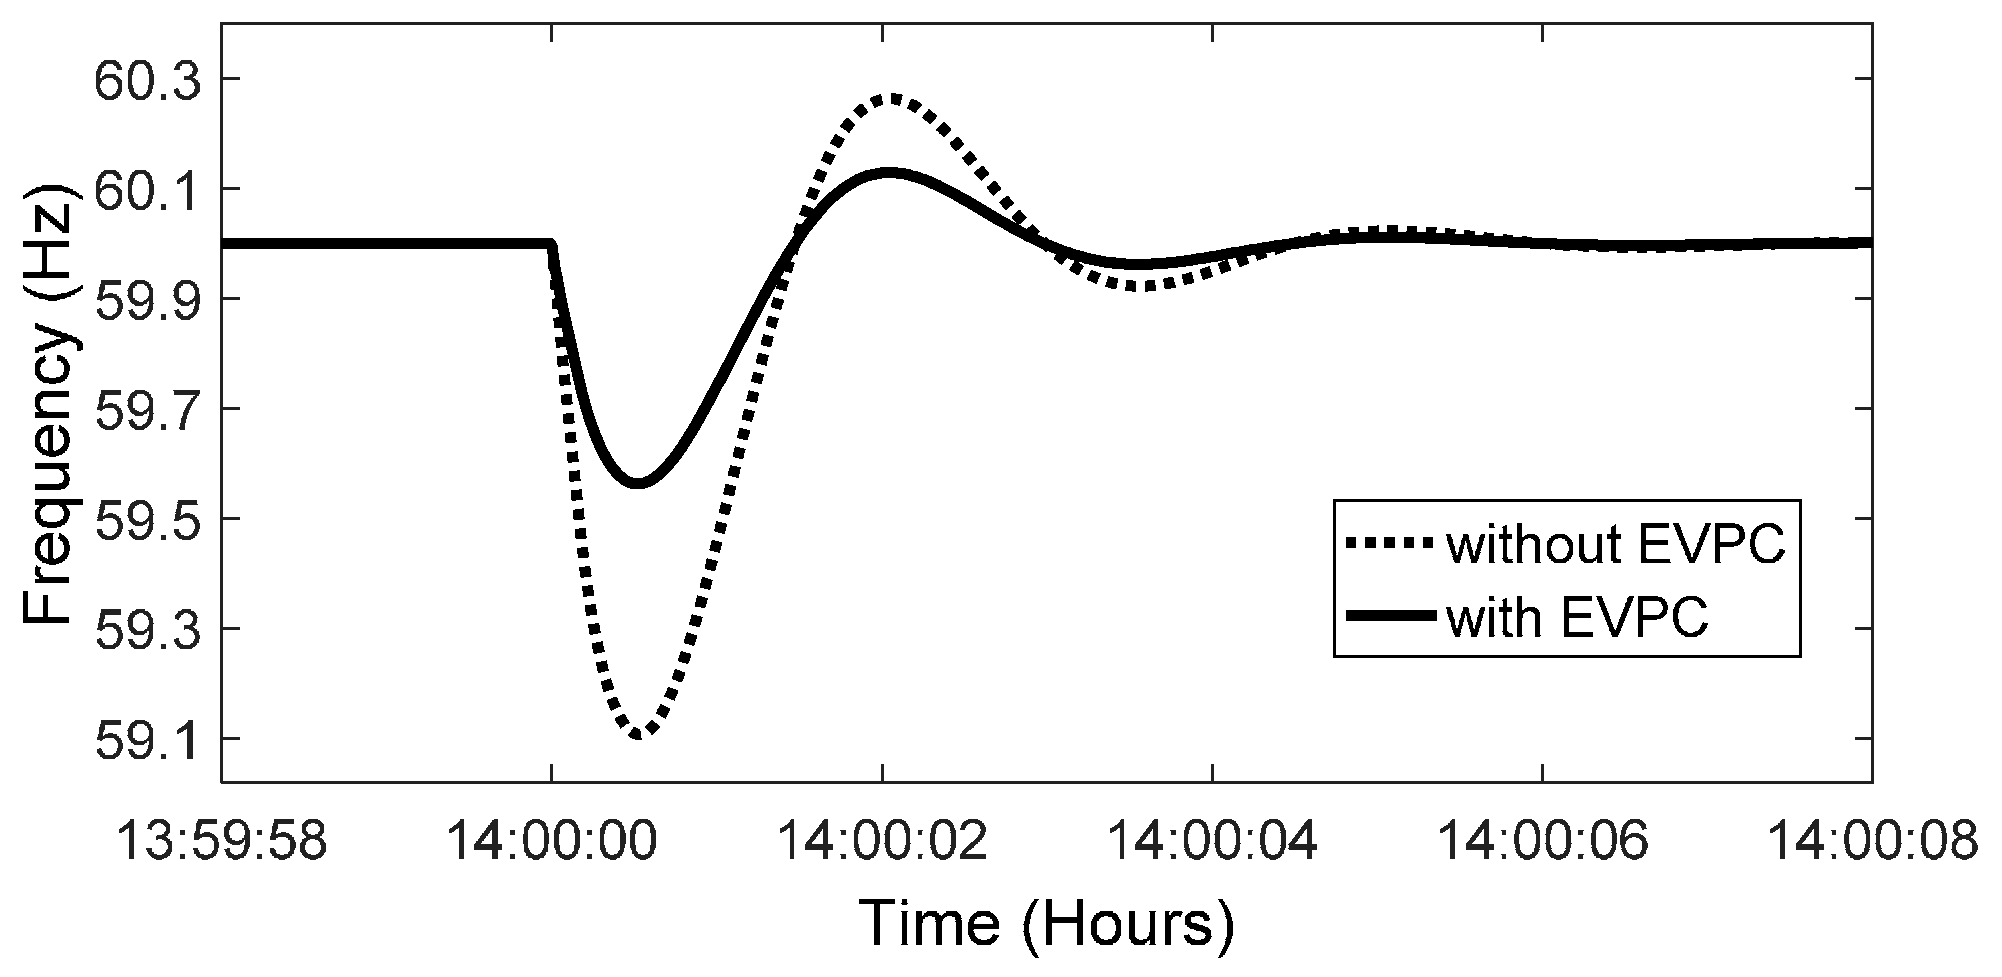
The maximum load demand occurs at 14:00 (368 kW), and frequency variation at this time is shown in Figure 17. At this time, load has its maximum value and the production of RESs is 300 kW. Based on both cost signals, EVs are charged 152 kW and 168 kW in cases with and without EVPC, respectively, and the frequency is kept in its limitations in both cases.
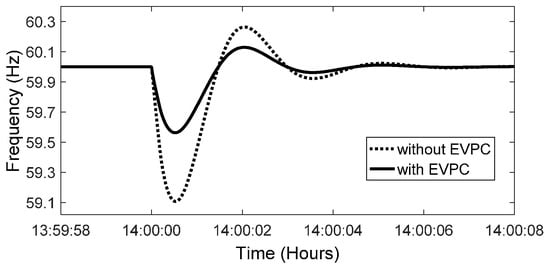
Figure 17.
Frequency variation at the maximum load.
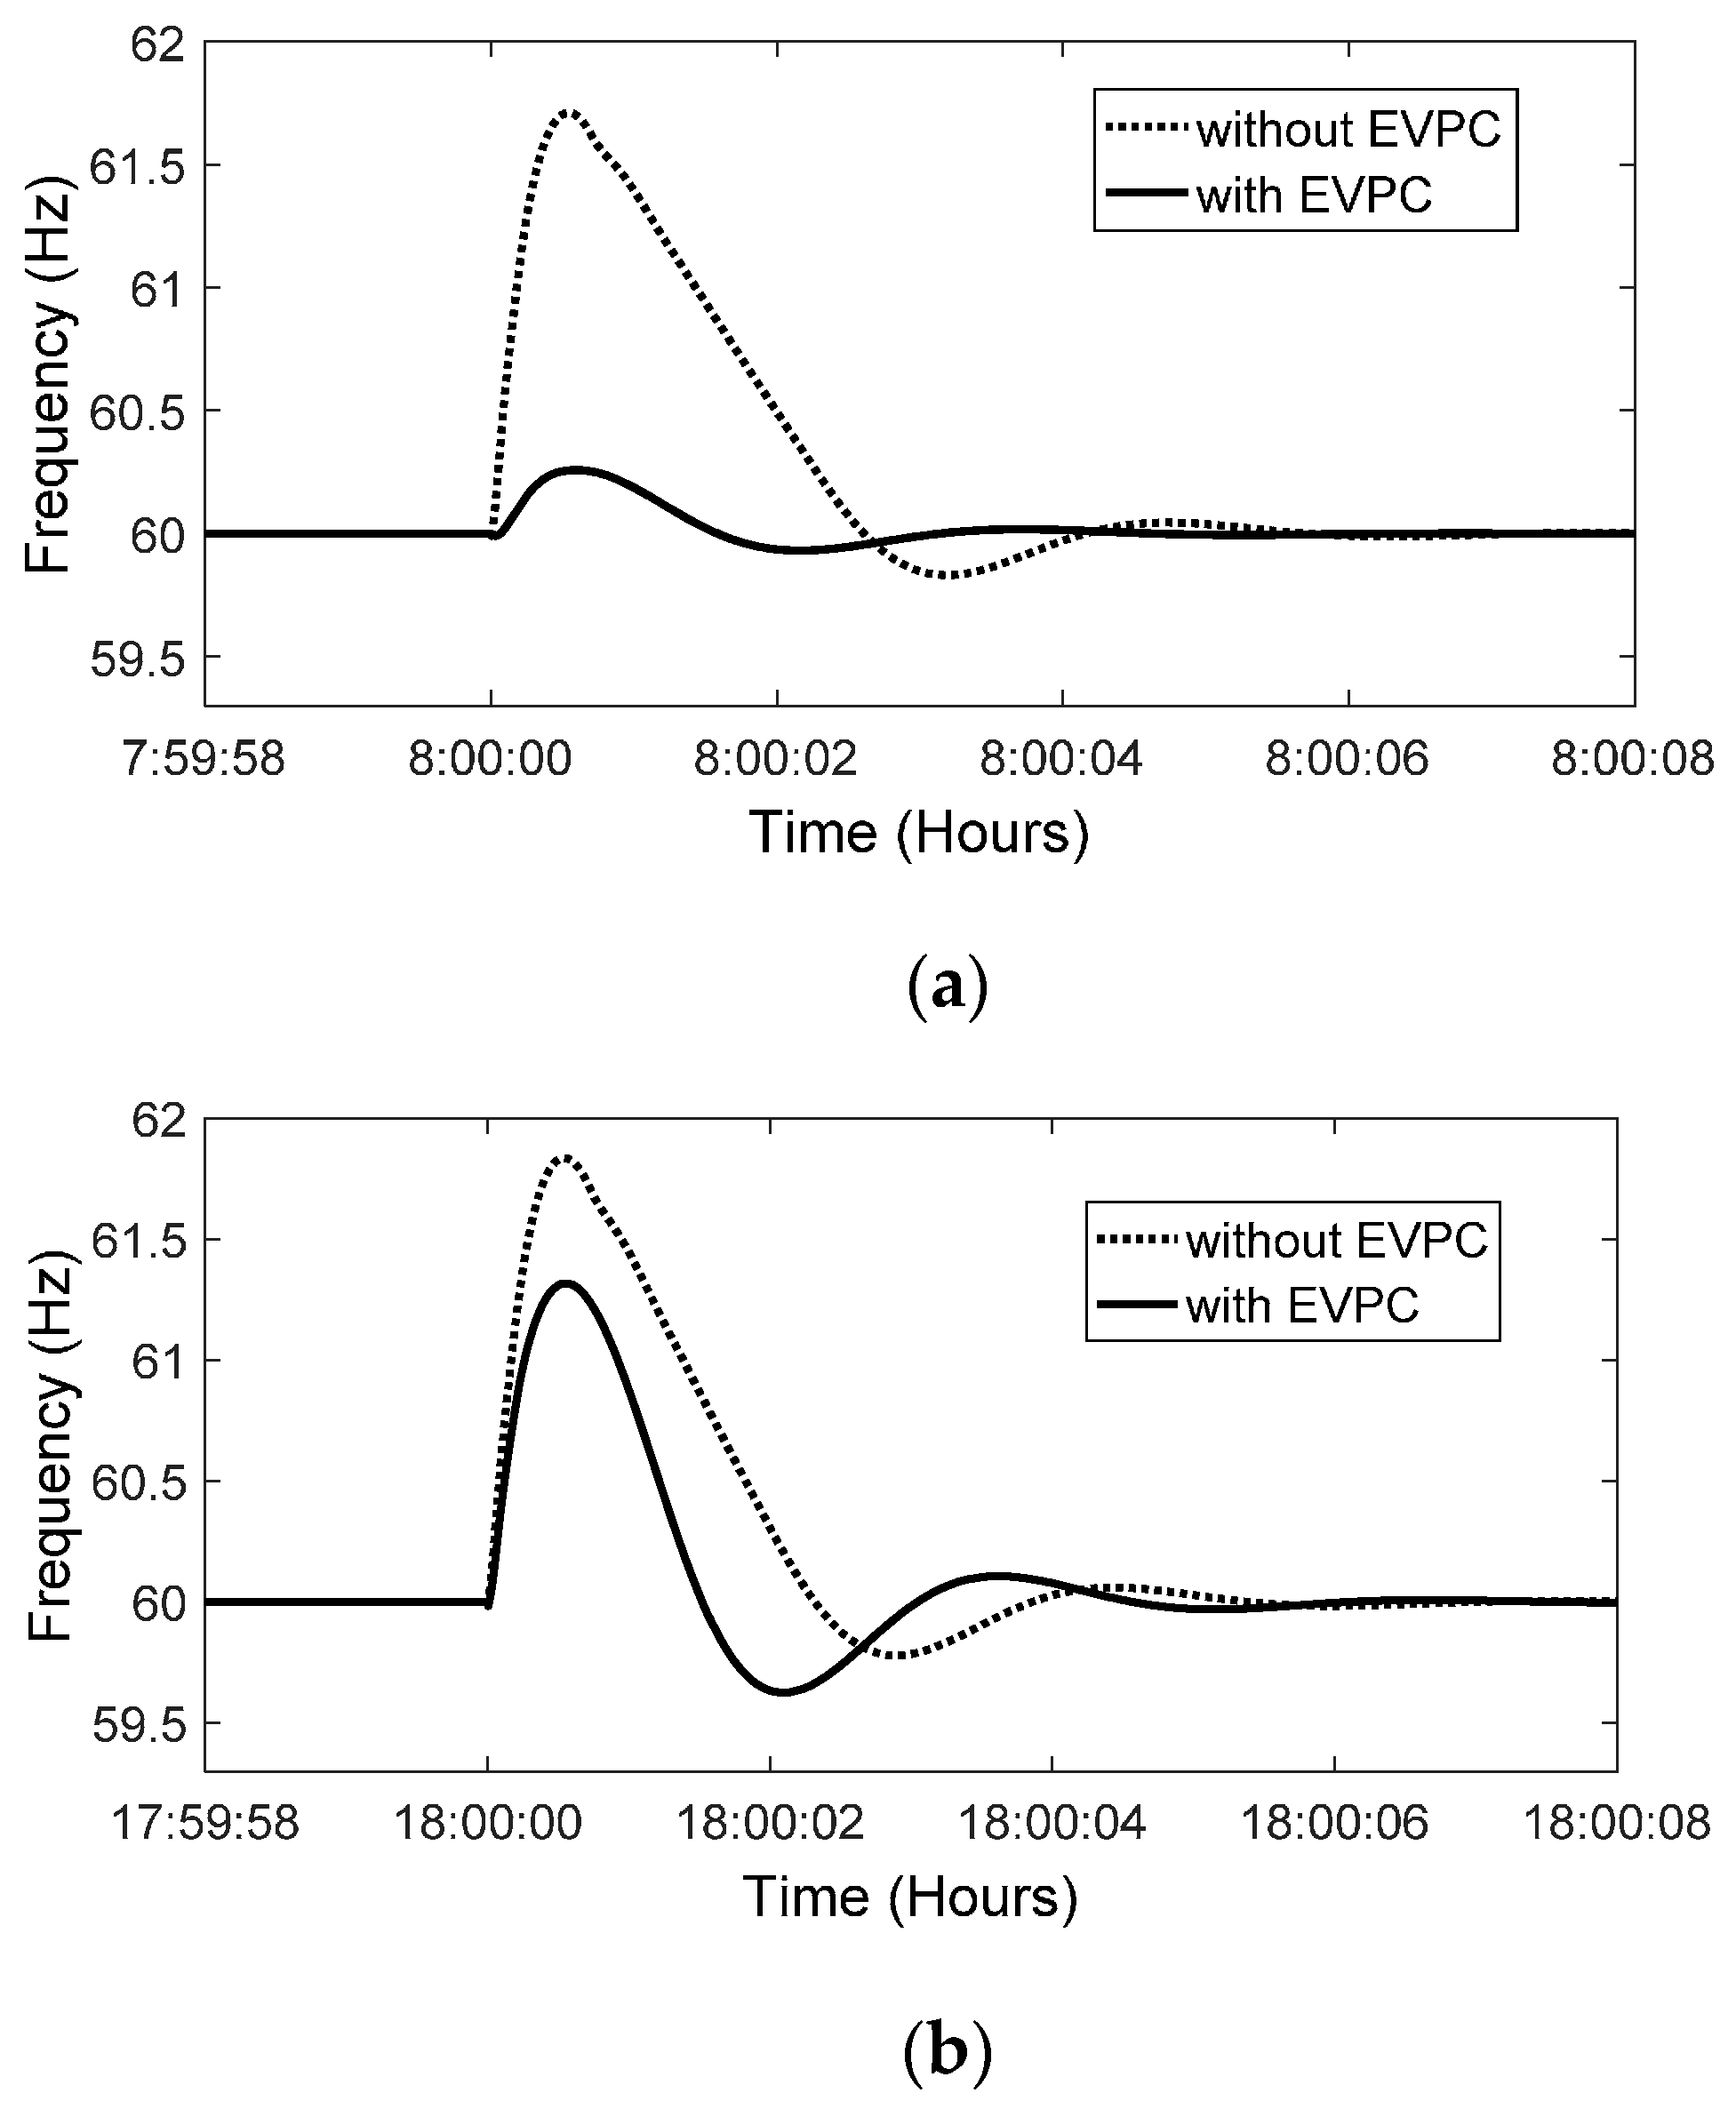
As can be observed in Figure 12, frequency has an overshoot at 8:00 and 18:00 that is zoomed in on in Figure 18. At these times, since SMI is higher in conditions without EVPC than that of in circumstances with EVPC; hence, frequency deviation is further in the former conditions than the latter ones.

Figure 18.
Frequency variation (a) at 8:00 and (b) at 18:00.
The optimization results of the under-study system with and without the application of EVPC are presented in Table 1. As it can be seen, the implementation of EVPC achieves better economic results as compared to the case without it. The results reveal that the MG operator’s profit (F1) is 324.2 £, which is 30.1 £ more than the case without EVPC. Moreover, MG emission is decreased about 205.849 kg with the proposed strategy.

Table 1.
The optimization results of microgrid (MG) in scheduling time horizon.
Furthermore, since the frequency deviations in the case with EVPC remain in the allowable range, the cost corresponding with load frequency control is zero. However, in the case without EVPC, cost of frequency control (F3) raises up to 11.7 £. Finally, the objective function that is equal to the total MG operator’s profits with and without the implementation of EVPC are obtained as 282.1 and 237.6 £, respectively. Thus, the assessment of the results shows that, with the application of EVPC, the total MG operator’s profit is increased considerably.
5. Conclusions
In this paper, an optimal management strategy was proposed in order to schedule the EVs’ charging/discharging process with the goal of improving frequency stability of MG during autonomous operating conditions. In this way, a cost signal including EBP and ESP was proposed based on the variation of SMI index that followed the intermittent nature of RESs and load variation. Based on the proposed strategy, when frequency is at risk, EVs could absorb (inject) the surplus (shortage) of energy and act as energy storage systems. The results also showed, that with the application of this strategy, the frequency variation of MG in isolated mode is less than that without it. Moreover, it is not required to use DL when the EVPC strategy is applied in the MG. Furthermore, it was understood from the results that using EVPC strategy could increase the total MG operator’s profit and decrease the emission substantially.
Author Contributions
Mostafa Vahedipour-Dahraie and Homa Rashidizaheh-Kermani developed the model; Mostafa Vahedipour-Dahraie simulated the case studies; Mostafa Vahedipour-Dahraie, Homa Rashidizaheh-Kermani and Amjad Anvari-Moghaddam analyzed the data; Mostafa Vahedipour-Dahraie, Homa Rashidizaheh-Kermani and Hamid Reza Najafi wrote the manuscript; Amjad Anvari-Moghaddam and Hamid Reza Najafi and Josep M. Guerrero provided their comments on the paper.
Conflicts of Interest
The authors declare no conflict of interest.
Nomenclature
| NG | Number of generation units |
| NJ | Set of loads number |
| Ns | Number of scenarios |
| NW | Number of wind turbine units |
| NP | Number of photovoltaic units |
| NK | Number of EVs |
| T | Scheduling time (24 h a day) |
| i(j) | Index of generating units (loads), running from 1 to NG (NJ) |
| b,n,r | Indices of system buses |
| t (s) | Index of time (scenario), running from 1 to T (Ns) |
| w (p) | Index of WT (PV) units, running from 1 to NW (NP) |
| k | Index of EVs, running from 1 to NK |
| Cw,t (Cp,t) | Energy bid submitted by WT w (PV p) in period t (£/kWh) |
| () | Bid of the up (down)-spinning reserve submitted by unit i in period t (£/kWh) |
| () | Bid of the up (down)-spinning reserve submitted by load j in period t (£/kWh) |
| Bid of the non-spinning reserve submitted by unit i in period t (£/kWh) | |
| SUCj,t (SDCj,t) | Start-up (shut-down) cost of unit i in period t (£) |
| ρ(t) | Electricity price in period t (£) |
| Pi,t | Scheduled power for unit i in period t (kW) |
| Pw,t (Pv,t) | Output power of WT w (PV v) in period t (kW) |
| Pxmax (Pxmin) | Maximum (minimum) generating capacity of unit x (kW) |
| Pk,tEV,ch (Pk,tEV,dis) | Charging (discharging) and discharging power of EV k in period i (kW) |
| () | Scheduled up (down)-spinning reserve for unit i in period t (kW) |
| Scheduled non-spinning reserve for unit i in period t (kW) | |
| () | Scheduled up (down)-spinning reserve for load j in period t (kW) |
| ui,t | Binary variable, equal to 1 if unit i is scheduled to be committed in period t otherwise 0 |
| yi,t | Binary variable, equal to 1 if unit i is starting up in period t otherwise 0 |
References
- Gholami, A.; Aminifar, F.; Shahidehpour, M. Front lines against the darkness: Enhancing the resilience of the electricity grid through microgrid facilities. IEEE Electrific. Mag. 2016, 4, 18–24. [Google Scholar] [CrossRef]
- Khodaei, A. Provisional microgrids. IEEE Trans. Smart Grid 2015, 6, 1107–1115. [Google Scholar] [CrossRef]
- Guerrero, J.M.; Vasquez, J.C.; Matas, J.; de Vicuna, L.G.; Castilla, M. Hierarchical control of droop-controlled AC and DC microgrids-A general approach towards standardization. IEEE Trans. Ind. Electron. 2011, 58, 158–172. [Google Scholar] [CrossRef]
- Pascal, M.; Rachid, C.; Alexandre, O. Optimizing a battery energy storage system for frequency control application in an isolated power system. IEEE Trans. Power Syst. 2009, 24, 1469–1477. [Google Scholar]
- Mu, Y.; Wu, J.; Ekanayake, J.; Jenkins, N.; Jia, H. Primary Frequency Response from Electric Vehicles in the Great Britain Power System. IEEE Trans. Smart Grid 2013, 4, 1142–1150. [Google Scholar] [CrossRef]
- Rotering, N.; Ilic, M. Optimal charge control of plug-in hybrid electric vehicles in deregulated electricity markets. IEEE Trans. Power Syst. 2010, 26, 1021–1029. [Google Scholar] [CrossRef]
- Vahedipour-Dahraie, M.; Najafi, H.R.; Anvari-Moghaddam, A.; Guerrero, J.M. Study of the Effect of Time-Based Rate Demand Response Programs on Stochastic Day-Ahead Energy and Reserve Scheduling in Islanded Residential Microgrids. Appl. Sci. 2017, 7, 378. [Google Scholar] [CrossRef]
- Guo, F.; Inoa, E.; Choi, W.; Wang, J. Study on global optimization and control strategy development for a PHEV charging facility. IEEE Trans. Veh. Technol. 2012, 61, 2431–2441. [Google Scholar] [CrossRef]
- Chukwu, U.C.; Mahajan, S.M. Real-Time Management of Power Systems with V2G Facility for Smart-Grid Applications. IEEE Trans. Sustain. Energy 2013, 4, 1142–1150. [Google Scholar] [CrossRef]
- Nienhueser, I.A.; Qiu, Y. Economic and environmental impacts of providing renewable energy for electric vehicle charging—A choice experiment study. Appl. Energy 2106, 18, 256–268. [Google Scholar] [CrossRef]
- Gao, S.; Chau, K.T.; Liu, C.; Wu, D.; Chan, C.C. Integrated Energy Management of Plug-in Electric Vehicles in Power Grid with Renewables. IEEE Trans. Veh. Tecnol. 2014, 63, 3019–3027. [Google Scholar] [CrossRef]
- Zhang, M.; Chen, J. The Energy Management and Optimized Operation of Electric Vehicles Based on Microgrid. IEEE Trans. Power Deliv. 2014, 29, 1427–1435. [Google Scholar] [CrossRef]
- Wu, T.; Yang, Q.; Bao, Z.; Yan, W. Coordinated energy dispatching in microgrid with wind power generation and plug-in electric vehicles. IEEE Trans. Smart Grid 2013, 4, 1453–1463. [Google Scholar] [CrossRef]
- Ghofrani, M.; Arabali, A.; Etezadi-Amoli, M.; Fadali, M.S. Smart Scheduling and Cost-Benefit Analysis of Grid-Enabled Electric Vehicles for Wind Power Integration. IEEE Trans. Smart Grid 2014, 5, 2306–2313. [Google Scholar] [CrossRef]
- Izadkhast, S.; Garcia-Gonzalez, P.; Frias, P. An aggregate model of plug-in electric vehicles for primary frequency control. IEEE Trans. Power Syst. 2015, 30, 1475–1482. [Google Scholar] [CrossRef]
- Almeida, P.M.R.; Lopes, J.A.P.; Soares, F.J.; Seca, L. Electric vehicles participating in frequency control: Operating islanded systems with large penetration of renewable power sources. In Proceedings of the 2011 IEEE Trondheim PowerTech, Trondheim, Norway, 19–23 June 2011; pp. 5–10. [Google Scholar]
- O’Connell, N.; Wu, Q.; Stergaard, J.; Nielsen, A.H.; Cha, S.T.; Ding, Y. Day-ahead tariffs for the alleviation of distribution grid congestion from electric vehicles. Electr. Power Syst. Res. 2012, 92, 106–114. [Google Scholar]
- Wu, C.; Mohsenian-Rad, H.; Huang, J. Vehicle-to-Aggregator Interaction Game. IEEE Trans. Smart Grid 2012, 3, 434–442. [Google Scholar] [CrossRef]
- Galus, M.D.; Koch Andersson, S. Provision of load frequency control by PHEV, controllable loads, and a cogeneration unit. IEEE Trans. Ind. Electron. 2011, 58, 4568–4582. [Google Scholar] [CrossRef]
- Ma, Y.; Houghton, T.; Cruden, A.; Infield, D. Modeling the Benefits of Vehicle-to-Grid Technology to a Power System. IEEE Trans Power Syst. 2012, 27, 1012–1020. [Google Scholar] [CrossRef]
- Rassaei, F.; Soh, W.S.; Chua, K.C. Demand Response for Residential Electric Vehicles with Random Usage Patterns in Smart Grids. IEEE Trans. Sustain. Energy 2015, 6, 1367–1376. [Google Scholar] [CrossRef]
- Pillai, J.R.; Bak-Jensen, B. Integration of vehicle-to-grid in the Western Danish power system. IEEE Trans. Sustain. Energy 2011, 2, 12–19. [Google Scholar] [CrossRef]
- Vahedipour-Dahraie, M.; Rashidizadeh-Kermani, H.; Najafi, H.R. A Proposed Strategy to Manage Charge/Discharge of EVs in a Microgrid Including Renewable Resources. In Proceedings of the 24th Iranian Conference on Electrical Engineering (ICEE), Shiraz, Iran, 10–12 May 2016; pp. 649–654. [Google Scholar]
- UK National Grid. Available online: http://www.bmreports.com/ (accessed on 10 May 2016).


© 2017 by the authors. Licensee MDPI, Basel, Switzerland. This article is an open access article distributed under the terms and conditions of the Creative Commons Attribution (CC BY) license (http://creativecommons.org/licenses/by/4.0/).