Abstract
This paper conducts a PRISMA-guided systematic review of the empirical literature on environmental, social, and governance (ESG) risk integration in European banking. Using evidence systematically retrieved from Scopus, ScienceDirect, IDEAS/RePEc, and SSRN, the review synthesizes 51 peer-reviewed and working studies published between 2020 and 2025, reflecting the recent and rapidly evolving nature of this research field. The analysis classifies the literature into three domains—pricing and allocation, monitoring and stress testing, and governance and management control systems—and evaluates whether ESG variables operate as first-order drivers within production credit-risk models. The results indicate that while ESG signals are increasingly incorporated into pricing decisions, stress-testing exercises, and governance frameworks, no study provides verifiable evidence of full model-level integration within Probability of Default (PD) or Loss Given Default (LGD) models. The contribution of this review lies in systematically identifying the structural, data-related, and supervisory constraints that sustain this integration gap and in proposing a roadmap that distinguishes incremental ESG sensitivity from genuine prudential model embedding. Overall, the findings clarify that ESG responsiveness in European banking is substantial, yet integration into core risk models remains limited.
1. Introduction
Environmental, Social, and Governance (ESG) factors have moved from peripheral concerns to central elements of corporate risk assessment, particularly in banking. Environmental risks capture climate transition and physical exposures; social factors relate to labour standards, human rights, and inclusion; and governance reflects internal controls, incentives, and oversight structures that shape risk-taking behaviour.
In Europe, ESG considerations have been embedded into the regulatory and supervisory framework through initiatives such as the Corporate Sustainability Reporting Directive (CSRD), the EU Taxonomy, and climate-related supervisory exercises conducted by the European Banking Authority (EBA) and the European Central Bank (ECB) (Hess, 2022; Horobet et al., 2025; Tranfield et al., 2003). These measures have elevated ESG from a disclosure topic to a core component of prudential supervision.
Financial markets have adjusted rapidly to this shift. The growing empirical literature documents ESG-related pricing effects in European banking: borrowers with higher emissions or weak transition strategies face higher loan spreads, while credible transition commitments are associated with lower financing costs (Ferretti et al., 2024). ESG disclosures, climate stress-test announcements, and environmental controversies also trigger market reactions, including abnormal returns, widening credit default swap spreads, and rating downgrades (Agbodgi et al., 2022; Agnese et al., 2024b; Akyildirim et al., 2024; Del Sarto, 2025; European Central Bank, 2024; Fiordelisi et al., 2025; Gurol & Lagasio, 2023; Hummel et al., 2021; La Torre et al., 2021; and Zasuwa & Wesołowski, 2024). These findings suggest that ESG information is quickly reflected in prices, even as internal risk-management practices evolve more slowly.
This divergence motivates the central question of this study: do European banks integrate ESG factors into their core risk-management models, or are ESG risks addressed primarily through pricing and supervisory overlays? Integration implies the use of ESG variables as first-order drivers in production Probability of Default (PD) and Loss Given Default (LGD) models, portfolio limits, or Internal Capital Adequacy Assessment Process (ICAAP) frameworks. Pricing-based approaches, by contrast, adjust spreads or capital costs without altering underlying model structures. While pricing is flexible and responsive, model-level integration is auditable, enforceable, and central to prudential risk management.
To answer this survey, this paper conducts a PRISMA-guided systematic literature review of 51 empirical studies on European banks published between 2020 and 2025. Studies are classified into three application domains: pricing and allocation, monitoring and stress testing, and governance and management control systems. Study quality is assessed using a finance-adapted Newcastle–Ottawa Scale. This structure allows a clear distinction between ESG as a market signal and ESG as an internal risk driver.
The reviewed evidence is highly asymmetric. Most studies document ESG-linked pricing effects or governance mechanisms that enhance oversight without altering production credit-risk models. A smaller body of work examines climate stress testing and exposure monitoring using scenario analysis or geospatial data. Across all domains, there is no consistent evidence that ESG variables operate as first-order inputs in production PD/LGD or ICAAP models.
The review identifies three structural reasons for this integration gap: limited availability of standardized, loss-relevant ESG metrics (particularly for social and governance factors); instability arising from heterogeneous ESG data providers; and differences in bank business models that affect the materiality and transmission of ESG risks. Despite enhanced disclosure and supervisory scrutiny, current regulations do not mandate model-level ESG integration.
This study contributes to the literature by clarifying the distinction between ESG-conditioned pricing and genuine model integration, synthesizing empirical evidence across risk, pricing, and governance domains, and outlining a practical agenda for advancing auditable ESG integration in European banking.
The remainder of the paper is structured as follows. Section 2 presents the theoretical framework. Section 3 describes the PRISMA-based review methodology. Section 4 reports the empirical findings. Section 5 discusses the results in light of the theoretical and institutional context. Section 6 concludes the paper, integrating the main findings with implications for banks, supervisors, and data providers, and outlining a future research and policy agenda.
2. Theoretical Background
Understanding how Environmental, Social, and Governance (ESG) factors enter bank risk processes has become a central issue in banking regulation, climate finance, and organizational studies. The literature distinguishes two complementary channels: (a) market-based pricing mechanisms, where ESG acts as an informational signal processed through spreads and valuations, and (b) prudential modelling approaches, where ESG variables are candidates for inclusion as first-order determinants within internal risk systems.
Within the asset-pricing perspective, ESG information influences credit spreads, loan premia, and credit default swap (CDS) rates as markets react to environmental exposures and transition commitments. Empirical studies show that borrowers with higher emission intensity or weaker transition strategies face higher loan costs, while credible decarbonization commitments are rewarded through discounted financing (e.g., Ferretti et al., 2024; Akyildirim et al., 2024; Gurol & Lagasio, 2023; and Hummel et al., 2021). Climate-related price premia also widen under contractionary monetary policy, amplifying capital costs for carbon-intensive firms. These pricing channels are rapid and incentive-compatible but operate mainly at the margin, failing to capture path-dependent vulnerabilities such as physical hazards or long-tail social risks that require model-based assessment.
The risk-modelling and prudential literature, by contrast, emphasizes internal integration—embedding ESG variables within production-level credit models (PD/LGD), risk-appetite metrics, and ICAAP/Pillar 2 frameworks (e.g., Hess, 2022; Horobet et al., 2025; and Tranfield et al., 2003). Achieving such integration demands auditable, stable, and statistically valid inputs as well as alignment with model-risk-management (MRM) and supervisory validation standards. Most banks still treat climate risk through overlays and scenario-based monitoring rather than as binding model drivers.
A recurring constraint is data heterogeneity. ESG scores differ across providers in coverage and construction, creating inconsistent signals that hinder comparability. Studies find that pillar-specific environmental indicators—financed emissions, emissions intensity, and hazard exposure—show stronger predictive potential than composite ESG scores (e.g., Del Sarto, 2025; European Central Bank, 2024; E. Bruno et al., 2024; and Rega et al., 2025). Governance quality further moderates the transmission of ESG information into models: robust board structures, incentive systems, and management-control mechanisms enhance data discipline but do not automatically ensure model integration (e.g., Di Tommaso & Thornton, 2020; Palmieri et al., 2024; and Schreiner & Beyer, 2024). Business models and funding structures also shape integration pathways; deposit-funded retail banks often display greater resilience and capacity to absorb integration costs than market-funded or investment-oriented institutions (e.g., Rega et al., 2025; Chiaramonte et al., 2024; and Menicucci & Paolucci, 2023).
Another conceptual distinction concerns transition versus physical climate risks. Transition risks—policy shifts, carbon pricing, technological change—affect revenues and default probabilities via sectoral repricing and are usually captured through scenario-based frameworks (e.g., Hess, 2022; Gurol & Lagasio, 2023; and Carretta et al., 2025). Physical risks—acute hazards or chronic environmental change—affect collateral valuation and operational continuity, requiring geospatial data and hazard mapping to estimate LGD or collateral haircuts (e.g., Horobet et al., 2025; European Central Bank, 2024).
Social risks remain the least operationalized dimension. Although linked to litigation, labour disputes, and reputational events, they lack stable, bank-relevant metrics and causal evidence linking social incidents to default outcomes (e.g., Palmieri et al., 2024; Krueger et al., 2020). This pillar asymmetry—environmental factors being measurable, governance acting as a moderator, and social indicators remaining underdeveloped—helps explain why ESG integration lags behind pricing practices.
Synthesizing these insights, Figure 1 illustrates the conceptual pathways through which ESG signals affect bank risk processes. ESG information first influences pricing and allocation decisions, then shapes monitoring and stress-testing frameworks, and finally interacts with governance and management-control systems. These channels together define whether ESG considerations remain at the market level or evolve toward genuine model-level integration.
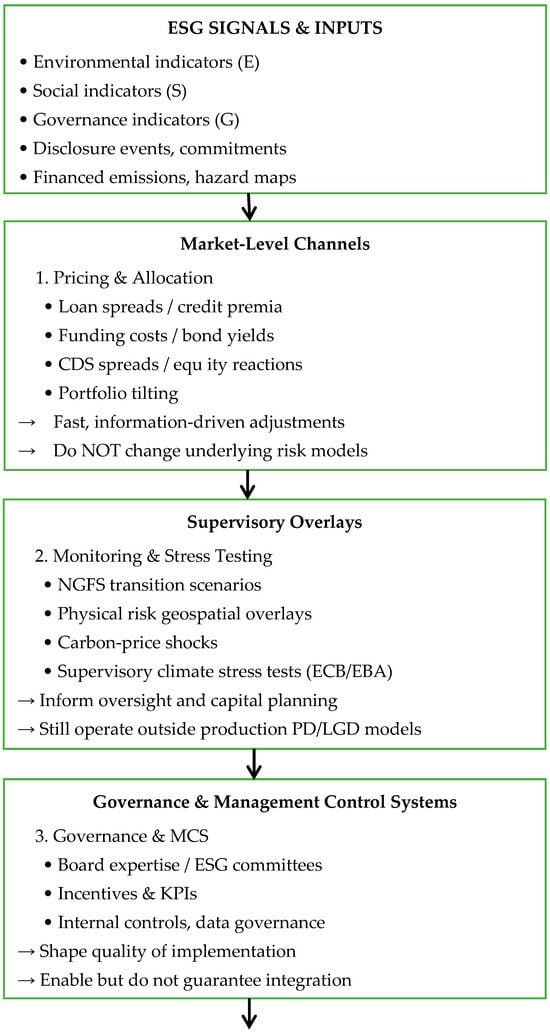
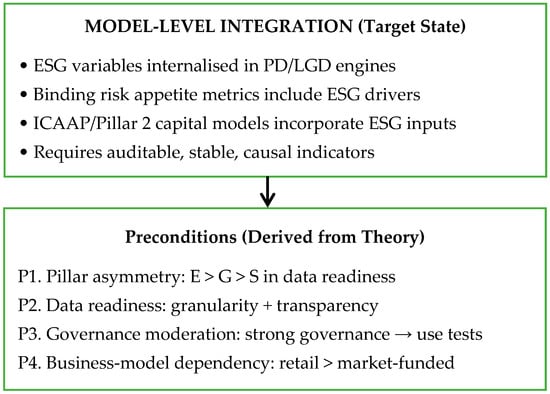
Figure 1.
Conceptual pathways from ESG signals to bank risk practices.
Building on this framework, the present study formulates four guiding propositions: (P1) Environmental metrics are generally more effective for model integration than social metrics (pillar asymmetry); (P2) Data transparency and asset-level granularity increase the likelihood of integration; (P3) Strong governance moderates, but does not guarantee, ESG use in models; and (P4) Business-model dependence and macroeconomic conditions influence integration dynamics. These propositions inform the systematic review design that follows. The next section details the PRISMA-guided methodology, outlining the search strategy, inclusion criteria, coding protocol, and risk-of-bias assessment used to classify and evaluate the 51 empirical studies on ESG and risk modelling in European banking.
3. Methodology
This study adopts a systematic literature review (SLR) to examine whether European banks have integrated Environmental, Social, and Governance (ESG) metrics into core risk-management frameworks or whether ESG influence remains confined to pricing adjustments. The design follows Tranfield et al. (2003), whose three-stage protocol—systematic searching, screening, and synthesis—is well established in management and finance research for ensuring transparency, replicability, and rigour. The process was documented through a complete audit trail with predefined inclusion and exclusion criteria to minimize bias.
A clear conceptual distinction underpins the review. Integration refers to the explicit inclusion of ESG factors as first-order drivers in internal risk models (e.g., Probability of Default (PD), Loss Given Default (LGD), portfolio risk-appetite calibration, ICAAP/Pillar 2 capital). Pricing, in contrast, captures ESG-sensitive adjustments at the transaction or market level (loan spreads, funding costs, and market valuations) that respond to ESG signals without altering production models. This distinction guided coding and interpretation.
Data were collected from ScienceDirect, Scopus, IDEAS/RePEc, and SSRN, four academic databases covering high-quality finance and banking research. Field restrictions were applied (Title/Abstract/Keywords for Scopus, All Fields for ScienceDirect, and full-platform searches for IDEAS/RePEc and SSRN) to capture studies using alternative ESG terminology (e.g., sustainability risk, climate risk). The review period—2020 to 2025—reflects the post-standardization regulatory phase following the EU Taxonomy, CSRD, and ECB/EBA climate-risk stress tests. Searches were limited to English-language publications in finance, banking, management, and economics.
A unified Boolean query was developed and adapted to each database/platform’s syntax: (“ESG” OR “environmental social governance”) AND (“risk management”) AND (“European banks” OR “EU banking sector”). This yielded 765 records; after removing duplicates (78) and automatic exclusions (2), 685 titles and abstracts were screened. Full-text review of 89 papers resulted in a final corpus of 51 eligible studies. Figure 2 presents the PRISMA 2020 flow diagram, summarizing the identification, screening, eligibility, and inclusion stages of the systematic review.
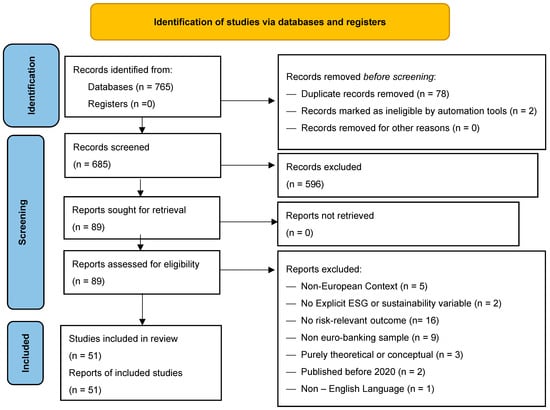
Figure 2.
PRISMA 2020 flow diagram of study selection for the ESG and risk-integration review. The diagram shows the number of records identified, screened, excluded, and included in the final sample of 51 studies.
Eligibility criteria ensured conceptual and empirical relevance. Included studies focused on European banks (EU-27 or broader) and operationalized at least one ESG construct—composite ratings, pillar-specific indicators, controversies, financed-emissions metrics, or physical-risk indices—and reported risk-related outcomes (PD, LGD, NPL ratios, loan spreads, funding costs, market-based indicators, systemic-risk measures, operational or governance outcomes, or reputational effects). Excluded were studies outside Europe or banking, lacking ESG or risk variables, purely conceptual works, pre-2020 papers, or non-English publications.
Study-level characteristics and extracted variables (sample, methods, ESG constructs, risk outcomes, and application domain) were systematically recorded using a standardized coding protocol. To provide an overview of how studies address different risk-management domains, Table 1 presents the cross-domain distribution of the 51 reviewed studies, highlighting overlaps between pricing, monitoring, and governance dimensions. The complete extraction matrix for all studies is reported in Appendix A. Methodological quality was assessed using an adapted Newcastle–Ottawa Scale (NOS) tailored to banking and ESG-risk research, classifying studies as low, moderate, or high risk of bias (Appendix B). Qualitative or policy-oriented works were not scored due to methodological incompatibility. Reliability and validity were ensured through predefined inclusion criteria, standardized coding, and reviewer cross-checks.

Table 1.
Cross-domain distribution of reviewed studies.
Table 1 summarizes the cross-domain distribution of the 51 reviewed studies, highlighting overlaps between pricing, monitoring, and governance dimensions. Full study-level characteristics and quality scoring are reported in Appendix A and Appendix B. Primary-domain assignment reflects the dominant analytical focus of each study and does not exclude secondary contributions to other domains.
The analytical strategy combined evidence mapping, thematic synthesis, and cross-domain interpretation. Evidence mapping captured the distribution of studies across ESG constructs, risk outcomes, methods, and domains. Thematic synthesis evaluated direction, magnitude, and consistency of findings, considering methodological factors affecting significance. Cross-domain analysis explored interactions between pricing, monitoring, and governance in shaping ESG integration, guided by the conceptual propositions of Section 2 regarding pillar asymmetries, data granularity, governance moderation, and business-model heterogeneity.
In addition, we conducted a bibliometric visualization to map the thematic structure of the broader literature and to support the qualitative synthesis. We complemented the PRISMA-based synthesis with a bibliometric mapping using VOSviewer (version 1.6.20; Centre for Science and Technology Studies (CWTS), Leiden University, Leiden, The Netherlands). Bibliographic records were retrieved from Scopus (N = 533) and analyzed using author keywords. We conducted a keyword co-occurrence analysis (full counting) and applied a minimum occurrence threshold of 15, yielding 21 keywords included in the network. VOSviewer’s clustering algorithm identified six thematic clusters, which were subsequently interpreted and used to triangulate the narrative synthesis.
Limitations include potential publication bias, ESG-data heterogeneity, the 2020–2025 window omitting longer-term dynamics, and partial misalignment of the adapted NOS with econometric studies. These are mitigated by triangulation, transparent reporting, and proposition-driven synthesis.
With the review protocol and coding strategy established, the next section synthesizes the empirical evidence across the three domains—pricing and allocation, monitoring and stress testing, and governance and management-control systems—highlighting key patterns, pillar asymmetries, and the degree of ESG integration observed in European banking.
4. Results
The final dataset consists of fifty-one empirical studies published between 2020 and 2025 that examine the relationship between ESG factors and risk outcomes in European banks. The methodological landscape is dominated by panel-data econometric designs and event-study approaches, with additional contributions from climate-scenario modelling, stress-testing exercises, and a limited number of survey or case-based analyses. The studies encompass a broad range of risk outcomes, including credit-risk measures such as loan pricing, PD, LGD, and non-performing loan ratios; market-based indicators such as equity valuations and CDS spreads; systemic-risk metrics; and a range of operational, governance, and reputational dimensions.
To ensure interpretative coherence, each study was mapped into a single primary application domain—pricing and allocation, monitoring and stress testing, and governance and management control systems—and also categorized by risk type. Although each study is assigned a single primary application domain for synthesis, secondary analytical linkages across domains (e.g., governance mechanisms affecting pricing or monitoring outcomes) are explicitly retained in the extraction matrix and systematically exploited in the cross-domain interpretation. The primary-domain classification therefore serves as an organizing device rather than a restrictive assumption and does not preclude multi-dimensional analysis of individual studies.
This approach ensures that studies with multi-dimensional contributions are not overlooked. For instance, papers primarily categorized under governance may still provide insights into pricing or monitoring mechanisms, and these cross-domain interactions are explicitly incorporated in the thematic synthesis. By systematically accounting for secondary contributions, the review captures the nuanced interplay between pricing, monitoring, and governance, mitigating the risk of oversimplification inherent in a single-domain assignment.
This classification proved essential for separating market-based reactions from internal-model practices, especially given the heterogeneity of designs and ESG constructs across the literature. The resulting distribution reveals a strong concentration of research in governance and control systems (twenty-nine studies), a smaller but methodologically diverse body of work on monitoring and climate-stress exercises (thirteen), and a focused cluster analyzing pricing and allocation mechanisms directly at the loan or market level (nine). Figure 3 provides an overview of the distribution of the 51 included studies across the three application domains.

Figure 3.
Distribution of studies across application domains (N = 51). Note: Percentages are rounded to the nearest whole number.
This figure presents the relative distribution of the 51 empirical studies across the three application domains employed in the review: Pricing & Allocation (9 studies, 18%), Monitoring & Stress Testing (13 studies, 25%), and Governance & Management Control Systems (29 studies, 57%). The visual summary highlights a strong concentration of research in governance and control systems (twenty-nine studies), a smaller but methodologically diverse work on monitoring and climate-stress testing (thirteen), and a focused cluster analyzing pricing and allocation mechanisms directly at the loan or market level (nine). Notably, the Social pillar remains underrepresented: few studies operationalize S-related exposures beyond proxy indices, and evidence linking social factors to measurable credit-risk outcomes is limited.
4.1. Bibliometric Visualization and Cluster Analysis (VOSviewer)
A VOSviewer keyword co-occurrence analysis was conducted using author keywords from the Scopus retrieval set (N = 533). Applying a minimum occurrence threshold of 15 (21 keywords retained), the mapping identifies distinct but interconnected thematic clusters. Figure 4 illustrates the resulting keyword co-occurrence network and associated thematic clusters.
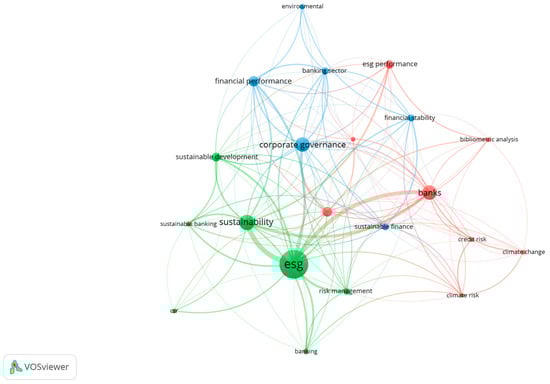
Figure 4.
Keyword co-occurrence network and thematic clusters.
A first cluster captures the core ESG–banking–sustainability nexus, centred on “ESG”, “banks/banking”, and “sustainability” and linking to risk-related terms such as “risk management”.
A second cluster reflects the governance and performance stream, connecting “corporate governance” and CSR-related terms with outcome variables including “financial performance” and “ESG performance”.
A third cluster groups stability and sustainable finance themes, linking “financial stability” and “sustainable finance” with broader contextual terms such as “banking sector” and environmental considerations and extending to climate and credit-risk concepts (e.g., “climate risk/climate change”, “credit risk”).
Overall, the cluster structure provides a data-driven overview of the field’s thematic organization and complements the PRISMA-based synthesis by visually corroborating the main streams discussed in Section 4.2, Section 4.3, Section 4.4 and Section 4.5.
Table 2 summarizes the keyword composition of the three VOSviewer clusters (minimum occurrences = 15). Each cluster groups author keywords that co-occur frequently across the Scopus retrieval set (N = 533), indicating closely related themes in the literature. Overall, the clusters highlight three interconnected streams: (1) climate and credit risk considerations alongside CSR/ESG performance and sustainability reporting, (2) the core ESG–sustainability nexus in banking linked to risk management, sustainable banking, and sustainable development, and (3) governance and performance/stability themes connected to sustainable finance at the sector level.
Table 2.
Thematic clusters form VOSviewer keyword co-occurrence analysis (N = 533; threshold = 15).
4.2. Pricing and Allocation
The literature on pricing and allocation consistently documents a pronounced climate-related pricing gradient in European credit markets. Loan-level studies based on credit-register microdata show that banks charge higher spreads to high-emitting borrowers and offer discounts to firms with credible transition plans, particularly where transition commitments are externally validated or aligned with science-based trajectories. These premia widen further under contractionary monetary policy, suggesting an interaction between macro-financial conditions and climate-risk assessment. In several cases, institutions with their own climate-commitment frameworks display more strongly differentiated spreads, indicating that internal strategic alignment reinforces pricing discrimination. Additional panel-data evidence drawn from crisis periods suggests that banks with stronger environmental and broader ESG profiles exhibit more stable lending behaviour, which reflects both improved credit-risk screening and a more resilient funding structure.
Market-based studies reinforce the loan-level findings. Event-study analyses show that disclosures of climate-related exposures or supervisory announcements concerning climate-stress exercises lead to immediate negative abnormal returns for banks with high physical-risk exposures and to widening of CDS spreads across the system, including for institutions with otherwise strong ESG ratings. These market reactions imply that investors differentiate sharply between banks on the basis of climate-risk fundamentals and that supervisory transparency triggers risk-pricing adjustments that extend beyond narrow credit channels.
Based on these studies, panel analyses investigating portfolio composition show that banks gradually reallocate credit away from highly carbon-intensive sectors and toward firms with stronger environmental performance. This pattern is more consistent with sectoral risk-management behaviour than with uniform de-risking. The strength of the reallocation effect is amplified during periods of stress, when banks with stronger ESG profiles face lower funding pressures and can sustain lending in less risky or greener segments. Evidence from equity markets further confirms that firms with robust environmental performance receive valuation premia or experience milder valuation losses around salient climate-related news.
A surprising element across the pricing literature is the asymmetry between environmental metrics and composite or social indicators. Environmental measures such as emissions intensity, financed emissions proxies, physical-hazard exposure, display the clearest and most stable associations with pricing outcomes. By contrast, composite ESG measures frequently generate weaker or inconsistent effects, a pattern partly attributable to cross-provider heterogeneity in weighting schemes and controversy treatment. Governance variables, where analyzed, tend to operate as moderators that enhance the stringency or consistency of credit screening rather than as independent determinants of spreads or allocations. Differences in business models further condition the magnitude of climate premia: deposit-funded, relationship-based banks exhibit more stable pricing dynamics and smaller lending contractions during stress than institutions relying more heavily on wholesale or market-based funding.
Thus, the pricing evidence reveals a coherent and economically significant ESG-sensitive regime operating at both origination and secondary-market levels. However, none of these studies provides evidence that ESG or climate-related indicators enter production PD/LGD models or other core internal-model components. Pricing and allocation appear responsive to ESG factors, but this responsiveness is achieved without embedding ESG drivers in the internal risk-modelling architecture.
4.3. Monitoring and Stress Testing
Studies on monitoring and stress testing focus on the supervisory and analytical frameworks through which banks and regulators assess transition and physical climate risks. This body of work identifies three main methodological pillars. The first consists of top-down transition-risk scenarios calibrated to NGFS or ECB trajectories, or to carbon-price shocks that simulate abrupt policy tightening. These exercises quantify revenue impacts, cost shocks, collateral revaluations, and sectoral migration by mapping loan and security exposures to NACE codes and applying sector-specific transition intensities. The results show that losses are concentrated in a subset of high-emitting industries and the implied capital consumption is generally reported as overlay adjustments rather than through revised PD or LGD estimates. In other words, while transition risk is recognized as material, its treatment remains external to production models.
The second pillar involves the integration of physical-risk information through geospatial overlays. These studies superimpose hazard indices—flood, heat, wildfire, or composite climatological risks—onto mortgage, SME, and corporate portfolios using asset location or postal-code proxies. Loss projections are obtained by linking hazard exposure to collateral haircuts, transition probabilities, or stressed loss parameters. Banks with a higher proportion of assets in hazard-prone areas face substantially larger projected losses, and capital markets tend to react adversely to disclosures concerning these exposures. Yet, as with transition scenarios, the outputs of these geospatial analyses feed supervision dashboards and ICAAP capital-planning processes rather than internal PD/LGD models.
The third pillar concerns the governance of supervisory integration. Climate scenarios have become part of routine supervisory dialogue and banks are required to demonstrate board oversight, data origin, and process coherence in scenario execution. However, supervisory expectations continue to rely primarily on scenarios, qualitative assessments, and capital buffers rather than on model-level use tests. There is no public evidence that scenario variables have been embedded directly into risk-model drivers across institutions.
Across these pillars, data and modelling challenges are presented. Scenario results depend on the reliability of emissions baselines, the credibility of firm-level targets, the precision of asset-location data, and the functions that translate hazard or transition shocks into credit-risk parameters. These uncertainties define the space between effective monitoring and genuine model integration.
The literature consistently shows that banks and supervisors have developed increasingly sophisticated tools for assessing climate-related exposures and potential losses, and markets react strongly to the publication of these assessments. Yet none of the studies indicates that these tools have altered production risk-modelling frameworks. Monitoring and stress-testing practices remain informative and operationally useful, but they remain largely parallel to rather than embedded within core internal risk models.
4.4. Governance and Management Control Systems
Governance and management-control studies form the largest component of the dataset and illustrate how organizational structures and control mechanisms shape the way banks incorporate ESG information. The studies show that European banks have enhanced board capacity through increased expertise, independence, and diversity, and have institutionalized ESG oversight by establishing dedicated committees and more clearly defined executive responsibilities. These developments are associated with greater financial stability, lower risk-weighted assets and improved resilience during stress periods. The mechanisms through which these effects arise relate to improved risk culture, stronger oversight, and greater process discipline rather than to modifications in the structure of credit-risk models.
Management control systems act as the operational counterpart of governance structures. Banks translate board priorities into concrete processes through planning and budgeting routines, KPI dashboards, administrative controls, and incentive schemes that link compensation to ESG performance. These systems strengthen internal accountability, enhance credit screening for ESG-related risks, and reduce exposure to controversial or risky counterparties. They thereby influence the consistency and quality of risk management while leaving core PD/LGD specifications unchanged.
Disclosure quality plays a further role. Stronger ESG reporting, supported by verifiable data pathways and senior-level sign-off, is associated with fewer controversies and smaller penalties when controversies occur. External assessments of ESG credibility likewise interact with market reactions: institutions with better disclosure practices or lower exposure to controversies face less adverse valuation adjustments during climate-related news or stress-test announcements. These effects highlight the reputational and process-quality dimensions of governance rather than any direct influence on loss modelling.
Across the governance part, a consistent pattern emerges: governance moderates and enhances pricing and monitoring outcomes but does not function as a direct risk driver. Stronger governance is associated with more consistent implementation of ESG considerations, more effective scenario analysis, and smoother supervisory engagement. However, no study reports the direct incorporation of ESG variables into production PD/LGD models, binding risk-appetite metrics, or ICAAP linkages as a consequence of governance reforms. The integration observed in these studies is organizational rather than model-based.
4.5. Moderators and Sources of Heterogeneity
The heterogeneity observed across studies arises primarily from differences between ESG pillars, data quality, bank business models, and macro-financial conditions. Environmental indicators consistently exhibit the strongest decision-usefulness across pricing and monitoring analyses because they rely on quantifiable, auditable metrics such as emissions intensity, financed emissions, and hazard-exposure indices. Transition-risk scenarios disproportionately affect high-emission sectors, while physical-risk estimations are most precise when asset-level geocoding is available. Markets likewise respond most sharply to climate-related disclosures or physical-risk revelations, confirming that the environmental pillar anchors the ESG-risk relationship.
The reviewed evidence clusters into three recurring channels. First, a repricing channel is most visible in market-based outcomes, where ESG and climate-related information is quickly reflected in prices and spreads, particularly around salient disclosures and regulatory announcements. Second, an allocation channel emerges in lending and portfolio adjustments, typically materializing more gradually and often being conditional on macro-financial conditions. Third, evidence for model integration, the use of ESG variables as first-order drivers within production PD/LGD systems, remains comparatively limited and difficult to verify externally, helping reconcile strong market reactions with weaker conclusions at the internal-model level.
Differences in bank business models shape both the channel and the speed through which ESG-related information is reflected in risk outcomes. Market-funded or wholesale-oriented institutions display stronger and faster market repricing around climate disclosures and regulatory announcements, consistent with higher exposure to market discipline and traded funding conditions. In contrast, retail and deposit-funded banks more often exhibit smoother adjustments and more persistent pricing gradients within relationship lending settings, with lending reallocation typically unfolding gradually. Across both groups, heterogeneity appears to affect the adjustment mechanism (market pricing versus incremental balance sheet reallocation) more than it alters the broader conclusion regarding limited, externally verified integration of ESG indicators as first-order drivers in production PD/LGD systems.
The social pillar, by contrast, remains the least operationalized. Its indicators often rely on disclosure proxies or stakeholder indices rather than directly measurable risk factors. Effects appear indirectly—through reputational or governance channels rather than loss mechanics—which contributes to the inconsistency of findings when social metrics are blended into composite ESG scores. Governance functions primarily as a moderator: stronger governance amplifies the effectiveness of pricing and monitoring practices, lowers controversy incidence, and enhances disclosure credibility. These mechanisms explain why governance-intensive banks show greater stability and smoother supervisory interactions, even though their internal model specifications remain unchanged.
Provider heterogeneity further shapes outcomes. Comparative evidence from studies such as E. Bruno et al. (2024) indicates that correlations among leading ESG data providers (MSCI, Sustainalytics, Refinitiv) often fall below 0.6, highlighting substantial divergence in ESG signals and explaining the instability of composite-score results across studies. Studies using E-pillar-specific indicators tend to produce clearer gradients, whereas those employing composite ESG measures report inconsistent results because of divergent provider weightings and controversy treatments. Business-model differences add another layer: deposit-funded banks exhibit smoother, more persistent ESG-risk adjustments and less pro-cyclical lending than market-funded institutions. Macro-financial conditions matter as well; contractionary monetary policy amplifies climate-related price premia without necessarily accelerating model integration. Data granularity also affects precision: asset-level geocoding strengthens physical-risk estimates, and credit-register microdata yield cleaner pricing gradients than aggregated datasets. During stress periods, banks with stronger ESG profiles experience milder lending contractions and more favourable funding conditions.
Although the reviewed designs are diverse, their reported coefficients allow an indicative summary of ESG-related effect magnitudes (Table 3).
Table 3.
Indicative range of ESG-risk effects across studies.
These descriptive ranges provide a quantitative sense of materiality while respecting methodological diversity. A formal meta-analysis was not pursued due to methodological heterogeneity across econometric designs and ESG constructs, but the indicative ranges summarized here provide comparable insight into magnitude and direction.
It should be noted that this review does not perform a formal meta-analysis of effect sizes. The substantial heterogeneity in study designs, ESG constructs, outcome measures, and reporting formats prevents statistical aggregation of coefficients. Table 3 therefore provides an indicative summary of effect magnitudes rather than pooled estimates. Nonetheless, these descriptive ranges, combined with thematic synthesis, allow robust identification of consistent ESG-risk patterns, pillar asymmetries, and moderating influences across the literature.
Where possible, studies were categorized by primary funding model—retail/deposit-funded versus market-funded banks—to enable a descriptive subgroup comparison of ESG integration patterns. Although formal meta-analysis by business model is not feasible due to incomplete reporting, clear differences emerge: retail-oriented, deposit-funded banks display steadier ESG-risk adjustments, reflecting stable funding bases and relationship-lending models, while market-funded institutions respond more strongly to climate disclosures through repricing channels but show weaker evidence of ESG incorporation within internal risk models. Taken together, these subgroup patterns indicate that funding structure mediates the speed and depth of ESG integration—a relationship future meta-analyses could formalize.
Despite these moderating influences, none alters the central conclusion: ESG factors—particularly environmental metrics—shape pricing and monitoring behaviour but do not yet operate as first-order drivers within production risk models. These multiple layers of heterogeneity—across pillars, business models, and data providers—explain much of the diversity in reported outcomes and set the stage for the discussion that follows.
5. Discussion
The evidence presented in this review reveals a consistent and systematic pattern across the 51 empirical studies: European banks have made substantial progress in pricing ESG-related risks, operating climate-sensitive credit allocation policies, developing scenario-based monitoring, and establishing ESG supervision through governance and management-control systems. Yet, despite the maturity of these practices, the studies collectively provide no verifiable indication that ESG factors function as first-order drivers in production credit-risk models. This divergence between widely used ESG-conditioned pricing and the absence of model-level integration reflects both empirical realities and deeper theoretical, institutional, and data-structural constraints.
These findings converge with prior systematic reviews on ESG–finance linkages, such as Carretta et al. (2025), which document that ESG integration in banking remains concentrated in pricing and disclosure domains rather than prudential modelling. The present review extends these earlier analyses by providing a structured cross-domain synthesis and by explicitly assessing the absence of ESG variables in production PD/LGD frameworks. Compared with previous studies, this approach highlights a persistent implementation gap between external market sensitivity and internal risk-model incorporation, demonstrating where prior reviews identified trends but did not quantify model-level integration.
A first major insight concerns pillar asymmetry. Environmental metrics, particularly financed-emissions intensity, sector-specific transition exposure, and location-based physical-hazard indicators, display the strongest predictive associations with credit spreads, portfolio adjustments, collateral sensitivities, and market repricing. These measures possess properties demanded by internal modelling frameworks: clear units of measurement, time consistency, and observable channels affecting credit risk. In contrast, Social indicators generally have a more indirect connection to economic losses, often emerging through reputational or legal challenges. Governance, while closely tied to organizational qualities such as stability, transparency, and a strong risk culture, acts more as a moderator of policy execution than as a direct driver of financial loss. This asymmetry clarifies why environmental data are more readily incorporated into pricing and monitoring models, whereas PD/LGD frameworks remain cautious about integrating broad, composite ESG variables.
While Environmental metrics dominate both pricing and monitoring studies, the Social (S) pillar remains largely conceptual due to the limited availability of standardized, bank-relevant empirical measures. Social-risk variables, covering labour relations, community impacts, or human-rights controversies, are typically proxied through disclosure indices rather than direct exposures. Consequently, they enter risk models indirectly via reputational losses, litigation costs, or governance channels. A few studies link social controversies to higher short-term credit spreads, yet none demonstrate stable causal paths to defaults or recoveries. This operational limitation explains the weak and inconsistent S-pillar effects across studies, emphasizing the need for standardized, bank-relevant social metrics before meaningful model integration can occur.
A closer inspection of the empirical corpus clarifies these limitations. According to the reviewed studies, the Social (S) pillar is operationalized less consistently than environmental metrics and is frequently captured indirectly. Two families of measures dominate: (i) adverse social/conduct signals observable in the public domain (controversies, misconduct, mis-selling episodes), and (ii) vendor-provided S sub-dimensions (e.g., product responsibility, community and stakeholder engagement). This measurement diversity, together with cross-provider differences in scope and taxonomy, helps explain why S effects are typically weaker or more heterogeneous than E effects.
Empirical coverage is present but fragmented. Controversy-based measures (which often bundle S and G incidents) are used in European bank panels to test outcomes such as profitability and stability/risk exposure. Evidence is outcome-dependent: ESG-controversy exposure has been linked to higher profitability in European samples (Agnese et al., 2024b), while other work finds that controversies coincide with heightened risk (lower stability and/or higher RWAs), with strong governance structures mitigating the adverse risk channel (Del Sarto, 2025).
More purely social mechanisms are most clearly identified when measurement is closer to the underlying conduct and stakeholder channel. Consumer-based evidence shows that awareness of potentially irresponsible banking operations (e.g., mis-selling) affects reputation primarily through blame attribution (Zasuwa & Wesołowski, 2024). Complementarily, event-study evidence on detected misconduct (fines) documents statistically significant reputational losses and shows that banks’ overall ESG performance (particularly governance) can attenuate the penalty (Carretta et al., 2025).
Where disaggregated pillar dimensions are available, results at the S-subdimension level remain mixed: for instance, product-responsibility indicators may relate differently to accounting performance than operational environmental measures in some settings (Menicucci & Paolucci, 2023), and climate risk/opportunity awareness is associated with improvements in selected S-related practices (e.g., product responsibility, community and stakeholder engagement) (Rega et al., 2025). Overall, these studies suggest plausible transmission channels for credit and operational risk, but they have not yet been systematically mapped into PD/LGD or borrower-level default models in the current empirical corpus.
- What is measured: (a) controversy/misconduct incidence; (b) vendor S sub-scores such as product responsibility, community and stakeholder engagement; (c) consumer-perceived social irresponsibility and blame (Agnese et al., 2024a; Del Sarto, 2025; Zasuwa & Wesołowski, 2024; Rega et al., 2025; Menicucci & Paolucci, 2023; and Carretta et al., 2025).
- What outcomes are tested: profitability and market valuation; stability and risk exposure (e.g., Z-score, RWA); reputational losses around misconduct/fine events; and, more rarely, operational-risk proxies (Agnese et al., 2024b; Del Sarto, 2025; Menicucci & Paolucci, 2023; and Carretta et al., 2025).
- Why results remain mixed: S indicators are less standardized, often bundled with G in controversy datasets, and exhibit stronger context dependence (legal regimes, enforcement intensity, media salience, and bank business models).
To clarify how social risks are operationalized in the empirical banking literature and why findings remain heterogeneous, Table 4 summarizes the main families of Social (S) proxies, their typical measurement approaches, the outcomes tested, and the direction and consistency of the reported effects.
Table 4.
Operationalization of Social (S) Risk Metrics in Empirical Banking Studies.
Table 4 synthesizes evidence from the reviewed studies on social-risk measurement in banking. Social indicators are predominantly proxied through controversy data, misconduct events, vendor-provided sub-dimensions, or consumer-based perception measures. Across studies, effects are highly context-dependent and often operate through reputational, legal, or governance channels rather than through directly observable default or recovery mechanisms. The limited standardization of S metrics and frequent bundling with governance indicators constrain comparability and help explain the absence of stable links to PD/LGD outcomes.
Measurement heterogeneity represents a second source of the integration gap. ESG providers employ distinct methodologies, weighting schemes, and controversy treatments, introducing signal noise that frustrates stability and calibration requirements in risk models. Composite ESG scores are consistently weaker predictors of credit outcomes than narrowly defined environmental metrics. This discrepancy generates governance barriers, as boards and validation units reject variables with unstable, non-transparent, or provider-dependent behaviour. A limited number of studies explicitly compare results across ESG providers and find that methodological choices—weighting schemes, controversy treatment, or sectoral coverage—can alter both the direction and magnitude of risk effects. This suggests that some apparent inconsistencies reflect input variation rather than genuine economic disagreement, highlighting the need for transparent, auditable data-construction methods.
A third structural consideration is business-model heterogeneity and macro-financial conditions. Banks relying mainly on deposits with stable funding are better positioned to maintain lending to lower-risk, greener assets, even under stress. Banks dependent on market funding react more strongly to price movements and monetary-policy shocks, amplifying climate-related price premia during tighter conditions. However, this does not drive deeper integration of climate factors into core risk models; it reinforces reliance on market-driven risk adjustments. Institutional asymmetries therefore explain why pricing responds rapidly and uniformly, while costly, data-intensive model integration remains limited.
Supervisory practices also play a key role. Climate stress tests, thematic reviews, and ICAAP expectations encourage scenario-based overlays and qualitative governance assessments rather than full integration through production-level use tests. Supervisors require banks to measure and disclose exposures but stop short of mandating ESG factors to determine expected losses, risk-weighted assets, or capital buffers. Combined with data limitations and modelling challenges, this sustains a system where ESG risks are acknowledged, priced, and monitored but not fully integrated into core risk frameworks.
The present findings corroborate earlier results by Battiston et al. (2021) and Bunea et al. (2025), which also report observable ESG-related pricing premia in European credit markets alongside limited model-level integration. Evidence on transition-risk overlays aligns with European Central Bank (2024) stress-test outcomes, where climate factors were scenario inputs rather than model drivers. By contrast, this review diverges from some earlier conceptual work (e.g., Bunea et al., 2025), which anticipated faster integration of ESG indicators into prudential risk models. The persistence of this lag underscores the structural and data-governance constraints documented here.
The divergence between pricing responsiveness and model inertia mirrors patterns found outside Europe (e.g., Izcan & Bektas, 2022), but the European context exhibits a stronger regulatory and governance dimension. Whereas U.S. studies often link ESG scores directly to firm-level default probabilities, European research finds weaker and more heterogeneous effects, consistent with data fragmentation and supervisory emphasis on scenario analysis rather than use-test integration. These cross-regional contrasts reinforce the theoretical proposition that institutional and data-governance structures moderate ESG incorporation.
The deliberate 2020–2025 focus ensures alignment with the post–EU Taxonomy regulatory environment, the introduction of standardized sustainability disclosures, and the first supervisory climate stress tests conducted by European authorities. This period captures the phase in which ESG considerations became operationally relevant for bank risk management rather than remaining primarily disclosure-driven, allowing the review to assess integration under contemporary prudential expectations.
To assess whether this temporal focus materially affects the core conclusions, the findings of this review were benchmarked against pre-2020 empirical studies on ESG, sustainability, and bank credit risk. Earlier European and international evidence consistently documents ESG-related pricing effects, market-based repricing, and disclosure-driven reactions, but does not provide verifiable cases of ESG variables operating as first-order drivers within production PD or LGD models. Extending the review window backward would therefore likely reinforce—rather than weaken—the central conclusion that ESG integration has historically concentrated on pricing and supervisory overlays rather than on auditable model-level incorporation. The 2020–2025 focus thus reflects regulatory alignment rather than a truncation that biases conclusions on model integration.
The following section concludes the study by summarizing the key empirical findings and their broader implications for sustainable finance and prudential regulation.
6. Conclusions
This review demonstrates that, despite meaningful progress in ESG pricing, monitoring, and governance, European banks have not yet integrated ESG metrics into their core risk management models. Across 51 empirical studies published between 2020 and 2025, not a single contribution provides evidence that ESG factors operate as first-order drivers within production PD/LGD models, binding portfolio limits, or ICAAP/Pillar 2 capital frameworks. Instead, banks predominantly price ESG risks at origination, respond to market-salient disclosures, conduct scenario-based overlays for supervisory engagement, and strengthen internal governance mechanisms—yet these activities remain adjacent to, rather than embedded in, the architecture of prudential models.
These results extend earlier systematic reviews such as Buallay (2022), by explicitly distinguishing between pricing responsiveness and prudential model integration. Unlike prior work, this review applies a domain-based classification to reveal how ESG factors influence different layers of the risk-management process—pricing, monitoring, and governance—thereby clarifying the specific mechanisms that hinder full integration.
The persistence of this gap reflects structural and methodological constraints. Environmental indicators are decision-useful and auditable, but social metrics lack standardization and empirically validated links to financial losses. Inconsistencies across ESG data providers, limited geospatial detail for assessing physical risks, and the absence of reliable, proven causal relationships between ESG factors and default or recovery rates all make model integration difficult. These constraints interact with business-model heterogeneity and macro-financial conditions, which help explain why pricing adjusts rapidly while production-model revisions remain slow and uneven across institutions. Furthermore, supervisory frameworks have so far focused on scenario analysis and governance standards rather than mandating production-level model use tests. As a result, although markets respond strongly to climate-related information, internal risk models continue to rely on traditional predictors that do not incorporate ESG exposures in a systematic or enforceable way.
The implications for practice are straightforward. Banks seeking to transition from pricing to full integration need a concise, auditable set of environmental drivers, evidence from challenger models showing measurable improvements in predictive performance, and clear use tests that connect ESG factors to risk appetite, limits, and capital outcomes. Supervisors can help accelerate progress by setting minimum data standards, clarifying the distinction between overlays and integration, and ensuring consistency between scenario variables and model inputs. Meanwhile, data providers should deliver transparent, version-controlled metrics, forward-looking emissions data, and usable hazard rasters (gridded spatial datasets that capture environmental/physical risks as floods, wildfires, heat, or storms) that meet the standards required for sound model risk governance.
The paper also defines a forward agenda for research. Future work should build causal evidence linking ESG exposures to realized defaults and losses, produce public case studies documenting transitions from challenger to production models, and develop quantifiable social metrics anchored in operational and legal risk channels. Greater access to microdata, particularly credit-register datasets linked to emissions and hazard exposures, will be essential to support replication across jurisdictions. These advances will also help clarify how business models and monetary policy conditions shape the cyclical dynamics of ESG incorporation.
In conclusion, the European banking system exhibits a high degree of ESG awareness and ESG responsiveness, but not ESG integration. Until auditable, stable ESG drivers demonstrably improve predictive performance in production models and are tied to risk-appetite and capital frameworks, claims of widespread integration must be treated with caution. The distance between pricing and true integration remains substantial, but the pathway is now clearer: narrow the metric set, strengthen causal identification, formalize governance and capital linkages, and enable supervisory verification. Only then can ESG become a first-order component of prudential risk management rather than an externally applied overlay.
Overall, these findings indicate that the road from ESG-sensitive pricing to full model integration remains long but actionable. The next step is to translate these analytical insights into concrete guidance for practitioners. The following subsections therefore examine the implications for banks, supervisors, and data providers, before setting out a future research and policy agenda that concludes the study.
6.1. Implications
The findings from the empirical analysis, combined with the theoretical mechanisms and heterogeneity drivers examined earlier, have significant implications for banks, supervisors, and data providers. Together, these measures set out a forward-looking agenda for moving from a system focused mainly on ESG-based pricing and governance oversight toward a fully auditable, model-level integration where ESG variables function as first-order determinants in production PD/LGD models and are embedded into risk-appetite and ICAAP frameworks. The proposed recommendations maintain proportionality and align with established principles of risk management and model-risk governance.
6.1.1. Implications for Banks
Current evidence shows that European banks have made significant progress in developing sophisticated ESG-linked pricing mechanisms and governance frameworks. However, most have not yet integrated ESG factors into their core risk-modelling systems. A credible transition requires beginning with a concise and auditable set of Environmental drivers with clean data lineage. These include borrower- and portfolio-level financed-emissions intensity, NACE-aligned sectoral transition intensity, and location-based physical-hazard indicators capturing exposure to flood, heat, or wildfire risk. Governance structures should be regarded as moderators that enhance screening, disclosure reliability and data quality—not as primary determinants of credit losses.
These Environmental signals should be introduced as candidate variables in PD/LGD challenger models, with full transparency regarding discriminatory power (AUC, Gini coefficients), calibration behaviour (slopes, intercepts) and stability diagnostics (population-stability indices). Validation must rely on out-of-time samples and stress-period subsamples to account for potential non-linearities and crisis-window dynamics documented in the literature.
When challenger models show measurable improvements in predictive power, banks should proceed to formal use tests, operationalizing ESG variables as risk-appetite triggers through sectoral caps, loan-to-value (LTV) haircuts, tenor restrictions, and concentration thresholds. Decision frameworks may also incorporate pricing adjustments for borrowers with high environmental exposure or approval overrides for those lacking credible transition plans. Within the ICAAP, integration should clearly explain how ESG variables influence expected losses, risk-weighted assets (RWA), and capital buffer requirements under NGFS-aligned scenarios. This should ensure that ESG-specific effects are distinguished from broader macroeconomic influences and portfolio-composition factors. To meet Model Risk Management (MRM) standards, banks must maintain transparent data lineage, apply version control to vendor-supplied data, document imputation methods, and establish back-testing thresholds that trigger governance reviews or corrective actions.
At the workflow level, ESG factors can be embedded throughout the credit process. The origination stage can be standardized through ESG-linked pricing grids and mandatory data packs that include emissions data, transition-target credibility scores, and hazard indicators. Ongoing monitoring should incorporate early-warning signals that capture ESG-related changes, as well as covenants tied to borrowers’ transition plans. Collateral processes can incorporate hazard-adjusted haircuts and location-quality criteria. Strategic portfolio allocation can use sectoral tilts based on transition intensity and structured sell-down schedules for carbon-intensive assets. Progress should be traceable through clear KPIs covering three dimensions: model performance (metrics such as ΔAUC/ΔGini, calibration diagnostics), business coverage (share of exposures with asset-level geocoding, proportion of obligors with verified transition targets, exposures under ESG-linked constraints, and attribution of EL and RWA to ESG drivers), and governance quality (the extent to which variable compensation is tied to verified ESG outcomes and data-lineage issues are identified and corrected).
6.1.2. Implications for Supervisors
Supervisory authorities can accelerate convergence by clarifying integration criteria, defining minimal data expectations, and applying proportionality principles. Integration tests should require that ESG variables operate as first-order determinants within production PD/LGD models, evidenced through model-documentation files, internal validation reports, MRM approvals, and concrete use-test evidence such as limits, overrides, and exception logs. Regulators should promote consistency by standardizing a concise, auditable set of Environmental indicators such as financed-emission intensity (with clear measurement units), target-credibility taxonomies aligned with science-based frameworks, and hazard indicators with defined spatial detail. Data-quality matrices should also be incorporated into SREP submissions to ensure transparency and accountability.
Proportionality should differentiate expectations by business model and the materiality of its exposures. Enhanced comparability across institutions can be achieved through standardized disclosure templates indicating which ESG variables enter PD/LGD models, internal limits, and ICAAP processes. Climate stress-test submissions should include reconciliation notes mapping scenario variables to model drivers and capital impacts, distinguishing ESG-specific channels from macroeconomic shocks. Institutions relying exclusively on overlays should declare this explicitly. Public statements explaining where and how ESG variables influence production models could reinforce market discipline and reduce unsupported claims of integration.
6.1.3. Implications for Data Providers and Vendors
Data providers play a central role in reducing measurement heterogeneity, a primary barrier to integration. Providers should give methodological details such as feature construction, weighting, controversy treatment, estimation windows, supported by confidence indicators and version-controlled change logs suitable for model-risk archives. Environmental data should include verifiable financed-emissions series and transition-target credibility scores with durable identifiers and point-in-time stamps. Physical-risk datasets should be delivered as high-resolution hazard rasters (maps), complete with metadata on risk definitions, return periods, and spatial resolution, ideally accessible via API to support asset-level matching and auditability. Consistent naming conventions, measurement units, and data schemas across providers would go a long way toward reducing frictions in model adoption. Vendors can further support banks by supplying validation packages, including out-of-sample ROC curves and calibration diagnostics on benchmark portfolios, thereby facilitating timely challenger-model approval.
6.2. Future Research and Policy Agenda
To bridge the current gap in ESG integration, it is essential to develop a clear, actionable roadmap for moving from superficial ESG-related pricing adjustments to full, model-level integration. In the short term, empirical work should prioritize feasible, near-term innovations that can accelerate progress.
Future empirical research must focus on establishing causal relationships between ESG exposures and realized credit defaults or loss outcomes. Causal-inference methodologies such as regression discontinuity, instrumental variable techniques, and exogenous exposure shifts should be employed to test these relationships. The research agenda should focus on actionable case studies that document the full model-integration process, from data collection and model design to post-implementation validation. This will help banks and supervisors better understand how ESG factors can be integrated into risk models. Clear audit trails documenting the evolution of models from testing to production and assessing their performance and capital impacts will be invaluable for practitioners.
The Social pillar of ESG still requires substantial development. Researchers should focus on defining practical, bank-relevant S-metrics, such as labour violations, safety incidents, and community harm, and examining how these factors lead to financial losses through increased operational costs or default and loss rates. This will help address the current conceptual gaps and provide banks with more actionable metrics for social risks. Additionally, improving data granularity—especially through geocoding of exposures in mortgages, real estate, and SMEs—will allow for better modelling of how physical risks impact collateral values and highlight potential location biases. Future research should also perform controlled comparisons using multiple ESG-data providers on identical bank or loan samples to quantify how provider-specific methodologies influence reported risk relationships.
A more detailed exploration of business-model heterogeneity is needed. Banks that rely on stable, deposit-based funding may respond to ESG risks differently compared to those with market-based funding, especially during stress periods. Moreover, monetary policy—particularly contractionary policies—tends to widen climate-related risk spreads, which can delay full ESG integration. Research should explore the cyclical dynamics of ESG incorporation, emphasizing how these dynamics affect different types of banks. One key practical step could be the development of an “ESG Integration Note” within banks’ risk disclosures, specifying which ESG factors are embedded in PD or LGD models, how they are validated, and how they link to the ICAAP. The Newcastle–Ottawa Scale could be adapted to assess whether ESG integration is truly operational, validated, and capital-relevant—helping distinguish genuine integration from superficial overlays.
While this review focuses on studies from 2020 to 2025, research from before this period—prior to the introduction of standardized climate disclosure frameworks—could provide valuable insights into long-term dynamics of ESG integration. Extending the temporal window in future research would allow for the analysis of persistence, structural changes, and regulatory learning effects across multiple decades, offering a broader perspective on the evolution of ESG in financial risk modelling. Future systematic reviews could therefore extend the temporal coverage to include pre-2020 studies, enabling a longitudinal comparison of ESG integration trajectories before and after the EU-Taxonomy and CSRD frameworks.
Taken together, these priorities point toward a clear roadmap for Europe’s banking sector: moving from surface-level pricing and supervisory overlays toward fully transparent, evidence-based ESG integration within core risk-modelling frameworks. In practical terms, short-term progress will depend on a sequence of feasible innovations rather than an overhaul of existing risk models. In the immediate term, three innovations are critical: developing and adopting unified ESG taxonomies and machine-readable formats for standardizing ESG data reporting and integration; embedding a limited set of auditable environmental indicators, such as financed emissions and hazard exposures, into supervisory stress-test overlays as an interim step toward full PD/LGD integration; and upgrading existing model-validation practices to handle climate scenario variables, ensuring that ESG metrics contribute effectively to risk models. These actions align with ongoing efforts from regulatory bodies such as the ECB and EBA, offering a realistic pathway for advancing ESG-risk integration without requiring immediate, large-scale model redesign.
Author Contributions
Conceptualization, E.K.Z. and R.H.; methodology, E.K.Z. and R.H.; formal analysis, E.K.Z., A.G.C. and R.H.; investigation, E.K.Z. and A.G.C.; resources, R.H.; data curation, E.K.Z. and R.H.; writing—original draft preparation, E.K.Z., A.G.C. and R.H.; writing—review and editing, E.K.Z. and R.H.; visualization, E.K.Z.; supervision, E.K.Z.; project administration, A.G.C.; funding acquisition, E.K.Z. All authors have read and agreed to the published version of the manuscript.
Funding
This research received no external funding.
Institutional Review Board Statement
Not applicable.
Informed Consent Statement
Not applicable.
Data Availability Statement
All data are included in the paper.
Acknowledgments
During the preparation of this manuscript/study, the author(s) used GPT-5 Mini for the purposes of enriching and organization of the text. The authors have reviewed and edited the output and take full responsibility for the content of this publication.
Conflicts of Interest
The authors declare no conflicts of interest.
Appendix A. Study-Level Extraction Details
Appendix A provides the study-level extraction details used in the systematic review, including both a summary subset of illustrative studies (Table A1) and the full extraction matrix for all 51 empirical studies (Table A2). This ensures transparency, replicability, and comparability across studies.
Appendix A.1. Summary of Key Study Characteristics
Table A1 provides a summary of key characteristics for a subset of empirical studies included in the review. Variables extracted include metadata, methodological approach, ESG constructs, risk outcomes, and assigned application domains (pricing and allocation; monitoring and stress testing; governance and management-control systems).
Table A1.
Summary of Key Study Characteristics (Subset of Studies).
Table A1.
Summary of Key Study Characteristics (Subset of Studies).
| Study | Country/Sample | Period | Methods | ESG Constructs | Risk Outcomes | Application Domain | Main Findings |
|---|---|---|---|---|---|---|---|
| A1 | Euro Area Banks | 2010–2022 | Loan-level panel regression | Financed emissions, SBTi targets | Loan spreads, allocation | Pricing & Allocation | Higher emissions → higher loan premia; credible transition targets → discounted pricing |
| A2 | EU Banks | 2015–2021 | Event Study | Climate disclosure indicators | CDS spreads, abnormal returns | Pricing & Allocation | Climate-stress-test announcements widen CDS spreads for exposed banks |
| A3 | EU Large Banks | 2014–2020 | NGFS scenario modelling | Emissions, NACE transition intensity | Capital impacts, losses | Monitoring & Stress Testing | Losses concentrated in high-emission sectors; mainly overlay effects |
| A4 | European Mortgage Portfolios | 2010–2020 | Geospatial overlay | Flood/heat/wildfire hazard | Collateral valuation, LGD | Monitoring & Stress Testing | Hazard exposure predicts collateral haircuts; not integrated into PD/LGD |
| A5 | European Banks | 2012–2021 | Governance modelling | Board diversity, ESG committees | Z-scores, RWAs, controversies | Governance & MCS | Governance moderates oversight but does not drive PD/LGD models |
Appendix A.2. Full Study-Level Extraction Matrix
Table A2 presents the complete extraction matrix for all 51 empirical studies included in the systematic review. For each study, the matrix reports:
- Bibliographic and sample information (authors, publication year, country, bank type, and sample period)
- Empirical methods and identification strategies employed
- ESG constructs analyzed (composite scores, pillar-specific metrics, emissions indicators, controversies, and hazard exposure)
- Risk outcomes measured (credit, market, systemic, operational, and reputational)
- Assigned application domain (pricing and allocation, monitoring and stress testing, and governance and management-control systems)
This comprehensive framework ensures transparency, replicability, and comparability across studies.
Table A2.
Full Study-Level Extraction Matrix for the 51 Empirical Studies Included in the Review.
Table A2.
Full Study-Level Extraction Matrix for the 51 Empirical Studies Included in the Review.
| Study ID | Authors (Year) | Country/Region | Bank Type | Sample Size/Period | Methodology | ESG Constructs | Risk Outcomes | Domain | Key Findings | NOS |
|---|---|---|---|---|---|---|---|---|---|---|
| A1 | Agbodgi et al. (2022) | Europe-wide | Listed banks | 2022–2024 EU banks | Event study + OLS | ΔCDS (short/medium); ESG E-pillar | Transition & market (default-risk repricing) | Monitoring–Stress | Disclosure → ↑ CDS; ESG did not shield (sometimes more penalty for high-ESG). | 5★ |
| A2 | Agnese et al. (2023) | Europe-wide | European banks | 2012–2021 61 EU banks | Dynamic panel (GMM) | Board size/diversity; ESG committees/incentives; controversies | Reputational/governance | Governance–MCS | Larger/diverse boards, ESG incentives/committee → fewer controversies. | 8★ |
| A3 | Agnese et al. (2024a) | Europe-wide | Listed banks | 2014–2022, 115 banks | GMM two-step | Board knowledge (cultural/industry/financial) vs. ESG | Governance/operational | Governance–MCS | Board knowledge ↑ ESG performance. | 8★ |
| A4 | Agnese et al. (2024b) | Europe-wide | European banks | 2015–2022, EU banks | SYS-GMM | ESG controversies; ROA/ROE/NIM | Profitability/reputational | Governance–MCS | More controversies ↔ higher profitability (opportunism). | 8★ |
| A5 | Akyildirim et al. (2024) | Europe-wide | European banks | 2007–2023, 11.832 CSI events | Event study + volatility | ARs; volatility; deposits; severity/novelty | Reputational/market/liquidity | Monitoring–Stress | CSI news → neg. ARs & ↑ volatility; strong ESG buffers; deposit instability magnifies. | 6★ |
| A6 | Algeri et al. (2025) | Europe-wide | Listed EU banks | 2006–2021, 42 listed banks | Stochastic Frontier Approach | Cost frontier with ESG output; controversies; ESG-linked pay | Operational/efficiency | Governance–MCS | ESG ↑ long-run cost efficiency; controversies ↑ costs; ESG-linked pay ↓ efficiency. | 8★ |
| A7 | Basile et al. (2025) | Europe-wide | European banks | 2017–2020, 472 eu banks | GLS panel | Diversity, independence, diligence, CSR committee | Governance/operational | Governance–MCS | Those traits ↑ ESG score. | 2★ |
| A8 | Bellinvia et al. (2025) | European economic area | European banks | 2019Q3–2023Q2, 102 eu banks | Panel models | CTR, CPR, total climate risk vs. NPL/PD | Credit | Pricing/Allocation | Transition & physical risk ↑ credit risk. | 8★ |
| A9 | Ben Abdallah et al. (2020) | Europe-wide | European banks | 2006–2016, 12 banks | Causality tests | SPI; soundness index | Prudential/soundness | Governance–MCS | Soundness→CSR; CSR→lower soundness (net). | 8★ |
| A10 | Bouattour et al. (2024) | Europe-wide | European banks | 2005–2022, European banks | Regime-switching (PSTAR) | ESG scores; ICT diffusion; failure risk | Default/systemic | Governance–MCS | Higher ESG ↓ failure risk (non-linear); low/moderate ESG may not offset tech fragility. | 8★ |
| A11 | E. Bruno et al. (2024) | Europe-wide | Listed banks | 2002–2020, European listed banks | IV + fractional logit | NPL ratio; ESG total, G, controversies | Credit (loan loss) | Pricing/Allocation | Higher ESG associated with higher NPLs; driven by G & controversies. | 9★ |
| A12 | M. Bruno and Lagasio (2021) | Europe-wide | European banks | EU and national frameworks | Policy review | NFRD/CSRD; EBA/ECB guidance | Regulatory/compliance | Governance–MCS | Regulation integrates ESG in risk mgmt/disclosure; national diffs remain. | 0★ |
| A13 | Bunea et al. (2025) | Europe-wide | European banks | 2020–2023, 76 EU banks | Panel OLS | ROA, ROE, EBITDA/TA; ESG & pillars; leverage, NPLs | Operational/strategic | Governance–MCS | Higher ESG ↔ higher ROA/ROE; G negative for ROA, can ↑ ROE. | 6★ |
| A14 | Caporale et al. (2025) | Europe-wide | European banks | 2000–2021, European banks | System GMM (dynamic panel) | Z-score; adjusted GHG growth; GDPpc, CPI, DCPS, WUI, WGI | Transition & physical (systemic) | Monitoring–Stress | Higher emissions growth → lower Z-scores; governance quality interacts with climate risk; EU ≠ non-EU. | 7★ |
| A15 | Carretta et al. (2025) | Europe-wide | Listed European banks | 2009–2022, 39 European banks | Event study | ARs around sanctions; ESG & G scores | Reputational/market | Governance–MCS | EU domestic sanctions → larger losses; high ESG—esp. G—mitigates. | 9★ |
| A16 | Chen et al. (2025) | Europe-wide | Listed European banks | 2019–2023, 106 European banks | Ordered logit | Moody’s/S&P/Fitch ratings; ESG pillars & controversies | Credit (ratings) | Governance–MCS | Environmental pillar improves ratings; S,G mixed; controversies mixed. | 8★ |
| A17 | Chiaramonte et al. (2022) | Europe-wide | European banks | 2005–2017 | Panel + DiD | Distance-to-Default; ESG pillars; disclosure duration | Default/systemic | Pricing/Allocation | ESG reduces fragility; longer disclosure → stronger benefits. | 8★ |
| A18 | Chiaramonte et al. (2024) | Europe-wide | European banks | 2020, European banks | Panel + interactions | CDS spreads; ESG E,S; pandemic panic | Market/credit | Pricing/Allocation | Higher ESG (E,S) hedged risk at peak; panic mediates. | 8★ |
| A19 | Cucinelli et al. (2024) | Europe-wide | Listed European banks | 2008–2021, 102 listed banks | Panel; QNE around Paris Agreement | Env. strategy; RM sophistication; governance | Transition/operational | Governance–MCS | Strong RM & E-oriented governance → more C&E strategy. | 5★ |
| A20 | Danisman and Tarazi (2024) | Europe- wide | Listed European banks | 2002–2020, 83 listed European banks | SYS-GMM; IV; DiD | Loan growth; risk/profitability/funding; ESG | Credit, liquidity, market | Pricing/Allocation | High-ESG banks cut lending less in crises; channel via risk & funding; mainly E pillar, GFC. | 9★ |
| A21 | Del Sarto (2025) | Europe-wide | European banks | 2013–2020, 88 European banks | SYS-GMM | Z-score, RWAs; ESG controversies; board traits | Reputational, governance | Governance–MCS | Fewer controversies → ↑ Z-score, ↓ RWAs; strong boards mitigate. | 9★ |
| A22 | Di Tommaso and Thornton (2020) | Europe-wide | European banks | 2007–2018, European banks | Panel OLS | ESG total; board traits; risk; Tobin’s Q | Market/valuation; risk-taking | Governance–MCS | Higher ESG ↓ risk-taking but ↓ value; board traits matter. | 8★ |
| A23 | Dou et al. (2025) | Europe-wide | European banks | 2018–2021, European banks | Panel | Financed emissions; controversies; P/B; residual income | Market/valuation | Monitoring–Stress | Higher financed emissions & controversies ↓ valuations. | 8★ |
| A24 | European Central Bank (2024) | Europe- wide | European banks | 2018Q3–2022Q4 | Panel; high-freq MP shocks | Loan premia; decarb commitments; lending volumes | Transition (policy/market); credit | Pricing/Allocation | Higher rates to high emitters; discounts to firms with targets; tightening ↑ climate premia & cuts lending to emitters. | 6★ |
| A25 | Ferretti et al. (2024) | Italy | 3 major Italian groups | 3 major Italian groups; 12 interviews + docs | Multiple-case | MCS package (planning, cybernetic, reward, admin, cultural) | Governance/operational | Governance–MCS | Broad ESG integration across MCS (except action planning). | 4★ |
| A26 | Fichera et al. (2025) | Europe-wide | European banks | 2015–2023, European banks | Panel of green lending | Green lending vs. country env. performance; sector mix | Transition (credit/systemic) | Governance–MCS | Misalignment driven by country/sector; need macroprudential tools. | 8★ |
| A27 | Fiordelisi et al. (2023) | Europe-wide | European banks | 2015–2021, 447 European banks | Panel | Env. engagement; NCSKEW, DUVOL | Market (crash) | Monitoring–Stress | Engagement lowers future crash risk via transparency. | 9★ |
| A28 | Fiordelisi et al. (2025) | Europe-wide | European listed banks | 2022, European listed banks | Event study | Abnormal returns; branch geo-exposure to hazards | Market/valuation | Monitoring–Stress | Negative ARs; more negative with high physical-risk exposure. | 7★ |
| A29 | Gurol and Lagasio (2023) | Europe-wide | European banks | 35 EURO STOXX, 600 banks | Panel | ESG/E/S disclosure; board size; women & independent ratios; profitability. | Governance/operational; reputational | Pricing/Allocation | Larger boards + higher women & independent ratios → higher ESG/E/S disclosure; disclosure ↔ profitability. | 8★ |
| A30 | Guth et al. (2021) | Austria | Austrian banking sector | Austrian banking sector; recent years pre-2022; scenarios | Top-down/Bottom-up ST | PD, LGD, NPLs; capital adequacy | Transition (credit/market) | Monitoring–Stress | Carbon price shocks ↑ credit risk & capital needs; heterogeneous impact. | 6★ |
| A31 | Hess (2022) | Europe-wide | European banks | - | Practitioner overview | Physical vs. transition channels; tools; capital | Regulatory/compliance | Monitoring–Stress | Voluntary action insufficient; supervisors may add capital measures. | 0★ |
| A32 | Horobet et al. (2025) | Europe-wide | European banks | 2014–2023, 61 European banks | Panel | ROE, beta; ESG pillars | Market/valuation; risk | Monitoring–Stress | Higher overall ESG → lower ROE & beta; E,S ↑ ROE and ↓ beta; G ↓ ROE. | 8★ |
| A33 | Hummel et al. (2021) | Europe-wide | European banks | 50 European banks | Survey + PLS-SEM | Strategy type; external E&S performance | Operational/governance | Monitoring–Stress | Proactive strategy → topic mgmt drives E&S performance; risk-mgmt path NS. | 9★ |
| A34 | Ielasi et al. (2023) | Europe-wide | European banks | Significant EU banks (SSM) | Index construction + application | Direct & indirect ESG indicators | Reputational/regulatory | Governance–MCS | Gaps in Social/Indirect; heterogeneity penalized; holistic measure. | 2★ |
| A35 | Izcan and Bektas (2022) | Europe-wide | European banks | 2002–2019, 31 European banks | Quantile regression | TR ESG; idiosyncratic volatility | Market (idiosyncratic) | Monitoring–Stress | ESG (E & G) reduce risk at medium-high quantiles; S ns. | 8★ |
| A36 | La Torre et al. (2024) | Italy | Italian banks | Italian banks | Mixed methods | Distance to legal benchmark; sustainable lending | Regulatory/compliance | Governance–MCS | Short of full compliance but improving. | 2★ |
| A37 | La Torre et al. (2021) | Europe-wide | European banks | 2008–2019, STOXX Europe 600 banks | Panel | ESGP vs. CFP (ROA, ROE, Tobin’s Q, EVA) | Strategic/regulatory | Governance–MCS | Authorities’ push dominates market incentives at early stage. | 2★ |
| A38 | Lamanda and Tamásné Vőneki (2024) | Europe-wide | European banks | 2017–2021, 26 European banks | Content + panel | Disclosure vs. size, CAR, perf. | Operational/strategic | Governance–MCS | No direct perf. link; size & capital ↑ disclosure; E improves post-2019. | 5★ |
| A39 | Lamanda and Tamásné (2025) | Europe-wide | European banks | 2017–2023, 26 European banks | Content + panel | ESG disclosure index; macro depth; GDP | Systemic/strategic | Governance–MCS | ESG performance − with financial depth; + with GDP; lagging risk frameworks. | 9★ |
| A40 | Liang et al. (2024) | Europe-wide | European banks | 2010–2020, Western European Banks | SFA | E,S,G activities; bank traits; efficiency | Operational/efficiency | Governance–MCS | E,S,G activities ↑ cost efficiency. | 0★ |
| A41 | López-Penabad et al. (2023) | Europe-wide | European banks | 2011–2019, 108 European banks | DEA + double-bootstrap | Efficiency vs. CSP pillars | Operational/efficiency | Governance–MCS | U-shaped CSP–efficiency; E ns; S,G non-linear. | 8★ |
| A42 | Lupu et al. (2022) | Europe-wide | European listed banks | 79 European listed banks; daily to annual, 2010s | Cross-quantilogram | CoVaR, ΔCoVaR, MES vs. ESG pillars | Systemic (tail) | Monitoring–Stress | Significant dependence across quantiles; pillar-specific effects; tail-risk link. | 8★ |
| A43 | Menicucci and Paolucci (2023) | Europe-wide | European banks | 2016–2020, 105 European banks | Panel | 10 ESG dims; ROA/ROE/market | Operational/market | Governance–MCS | Overall ESG negative; emissions/waste positive; product responsibility hurts accounting perf. | 8★ |
| A44 | Samaniego-Medina and Giráldez-Puig (2022) | Europe-wide | European banks | 2011–2020, 65 European banks | Ordered logit; ATT | Credit ratings; controversy indicators | Reputational & credit | Governance–MCS | Controversies ↓ ratings/upgrade odds. | 6★ |
| A45 | Palmieri et al. (2024) | Europe-wide | European banks | 2013–2022, 639 European banks | Random effects; 2SLS, Arellano | Default probability; ENV/SOC/GOV; BBM classes | Default/solvency | Pricing/Allocation | ENV lowers default risk for wholesale/retail; investment banks benefit most from strong G. | 9★ |
| A46 | Rega et al. (2025) | Europe-wide | European banks | 2013–2022, European banks | SYS-GMM; Heckman | Refinitiv S & G sub-scores; CCRO | Governance & social | Governance–MCS | Climate awareness ↑ S & G (product responsibility, community, stakeholder engagement, management). | 8★ |
| A47 | Schreiner and Beyer (2024) | Europe-wide | European banks | 2020–2023, Sis (treated) vs. LSIs (control) | DiD | Climate-risk mgmt metrics; green bonds/AUM/lending | Regulatory/transition | Governance–MCS | Supervision improved climate-risk mgmt & increased green finance among SIs. | 9★ |
| A48 | Schütze and Sandbaek (2025) | Europe-wide | - | EU regime (Art.8) | Policy analysis | Eligibility, alignment, GAR; costs/data | Regulatory/compliance | Governance–MCS | Useful framework vs. greenwashing; challenges persist; simplifications pending. | 0★ |
| A49 | Vrontis et al. (2023) | Europe-wide | European banks | European banks | Conceptual/evidence | Credit-quality channels | Credit (transition) | Pricing/Allocation | Opportunities via reallocation & tools; need data/metrics. | 8★ |
| A50 | Wang and Liu (2025) | Europe-wide | European banks | 2019–2024, 26 European banks | mLSTM-CoVaR; Q-on-Q | CoVaR; satellite physical-risk; investor attention | Systemic (physical) | Monitoring–Stress | Physical risk ↑ systemic risk; attention amplifies; stronger in COVID/RU-UA. | 9★ |
| A51 | Zasuwa and Wesołowski (2024) | Poland | Polish banks | Polish banks | Survey/experiment (SEM) | Reputation; attribution types; response strategies | Reputational | Governance–MCS | Irresponsibility ↓ reputation; transparent remedial actions mitigate. | 8★ |
Complete extraction matrix for all 51 empirical studies, detailing bibliographic info, sample characteristics, methods, ESG constructs, risk outcomes, and application domains.
Appendix B
This appendix reports the complete NOS scoring for each study, including selection validity, comparability, and outcome measurement. It identifies studies classified as low, moderate, or high risk of bias, and excludes qualitative or policy-oriented studies for which the NOS instrument is not appropriate.
Table A3.
Newcastle–Ottawa Scale (NOS) Risk-of-Bias Summary (Adapted for Banking/ESG Studies).
Table A3.
Newcastle–Ottawa Scale (NOS) Risk-of-Bias Summary (Adapted for Banking/ESG Studies).
| ID | Selection (0–4★) | Comparability (0–2★) | Outcome (0–3★) | Total (0–9★) | Risk Category | Explanation |
|---|---|---|---|---|---|---|
| 1 | 3 | 2 | 3 | 8 | Low | Strong representativeness; clear ESG measurement; robust event windows |
| 2 | 2 | 1 | 2 | 5 | Moderate | Limited comparability; ESG construct ambiguous |
| 3 | 4 | 2 | 2 | 8 | Low | High-quality selection; strong controls |
| 4 | 2 | 2 | 2 | 3 | High | Weak temporal ordering; contamination risk |
| 5 | N/A | N/A | N/A | N/A | Qualitative | Policy-oriented; not scored |
References
- Agbodgi, A., Nys, E., & Paimanova, V. (2022). Climate threats to bank default risk and financial stability: Any market concern about the ECB 2022 climate risk stress test? [Working paper]. Université de Limoges. [Google Scholar]
- Agnese, P., Arduino, F. R., Cerciello, M., & Taddeo, S. (2024a). Does board knowledge matter for ESG performance in the European banking industry? Corporate Social Responsibility and Environmental Management, 31(5), 4454–4468. [Google Scholar] [CrossRef]
- Agnese, P., Cerciello, M., Giacomini, E., & Taddeo, S. (2023). Environmental, social and governance controversies: The role of European bank boards. Management Decision, 61(12), 3739–3754. [Google Scholar] [CrossRef]
- Agnese, P., Cerciello, M., Oriani, R., & Taddeo, S. (2024b). ESG controversies and profitability in the European banking sector. Finance Research Letters, 61, 105042. [Google Scholar] [CrossRef]
- Akyildirim, E., Corbet, S., Ongena, S. R. G., & Staunton, D. (2024). Understanding reputational risks: The impact of ESG events on European banks. SSRN. [Google Scholar] [CrossRef]
- Algeri, C., Brighi, P., & Venturelli, V. (2025). Integrating ESG factors into cost-efficiency frontier: Evidence from the European listed banks. Business Strategy and the Environment, 34(3), 3242–3270. [Google Scholar] [CrossRef]
- Basile, V., Serino, L., D’Ambra, A., & Campanella, F. (2025). Board characteristics and effects on ESG performance: Empirical evidence from the European banking system. Quality & Quantity. [Google Scholar] [CrossRef]
- Battiston, S., Dafermos, Y., & Monasterolo, I. (2021). Climate risks and financial stability. Journal of Financial Stability, 54, 100867. [Google Scholar] [CrossRef]
- Bellinvia, A., Venturelli, V., Brighi, P., & Algeri, C. (2025). Weathering the storm: How climate risks shape bank credit risk in European banks. Finance Research Letters, 81, 107511. [Google Scholar] [CrossRef]
- Ben Abdallah, S., Saïdane, D., & Ben Slama, M. (2020). CSR and banking soundness: A causal perspective. Business Ethics: A European Review, 29(4), 706–721. [Google Scholar] [CrossRef]
- Bouattour, A., Kalai, M., & Helali, K. (2024). The non-linear relationship between ESG performance and bank stability in the digital era: New evidence from a regime-switching approach. Humanities and Social Sciences Communications, 11(1), 1445. [Google Scholar] [CrossRef]
- Bruno, E., Iacoviello, G., & Giannetti, C. (2024). Bank credit loss and ESG performance. Finance Research Letters, 59, 104719. [Google Scholar] [CrossRef]
- Bruno, M., & Lagasio, V. (2021). An overview of the European policies on ESG in the banking sector. Sustainability, 13(22), 12641. [Google Scholar] [CrossRef]
- Buallay, A. (2022). Sustainability reporting and retail sector performance: Worldwide evidence. International Review of Retail, Distribution and Consumer Research, 32(3), 311–330. [Google Scholar] [CrossRef]
- Bunea, M., Hategan, C. D., Blidisel, R. G., & Bigioi, A. D. (2025). Adaptation of banks to sustainability requirements and impact on their financial performance. Amfiteatru Economic, 27(70), 771–787. [Google Scholar] [CrossRef]
- Caporale, G. M., Sova, A. D., & Sova, R. (2025). Climate risk and financial stability: Some panel evidence for the European banking sector [Working paper]. CESifo GmbH. [Google Scholar]
- Carretta, A., Schwizer, P., & Soana, M. G. (2025). Reputational damage of bank misconduct: The role of regulation and ESG performance. Financial Review, 60(4), 1359–1387. [Google Scholar] [CrossRef]
- Chen, S.-L., Wang, D., & Chen, H.-W. (2025). The impact of ESG factors on credit ratings: An empirical study of European banks. International Review of Economics & Finance, 99, 104056. [Google Scholar] [CrossRef]
- Chiaramonte, L., Dreassi, A., Girardone, C., & Piserà, S. (2022). Do ESG strategies enhance bank stability during financial turmoil? Evidence from Europe. The European Journal of Finance, 28(12), 1173–1211. [Google Scholar] [CrossRef]
- Chiaramonte, L., Dreassi, A., Girardone, C., & Piserà, S. (2024). Socially responsible banking: Weathering the COVID-19 storm. Journal of International Financial Markets, Institutions and Money, 95, 102029. [Google Scholar] [CrossRef]
- Cucinelli, D., Nieri, L., & Piserà, S. (2024). Climate and environment risks and opportunities in the banking industry: The role of risk management. International Journal of Finance & Economics, 31(1), 1169–1185. [Google Scholar] [CrossRef]
- Danisman, G. O., & Tarazi, A. (2024). ESG activity and bank lending during financial crises. Journal of Financial Stability, 70, 101206. [Google Scholar] [CrossRef]
- Del Sarto, N. (2025). Corporate governance and ESG controversies: Navigating risk-taking in banks. Business Strategy and the Environment, 34(4), 4541–4560. [Google Scholar] [CrossRef]
- Di Tommaso, C., & Thornton, J. (2020). Do ESG scores affect bank risk taking and value? Evidence from European banks. Corporate Social Responsibility and Environmental Management, 27(5), 2286–2298. [Google Scholar] [CrossRef]
- Dou, J., Mirza, N., Umar, M., & Horobet, A. (2025). ESG uncertainties and valuation implications: Evidence from the EU banking sector. Research in International Business and Finance, 76, 102872. [Google Scholar] [CrossRef]
- European Central Bank. (2024). Climate risk, bank lending and monetary policy. Publications Office of the European Union. [Google Scholar] [CrossRef]
- Ferretti, P., Gonnella, C., & Martino, P. (2024). Integrating sustainability in management control systems: An exploratory study on Italian banks. Meditari Accountancy Research, 32(7), 1–34. [Google Scholar] [CrossRef]
- Fichera, L., Galletta, S., & Mazzù, S. (2025). Climate transition challenges: Exploring credit portfolio misalignment in European banks. Business Strategy and the Environment, 34(8), 10118–10130. [Google Scholar] [CrossRef]
- Fiordelisi, F., Ricci, O., & Santilli, G. (2023). Environmental engagement and stock price crash risk: Evidence from the European banking industry. International Review of Financial Analysis, 88, 102689. [Google Scholar] [CrossRef]
- Fiordelisi, F., Ricci, O., & Santilli, G. (2025). Spotlight on physical risk: Assessing the banks’ stock reaction to the ECB climate stress test. International Review of Financial Analysis, 98, 103882. [Google Scholar] [CrossRef]
- Gurol, B., & Lagasio, V. (2023). Women board members’ impact on ESG disclosure with environmental and social dimensions: Evidence from the European banking sector. Social Responsibility Journal, 19(1), 211–228. [Google Scholar] [CrossRef]
- Guth, M., Hesse, J., Königswieser, C., Krenn, G., Lipp, C., Neudorfer, B., & Weiss, P. (2021). OeNB climate risk stress test: Modeling a carbon price shock for the Austrian banking sector. Financial Stability Report, 42, 27–45. [Google Scholar]
- Hess, P. (2022). The supervision and regulation of climate risks for banks: Overview from the perspective of a European practitioner. Green Finance, 4(3), 295–309. [Google Scholar] [CrossRef]
- Horobet, A., Rahat, B., Floarea, A.-M., & Belascu, L. (2025). Green banks, golden returns? Unraveling the ESG–financial performance nexus in European banking. Review of Accounting and Finance, 24(3), 259–285. [Google Scholar] [CrossRef]
- Hummel, K., Laun, U., & Krauss, A. (2021). Management of environmental and social risks and topics in the banking sector: An empirical investigation. British Accounting Review, 53(1), 100921. [Google Scholar] [CrossRef]
- Ielasi, F., Bellucci, M., Biggeri, M., & Ferrone, L. (2023). Measuring banks’ sustainability performances: The BESGI score. Environmental Impact Assessment Review, 102, 107216. [Google Scholar] [CrossRef]
- Izcan, D., & Bektas, E. (2022). The relationship between ESG scores and firm-specific risk of Eurozone banks. Sustainability, 14(14), 8619. [Google Scholar] [CrossRef]
- Krueger, P., Sautner, Z., & Starks, L. T. (2020). The importance of climate risks for institutional investors. Review of Financial Studies, 33(3), 1067–1111. [Google Scholar] [CrossRef]
- Lamanda, G., & Tamásné, Z. V. (2025). Is banks’ ESG disclosure associated with financial depth and economic growth? Evidence from the Visegrad Four countries. Environmental Development, 55, 101233. [Google Scholar] [CrossRef]
- Lamanda, G., & Tamásné Vőneki, Z. (2024). Is ESG disclosure associated with bank performance? Evidence from the Visegrad Four countries. Management of Environmental Quality, 35(1), 201–219. [Google Scholar] [CrossRef]
- La Torre, M., Bittucci, L., Paccione, C., & Palma, A. (2024). Evaluating the sustainability profile of banks: A comprehensive benchmarking analysis in the Italian context. Business Strategy and the Environment, 33(4), 3654–3668. [Google Scholar] [CrossRef]
- La Torre, M., Leo, S., & Panetta, I. C. (2021). Banks and environmental, social and governance drivers: Follow the market or the authorities? Corporate Social Responsibility and Environmental Management, 28(6), 1620–1634. [Google Scholar] [CrossRef]
- Liang, L., Lin, T., & Chung, M. (2024). The impact of ESG on the cost efficiency of commercial banks: Evidence from Western European commercial banks. Managerial and Decision Economics, 45(8), 5811–5824. [Google Scholar] [CrossRef]
- López-Penabad, M. C., Iglesias-Casal, A., Neto, J. F. S., & Maside-Sanfiz, J. M. (2023). Does corporate social performance improve bank efficiency? Evidence from European banks. Review of Managerial Science, 17(4), 1399–1437. [Google Scholar] [CrossRef]
- Lupu, I., Hurduzeu, G., & Lupu, R. (2022). How is the ESG reflected in European financial stability? Sustainability, 14(16), 10287. [Google Scholar] [CrossRef]
- Menicucci, E., & Paolucci, G. (2023). ESG dimensions and bank performance: An empirical investigation in Italy. Corporate Governance: The International Journal of Business in Society, 23(3), 563–586. [Google Scholar] [CrossRef]
- Palmieri, E., Ferilli, G. B., Altunbas, Y., Stefanelli, V., & Geretto, E. F. (2024). Business model and ESG pillars: The impacts on banking default risk. International Review of Financial Analysis, 91, 102978. [Google Scholar] [CrossRef]
- Rega, F. G., Russo, S., & Salerno, D. (2025). Disentangling the S and the G in the European banking industry: The role of climate risk and opportunity awareness. Research in International Business and Finance, 77, 102977. [Google Scholar] [CrossRef]
- Samaniego-Medina, R., & Giráldez-Puig, P. (2022). Do sustainability risks affect credit ratings? Evidence from European banks. Amfiteatru Economic, 24(61), 720–738. [Google Scholar] [CrossRef]
- Schreiner, L., & Beyer, A. (2024). The impact of ECB banking supervision on climate risk and sustainable finance. SSRN. [Google Scholar] [CrossRef]
- Schütze, F., & Sandbaek, B. (2025). Taxonomy disclosure in the EU—A useful framework, despite current challenges. The Economists’ Voice, 22(1), 161–172. [Google Scholar] [CrossRef]
- Tranfield, D., Denyer, D., & Smart, P. (2003). Towards a methodology for developing evidence-informed management knowledge by means of systematic review. British Journal of Management, 14(3), 207–222. [Google Scholar] [CrossRef]
- Vrontis, D., Thrassou, A., Efthymiou, L., Weber, Y., Shams, S. M. R., & Tsoukatos, E. (Eds.). (2023). Business for sustainability, Volume I: Strategic avenues and managerial approaches. Springer. [Google Scholar] [CrossRef]
- Wang, Z., & Liu, Y. (2025). Nonlinear relationship between physical environment risks, investor attention, and financial systemic risks: Evidence from mLSTM-CoVaR networks. Journal of Environmental Management, 374, 124065. [Google Scholar] [CrossRef]
- Zasuwa, G., & Wesołowski, G. (2024). How do irresponsibility attributions affect organisational reputation? Evidence from the banking industry. International Journal of Bank Marketing, 42(6), 1370–1387. [Google Scholar] [CrossRef]


Disclaimer/Publisher’s Note: The statements, opinions and data contained in all publications are solely those of the individual author(s) and contributor(s) and not of MDPI and/or the editor(s). MDPI and/or the editor(s) disclaim responsibility for any injury to people or property resulting from any ideas, methods, instructions or products referred to in the content. |
© 2026 by the authors. Licensee MDPI, Basel, Switzerland. This article is an open access article distributed under the terms and conditions of the Creative Commons Attribution (CC BY) license.