Equity at the Top: Board Diversity and Executive Remuneration in South Africa

Abstract
1. Introduction
1.1. Research Background and Motivation
1.2. Research Gap, Questions and Contribution
2. Literature Review and Hypothesis Development
2.1. Understanding Board Diversity
2.1.1. Board Gender Diversity Trends
2.1.2. Board Ethnic Diversity Trends
2.2. Gender and Ethnic Pay Gaps Relating to Executive Remuneration
3. Methodology
3.1. Data Collection
3.2. Data Analysis
- SALi,t = β0 + β1GENDERi,t + β2ETHNICi,t + β3AGEi,t + β4TENUREi,t + β5CEOi,t + β6SIZEi,t + β7PERF,t + β8SRi,t + β9GROWi,t + β10LEVi,t
- BONi,t = β0 + β1GENDERi,t + β2ETHNICi,t + β3AGEi,t + β4TENUREi,t + β5CEOi,t + β6SIZEi,t + β7PERF,t + β8SRi,t + β9GROWi,t + β10LEVi,t
- SBi,t = β0 + β1GENDERi,t + β2ETHNICi,t + β3AGEi,t + β4TENUREi,t + β5CEOi,t + β6SIZEi,t + β7PERF,t + β8SRi,t + β9GROWi,t + β10LEVi,t
- TOT_REMi,t = β0 + β1GENDERi,t + β2ETHNICi,t + β3AGEi,t + β4TENUREi,t + β5CEOi,t + β6SIZEi,t + β7PERF,t + β8SRi,t + β9GROWi,t + β10LEVi,t
4. Results
4.1. Descriptive Statistics and Correlations
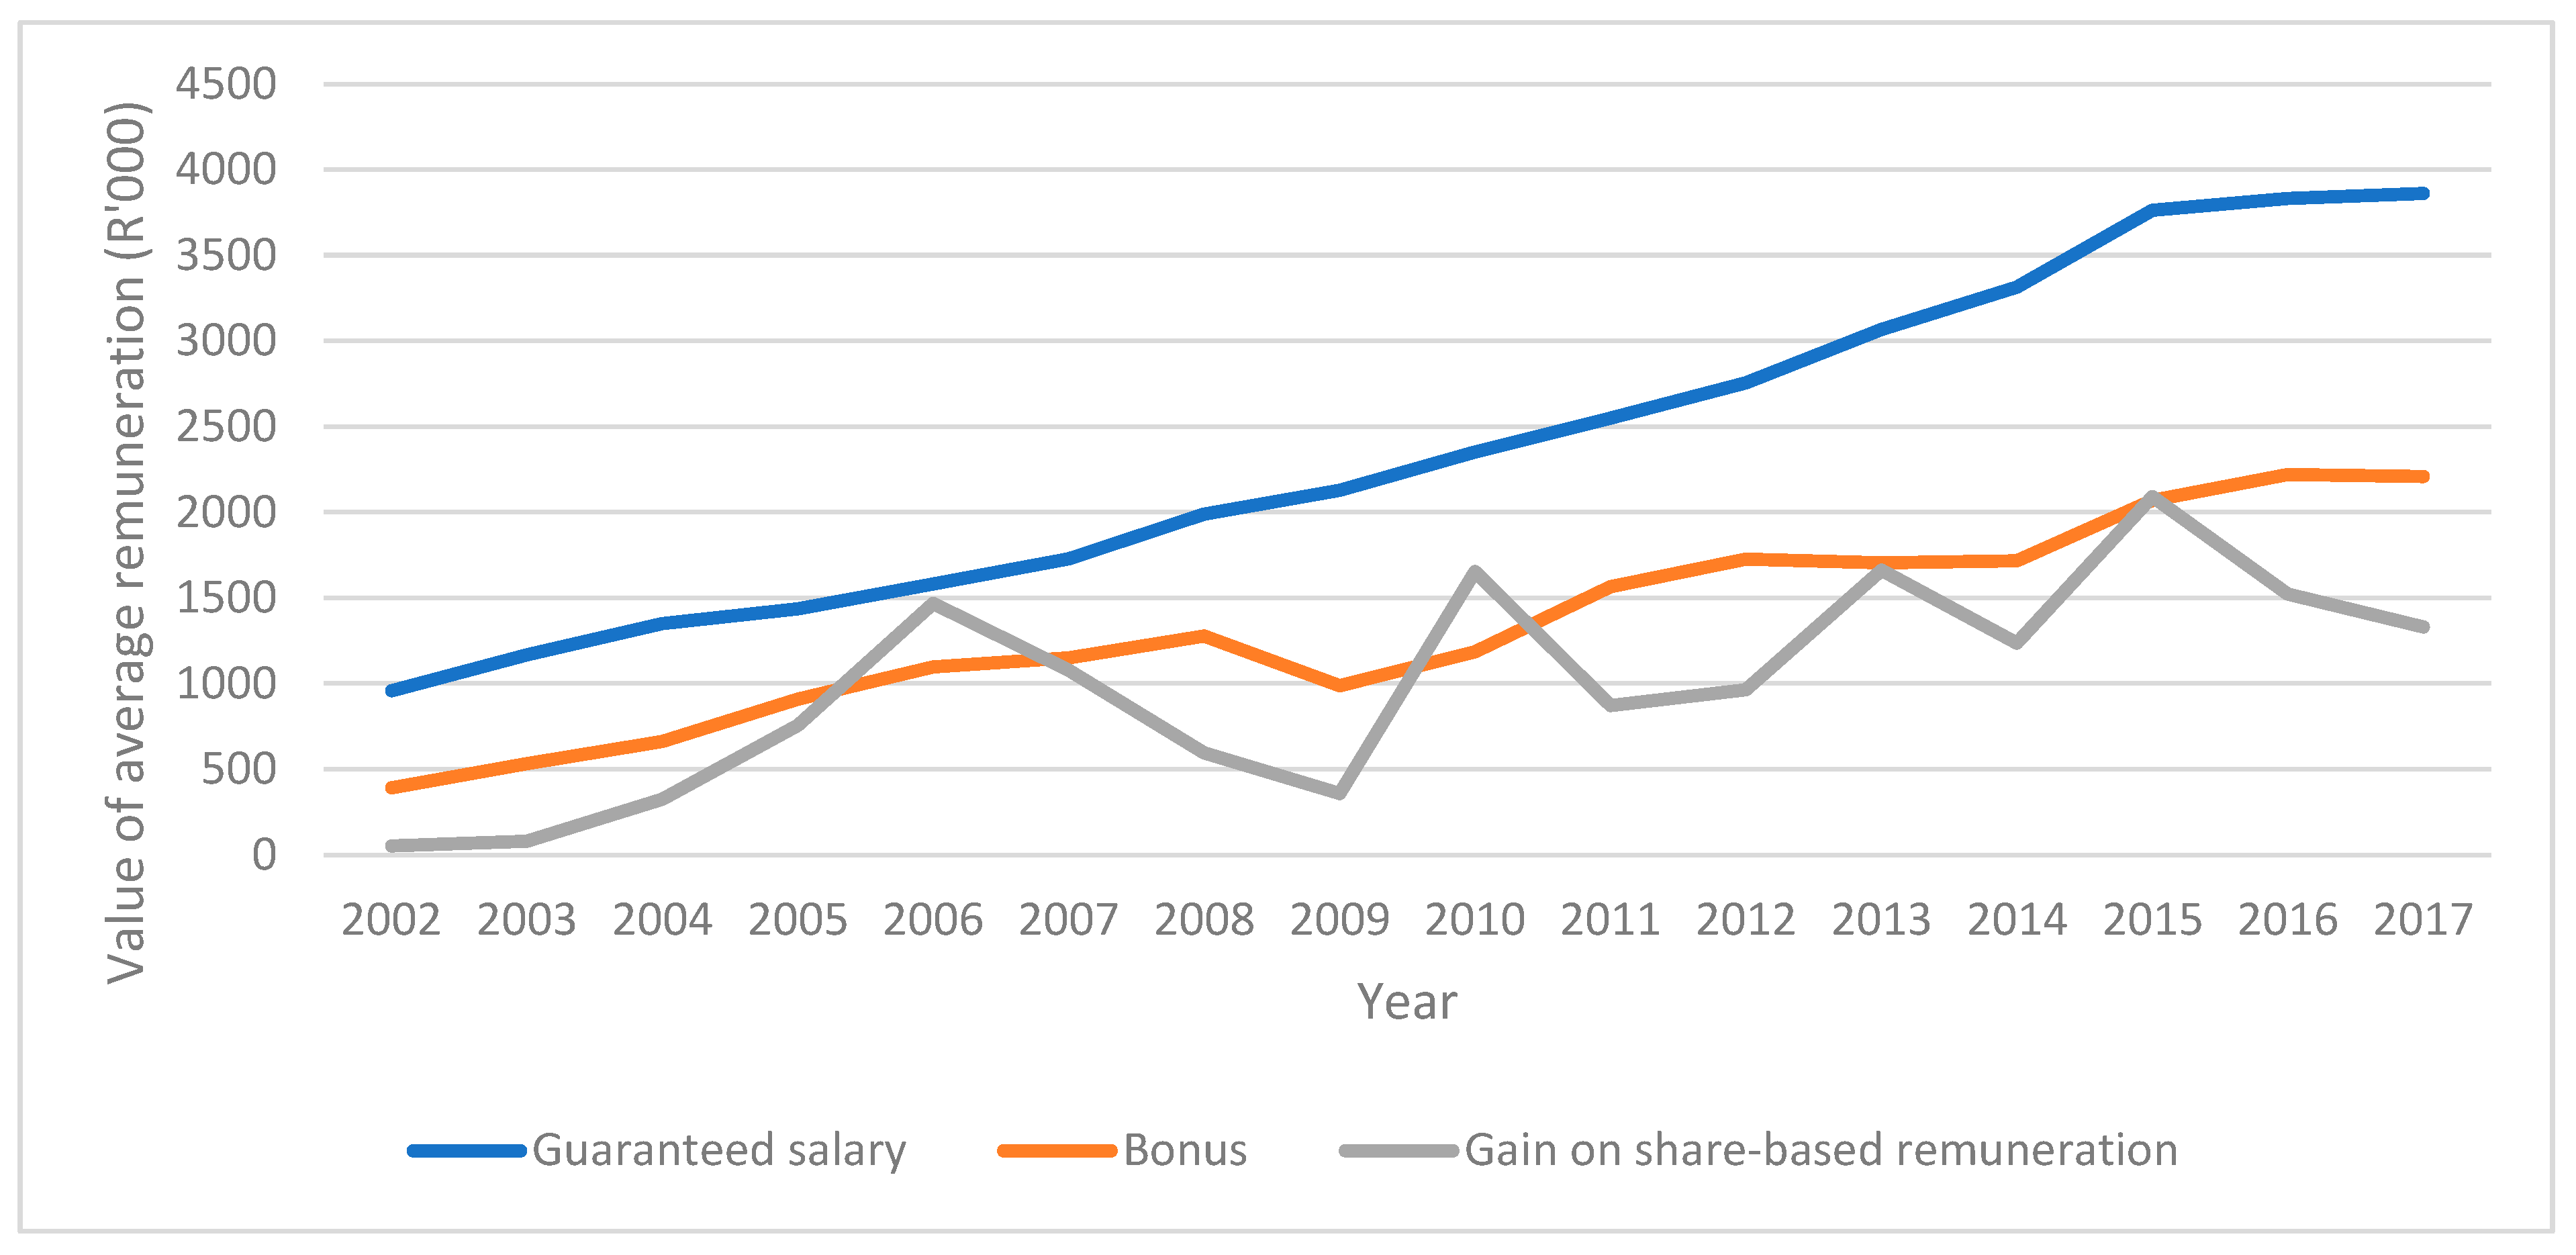
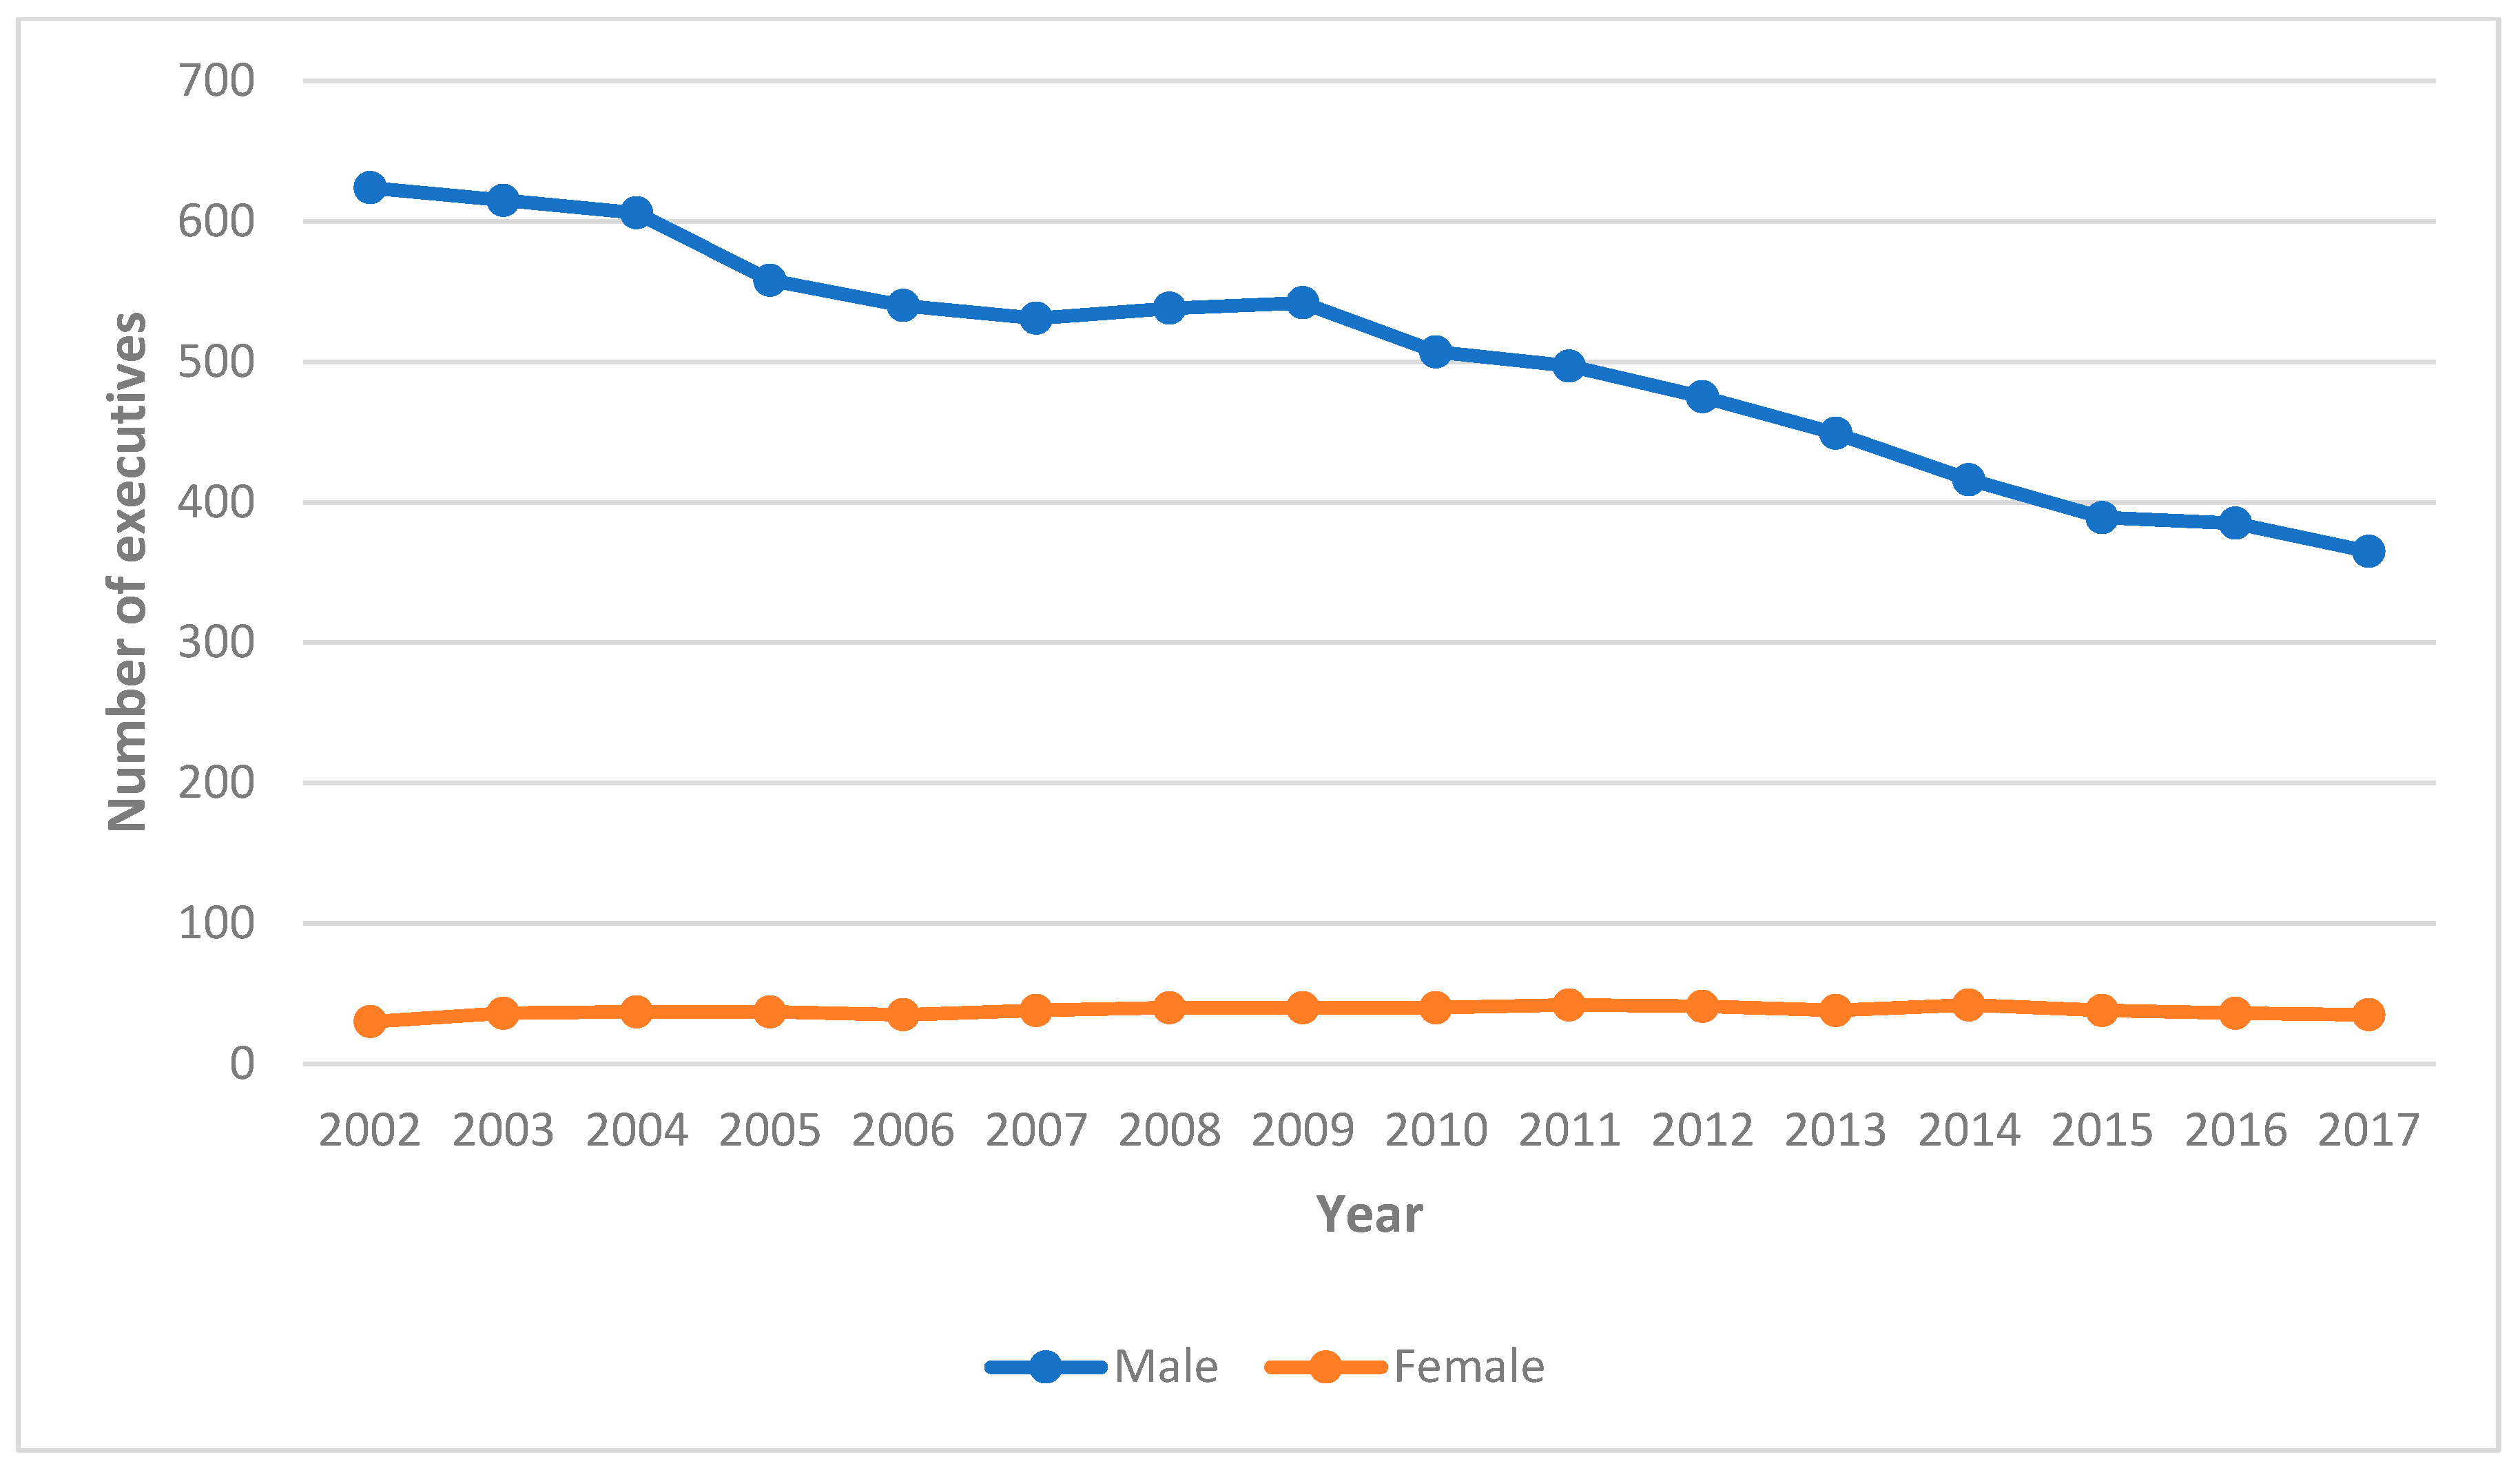
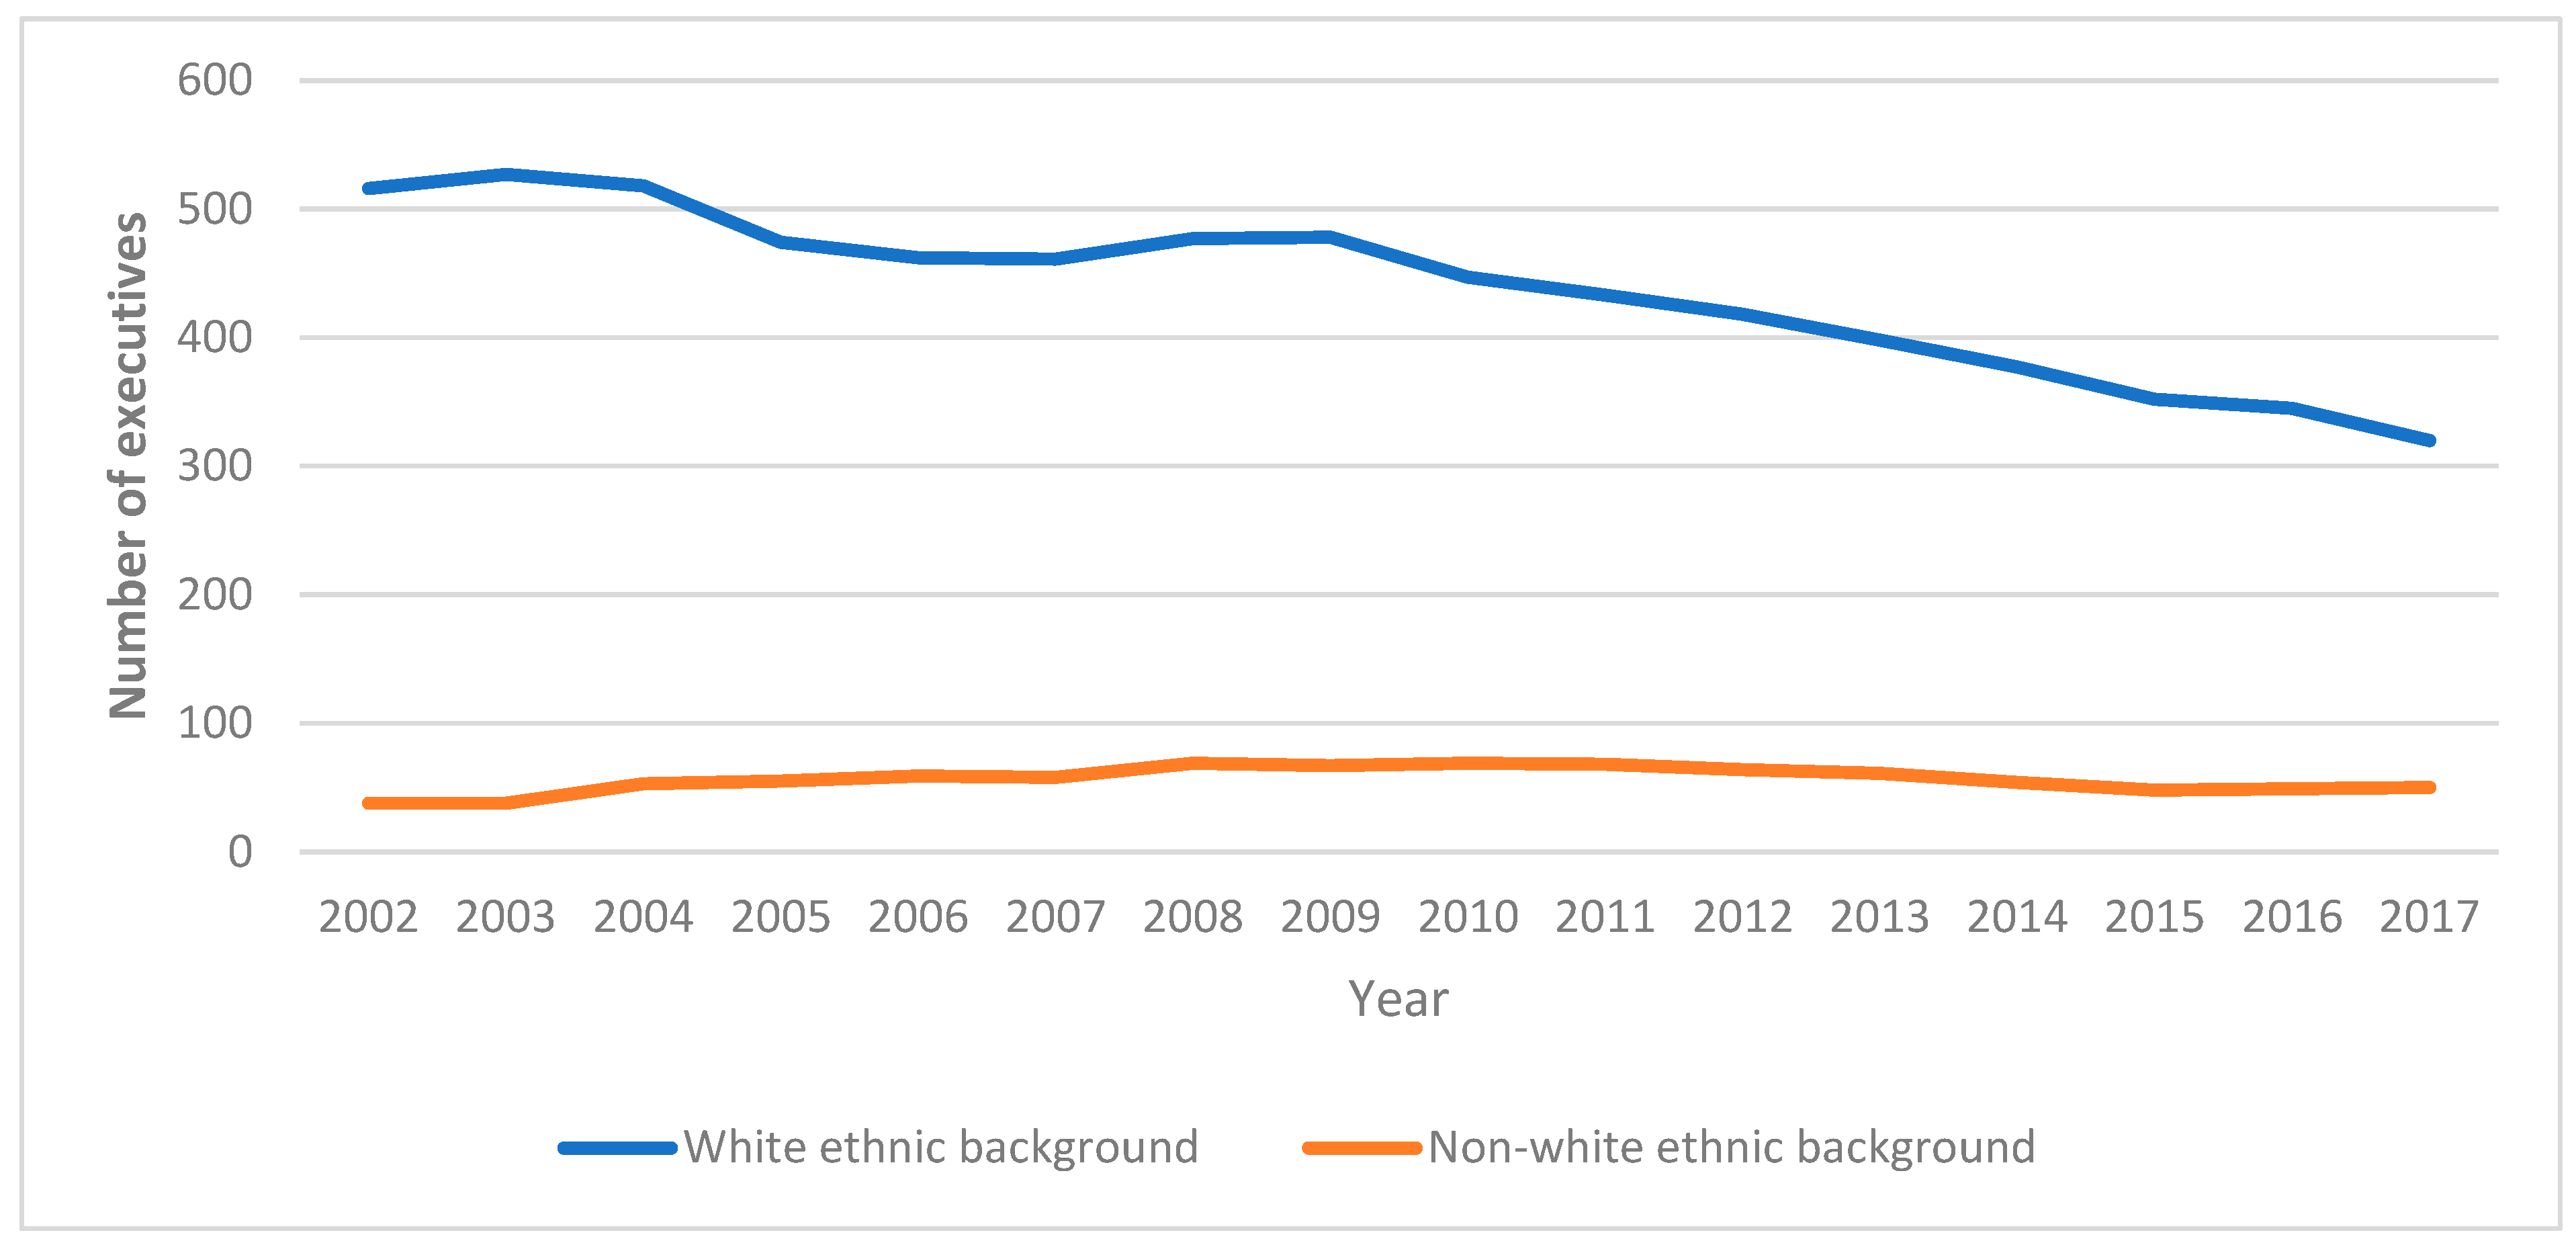
4.2. Research Question 1: Trends in Executive Remuneration and Diversity Characteristics
4.3. Research Question 2: Determinants of Remuneration and Pay Gaps
5. Conclusions
Author Contributions
Funding
Institutional Review Board Statement
Informed Consent Statement
Data Availability Statement
Conflicts of Interest
References
- Ahern, K. R., & Dittmar, A. K. (2012). The changing of the boards: The impact on firm valuation of mandated female board representation. Quarterly Journal of Economics, 127(1), 137–197. [Google Scholar] [CrossRef] [Scilit]
- Amore, M. D., & Garofalo, O. (2021). Pay inequality and gender dynamics in top executive positions. Corporate Governance: An International Review, 29(6), 526–540. [Google Scholar] [CrossRef] [Scilit]
- Arfken, D. E., Bellar, S. L., & Helms, M. M. (2004). The ultimate glass ceiling revisited: The presence of women on corporate boards. Journal of Business Ethics, 50, 177–186. [Google Scholar] [CrossRef] [Scilit]
- Bebchuk, L., & Fried, J. (2004). Pay without performance: The unfulfilled promise of executive compensation. Harvard University Press. [Google Scholar]
- Bezuidenhout, M. L. (2015). Review of executive salaries in South Africa. SA Journal of Human Resource Management, 13(1), a698. [Google Scholar] [CrossRef] [Scilit]
- Blanes, F., de Fuentes, C., & Porcuna, R. (2020). Executive remuneration determinants: New evidence from meta-analysis. Economic Research—Ekonomska Istraživanja, 33(1), 2844–2866. [Google Scholar] [CrossRef] [Scilit]
- Brammer, S., Millington, A., & Rayton, B. (2007). The contribution of corporate social responsibility to organisational commitment. International Journal of Human Resource Management, 18(10), 1701–1719. [Google Scholar] [CrossRef] [Scilit]
- Bussin, M., & Barrett, S. (2016). The effect of race on CEO pay-performance sensitivity in South Africa. South African Journal of Labour Relations, 40(2), 8–29. [Google Scholar] [CrossRef] [Scilit] [PubMed]
- Conyon, M. J. (2014). Executive compensation and board governance in US firms. Economic Journal, 124(574), F60–F89. [Google Scholar] [CrossRef] [Scilit]
- Cook, A., & Glass, C. (2014a). Above the glass ceiling: When are women and racial/ethnic minorities promoted to CEO? Strategic Management Journal, 35(7), 1080–1089. [Google Scholar] [CrossRef] [Scilit]
- Cook, A., & Glass, C. (2014b). Women and top leadership positions: Towards an institutional analysis. Gender, Work & Organization, 21(1), 91–103. [Google Scholar] [CrossRef] [Scilit]
- CSRI (Credit Suisse Research Institute). (2016). The CS gender 3000: The reward for change. Credit Suisse. Available online: https://evolveetfs.com/wp-content/uploads/2017/08/Credit-Suisse-Reward-for-Change_1495660293279_2.pdf (accessed on 28 September 2025).
- Dowling, J., & Pfeffer, J. (1975). Organizational legitimacy: Social values and organizational behavior. Pacific Sociological Review, 18(1), 122–136. [Google Scholar] [CrossRef] [Scilit]
- Elkinawy, S., & Stater, M. (2011). Gender differences in executive compensation: Variation with board gender composition and time. Journal of Economics and Business, 63(1), 23–45. [Google Scholar] [CrossRef] [Scilit]
- Fama, E. F. (1980). Agency problems and the theory of the firm. Journal of Political Economy, 88(2), 288–307. [Google Scholar] [CrossRef] [Scilit]
- Faulkender, M., Kadyrzhanova, D., Prabhala, N., & Senbet, L. (2010). Executive compensation: An overview of research on corporate practices and proposed reforms. Journal of Applied Corporate Finance, 22(1), 107–118. [Google Scholar] [CrossRef] [Scilit]
- Fedorets, A., Gibert, A., & Burow, N. (2019). Gender quotas in the boardroom: New evidence from Germany. Available online: https://ddd.uab.cat/record/299370 (accessed on 28 September 2025).
- Ferrary, M. (2024). The French approach to promoting gender diversity in corporate governance. European Management Journal, 42(4), 445–451. [Google Scholar] [CrossRef] [Scilit]
- Finkelstein, S. (1992). Power in top management teams: Dimensions, measurement, and validation. Academy of Management Journal, 35(3), 505–538. [Google Scholar] [CrossRef]
- Gregory-Smith, I., Main, B. G. M., & O’Reilly, C. A. (2014). Appointments, pay and performance in UK boardrooms by gender. The Economic Journal, 124(574), F109–F128. [Google Scholar] [CrossRef] [Scilit]
- IoDSA (Institute of Directors in Southern Africa). (2002). King IV report on corporate governance for South Africa 2002. IoDSA. [Google Scholar]
- IoDSA (Institute of Directors in Southern Africa). (2009). King IV report on corporate governance for South Africa 2009. IoDSA. [Google Scholar]
- IoDSA (Institute of Directors in Southern Africa). (2016). King IV report on corporate governance for South Africa 2016. IoDSA. [Google Scholar]
- Jensen, M. C., & Meckling, W. H. (1976). Theory of the firm: Managerial behavior, agency costs and ownership structure. Journal of Financial Economics, 3(4), 305–360. [Google Scholar] [CrossRef] [Scilit]
- Johannesburg Stock Exchange (JSE) Limited. (2017). Amendments to the JSE listings requirements: Part 1 of 2016. Available online: https://www.empowerdex.com/images/Documents/JSElistingsRequirments.pdf (accessed on 21 November 2025).
- Mans-Kemp, N., & Viviers, S. (2015). Investigating board diversity in South Africa. Journal of Economic and Financial Sciences, 8(2), 392–414. [Google Scholar] [CrossRef] [Scilit]
- Meyer, J. W., & Rowan, B. (1977). Institutionalized organizations: Formal structure as myth and ceremony. American Journal of Sociology, 83(2), 340–363. [Google Scholar] [CrossRef] [Scilit]
- Milliken, F. J., & Martins, L. L. (1996). Searching for common threads: Understanding the multiple effects of diversity in organizational groups. Academy of Management Review, 21(2), 402–433. [Google Scholar] [CrossRef] [Scilit]
- Muniandy, B. (2022). Audit fees, board ethnicity and board independence: Evidence from South Africa. Managerial Auditing Journal, 37(4), 409–437. [Google Scholar] [CrossRef] [Scilit]
- Murphy, K. J. (1999). Executive compensation. Handbook of Labor Economics, 3, 2485–2563. [Google Scholar] [CrossRef] [Scilit]
- Nguyen, H. T., & Muniandy, B. (2021). Gender, ethnicity and stock liquidity: Evidence from South Africa. Accounting and Finance, 61(S1), 2337–2377. [Google Scholar] [CrossRef] [Scilit]
- Organisation for Economic Co-operation and Development [OECD]. (2017). The pursuit of gender equality: An uphill battle. OECD Publishing. Available online: https://www.oecd.org/content/dam/oecd/en/publications/reports/2017/10/the-pursuit-of-gender-equality_g1g8072d/9789264281318-en.pdf (accessed on 28 September 2025).
- Pastore, P. (2019). Italian lesson about getting women on the board five years after the implementation of the gender quota law. Corporate Ownership and Control, 16(1–1), 185–202. [Google Scholar] [CrossRef] [Scilit]
- PricewaterhouseCoopers [PwC]. (2019). Executives: Practices & remuneration trends report (11th ed.). PricewaterhouseCoopers South Africa. Available online: https://www.pwc.co.za/en/assets/pdf/executive-directors-report-2019.pdf (accessed on 28 September 2025).
- PricewaterhouseCoopers [PwC]. (2022). Executives: Practices & remuneration trends report (14th ed.). PricewaterhouseCoopers South Africa. Available online: https://www.bbrief.co.za/content/uploads/2022/08/2022-Executive-Directors-Report.pdf (accessed on 28 September 2025).
- Ramgath, W., & Bussin, M. H. (2022). Determinants of chief executive officers remuneration for Johannesburg Stock Exchange listed financial service organisations. South African Journal of Human Resource Management, 20, a1774. [Google Scholar] [CrossRef] [Scilit]
- Scholtz, H., & Kieviet, S. (2018). The influence of board diversity on company performance of South African companies. Journal of African Business, 19(1), 105–123. [Google Scholar] [CrossRef] [Scilit]
- Seekings, J., & Nattrass, N. (2005). Class, race, and inequality in South Africa. Yale University Press. [Google Scholar]
- Selody, K. (2010). Board independence and the gender pay gap: Evidence from U.S. publicly traded companies [Unpublished working paper]. Cornell University. Available online: https://ecommons.cornell.edu/server/api/core/bitstreams/b66e2dcc-b082-43ce-804d-2e1b0ff07799/content (accessed on 28 July 2025).
- Steenkamp, G., & Wesson, N. (2021). Executive share-based remuneration in South Africa: Evidence of alignment or rent-extraction? Management Dynamics, 30(1), 1–15. [Google Scholar]
- Stephenson, C. (2004). Leveraging diversity to maximum advantage: The business case for appointing more women to boards. Ivey Business Journal, 1(1), 1–5. [Google Scholar]
- Taljaard, C. C., Ward, M. J. D., & Muller, C. J. (2015). Board diversity and financial performance: A graphical time-series approach. South African Journal of Economic and Management Sciences, 18(3), 425–447. [Google Scholar] [CrossRef]
- Terblanche, W., Steenkamp, G., Dippenaar, M., & Soobaroyen, T. (2025). Revising the King Code: Does it matter for board diversity and corporate performance? Journal of Accounting in Emerging Economies, 1–29. [Google Scholar] [CrossRef] [Scilit]
- Toerien, F., Breedt, C., & de Jager, P. G. (2023). Does board gender diversity improve environmental, social and governance disclosure? Evidence from South Africa. South African Journal of Business Management, 54(1), 3646. [Google Scholar] [CrossRef] [Scilit]
- Viviers, S., Mans-Kemp, N., & Fawcett, R. (2017). Mechanisms to promote board gender diversity in South Africa. Acta Commercii, 17(1), a489. [Google Scholar] [CrossRef] [Scilit]
- Westphal, J. D., & Zajac, E. J. (1995). Who shall govern? CEO/board power, demographic similarity, and new director selection. Administrative Science Quarterly, 40(1), 60–83. [Google Scholar] [CrossRef] [Scilit]
- Zainal, D., Zulkifli, N., & Saleh, Z. (2013). Corporate board diversity in Malaysia: A longitudinal analysis of gender and nationality diversity. International Journal of Academic Research in Accounting, Finance and Management Sciences, 3(1), 136–148. [Google Scholar]



| Variable Names and Abbreviations | Measurement | Reference to Literature |
|---|---|---|
| Remuneration variables (employed as separate dependent variables) | ||
| Guaranteed salary (SAL), Bonus (BON), Gain from share-based remuneration (SB) and Total remuneration (TOT_REM) | Thousands of rands | Steenkamp and Wesson (2021) |
| Demographic characteristics (employed as independent variables) | ||
| Male gender (GENDER) | Coded as a one for male, zero for female and left blank if gender was not disclosed | Bussin and Barrett (2016); Amore and Garofalo (2021) |
| White ethnicity (ETHNIC) | Coded as a one for white, zero for non-white and left blank if ethnicity was not disclosed | |
| Age (AGE) | Age in years | |
| Tenure (TENURE) | Number of years working for company | |
| CEO (CEO) | Coded as a one for CEO or zero if not | |
| Company characteristics (employed as control variables) | ||
| Size (SIZE) | Logarithm of market capitalisation | Faulkender et al. (2010); Conyon (2014); Blanes et al. (2020); Amore and Garofalo (2021); Ramgath and Bussin (2022) |
| Performance (PERF) | Return on assets ratio | |
| Share return (SR) | Change in share price expressed as a percentage of the opening share price | |
| Growth opportunities (GROW) | Price-to-book ratio | |
| Leverage (LEV) | Debt-to-assets ratio | |
| Variable | Number of Observations | Mean | Standard Deviation | Minimum | Maximum |
|---|---|---|---|---|---|
| Remuneration variables in R’000 (employed as separate dependent variables) | |||||
| Guaranteed salary | 8835 | 2212.358 | 2320.140 | 0 | 69,221 |
| Bonus | 8835 | 1247.687 | 2587.494 | −5000 | 54,031 |
| Gain from share-based remuneration | 8835 | 923.391 | 7432.163 | −260 | 594,500 |
| Total remuneration | 8835 | 4383.436 | 9134.912 | 0 | 627,526 |
| Demographic characteristics (employed as independent variables) | |||||
| Male gender | 8642 | 0.930 | 0.255 | 0 | 1 |
| White ethnicity | 7903 | 0.886 | 0.318 | 0 | 1 |
| Age | 8142 | 50.201 | 8.782 | 22 | 84 |
| Tenure | 8007 | 8.366 | 7.534 | 0 | 55 |
| CEO | 8835 | 0.268 | 0.443 | 0 | 1 |
| Company characteristics (employed as control variables) | |||||
| Size | 8835 | 21.124 | 2.179 | 12.221 | 28.046 |
| Performance | 8818 | 12.961 | 17.664 | −198.082 | 205.559 |
| Share return | 8250 | 0.278 | 2.112 | −0.996 | 119.200 |
| Growth opportunities | 8648 | 2.310 | 3.108 | −5.986 | 120.175 |
| Leverage | 8818 | 0.537 | 0.236 | 0 | 2.325 |
| (1) | (2) | (3) | (4) | (5) | (6) | (7) | (8) | (9) | (10) | |
|---|---|---|---|---|---|---|---|---|---|---|
| (1) Male gender | 1.000 | |||||||||
| (2) White ethnicity | 0.136 | 1.000 | ||||||||
| (3) Age | 0.193 | 0.114 | 1.000 | |||||||
| (4) Tenure | 0.104 | 0.129 | 0.499 | 1.000 | ||||||
| (5) CEO | 0.125 | 0.053 | 0.107 | 0.198 | 1.000 | |||||
| (6) Size | 0.052 | −0.046 | 0.224 | 0.035 | −0.016 | 1.000 | ||||
| (7) Performance | −0.039 | −0.023 | −0.008 | 0.018 | −0.002 | 0.217 | 1.000 | |||
| (8) Share return | 0.017 | 0.014 | −0.041 | −0.049 | −0.004 | 0.019 | 0.085 | 1.000 | ||
| (9) Growth opportunities | −0.023 | −0.033 | 0.047 | 0.015 | 0.007 | 0.425 | 0.293 | 0.062 | 1.000 | |
| (10) Leverage | 0.042 | −0.083 | −0.003 | −0.079 | −0.021 | 0.061 | −0.204 | 0.012 | 0.145 | 1.000 |
| Number (Percentage) of Observations | Average Guaranteed Salary | Average Bonus | Average Gain on Share-Based Remuneration | Average Total Remuneration | |
|---|---|---|---|---|---|
| Per gender category | |||||
| Female | 605 (7%) | 1640.790 | 669.638 | 398.752 | 2709.180 |
| Male | 8037 (91%) | 2282.043 | 1314.897 | 982.633 | 4579.573 |
| Unallocated | 193 (2%) | 1102.212 | 260.912 | 101.010 | 1464.135 |
| Per ethnic category | |||||
| Non-white | 900 (10%) | 2373.700 | 1513.532 | 628.839 | 4516.071 |
| White | 7003 (79%) | 2315.001 | 1332.327 | 1062.319 | 4709.646 |
| Unallocated | 932 (11%) | 1285.307 | 354.989 | 163.933 | 1804.230 |
| Variables | Dependent Variable Employed | |||
|---|---|---|---|---|
| Guaranteed Salary | Bonus | Gain from Share-Based Remuneration | Total Remuneration | |
| Demographic characteristics | ||||
| Male gender | 305.267 ** | 364.732 *** | −4.983 | 665.017 |
| White ethnicity | 364.521 *** | 176.417 | 467.785 *** | 1008.723 *** |
| Age | 4.996 | 4.964 | −7.489 | 2.47 |
| Tenure | 43.598 * | 32.089 *** | 71.91 * | 147.596 ** |
| CEO | 1260.067 *** | 1020.749 *** | 990.138 *** | 3270.954 *** |
| Company characteristics | ||||
| Size | 43.214 | 253.225 *** | 451.266 *** | 747.705 *** |
| Performance | 1.368 | 2.12 | 14.855 * | 18.343* |
| Share return | −24.76 | 61.528 ** | 19.475 | 56.243 |
| Growth opportunities | 1.103 | 55.368 | 214.617 | 271.088 |
| Leverage | 312.884 | 252.269 | 336.065 | 901.218 |
| Constant | −1579.310 | −6272.165 *** | −10,700.861 *** | −18,552.335 *** |
| Year dummies | Yes | Yes | Yes | Yes |
| Number of observations | 6641 | 6641 | 6641 | 6641 |
| R-squared | 0.271 | 0.120 | 0.018 | 0.091 |
| F-statistic | 21.648 | 4.916 | 2.760 | 7.058 |
| Prob > F | 0.000 | 0.000 | 0.000 | 0.000 |
| Variables | Dependent Variable Employed | |||
|---|---|---|---|---|
| Guaranteed Salary | Bonus | Gain from Share-Based Remuneration | Total Remuneration | |
| Male gender (2002–2009) | 139.424 * | 101.307 | −93.75 | 146.98 |
| Male gender (2010–2017) | 393.661 | 513.594 *** | −191.551 | 715.704 |
| White ethnicity (2002–2009) | 308.97 *** | 122.714 | 342.507 *** | 774.192 *** |
| White ethnicity (2010–2017) | 541.13 *** | 373.886 | 422.591 | 1337.607 ** |
Disclaimer/Publisher’s Note: The statements, opinions and data contained in all publications are solely those of the individual author(s) and contributor(s) and not of MDPI and/or the editor(s). MDPI and/or the editor(s) disclaim responsibility for any injury to people or property resulting from any ideas, methods, instructions or products referred to in the content. |
© 2026 by the authors. Licensee MDPI, Basel, Switzerland. This article is an open access article distributed under the terms and conditions of the Creative Commons Attribution (CC BY) license.
Share and Cite
Steenkamp, G.; Dippenaar, M.; de Lange, T.; Frade, J.; Jordaan, C. Equity at the Top: Board Diversity and Executive Remuneration in South Africa. J. Risk Financ. Manag. 2026, 19, 109. https://doi.org/10.3390/jrfm19020109
Steenkamp G, Dippenaar M, de Lange T, Frade J, Jordaan C. Equity at the Top: Board Diversity and Executive Remuneration in South Africa. Journal of Risk and Financial Management. 2026; 19(2):109. https://doi.org/10.3390/jrfm19020109
Chicago/Turabian StyleSteenkamp, Gretha, Mareli Dippenaar, Tamzin de Lange, Jenna Frade, and Cara Jordaan. 2026. "Equity at the Top: Board Diversity and Executive Remuneration in South Africa" Journal of Risk and Financial Management 19, no. 2: 109. https://doi.org/10.3390/jrfm19020109
APA StyleSteenkamp, G., Dippenaar, M., de Lange, T., Frade, J., & Jordaan, C. (2026). Equity at the Top: Board Diversity and Executive Remuneration in South Africa. Journal of Risk and Financial Management, 19(2), 109. https://doi.org/10.3390/jrfm19020109