1. Introduction and Literature Review
The financial implications of green banking activities have gained more attention in the financial sector, particularly as institutions continue to adopt sustainable business practices due to regulatory and environmental concerns. Green banking practices encompass a wide range of activities, which include but are not limited to customer-centric, operations-focused, policy-related, and employee-related activities, among others (
Aslam & Jawaid, 2023). Previous studies have indicated various mixed results on how green banking activities influence banks’ profitability. A study by
Li and Wu (
2025) established a positive significant effect between green credit policies and banks’ profitability through the income effect. Similarly, a study by
Herwadkar et al. (
2025) concluded that green lending tends to have a positive correlation with improved profitability after a certain level of green lending threshold is achieved. The same observations were made based on non-performing loans (NPLs). Similarly,
Huang et al. (
2025) also observed that green credit boosted the net interest income of commercial banks. In addition,
Pradnyani et al. (
2024) concluded that sustainable banking practices improve banks’ financial performance by reducing their credit risk exposure.
Putri et al. (
2022),
Singh et al. (
2022) and
Olasiuk et al. (
2023) collectively pointed out that green banking can enhance a bank’s competitiveness through cost savings, product innovation and operational efficiency.
Afzal et al. (
2024) and
Aslam and Jawaid (
2023) highlighted the potential financial benefit banks would enjoy from government incentives in the form of tax rebates and subsidies for financing green projects.
Nevertheless, other studies have also established contradictory results. A study by
Han et al. (
2019), for instance, identified the marginal efficiency of banks’ financial performance, implying that while green credit policies enhance banks’ profitability initially, the impact decreases over time. A study by
Z. Zhou et al. (
2024) based in China, however, established a negative impact of green loan balances on net profits.
Del Gaudio et al. (
2022) emphasize that a higher propensity for green lending with moderate credit and default risks lowers profitability.
Some studies have also explored the factors influencing the impact of green banking activities on banks’ performance. The study by
Pasha and Elbages (
2022), for instance, noted that technological advances such as digital transformation lead to enhanced performance due to the increased efficiency of operations. Interestingly, a study by
Galán and Tan (
2024) established heterogeneous results concerning the influence of green credit policies on banks’ profitability and efficiency among small and big banks. They observed that highly capitalized banks were able to offset the negative effects and ultimately gain financial benefits in the long run.
As highlighted in the review above, the literature shows inconsistent results, with some studies identifying a positive influence, others a negative one, some finding a heterogeneous influence, while others, such as
Nanda and Bihari (
2012) and
Han et al. (
2019), conclude there to be no significant influence, invoking the need to explore the conditions under which green banking activities enhance banks’ performance.
In addition, the majority of the studies are limited to specific regions; for instance, India (
A. Jain et al., 2024), Indonesia (
Nanda & Bihari, 2012), and China (
Li & Wu, 2025), among others. There is therefore a need to adopt a comprehensive approach that incorporates diverse geographical contexts to unravel the global impact of green banking activities on banks’ profitability.
To address this gap, this study adopts the meta-analysis approach to solve the problem of the results’ generalizability by applying an evidence-based, robust and systematic approach to reach a definitive conclusion on how green banking activities influence banks’ profitability. The existing literature seems highly fragmented, with some studies using different profitability metrics, geographical focuses, and methodologies, and some being based on different sample sizes, making it difficult to draw general conclusions. In solving this problem, the meta-analysis approach aggregates the results of multiple findings in a statistically sound and structured manner to draw a definitive conclusion. Therefore, this study adopts the meta-analysis approach to answer the research question: how do green banking activities impact banks’ financial performance? To the best of our knowledge, there is no meta-analytic synthesis on the nexus between green financing and banks’ profitability, and therefore, by adopting this approach, this study offers novel actionable insights for policymakers, stakeholders and academics in the financial sector.
2. Materials and Methods
2.1. Search Query
The initial search query was applied in both the Scopus and Web of Science (WOS) databases. The search was conducted in April 2025. The following keyword combinations were used in each of the databases.
Scopus
TITLE-ABS-KEY ((“green banking” OR “green finance” OR “green financing” OR “climate finance”) AND (“bank performance” OR “profitability” OR “financial performance” OR “ROA” OR “ROE”)) AND (LIMIT-TO (DOCTYPE, “ar”)) AND (LIMIT-TO (LANGUAGE, “English”)) AND (LIMIT-TO (OA, “all”)).
WOS
TS = ((“green banking” OR “green finance” OR “green financing” OR “climate finance”) AND (“bank performance” OR “profitability” OR “financial performance” OR “ROA” OR “ROE”)) and 2021 or 2020 or 2022 or 2023 or 2024 or 2025 (Publication Years) and Article (Document Types) and All Open Access (Open Access).
After the initial search, a total of 343 articles were identified, among which 189 were from Scopus and 154 came from the Web of Science databases. Through database automation tools, a total of 52 articles were removed as they were beyond the selected timeline of 2020–2025. A total of 133 papers were excluded as they were not journal articles, while 16 more were eliminated as they were not open access. Only 1 article was eliminated based on language as it was not written in English.
A total of 202 publications were eliminated, leaving a total of 129 articles for the initial screening. After a thorough check of the article titles and abstracts, 62 articles were further excluded, mainly because they were not focused on the banking sector, which was the focus of this study, leaving a total of 67 articles for retrieval. Five articles could not be accessed, either because they needed subscriptions for access or they had an abstract only. The full accessible articles were further assessed for eligibility.
Forty articles were removed at this stage as they did not report the results relevant for the calculation of the effect sizes, such as the correlation, regression coefficients, standard errors and significance values, or did not report data results such as t-statistics that could enable the calculation of the effect sizes. In the end, 12 studies qualified for the final meta-analysis.
Table 1 summarizes the inclusion and exclusion criteria.
The research process was summarized based on the PRISMA flowchart, as guided by
Page et al. (
2021), as follows (
Figure 1):
2.2. Main Information on the Corpus
This study focused on the most recent articles that are highly relevant to the research objective, which entails determining how green banking and green financing activities impact banks’ profitability. Only recent peer research articles were included, as indicated by the documents’ average age of 2.5.
Table 2 summarizes the main information on the corpus synthesized.
3. Results
3.1. Meta-Analysis Results
3.1.1. Study Selection
The objective of this study was to explore how green banking and financing activities undertaken by banks affects their financial performance. The important research question associated with this objective was whether the green financing and banking activities undertaken by the banks impacted their financial performance positively or negatively, or if there was no effect at all, and whether the impact is consistent. To examine if it was possible to answer this research question based on the meta-analysis approach, an initial search for published articles based on the above search query was run and 12 original studies that examined 28 different aspects of green financing or green banking activities and how they impact banks’ financial performance were identified. According to
McLellan and Perera (
2018), nine studies are considered sufficient for conducting a meta-analysis, implying that this study was based on a sufficient number of studies far beyond the recommended threshold.
The green banking practices and financing activities examined include the number of AMTs, amounts of capital adequacy for the banks, green banking performance index, green credit efficiency, environmental activities, ESG, renewable energy, carbon emissions, waste management and water consumption disclosure, green credit balance, availability of online and internet banking, green loan provision, climate change performance index, bank environmental score, green lending and green credit. These were considered as proxies for independent green banking and financing.
Banks’ profitability was assessed by different metrics, including the return on assets (ROA), return on equity (ROE), net interest margin (NIM) and Tobin’s Q measure. The studies also adopted various models, including the fixed-effect model (FEM), random-effects model (REM), difference in difference (DID-GMM) dynamic model, ordinal least square (OLS) and slacks-based measure of efficiency in data envelopment analysis (SBM-DEA) model. The studies selected were distributed across different countries, including Bangladesh, Indonesia, China, Southeast Asia, Nigeria, Qatar, BRICS and others across several continents.
The details regarding the specific independent and dependent variables, the regression and correlation coefficients where applicable, the number of observations used in each study, the standard errors and the countries in which the studies were based were identified and are summarized in
Table 3, as suggested by
Hansen et al. (
2021). This step was important in filtering the most important green financing and banking factors as measured against the corresponding financial performance metrics. Also, it was a perquisite for facilitating the next step of computing the common effect sizes.
3.1.2. Calculation of Effect Sizes
Effect sizes form the basis upon which researchers synthesize findings across multiple studies quantitatively (
Lakens, 2013). They go beyond calculating studies that established significant results and also help in measuring the direction, strength and consistency of the variable relationship among the selected studies. Through calculating the effect sizes, the results from multiple studies are standardized to make it easier for combining or comparing the studies’ outcomes regardless of their measurement scales or sizes. The types of common effect sizes include the odds ratio, Hedges, regression coefficients and Cohen’s. Effect sizes, therefore, provide a unified metric based upon which researchers can draw conclusions about the observed patterns of relationships (
Smelser & Baltes, 2001).
While selecting the studies to include in this meta-analysis, only those studies that had reported their regression coefficients, correlation coefficients and standard errors were included. If the study results did not explicitly present the standard errors in the results but included the
t-statistics, the standard errors were computed using the following formula, as guided by (
Wright & Herrington, 2011).
The standardized regression coefficients were converted into Cohen’s d using the following formula, as suggested by (
Peterson & Brown, 2005).
where
is the standardized regression coefficient and
R2 is the coefficient of determination. In some cases, such as studies no. 3, 4 and 5 in table above, only the correlation coefficients were provided. To calculate the effect sizes, the Fisher’s z-transformation was performed using the following formula, as suggested by (
Fisher, 1915).
where
r is the correlation coefficient and z is the Fisher’s z value. The effect sizes showed mixed results, with some studies showing a strong positive effect (15), while others showed a strong negative effect (9). The majority of the studies, however, indicated small to moderate effect sizes.
Table 4 below presents a summary of the effect sizes, the lower and upper limit CIs, as well as the weights.
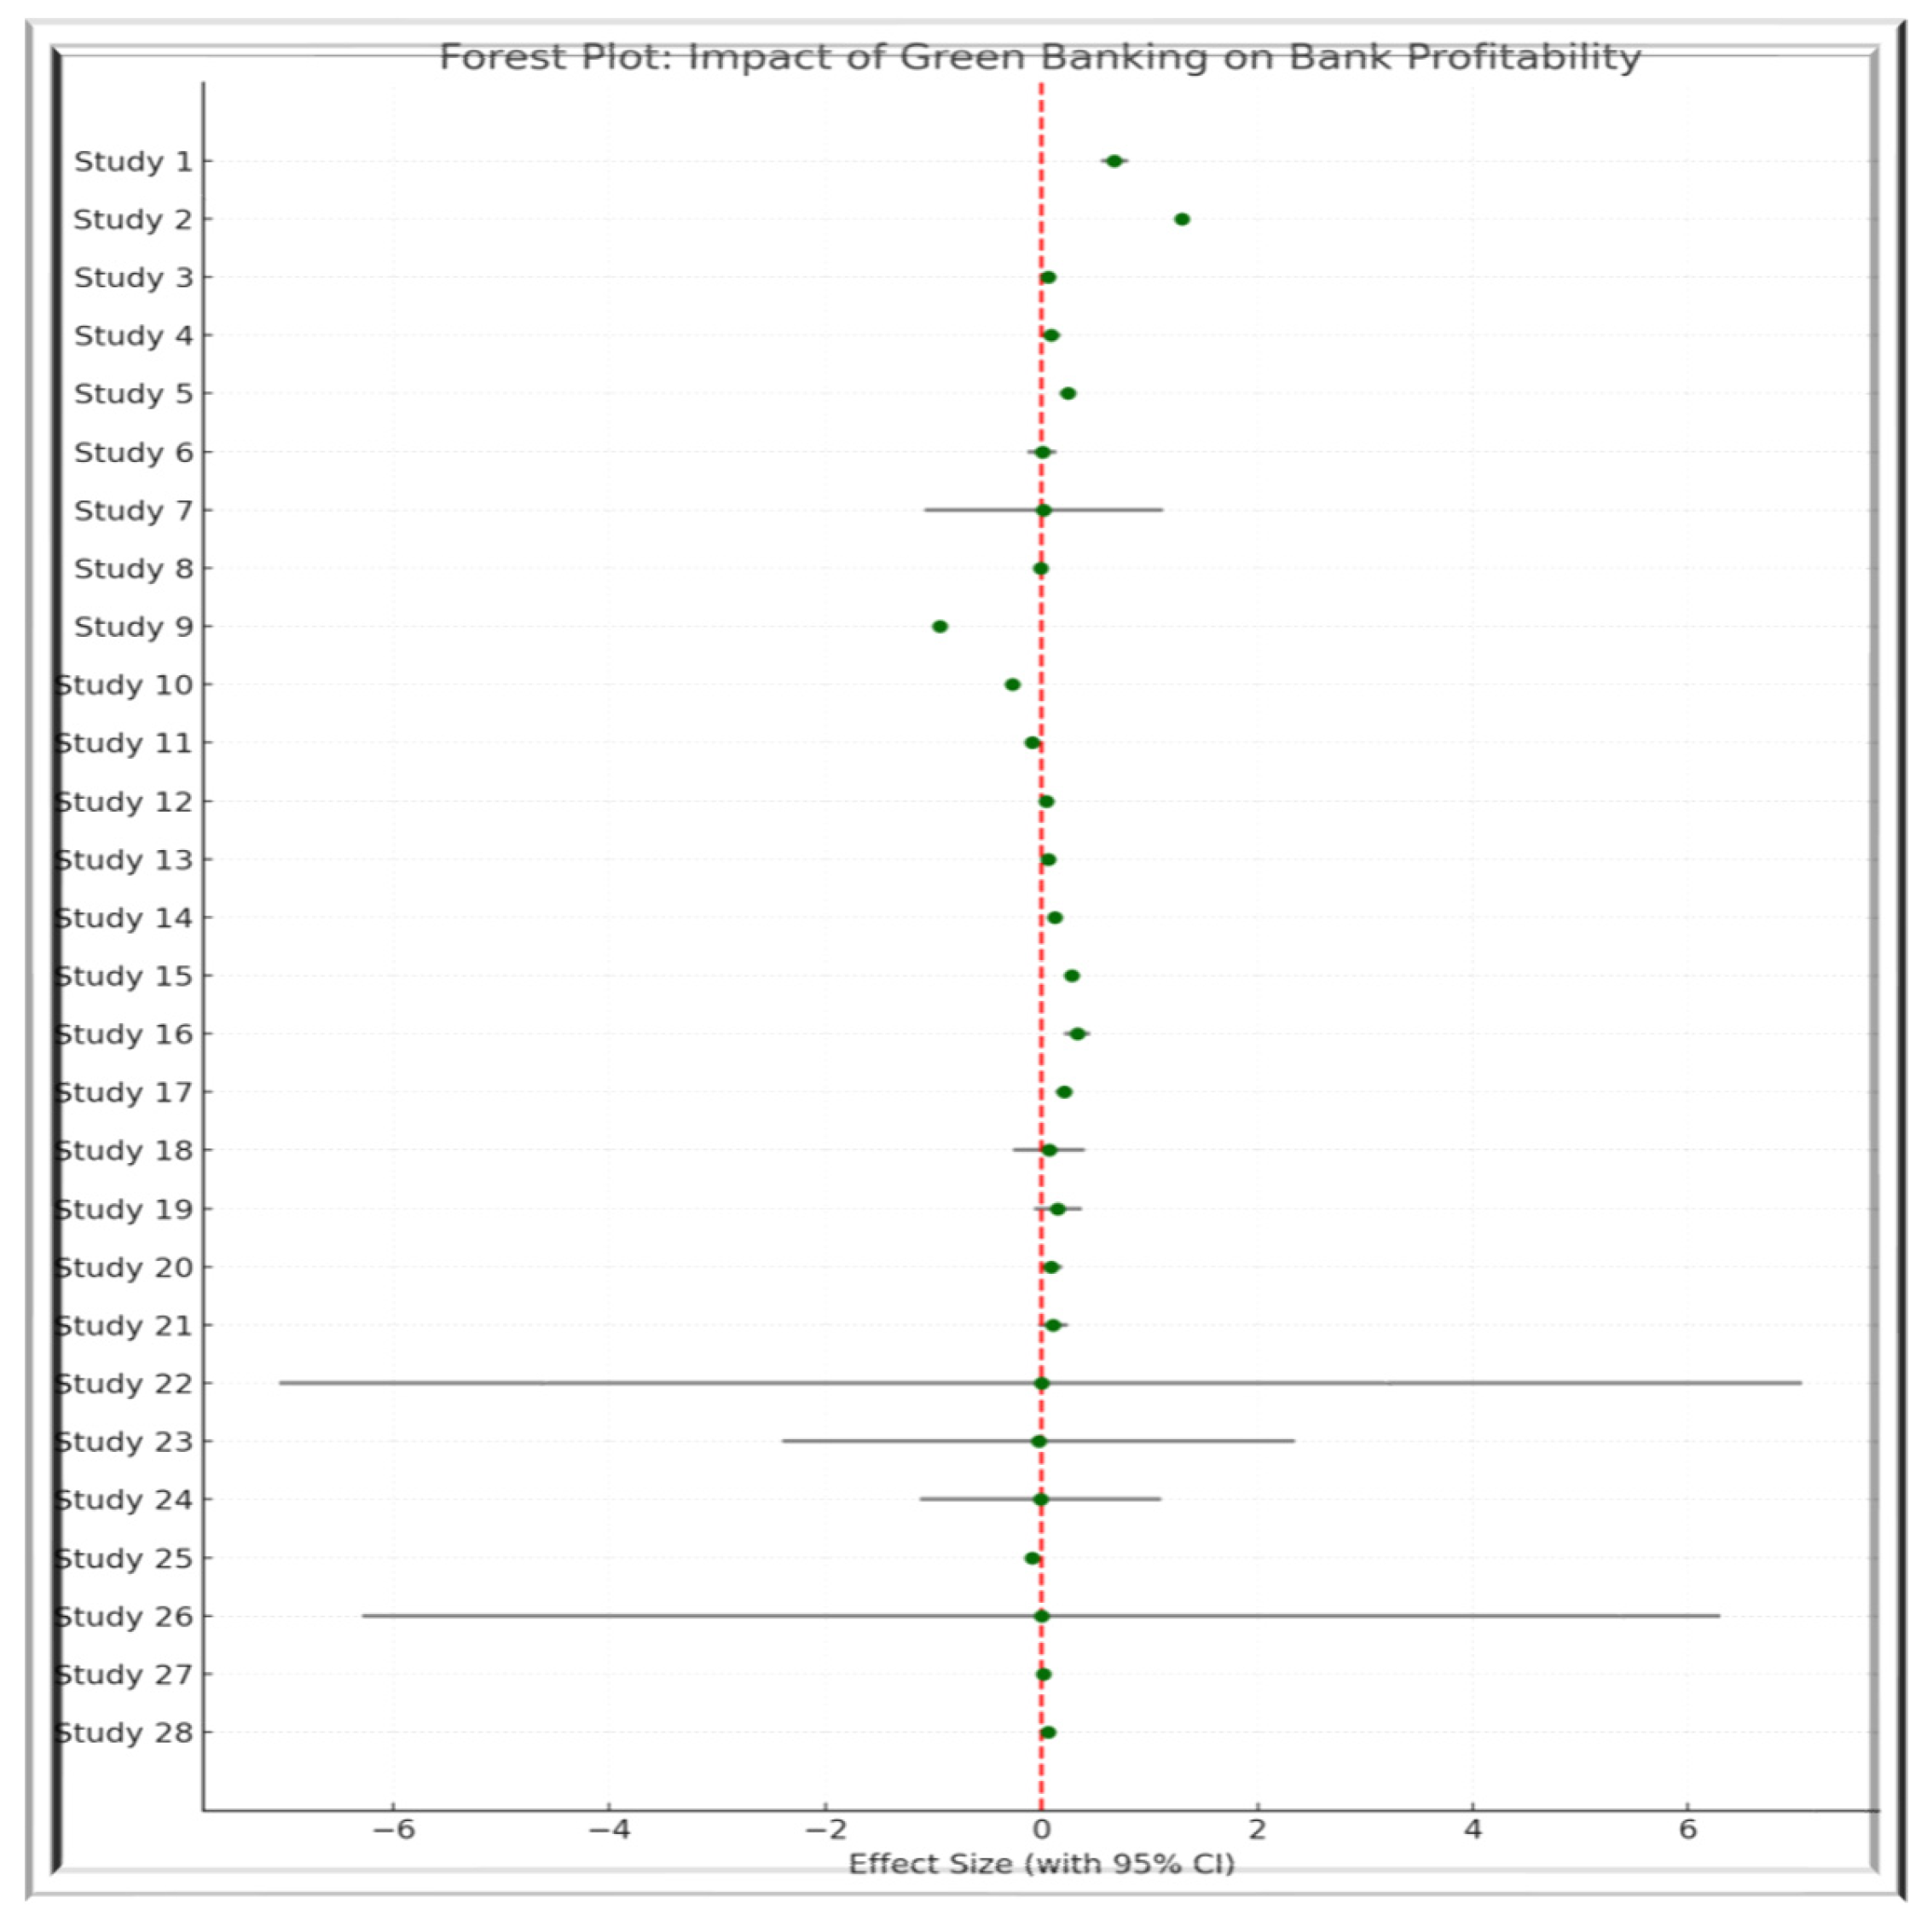
3.1.3. Forest Plot
The forest plot displays the effect size results of 28 green financing and financial performance relationships and their 95% confidence intervals (
Figure 2). The majority of the studies indicate positive effect sizes, implying that green banking mostly tends to influence banking profitability positively. A few studies (9, 10 and 11) though show negative effect sizes, which are statistically significant, indicating that green financing and green banking activities do not always result in financial benefits in all contexts. Studies number 22 and 26 reveal high uncertainties, as indicated by their high confidence intervals, which could possibly be caused by factors such as inconsistent measurements or small sample sizes. If the CI crosses the vertical red line, it implies that there is no statistical significance, whether positive or negative, but if otherwise, it means that statistical significance exists (
Ghajarzadeh, 2024). In this case, while the CIs from a few studies, such as studies no. 1, 2, 5, 9, 10 and 15, do not cross the red line at zero, the majority of the rest cross the red line at zero, suggesting that they are not statistically significant individually. The overall results show a general positive trend, suggesting that green financing and green banking activities positively impact banks’ profitability, but the effects remain heterogeneous and therefore context dependent.
3.1.4. Combined Effect Size
The combined overall effect for the multiple studies included in
Table 5 was 0.14 (95% CI: −0.17 to 0.46), implying a small positive but insignificant effect of green banking activities and green financing on banks’ financial performance. Two subgroups were created based on the nature of the data used in concluding the findings of the selected study. Studies that utilized data on green financing monetary allocations rather than the Likert scale ordinal data were categorized as green financing (GF), while the latter were categorized as green banking (GB). A subgroup analysis was then run to examine whether the relationship was different based on the type of data. A similar non-significant pattern was also observed for the subgroup analysis GF (effect = 0.03, CI: −0.11 to 0.18) and GB (effect = 0.36, CI: −0.12 to 0.84), all with I
2 = 100%.
3.1.5. Heterogeneity Analysis
The heterogeneity was, however, quite high, as indicated by the results (Q = 23,824.89,
p < 0.001; I
2 = 99.89%), with a std deviation (T) of 0.24 and variance (T
2 = 0.06). This was possibly because of the different research contexts, different measurement tools, study designs and sample characteristics. For instance, some studies measured green banking in terms of activities such as the availability of digital banking tools, mobile banking, ATMs or number of ATMs, et cetera, while others measured it in terms of green credit monetary disbursements, green lending, green loan loss provisions, etc. Some studies were based on a high number of observations; for instance, a study utilized as many as 61,776 observations, while another one was based on as few as 40 observations. Different studies were based on different timelines and utilized different models, as detailed in
Table 1 above.
Table 5 presents the combined effect size and heterogeneity results.
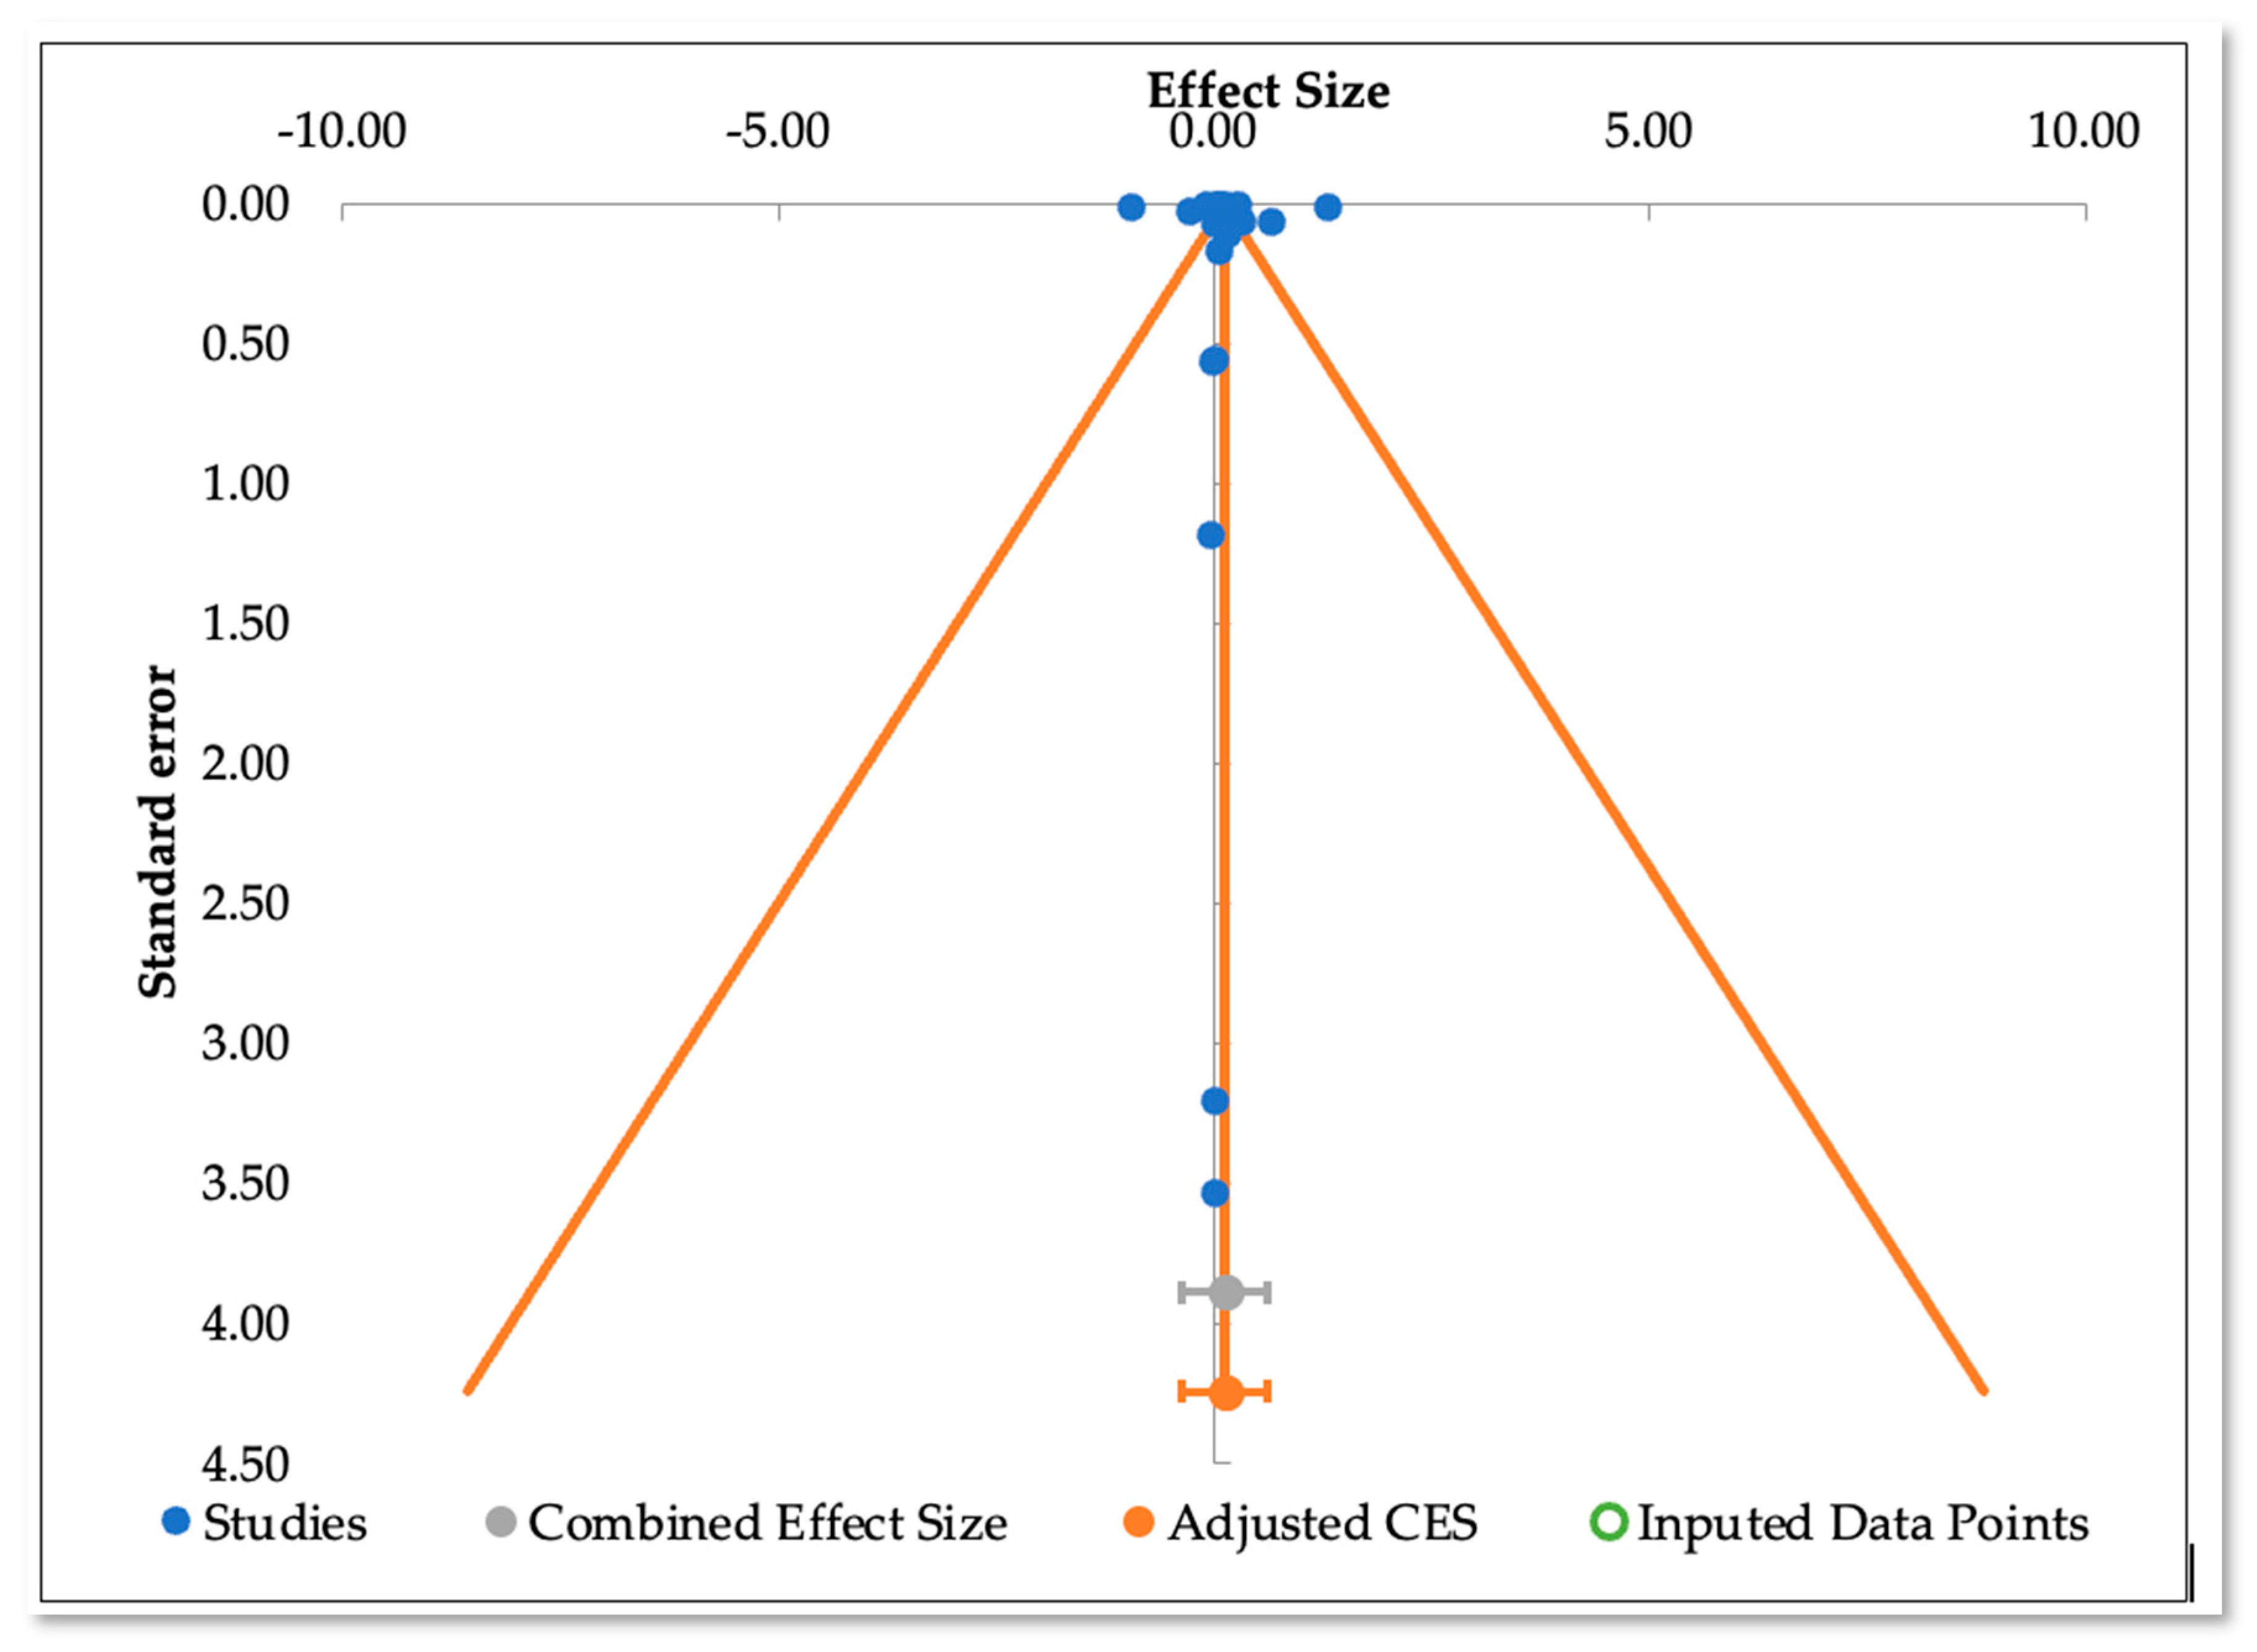
3.1.6. Publication Bias Analysis
Publication bias occurs when the studies with positive effects or those that are statistically significant are more likely to be retrieved as compared to those that have either negative effects or are statistically insignificant (
AJE, 2024). This bias can therefore distort the overall effect size if present (
Smelser & Baltes, 2001).
The wide prediction intervals for both the overall and subgroup effects suggest substantial variability in the potential outcomes of future studies. Several studies with unusually large confidence intervals and minimal weights suggest the presence of outliers, warranting further investigation through sensitivity analysis. High inconsistency was noted among the selected studies, as revealed by the Q (27) = 23,824.89,
p < 0.001, and the I
2 = 99.89%, while the (T) and (T
2) were 0.06 and 0.24, respectively, indicating the substantial dispersion of the effects.
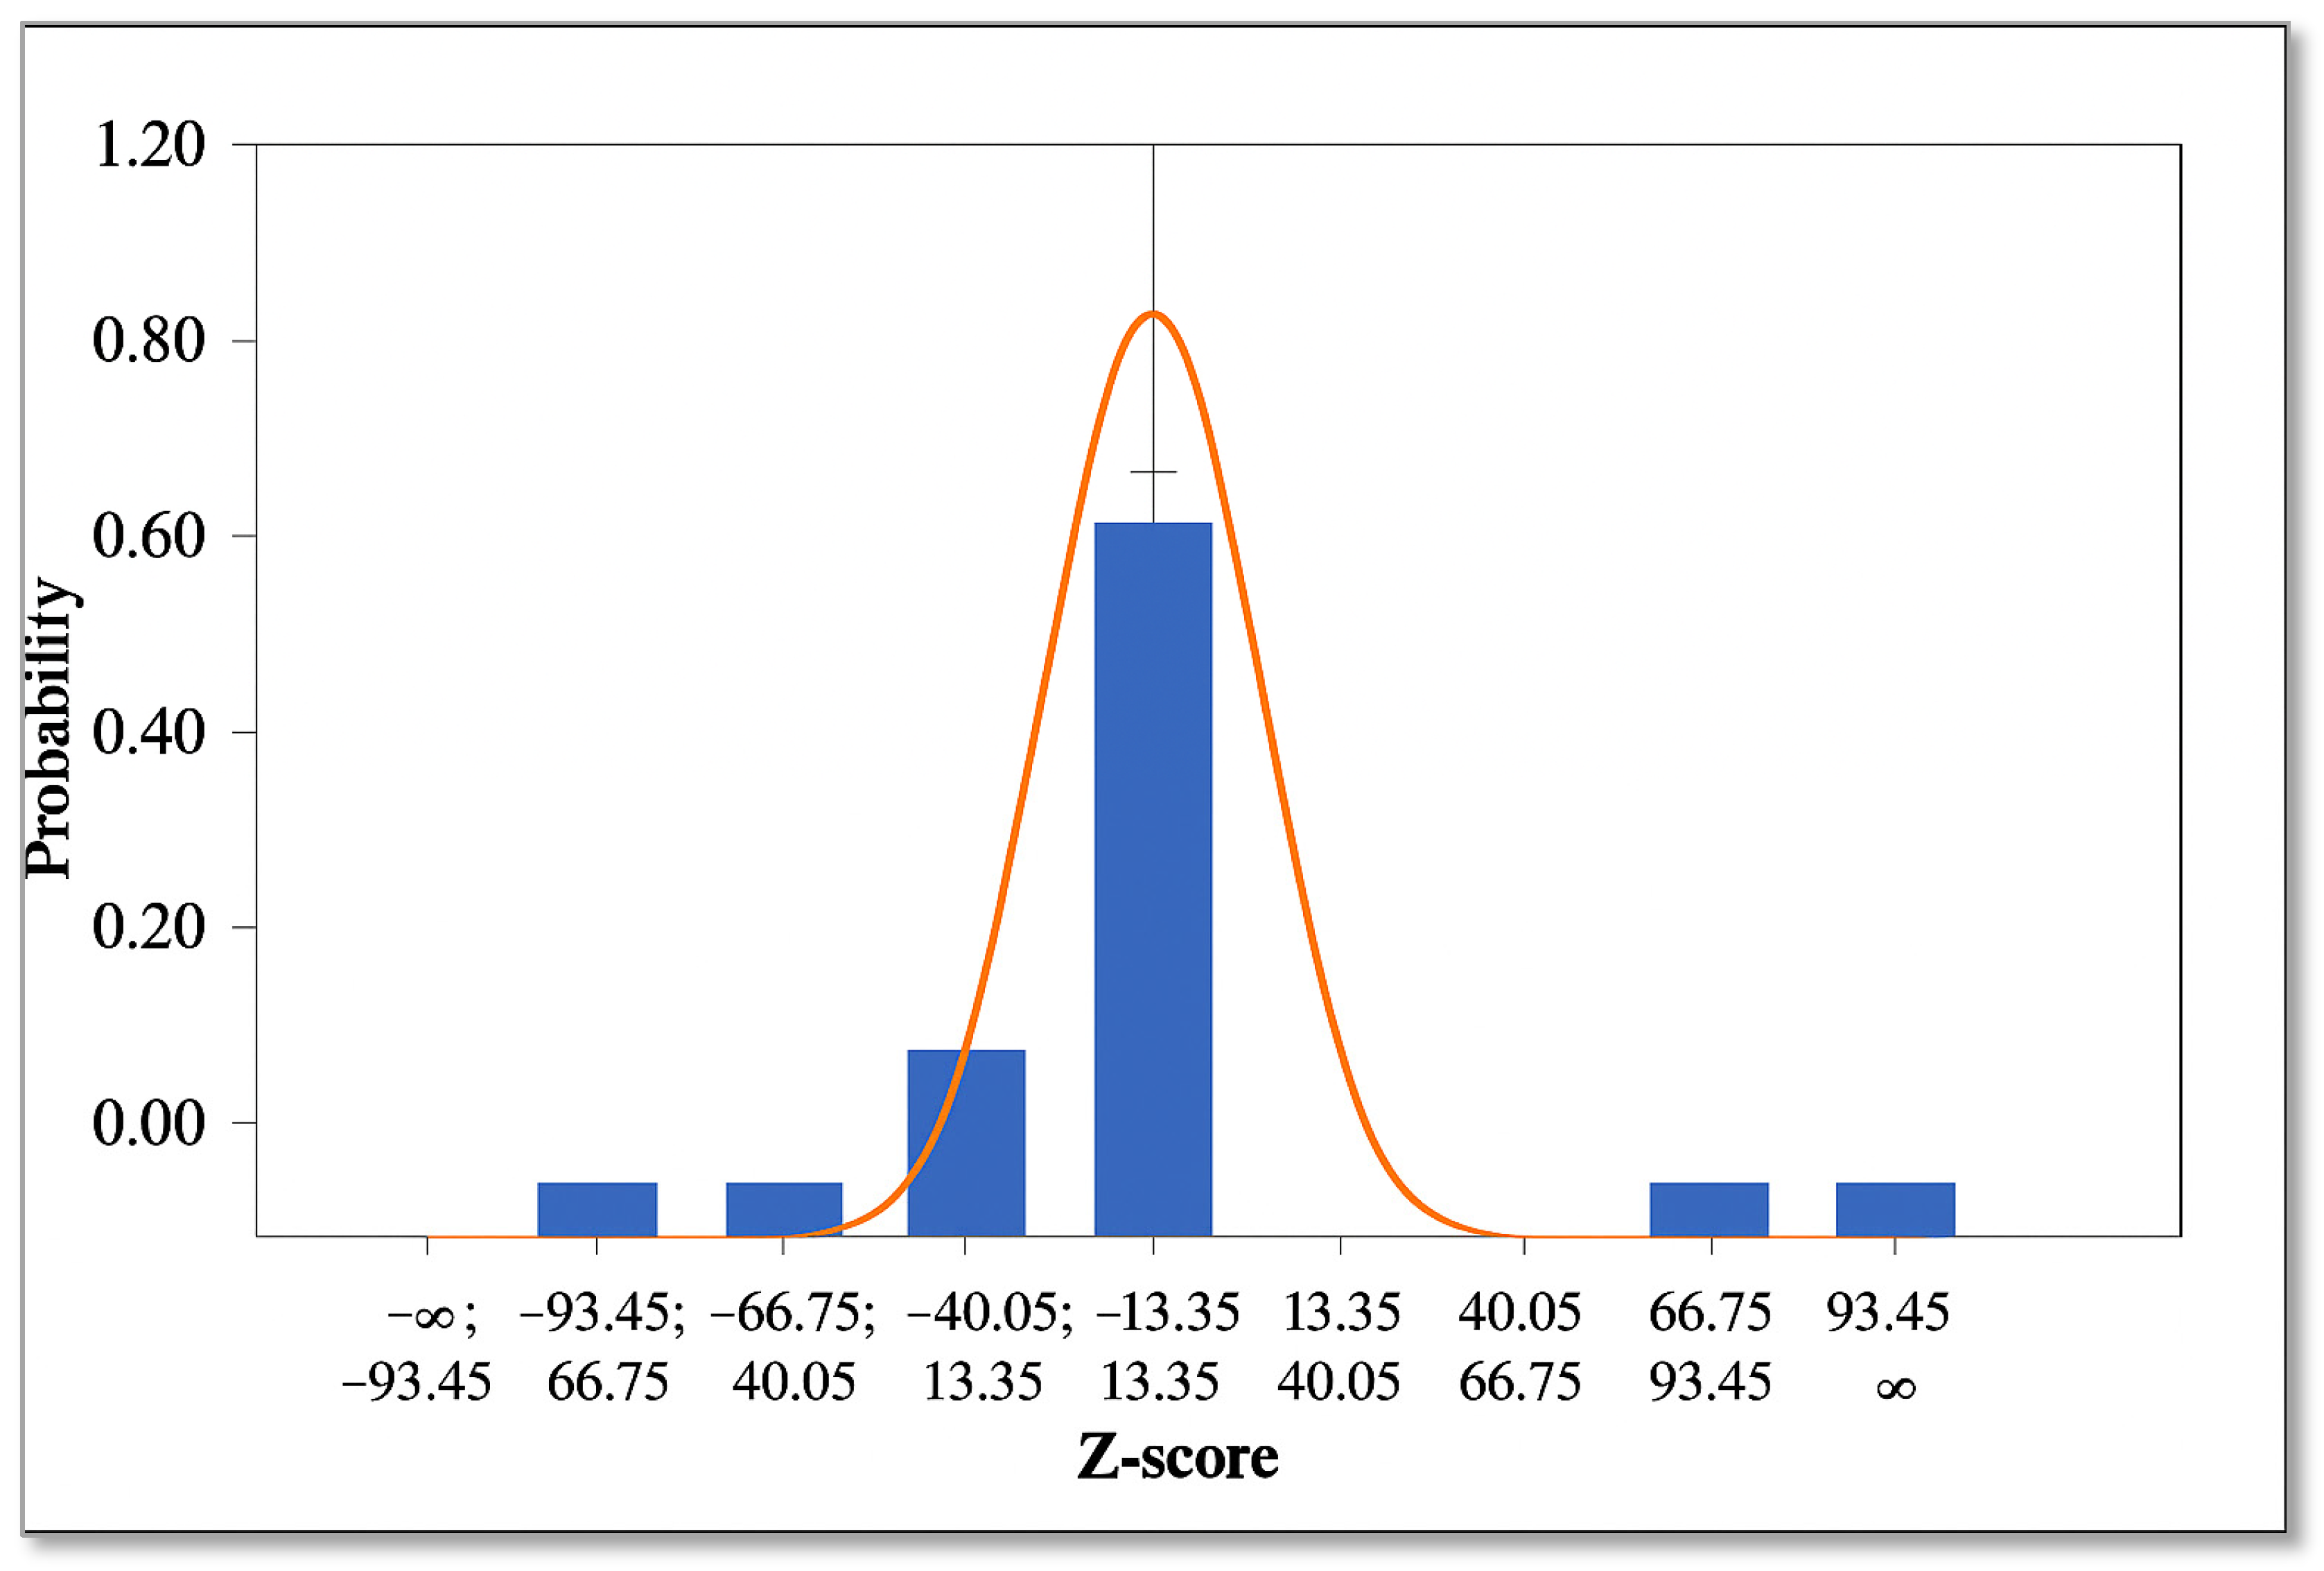
Figure 3 below shows that some studies had very high CIs (7.05, 7.06, −6.29 and 6.30), while others had very small CIs (0.00–0.01).
Figure 4 shows the distribution of effect sizes in a funnel plot to further observe if substantial asymmetry is observation.
3.1.7. Failsafe Tests
To further ascertain the robustness of the selected studies, the failsafe test, Orwin’s failsafe N, Gleser and Olkin method and Rosenthal failsafe approaches were applied. These tests together help in estimating the reliability and stability of meta-analysis conclusions by estimating the hypothetical null results that would be required to make the effect insignificant as a way of testing for the presence of publication bias (
Snijders, 2015).
Table 6 summarizes the results of the failsafe tests.
The Rosenthal failsafe N indicates that it would take 19,863 unpublished null studies to make the current meta-analysis results insignificant, indicating that the current meta-analysis results are sufficiently robust (
Fragkos et al., 2017). The Orwin’s failsafe N results, however, indicate that it would take 43 unpublished null studies to make the meta-analysis results trivial. This falls slightly short of the recommended reasonable threshold of ≥50 unpublished null studies, necessitating further tests of robustness (
Howell & Shields, 2008). The Fisher’s failsafe test, however, re-affirms the robustness of the meta-analysis by indicating that it would take a total of 12,891 unpublished null hypotheses, far above the recommended threshold of ≥500 studies, to make the results insignificant (
Snijders, 2015). These tests together affirm that the current results are not distorted by publication bias and are statistically robust, making the results reliable
4. Discussion
The meta-analysis results indicate no statistically significant effect between green banking and banks’ profitability for the overall effect and even for the subgroup meta-analysis. The relationship though was found to be positive, indicating that green banking and financing activities positively influence banks’ profitability, although not statistically significantly. When the relationship was tested through subgroup analysis, the relationship between green monetary allocations or green loans and banks’ profitability was even weaker, with an effect size of 0.03 compared to both the overall effect of 0.14 and the stakeholder’s perception on the financial implications of green banking, as indicated by the effect size of 0.36.
These results align with the findings of other studies, such as
Putri et al. (
2022), which established a positive relationship between the number of ATMs and the profitability of Indonesian banks. A study by
Han et al. (
2019), however, established that the impact of green credit policies on banks’ profitability tends to diminish over time as it depends on the banks’ ability to adapt and innovate. The majority of the studies, including (
Sutrisno et al., 2024) in Indonesia, (
Valencia & Calabuig-Tormo, 2023) in Colombia and (
Julia & Kassim, 2016) in Bangladesh, established a positive significant relationship between green banking practices and banks’ profitability. The studies (
T. Zhou et al., 2025) and (
Siauwijaya et al., 2025) argue that the interaction between green banking activities and profitability depends on the prevailing market conditions. While the study of
Gulzar et al. (
2024) have linked green banking activities to environmental performance, their impact on banks financial performance was established to be insignificant.
The high heterogeneity among the studies is explained by the high discrepancies in the number of observations used in the studies, the diverse regulatory and geographical contexts, as well as the different approaches applied for analysis across the selected studies. This is also observed by other studies from India (
Kumar et al., 2024), Pakistan (
Rehman et al., 2021), and Vietnam (
My, 2024), which identified different factors influencing the adoption of green banking practices based on the diverse social economic and cultural contexts. This emphasizes the variability in how green financing or banking activities are measured or operationalized.
In essence, the absence of a significant overall effect suggests that the relationship between green financing and green banking activities in terms of banks’ profitability is not universally determined and highly likely to depend on the specific context. In some cases, depending on other factors, such as the prevailing economic, regulatory, social cultural contexts, the banks might profit or struggle to raise revenue through green lending. If the conditions are favorable, the banks might enjoy financial benefits, but if the climate-related risks become more eminent, the banks might end up having high climate-related non-performing loans or stranded assets or become victims of transition risks, affecting their profitability negatively. For instance, a study in China established a positive relationship between green credit and bank profitability (
T. Zhou et al., 2025), while one in Indonesia established a negative relationship between green credit policies and banks’ financial performance measured as the net profit margin (
Siauwijaya et al., 2023).
5. Conclusions and Recommendations
In conclusion, this study observes that the overall effect size of the relationship between green financing and green banking practices in terms of banks’ profitability is positive but insignificant. These results suggest that green initiatives such as green lending, ESG integration, environmental disclosure, digital banking, et cetera, may not consistently translate into improved bank profitability. The findings therefore imply that, while green finance bears great potential for enhancing sustainability in the financial sector, the impact on banks’ financial performance is not universal and is highly influenced by operational and contextual factors.
Considering these findings therefore, context-specific green financing approaches are highly recommended rather than viewing green financing as a one-size-fits-all solution. Banking institutions should align their green financing initiatives with local regulatory frameworks, strategic goals, and market demands to realize the benefits of green financing and green banking activities. In addition, these initiatives should take in consideration bank-specific factors. For instance, small banks could prioritize low-cost green banking interventions such as investing in digital tools to reduce their overall operational costs, while large banks might expand their scope to more capital-intensive interventions such as financing large renewable energy projects, among others.
Similarly, banks in developed economies are more likely to benefit from mature regulatory frameworks and markets. As such, banks in these economies might benefit from advancing green financial instruments such as sustainability-linked loans, green bonds, etc. In contrast, financial institutions in developing economies might benefit more by adapting a gradual market tailored approach (e.g., begin by deploying simple credit policies, conducting green-related pilot programs targeting key sectors such as SMEs, agriculture, among others). Policymakers in developing economies and markets should prioritize more creating an enabling regulatory environment, offering technical assistance and incentives and related initiatives, while the policy direction in more mature and developed markets could go beyond creating an enabling green banking practice but focus on refining regulatory frameworks to encourage high-integrity green innovation and foster market discipline. Ultimately, such localized interventions are more likely to translate into financial benefits as they align with local market readiness, institutional capabilities and regulatory frameworks.
To further explore this nexus, future research studies could investigate the moderating and mediating variables that shape the relationship between green financing and banks profitability using panel data and longitudinal approaches.
Author Contributions
Conceptualization, M.K.M.; methodology, M.K.M.; software, M.K.M.; validation, M.K.M. and S.K.E.-G.; formal analysis, M.K.M. and S.K.E.-G.; investigation, M.K.M.; resources, M.K.M.; data curation, M.K.M.; writing—original draft preparation, M.K.M.; writing—review and editing, S.K.E.-G. and M.F.-F.; visualization, M.K.M.; supervision, M.F.-F.; project administration, S.K.E.-G.; funding acquisition, M.F.-F. All authors have read and agreed to the published version of the manuscript.
Funding
This research did not receive external funding.
Institutional Review Board Statement
Not applicable.
Data Availability Statement
Acknowledgments
The authors thank the Hungarian University of Agriculture and Life Sciences and Stipendium Hungaricum for the support.
Conflicts of Interest
The authors declare no conflicts of interest.
References
- Afzal, A., Hasnaoui, J. A., Firdousi, S., & Noor, R. (2024). Climate change and the European banking sector: The effect of green technology adaptation and human capital. Review of Accounting and Finance, 23(3), 394–418. [Google Scholar] [CrossRef]
- AJE. (2024). Assessing and avoiding publication bias in meta-analyses|AJE. Available online: https://www.aje.com/arc/assessing-and-avoiding-publication-bias-in-meta-analyses/ (accessed on 16 April 2025).
- Aslam, W., & Jawaid, S. T. (2023). Green banking adoption practices: Improving environmental, financial, and operational performance. International Journal of Ethics and Systems, 39(4), 820–840. [Google Scholar] [CrossRef]
- Del Gaudio, B. L., Previtali, D., Sampagnaro, G., Verdoliva, V., & Vigne, S. (2022). Syndicated green lending and lead bank performance. Journal of International Financial Management and Accounting, 33(3), 412–427. [Google Scholar] [CrossRef]
- Fisher, R. A. (1915). Frequency distribution of the values of the correlation coefficient in samples from an indefinitely large Population. Biometrika, 10(4), 507–521. [Google Scholar] [CrossRef]
- Fragkos, K. C., Tsagris, M., & Frangos, C. C. (2017). Exploring the distribution for the estimator of Rosenthal’s “fail-safe” number of unpublished studies in meta-analysis. Communications in Statistics-Theory and Methods, 46(11), 5672–5684. [Google Scholar] [CrossRef]
- Galán, J. E., & Tan, Y. (2024). Green light for green credit? Evidence from its impact on bank efficiency. International Journal of Finance and Economics, 29, 531–550. [Google Scholar] [CrossRef]
- Ghajarzadeh, M. (2024). Interpretation of results in the forest plot. In Systematic review and meta-analysis: Stepwise approach for medical and biomedical researchers (pp. 153–156). Academic Press. [Google Scholar] [CrossRef]
- Gulzar, R., Bhat, A. A., Mir, A. A., Athari, S. A., & Al-Adwan, A. S. (2024). Green banking practices and environmental performance: Navigating sustainability in banks. Environmental Science and Pollution Research, 31(15), 23211–23226. [Google Scholar] [CrossRef]
- Han, Z., Xu, H., & Tu, K. (2019, October 11–12). Research on the effectiveness of green credit policy-based on the empirical study of 19 listed banks in China. 2019 3rd International Conference on Data Science and Business Analytics, ICDSBA (pp. 202–205), Istanbul, Turkey. [Google Scholar] [CrossRef]
- Hansen, C., Steinmetz, H., & Block, J. (2021). How to conduct a meta-analysis in eight steps: A practical guide. Management Review Quarterly, 72(1), 1–19. [Google Scholar] [CrossRef]
- Herwadkar, S. S., Dhingra, S., Goel, S., & Nair, R. A. (2025). Scopus-document details-are greens healthy for banks’ balance sheets?|signed in. Available online: https://www.scopus.com/record/display.uri?eid=2-s2.0-105000950335&origin=scopusAI (accessed on 15 April 2025).
- Howell, R. T., & Shields, A. L. (2008). The file drawer problem in reliability generalization: A strategy to compute a fail-safe N with reliability coefficients. Educational and Psychological Measurement, 68(1), 120–128. [Google Scholar] [CrossRef]
- Huang, F., Zhu, H., & Wu, S. (2025). Green credit, monetary policy, and bank risk-taking. Finance Research Letters, 79, 107289. [Google Scholar] [CrossRef]
- Jain, A., Yadav, P., & Kochhar, K. (2024). Do green banking practices change customers’ attitudes and behavior: A conceptual model. Indian Journal of Finance, 18(4), 25–43. [Google Scholar] [CrossRef]
- Julia, T., & Kassim, S. (2016). Green financing and bank profitability: Empirical evidence from the banking sector in Bangladesh. Al-Shajarah, 21(Specialissue), 307–330. [Google Scholar]
- Kumar, J., Rani, G., Rani, M., & Rani, V. (2024). Do green banking practices improve the sustainability performance of banking institutions? The mediating role of green finance. Social Responsibility Journal, 20(10), 1990–2007. [Google Scholar] [CrossRef]
- Lakens, D. (2013). Frontiers|Calculating and reporting effect sizes to facilitate cumulative science: A practical primer for t-tests and ANOVAs. Available online: https://www.frontiersin.org/journals/psychology/articles/10.3389/fpsyg.2013.00863/full (accessed on 16 April 2025).
- Li, Y., & Wu, G. (2025). The green advantage: Mapping the profit power of green credit in commercial banks. Economic Change and Restructuring, 58, 29. [Google Scholar] [CrossRef]
- McLellan, J., & Perera, R. (2018). 21 Restricted meta-analyses versus full meta-analyses: Threshold number of studies based on study sample size. BMJ, 23, A11.1–A11. [Google Scholar] [CrossRef]
- My, S. T. (2024). Promoting sustainable development through improving green banking behaviour. In Sustainable finance (pp. 215–236). Springer. Part F4262. [Google Scholar] [CrossRef]
- Nanda, S., & Bihari, S. C. (2012). Profitability in banks of India: An impact study of implementation of green banking. International Journal of Green Economics, 6(3), 217–225. [Google Scholar] [CrossRef]
- Olasiuk, H., Kumar, S., Singh, S., Nagpal, G., & Ganushchak, T. (2023, December 8–9). Thematic clustering of green banking research using topic modelling and text mining: A machine learning approach. 4th IEEE International Conference on Smart Technologies in Computing, Electrical and Electronics, ICSTCEE, Bengaluru, India. [Google Scholar] [CrossRef]
- Page, M. J., McKenzie, J. E., Bossuyt, P. M., Boutron, I., Hoffmann, T. C., Mulrow, C. D., Shamseer, L., Tetzlaff, J. M., Akl, E. A., Brennan, S. E., Chou, R., Glanville, J., Grimshaw, J. M., Hróbjartsson, A., Lalu, M. M., Li, T., Loder, E. W., Mayo-Wilson, E., McDonald, S., … McGuinness, L. A. (2021). The PRISMA 2020 statement: An updated guideline for reporting systematic reviews. BMJ, 372, n71. [Google Scholar] [CrossRef]
- Pasha, R., & Elbages, B. (2022). Green banking practices: The impact of internet banking on bank profitability in egypt. Corporate and Business Strategy Review, 3(2), 65–75. [Google Scholar] [CrossRef]
- Peterson, R., & Brown, S. (2005). On the use of beta coefficients in meta-analysis. The Journal of Applied Psychology, 90, 175–81. [Google Scholar] [CrossRef]
- Pradnyani, N. L. P. S. P., Suartana, I. W., Sari, M. M., & Budiasih, I. G. A. N. (2024). Achieving financial performance through the implementation of sustainable banking and credit risk: Analysis based on natural environmental sustainability. Journal of Sustainability Science and Management, 19(8), 70–88. [Google Scholar] [CrossRef]
- Putri, P. I., Rahayu, K. A., Rahmayani, D., & Siregar, M. E. S. (2022). The effect of green banking and financial performance on banking profitability. Quality-Access to Success, 23(191), 38–45. [Google Scholar] [CrossRef]
- Rehman, A., Ullah, I., Afridi, F.-e.-A., Ullah, Z., Zeeshan, M., Hussain, A., & Ur Rahman, H. (2021). Adoption of green banking practices and environmental performance in Pakistan: A demonstration of structural equation modelling. Environment, Development and Sustainability, 23(9), 13200–13220. [Google Scholar] [CrossRef]
- Siauwijaya, R., Meiryani., & Lesmana, T. (2023). The impacts of green credit policy, bank-specific, industry-specific, and macroeconomic variables on bank profitability in indonesia. Journal of System and Management Sciences, 13(6), 502–522. [Google Scholar] [CrossRef]
- Siauwijaya, R., Yusanto, T. J., & Grania, G. C. (2025). The impacts of green credit policy and competition on bank profitability in Indonesia. Global Business and Economics Review, 32(2), 134–159. [Google Scholar] [CrossRef]
- Singh, R. P., Nagdev, K., & Kishor, N. (2022). Do green banking initiatives lead to competitiveness and improved financial performance? An empirical analysis of Indian banks. International Journal of Public Sector Performance Management, 10(1), 22–40. [Google Scholar] [CrossRef]
- Smelser, N., & Baltes, P. (2001). Effect size-an overview|ScienceDirect topics. Available online: https://www.sciencedirect.com/topics/nursing-and-health-professions/effect-size (accessed on 16 April 2025).
- Snijders, T. A. B. (2015). Hypothesis testing: Methodology and limitations. In International encyclopedia of the social & behavioral Sciences (2nd ed., pp. 494–499). Elsevier. [Google Scholar] [CrossRef]
- Sutrisno, S., Widarjono, A., & Hakim, A. (2024). The role of green credit in bank profitability and stability: A case study on green banking in indonesia. Risks, 12(12), 198. [Google Scholar] [CrossRef]
- Valencia, D. C., & Calabuig-Tormo, C. (2023). The impact of green banking activities on banks’ green financing and environmental performance. Scientific Papers of the University of Pardubice, Series D: Faculty of Economics and Administration, 31(1), 1681. [Google Scholar] [CrossRef]
- Wright, D. B., & Herrington, J. A. (2011). Problematic standard errors and confidence intervals for skewness and kurtosis. Behavior Research Methods, 43(1), 8–17. [Google Scholar] [CrossRef]
- Zhou, T., Chen, G., Su, Y., Yang, T., & Ding, J. (2025). Green bond underwriting, financial openness, and profitability of commercial banks. International Review of Financial Analysis, 99, 103900. [Google Scholar] [CrossRef]
- Zhou, Z., Tong, J., Lu, H., & Luo, S. (2024). The impact of green finance and technology on the commercial banks’ profit and risk. Finance Research Letters, 66, 105715. [Google Scholar] [CrossRef]
| Disclaimer/Publisher’s Note: The statements, opinions and data contained in all publications are solely those of the individual author(s) and contributor(s) and not of MDPI and/or the editor(s). MDPI and/or the editor(s) disclaim responsibility for any injury to people or property resulting from any ideas, methods, instructions or products referred to in the content. |
© 2025 by the authors. Licensee MDPI, Basel, Switzerland. This article is an open access article distributed under the terms and conditions of the Creative Commons Attribution (CC BY) license (https://creativecommons.org/licenses/by/4.0/).


