Abstract
A ban on short selling exists on several exchanges, especially in emerging markets. In most cases, short selling has always been prohibited, thus making it difficult to examine the ban’s effect on price discovery. In this paper, we consider data from the Dhaka Stock Exchange (DSE) to test for a short selling ban on market efficiency. The analysis examines runs in daily stock returns and then forms a distribution of return clusters according to their duration. Using Monte Carlo simulation, we find that runs of longer duration appear more frequently in the DSE data than we would expect in efficient markets. We compare these results to stocks in the Dow Jones Industrial Average (DJIA). We find that the same runs tests accord with market efficiency for liquid and easily shorted DJIA stocks.
1. Introduction
The practice of short selling and profiting from a fall in share price has been around for at least four centuries. In 1609, Isaac Le Maire formed a secret company to short shares in the East India Company in anticipation of a new French firm that would offer stiff competition (Bris et al. 2007). As events played out, the creation of the French rival never occurred, and the ensuing litigation provided yet another argument to ban short selling practices in the marketplace.
Potential abuse has led regulators to ban short selling in a number of national exchanges. Restrictions on short selling are especially commonplace in emerging markets, and exist because of an outright ban or lack of institutional mechanisms to borrow stock.1 Moreover, in many of these markets there are no parallel option markets to effect a short sale through the buying of puts or writing of calls. As short selling restrictions inhibit information flow, market prices may be slow to adjust to news.
While potential abuse has led to a ban on short selling in a number of exchanges, a strain of research suggests that short sale restrictions may inhibit the price discovery process. For example, Miller (1977) argues that with divergence of opinion, a short sales ban results in the overvaluation of a security. Diamond and Verrecchia (1987) develop a formal model to discuss the importance of short selling in the asset price adjustment process. They show that constraints do not bias prices upward, although they do reduce the adjustment speed of prices to private information.
One way to test for the effect of a short selling ban is to investigate any differences in price discovery across regime shifts. For example, Beber and Pagano (2013) examine how temporary bans in short selling around the world following the financial crisis of 2007–2009 led to a deterioration in market liquidity.
This was especially true for stocks with small market capitalization and no listed options.2 They displayed slower price discovery, especially in bear markets.3
A short selling ban may hinder price discovery even when news is positive. This can occur if investors overreact to information, leading to a reversal of prices (see, De Bondt and Thaler 1985). Atkins and Dyl (1990) first find evidence of market overreaction using daily returns. To the extent that market corrections require a decrease in returns, a ban on short sales may further inhibit the price discovery process.
In the following analysis, we examine the effect of short sale restrictions on market efficiency for the Dhaka Stock Exchange (DSE). The DSE has always had a ban on short selling of securities, so performing any type of test that depends upon a regime change is not possible. Instead, we rely on a battery of runs tests to examine market efficiency and the ability of prices to adjust rapidly to new information. In particular, we test for statistical independence, and employ a standard non- parametric runs test that looks at clusters of price changes in the same direction.
To further test for the effect of short selling restrictions, we also consider the distribution of daily price runs. Any evidence of an asymmetric distribution with an unusual number of long, negative return runs would suggest that a ban on short selling inhibits rapid price adjustment to adverse information. On the other hand, if investors overreact to positive news, a short sale ban may delay any market correction. In this situation, the distribution of daily price runs would display an unusual number of longer runs with positive price changes.
Previous work on the Dhaka Stock Exchange provides conflicting evidence regarding market efficiency on the Dhaka Stock Exchange. Islam and Khaled (2005) consider DSE index returns for the period 1990–2001. They suggest that structural changes put in place after the market crash of 1996 led to market efficiency. Their statistical tests show short term predictability of share prices prior to the crash, but not subsequently.
Mollik and Bepari (2009) use the runs test to investigate the weak form market efficiency of the DSE. They examine two stock indices from 2002–2007 to see whether there was an unusual number of runs. In contrast to Islam and Khaled (2005), they find that returns do not follow a random walk, and reject weak form efficiency of the DSE in the post-crash period.
In addition to DSE index returns, Mobarek et al. (2008) examine individual stock returns from 1988–2000 provided by a data vendor. Even allowing for structural changes following the 1996 crash, they find that there is significant auto correlation over the sample period. They reject weak form market efficiency and call for additional studies using market price information.
Our analysis updates the sample time period, and following the suggestion of Mobarek et al. (2008), examines the dynamics of individual stock price data obtained directly from the exchange. This allows us to also adjust for dividends, share splits, and other corporate events. Additionally, we introduce runs tests that specifically investigate for the effect of short sale restrictions on price adjustment; for robustness, we compare our results to evidence from the U.S. and Australian stock markets.
The runs test analysis suggests that DSE stock returns are not independent. Moreover, DSE stock prices appear to incorporate information more slowly than one would expect, with the daily runs distributions exhibiting fatter tails for DSE stocks than for US stocks. In other words, for both good and bad news, the DSE ban on short selling causes prices to adjust more slowly to a new equilibrium, resulting in a disproportionate number of lengthy return runs. For emerging market exchanges that have never experienced short selling, this novel application of the runs test provides a valuable tool to analyze the effect of short sale restrictions on asset price dynamics.
2. Data and Methodology
2.1. Data
The analysis focuses on the 21 most liquid stocks on the Dhaka Stock Exchange (DSE). We use daily stock prices from January 1999 through December 2014. This yielded roughly 4000 stock prices for each of the 21 different stocks.
In addition to looking at individual stock price changes, we also consider stock indices representing the DSE market as a whole. As no single broad index exists for the entire sample period, we rely on two of the more popular indices. The DSE Broad Index, referred to as DSEX, represents 97% of market capitalization. This free-float broad index became effective in 2013. The previous broad index, the DSE General Index or DGEN, existed from December 2002 until July 2013. We thus use the DGEN index from December 2002 through July 2013, and continue with the DSEX index from August 2013 through the end of 2014. Hereafter, we will refer to the broad market index as the DSEX, recognizing that it represents both the DGEN and DSEX in their respective sample periods.
The Dhaka Stock Exchange library provided daily stock prices and data for the Dhaka Stock. We adjust all prices for cash and stock dividends, splits, bonus and right shares. It is important to remember that the 21 individual stocks chosen are the most liquid stocks, have trading on virtually every business day; therefore, they are likely among the most efficiently-priced stocks on the Dhaka Stock Exchange.
For matters of robustness, we compare the DSE results to similar tests using US data. Specifically, we consider the Dow Jones Industrial Average and the component stocks. The analysis covers the similar 1999–2014 period for individual stocks and 2002–2014 for the DJIA index. Because Visa was only a constituent stock of the index for part of the time, we exclude it from the analysis. Thus, we examine price dynamics for the DJIA index and the remaining 29 stocks.
2.2. Methodology—Calculating Runs and Testing for Statistical Independence
The runs test is a non-parametric test that can be used to examine randomness in stock returns. Let returns be defined as (Pt+1 − Pt)/Pt, where Pt is the adjusted stock price on day t. We then define a run as a string of daily returns all of the same sign. If the data follows a binomial distribution, we assume that a 0 return continues the run. Thus, the end of a run and beginning of a new run is when the sign changes from either positive to negative, or vice versa. Put another way, the end of a run only occurs when there is a sign change.
To illustrate how runs are calculated, let P denote a positive return, N a negative return, and 0 denote no change in daily prices. Suppose that the price data yields the following string of returns:
PPPP N0N PP N PPP0P NNNNN PPP NN
This string of 25 daily returns includes 8 separate runs, the shortest being a 1 day run with a negative return, and the longest a 5 day run for both positive and negative returns.
Suppose, for the moment, we believe that 50% of returns are positive and 50% are negative. Given this binomial distribution, we can calculate the number of runs and see if it is more or less than the number we expect. If the number of runs differs significantly from what we expect, we reject the null hypothesis that the data was randomly generated and accept the alternative that the sequence was not produced in a random manner.
Comparing the number of runs to the expected value is a test of statistical independence. If, for example, we find significantly fewer runs than expected, that would suggest that the data is highly clustered. Thus, positive returns likely follow positive returns, and negative returns likely follow negative returns, a result that implies a positive serial correlation of returns. On the other hand, if there is little clustering and signs change frequently, such a pattern would indicate negative autocorrelation.
From the above discussion, we compare observed runs patterns to what we expect. In turn, expectations depend upon the true probability of success, for example, the probability of observing a positive return and the number of trials or observations in the sample. In our samples, the number of observations is approximately 4000 for stocks and 3200 returns for each index. With large samples, it is reasonable to assume as a first approximation that the observed frequency of positive outcomes is equal to the true probability of “success.” Mollik and Bepari (2009) implicitly follow this line of reasoning and make this assumption in their runs tests.
Table 1 presents the percentage of positive returns and negative returns for each asset class. For both the DSEX and Dow Jones indexes, the observed frequency of positive returns is close to 53%. For stocks, however, the Dhaka and U.S. stocks diverge in the proportion of positive returns. For DSE stocks, the average frequency of positive returns is 46.33%, whereas for stocks in the Dow, the average percentage of positive returns is 51.13%.

Table 1.
Proportion of Positive and Negative Returns (DSE vs. DJIA).
2.3. Methodology—Monte Carlo Simulation and Forming Expectations
To form expectations on the number of runs to expect in a sample, we rely on a Monte Carlo simulation. Consider the case of the DSEX that has 3119 returns. If we observe positive returns 53% of the time, we generate 3119 returns from the binomial distribution, with a success rate of 53%. We then count the number of runs found in our trial. The simulation then repeats this process 10,000 times to form a distribution of runs generated from all the trials.
Figure 1 illustrates the results of our 10,000 trial simulation given 3119 returns. Based on a success rate of 53%, 95% of the time we find that the number of runs is between 1497 and 1609. Thus, if the number of runs observed for the DSE Index is outside the 95% confidence interval, we reject the null hypothesis of statistical independence. If the number of runs exceeds 1609, that suggests negative serial correlation, whereas runs fewer than 1497 implies positive serial correlation.
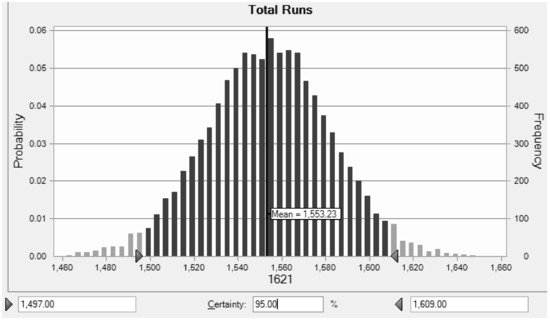
Figure 1.
Monte Carlo Simulation for Number of Runs Observed over 10,000 Trials. This graph assumes the DSE based parameters of 3119 returns and a success rate of 53%.
We perform a similar Monte Carlo simulation for the DJIA index with 3272 returns. Again assuming a 53% success rate, 95% of the time the number of runs is between 1573 and 1685. If the observed number of runs is outside this confidence interval, we reject the null hypothesis of independent returns.
2.4. Methodology—The Distribution of n Day Runs and Implications for the Short Selling Ban
While the standard runs test considers statistical independence, it does not directly examine whether the tails of the runs distribution are larger than expected. If, as Diamond and Verrecchia (1987) and Beber and Pagano (2013) suggest, a short selling ban inhibits price discovery given bad news, then the returns distribution would be more negatively skewed than in an efficient market. This implies finding more runs than expected in the left hand tail of the distribution. Additionally, if markets overreact after good news, a short selling ban might impede a correction. If that were the case, we would observe longer, positive return runs than expected yielding a fatter right hand tail of the distribution.
To appreciate what the tails of the n day run distribution might look like, consider again the Monte Carlo simulation. For each trial, we can also collect the number of n day runs we observe. So for example, we can observe the number of two day, negative return runs (n = −2) in one trial. We can then generate the average number of −2 day runs for the 10,000 trials and calculate a 95% confidence interval for each n day run. We collect this information for all values of n starting with negative return runs of 10 days or longer (n = −10+) all the way up to positive return runs of 10 days or longer (n = 10+).
To give the flavor of what the tails of the distribution might look like, consider a probability of success equal to 50% for a sample of 4000 returns. Table 2 illustrates the tails of the distribution under these conditions. The second row shows the percentage of n day runs we observe, on average, for the 10,000 trials. From Table 2, negative and positive return runs of 10+ days each typically comprise 0.10% of all runs in a sample. Looking between |5| and |10+| day runs, we see that in total, this represents 6.16% of all runs (row 3, Table 2). Thus, the 5% tails of the distribution are for runs that are 5 days or longer.

Table 2.
Tails of the n day distribution (probability of success assumed equal to 50%).
In the following analysis, we examine the distribution of n day runs by splitting the sample into runs of 5 days or longer and runs between 1 and 4 days. Observing more runs than expected that are 5 days or longer suggests fat tails, and implies a short selling ban impedes price discovery leading to extended periods for markets to digest new information. If that result is obtained, it necessarily follows that shorter run periods (1–4 days) will have fewer runs than expected in an efficient market.
3. Empirical Results
3.1. Results for Statistical Independence of Index Returns
The first test is to see whether index returns are statistically independent. Consider the returns to the DSE index. In Table 3, we observe that the total number of runs based on DSEX returns equals 1334, below the lower bound of the 95% confidence interval. We reject the null hypothesis of statistical independence, and the fact that there are fewer runs than expected suggests a positive, serial correlation. For returns on the DSE index, similar sign returns follow each other more than expected, a result that indicates that the markets are slow to adjust to new information.

Table 3.
Statistical Independence of Index Returns.
For returns on the Dow Jones Industrial Average, the number of runs equals 1727, which is slightly higher than the upper bound of the 95% confidence interval, 1685. This result also rejects statistical independence, instead implying a negative serial correlation of returns. A finding of slight negative serial correlation is in line with earlier studies of U.S. markets. Fama (1965), for instance, finds that 8 of the 30 stocks listed in the Dow had negative serial correlations, but that most of the serial correlations are less than 0.05. French and Roll (1986) repeat Fama’s tests for NYSE and AMEX stocks during 1963–1982 period. They report a small but significant negative serial correlation of daily returns. To get a better idea of the runs distribution for both indexes, Figure 2A,B plots the number of n day runs and the 95% confidence intervals. From Figure 2A, the number of runs observed from −2 to +2 is well below the lower bound of each confidence interval. Conversely, the number of obtained longer runs tend to be higher than expected. In comparison, Figure 2B illustrates the runs distribution for the Dow Jones index. Short runs (−2 to +2) occur slightly more often than expected, while longer n day runs happen within expected boundaries. These results further confirm our previous findings. For the DSE index, information is more slowly digested in the market, thus yielding positive, serial correlation. On the other hand, for the U.S. index, runs accord nearly as anticipated, with only slightly more short-term runs than one might expect in an efficient market. In the next section, we consider the runs pattern for the individual stocks in both the DSE and DJ indexes and see if similar results are obtained.
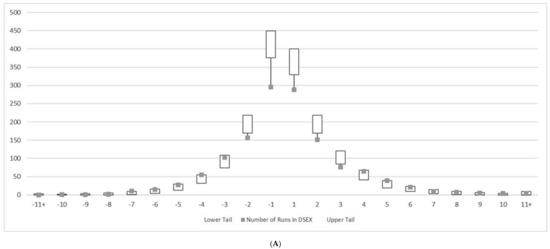
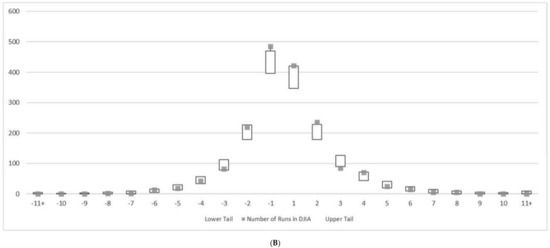
Figure 2.
(A) DSEX Number of n Day Runs and 95% Confidence Intervals; (B) DJIA Number of n Day Runs and 95% Confidence Intervals.
3.2. Run Results for Individual Stock Returns
In order to examine runs for individual stocks, we must first investigate the success rate of a positive return occurring for each firm in our sample. Figure 3A,B graph the percentage of positive and negative returns for the 21 DSE and 29 DJ stocks in our sample. As reported earlier, the average success rate for DSE stocks is 46.33% and equals 51.13% for DJ stocks. The figures reveal that the success rate for each individual stock is near the relevant average; therefore, we base our confidence intervals for DSE and DJ stocks on the 46.33% and 51.13% success rates, respectively.
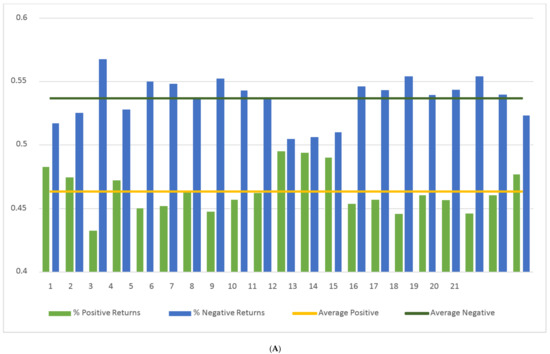
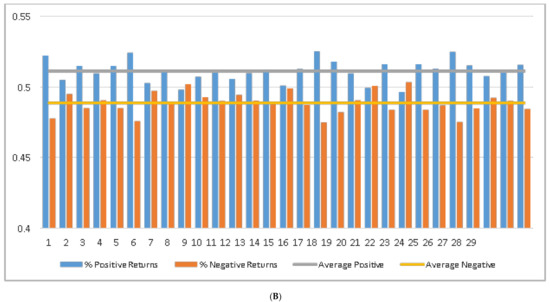
Figure 3.
(A) Percentage of Positive and Negative Returns in Each of the 21 DSE Stocks. Average success rate (positive returns) equals 46.33% for DSE stocks; (B) Percentage of Positive and Negative Returns in Each of the 29 Dow Jones Stocks. Average success rate (positive returns) equals 51.13% for Dow Jones stocks.
Table 4A displays the number of runs in the middle of the distribution for each of the 21 DSE stocks. From before, that includes runs that are between 1 and 4 days, and represents almost 90% of the distribution. Table 4B exhibits the number of runs for the same 21 firms, except in this panel, |n| is equal to or greater than 5. This region represents the tails of the distribution, and covers approximately 10% of all runs.
At the top of Table 4A,B are 95% confidence intervals for each n day run. For example, the number of expected 2-day, negative return runs (n = −2) is between 221 and 278. This assumes nearly 4000 stock returns and a success rate equal to 46.33%. Any violation below the lower bound of the confidence interval is shaded a dark gray, while a light gray cell denotes an upper bound violation.
From Table 4A, we observe a number of confidence interval violations. All but one breach the lower bound of the relevant 95% band. In contrast, Table 4B reveals several violations of the confidence interval’s upper bound. Taken together, these results suggest that the n day run distributions have a skinnier than expected middle, and have fat tails. This evidence implies that the short sale ban on the Dhaka Stock Exchange contributes to market lags in fully digesting information. Long runs for both positive and negative returns occur more frequently than you would expect if returns were independent.
As a matter of robustness, we compare these findings to the run distributions of U.S. stocks and see if similar results are obtained. Table 5A,B replicate the analysis for 29 of the 30 stocks in the DJIA. The Dow Jones results are in stark contrast to those of the stocks in the DSE. Specifically, we note relatively few violations for the U.S. stocks. Roughly 5% of the entire sample breach the confidence intervals, as we would expect. Moreover, the violations are not all in one direction for the middle of the distribution and the other direction for the tails. Breaches of the upper and lower bound violations appear randomly sprinkled throughout Table 5A,B. Thus, the Dow Jones stocks, unlike those in the DSE, have n day return distributions which are consistent with return independence. Thus, the results suggest that U.S. markets incorporate information readily, and that returns follow some type of Markov process.
3.3. Further Tests of Robustness—Causality
The previous analysis shows that markets with short selling bans exhibit positive serial correlation and fat tail return distributions. However, that does not necessarily imply that it is the prohibition of short selling that causes market inefficiency. Islam and Khaled (2005) note that “emerging stock markets are in many cases characterised by a lower volume and frequency of trading (‘thin trading’), ease of manipulation by a few large traders, weaker disclosure and accounting requirements, settlement delays, and a generally less than smooth transmission of financial information.” Thus, any or all of these conditions, rather than a short selling ban, might lead to market inefficiencies and the return distributions for DSE stocks that we document.
To link a short selling ban with positive serial correlation and fat-tail return distributions, we look for a developed market that experienced a recent short-selling ban to see if the return distributions are structurally different before after the ban. In contrast to emerging markets, exchanges in developed countries tend to be more liquid, less prone to manipulation, and have greater informational transparency. If after the structural shift the returns distribution changes and looks similar to our DSE results, we can conclude that it is the short selling ban, and not other market impediments, that is at the root of our findings.
To perform our analysis, we turn to a natural experiment precipitated by the financial crisis. Worldwide, a number of countries banned short selling of stock on their national exchanges at the onset of the financial crisis. In some cases, regulators restricted the short selling ban to the stock of financial intuitions. Thus, we can examine run distributions before and after the ban and look for any differences. However, to do that, the short selling ban period must be long enough for the sample of runs to be indicative of the underlying population.
From Beber and Pagano (2013), we find that one of the longest short sale bans occurred in Australia, where prohibition of short selling financial institution stocks occurred from 22 September 2008 to 1 June 2009, a total of 170 trading days. The Australian Stock Exchange (ASX Group 2018) is the 15th largest, with market capitalization of $1.442 trillion (World Federation of Exchanges 2017). In its corporate overview, the ASX states that it operates in a “world class regulatory environment”, and its clearing houses are “among the most secure and well capitalised in the world.” To further confine our analysis to the most liquid stocks, we examine the nine financial institutions in the ASX 200 index.
Table 6 illustrates the number of runs observed 170 days before and after the ban for each of the financial institution stocks in the ASX 200 index. In 7 of 9 cases, and in total, there are fewer runs after the ban. This result suggests that a short selling ban contributes to inefficiency and a positive serial correlation of returns.

Table 6.
Number of Runs before (B) and After (A) Short Selling Ban in Australia.
Given the limited number of banned short selling days, we artificially constructed a longer time period by combining all nine stocks into one distribution. This simulates a return run distribution covering approximately six years. Figure 4A graphs the number of runs both before and after the ban. Similar to our earlier DSE results, there are fewer short runs (4 days or less) and more long runs (5 days or more) during the period in which short selling is banned. Figure 4B more clearly illustrates the long runs observed in the tails of the distribution. There are several more runs of positive returns that are 5 days or longer after the ban. Whereas the longest positive return run observed is 7 days before the ban, after the prohibition of short selling, we find one 10 day run. For negative return runs, the longest period observed is 8 days, whereas there are several examples of 9 and 10 day runs after the ban. In total, evidence from a natural experiment shows that prohibiting short sales contributes to relatively greater frequency of long runs, and reflects the market’s need for additional time to digest new information.
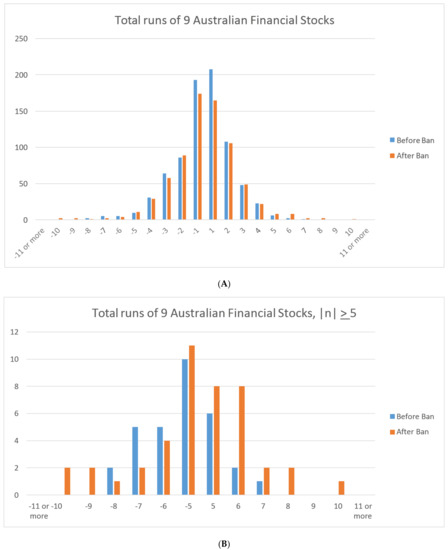
Figure 4.
(A) Runs Distribution for Australian Stock Returns Before and After Short Selling Ban; (B) Tails of the Runs Distribution for Australian Stock Returns (|n| ≥ 5 days).
4. Concluding Remarks
Regulators for a number of national exchanges have banned the practice of short selling. This is often the case in emerging markets. Whether the reason is fear of market manipulation or simply the lack of an institutional framework to borrow shares, a short selling ban potentially impedes the impounding of information in market prices.
Previous studies typically consider the effect of a short selling ban on price discovery by examining price dynamics before and after changes in short selling regulations. However, for many exchanges in emerging economies, investors have never been able to short sell securities. Thus, testing for differences across regime shifts is not possible.
To address that problem, our analysis compares the return runs we observe to what we would expect if markets were otherwise efficient. We first construct a simple runs test for statistical independence of daily stock returns, a necessary condition for market efficiency. A run is a series of returns all of the same sign, and the test calls for comparing the total number of runs in a given time period to the expected number of runs. We use Monte Carlo simulation to determine the latter. We then extend the analysis by considering the number of days for each run and form a distribution of return clusters according to their duration. Again, we compare the distribution to expectations based on a Monte Carlo simulation. The extended analysis considers whether runs of longer duration appear more or less frequently than anticipated if markets are efficient.
Additionally, we examine the symmetry of the distribution to see whether any effects are obtained for both positive and negative return runs.
Using data from the Dhaka Stock Exchange, we examine whether a short selling ban affects market efficiency. The runs test provides strong evidence that returns are not independent. Moreover, a runs distribution reveals fat tails, implying that runs of longer duration appear more frequently in the DSE data than we would expect in efficient markets.4 Thus, for both positive and negative return runs, we observe a relatively large number of runs that are 5 days or longer. We next consider similar tests for the DJIA and stocks within the index. This list includes extremely liquid stocks that are easily shorted. In contrast to the DSE results, the runs tests generally accord with market efficiency. Finally, to further show causality, we examine Australian stock return runs before and after a ban on short selling. After the prohibition, the findings are similar to the DSE results and reproduce the longer time necessary for markets to reach a new equilibrium. The evidence taken as a whole suggests that a short selling ban delays the market’s digestion of information. This is true for both positive and negative news. In light of these results, regulators may want to rethink the prohibition of short selling securities.
Author Contributions
The authors contributed equally to the research and writing of the manuscript.
Funding
This research received no external funding.
Acknowledgments
We would like to thank our discussant at the 2017 Paris Financial Management Conference, Suk-Joong Kim, the University of Sydney, Australia and two anonymous reviewers. We also appreciate the help of Assistant Editor, Eliza Dou, and the encouragement and editorial guidance of Duc Khuong Nguyen.
Conflicts of Interest
The authors declare no conflict of interest.
References
- Atkins, Allen B., and Edward A. Dyl. 1990. Price Reversals, Bid-Ask Spreads, and Market Efficiency. Journal of Financial and Quantitative Analysis 25: 535–47. [Google Scholar] [CrossRef]
- ASX Group. 2018. Australian Securities Exchange, LTD, Corporate Overview. Available online: https://www.asx.com.au/about/corporate-overview.htm (accessed on 26 September 2018).
- Beber, Alessandro, and Marco Pagano. 2013. Short-Selling Bans around the World: Evidence from the 2007–2009 Crisis. Journal of Finance 68: 343–81. [Google Scholar] [CrossRef]
- Bris, Arturo, William N. Goetzmann, and Ning Zhu. 2007. Efficiency and the Bear: Short Sales Markets around the World. Journal of Finance 62: 1029–79. [Google Scholar] [CrossRef]
- De Bondt, Werner F.M., and Richard Thaler. 1985. Does the Stock Market Overreact? Journal of Finance 40: 793–805. [Google Scholar] [CrossRef]
- Diamond, Douglas W., and Robert E. Verrecchia. 1987. Constraints on short-selling and asset price adjustment to private information. Journal of Financial Economics 18: 277–311. [Google Scholar] [CrossRef]
- Fama, Eugene F. 1965. The Behavior of Stock Market Prices. Journal of Business 38: 34–105. [Google Scholar] [CrossRef]
- French, Kenneth R., and Richard Roll. 1986. Stock Return Variances: The Arrival of Information and Reaction of Traders. Journal of Financial Economics 17: 5–26. [Google Scholar] [CrossRef]
- Islam, Ainul, and Mohammed Khaled. 2005. Tests of Weak-Form Efficiency of the Dhaka Stock Exchange. Journal of Business Finance and Accounting 32: 1613–24. [Google Scholar] [CrossRef]
- Jain, Archana, Pankaj K. Jain, Thomas H. McInish, and Michael McKenzie. 2013. Worldwide Reach of Short Selling Regulations. Journal of Financial Economics 109: 177–97. [Google Scholar] [CrossRef]
- Miller, Edward M. 1977. Risk, Uncertainty, and Divergence of Opinion. Journal of Finance 32: 1151–68. [Google Scholar] [CrossRef]
- Mobarek, Asma, A. Sabur Mollah, and Rafiqul Bhuyan. 2008. Market Efficiency in Emerging Stock Market: Evidence from Bangladesh. Journal of Emerging Market Finance 7: 17–41. [Google Scholar] [CrossRef]
- Mollik, A., and Md Bepari. 2009. Weak-Form Market Efficiency of Dhaka Stock Exchange (DSE), Bangladesh. Paper presented at 22nd Australasian Finance and Banking Conference (Abstracted in SSRN), Sydney, Australia, December 16–18. [Google Scholar]
- Swidler, Steve. 1988. An Empirical Investigation of Heterogeneous Expectations, Analysts’ Earnings Forecasts and the Capital Asset Pricing Model. Quarterly Journal of Business and Economics 27: 20–41. [Google Scholar]
- Wang, Song. 2014. Does idiosyncratic risk deter short-sellers? Evidence from a First- time Introduction of Short-Selling. Paper presented at European Financial Management Association Meetings, Rome, Italy, June 25–28. [Google Scholar]
- World Federation of Exchanges. 2017. Annual Statistics Guide. London: World Federation of Exchanges. [Google Scholar]
| 1 | For a list of global short selling regulations, see Jain et al. (2013). |
| 2 | Swidler (1988) provides one early empirical study of the effect of short shale restrictions on stock prices and the further effect when there is option trading. He shows that with heterogeneous expectations, estimation risk is more important than short selling restrictions in explaining asset returns. Moreover, for stocks with listed options, investors can synthetically sell short via long puts or short calls. The evidence finds that for stocks with listed options, only estimation risk is important in determining asset returns. |
| 3 | Still another study that looks across regime changes is Wang (2014). He finds that when Chinese regulators lifted the short selling ban on 90 stocks in 2010, they experienced a significant price decline. Moreover, the price declines were positively related to the amount of short selling and is consistent with the notion that short selling can be used as a mechanism to correct for overvaluation. |
| 4 | While a short selling ban appears to affect both tails of the runs distribution, the tests depend on the success rate, the percentage of positive returns observed. For all DSE stocks, the success rate is less than 50%, while for all Dow Jones stocks the success rate is greater than 50%. Thus, it may be that a short selling ban affects the success rate itself causing these markets to exhibit negative returns more frequently. It should be noted that theory does not give any guidance to what the success rate must be if markets are efficient and follow some type of Markov process. Indeed, it can be shown that if stock prices follow some type of geometric Brownian motion, the success rate increases with the stock returns drift term and decreases with idiosyncratic risk and can theoretically be greater or less than 50%. |
© 2018 by the authors. Licensee MDPI, Basel, Switzerland. This article is an open access article distributed under the terms and conditions of the Creative Commons Attribution (CC BY) license (http://creativecommons.org/licenses/by/4.0/).