Abstract
Sudden cardiac death belongs to the acute coronary syndromes, beside unstable angina and myocardial infarction. Today, 60%–80% of deaths due to myocardial infarction still occur outside the hospital. In order to detect individuals prone to such events, risk scores have been developed, including the Heart Score of the European Society of Cardiology. Drawbacks of all current risk scores are, however, the exclusion of signs of atherosclerosis, the underlying aetiology of plaque rupture and erosion leading to sudden death. Computed tomography is an ideal imaging tool, which is able to detect, to localise and to quantify calcified and noncalcified plaques in coronary vessels. The amount of calcium is related to coronary and cardiovascular risk, as well as all-cause mortality. The use of calcium-score risk prediction can eliminate a big problem of the current risk factors, because the lifetime exposure to risk factors, including genetic and heritable features, has an important influence on atherosclerosis. Individual, meaning personalised, management is provided. Plaque burden indicates the degree of risk, which is what matters most.
Epidemiology of coronary artery calcification
An article from the series “Atherosclerosis and inflammation”
Coronary artery calcification (CAC) is present in nearly 100% of men surviving an acute coronary event and more than 80% of women [1]. In young victims of sudden death (<50 years of age), calcified deposits are found in areas of stenosis ≥50% with plaque ruptures in 70%, plaque erosions in 33% and in stable plaques in 50%. These values slightly increase if the area stenosis is ≥75% [2, 3]. Most important are the clear linear relationship between the calcified plaque area and the total plaque area per patient, and the relation between plaque area and calcified plaque area by vessel score. The calcified plaque area accurately predicts overall plaque area [3].
The prevalence of coronary artery disease reaches about 7% in West Germany in a population aged between 45 and 75 years. In the general population, however, coronary artery calcification is found in 82% of men and 55% of women. The median calcium score reaches 55 (4–239) in men and 1.5 (0–38.2) in women. A calcium score below 100 was present in 60% of men and 85% of women. A calcium score of 100–399 was found in 24% and 11% and a calcium score ≥400 in 17% and 4.5%, respectively [4].
In the United States, the prevalence of coronary calcification was 70.4% in men and 44.6% in women [5]. In other ethnic groups the prevalence of calcification was significantly different, reaching 52.1% in Black men, 46.5% in Hispanic men and 29.2% in Chinese men, as well as 36.5%, 34.9% and 41.9%, respectively, in women. After adjustment for age, education, lipids, Body Mass Index, diabetes, hypertension, hypertriglyceridaemia, gender and scanning centre, the coronary calcification relative to Whites was 77% in Chinese, 74% in Hispanics and 69% in Blacks.
At autopsy also, less calcification of coronary artery sclerosis was found in Blacks than in Whites with a difference between Blacks and Whites of 20%–75% [6]. These studies were confirmed by fluoroscopy showing CAC in 24% of African-Americans, 48% in AsianAmericans, and 47% of Caucasians [7]. The prevalence was 62% in Black, 71% in Hispanic,and 84% in White individuals. Using computed tomography (CT), plaques in Blacks are less often calcified than in Whites [8,9,10].
These ethnic variations in the prevalence of coronary artery calcification are in agreement with genetic variations of the G-protein, which show a similar distribution related to obesity and hypertension [11]. The revalence of atherosclerosis studied in mummies of different areas in the world, also showed such a difference in penetration, reflecting the start of the development of human beings in Africa [12, 13].
Natural history
The natural history of atherosclerosis has previously been described in detail [1, 14, 15]. First intracellular than extracellular calcium was a common sign and found not only in advanced atherosclerotic lesions but also in atheroma and fibroatheroma close to the lipid necrotic core [15]. Typically, the first signs of coronary arteriosclerosis, indicated by plaque formation, are found 2–3 cm from the origin of both the left and right coronary arteries [16, 17]. Aging is indicated by progression of the disease, leading to plaque formation also in the distal part of the left anterior descending and circumflex coronary arteries, which was not observed to the same degree in the right coronary artery [17].
Also with coronary angiography in patients with multiple lesions and an average of three vessel disease, lesions are found in the proximal left anterior descending coronary artery followed by the right coronary artery [18, 19]. Due to the positive remodelling of the arteriosclerotic process, only plaques compromising more than 45% of the vessel area will, however, lead to lumen narrowing and hence visible angiographic stenosis [20].
Atherosclerotic plaques can nowadays be visualised by use of intracoronary ultrasound well before the inner lumen of a coronary artery is compromised (Figure 1) [21]. Thus, in patients without angiographically visible lesions, coronary artery calcification can be detected and also imaged with CT in approximately 60% of all early coronary arteriosclerotic lesions [22, 23]. The calcium score increases with the number of vessels involved.
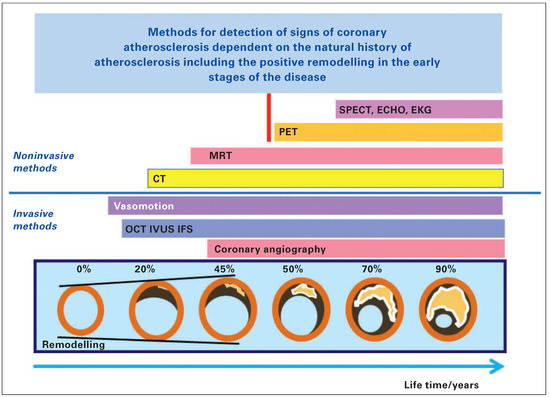
Figure 1.
Schematic drawing of the development of coronary arteriosclerosis including positive remodelling during plaque burden increase and listing of invasive and noninvasive methods concerning their ability to detect signs of the clinical coronary arteriosclerosis starting with endothelium dysfunction and ending with signs of ischaemia detected in the ECG. Modified from Erbel R, Budoff M [21].
CT in the early stage of coronary artery disease shows calcification in only one of the major coronary arteries: most often (>50%) the left anterior coronary artery, in 25% the right coronary artery and in 17% the left circumflex. If two calcified lesions are visible, then most often the left and right coronary artery are involved (45%). Other combinations are less frequent. Calcified lesions of the left main artery are detected in only 7%. Importantly, 25% of those with three vessels already show coronary artery calcification of the left main stem [23].
It is interesting to note that with increasing total calcium score more distal segments are involved, but the increase is most pronounced in the proximal segments. That means that the amount of calcification still increases most prominently in the segments initially involved, which are found in the proximal left coronary artery [24].
Noninvasive quantification of coronary artery calcification
With modern technology the quantification of CAC is possible and reproducible. In comparison to other methods, CT is the noninvasive technique to best detect signs of subclinical atherosclerosis (Figure 2). If the density is ≥130 Hounsfield units, a calcified plaque is present. A plaque is defined if ≥4 adjusted pixels are found. This density can be related to a density factor between 1 and 4 (≥130–199, 200–299, 300–399, ≥400) and multiplied with the area of the plaque which leads to the Agatston Score [25]. The usual slice thickness is set at 3 mm and all slices in which plaques can be identified are summed up. Thus, the Agatston Score gives the total amount of calcification, but can also be related to vessels or even vessel segments.
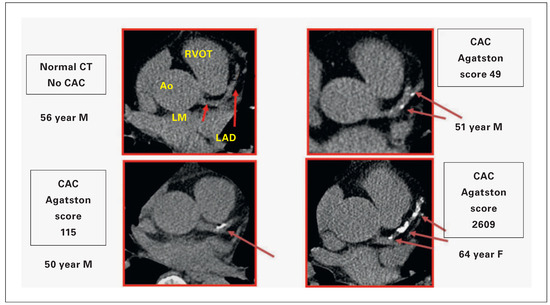
Figure 2.
Signs of subclinical coronary artery sclerosis detected in men and women (m/w) at the age of 50–65 years with increasing calcium load: 0, 0–49, 115 and 1609 Agatston Score. Visualised is a typical slice at the level of the origin of the left main coronary artery from the aorta, showing the proximal left descending coronary artery distal to the bifurcation. AO = Aorta; LAD = left anterior descending coronary artery; LM = left main coronary artery; RVOT = right ventricular outflow tract.
Coronary artery calcification during aging
Early on, it was already obvious that coronary artery calcification increases continuously during life and this effect differs between patient cohorts and individuals in observational studies. Meanwhile, three observational studies have presented their results: the Heinz Nixdorf Recall (HNR) study, the Multi-Ethnic Study in Atherosclerosis (MESA) and the Rotterdam study demonstrate very comparable results [26– 28]. The comparison between MESA and the HNR study in particular demonstrated a comparable percentile distribution of coronary artery calcification for Caucasian men and women, with nearly overlapping curves despite different countries, continents and risk factors. The percentile distribution of CAC is, however, different for different ethnicities [26]. These percentiles of CAC distribution (Figure 3) can be used in order to estimate the individual vascular age risk, and for these two studies have provided an Internet access:
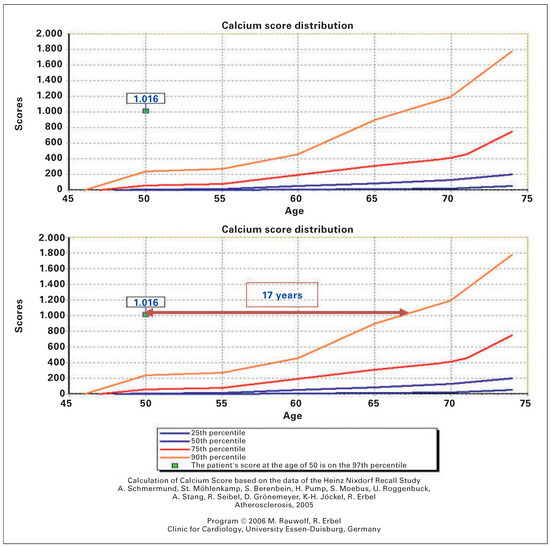
Figure 3.
Coronary artery calcification (CAC) score of a male aged 50 years with an Agatston Score of 1.016 listed in the percentile of CAC distribution (90th [orange], 75th [red], 50th [blue] and 25th [black]). The degree of calcification corresponding to a man at the age of 67 years crosses the 90th percentile (age difference 17 years) based on the CAC calculation algorithm of the HNR study (www.recall-studie.uni-essen.de) was used. (Schmerm und A, et al.[24], Erbel R, et al.[28]).
A typical example is shown in Figure 3, which demonstrates for a man with metabolic syndrome at the age of 50 years, a severe calcification that far exceeds the 90th percentile of CAC distribution. It corresponds to the 90th percentile of a man aged 67 years. That means that the vascular age seems to be >17 years older.
In women, calcification is lower and starts later. Whereas some of the male patients already demonstrate a positive calcium score at the age of 45 years or even before, it is found in women >10 years later.

Figure 4.
Relative risks and 95% confidence intervals of CAC categories 1–99, 100–399, 400–999 and ≥1000 versus CAC = 0 during a 5-year follow-up in the HNR study, listed in comparison to results of the meta-analysis by Greenland et al. [44]. CAC = coronary artery calcification; HNR = Heinz Nixdorf Recall study.
Risk factors and coronary artery calcification
The percentile distribution of coronary artery calcification can be used in order to study the influence of risk factors on the calcification process. In smokers the calcification process showed a 10-year difference from nonsmokers, in women as well as in men [29]. Similarly, in men and in women with diabetes a shift to the left and upwards could be demonstrated, but the difference was not as high as for the effect of smoking. In addition, an effect of prediabetes could be shown only in women, but not in men [30].
In addition to smoking, diabetes and hypercholesterolaemia, hypertension is a major risk factor. Similar to the effect of diabetes, hypertension leads to a higher calcification grade, which is more pronounced in women than in men. This effect was also found for those with prehypertension [31]. It is interesting to note that even in those without hypertension, a level of high coronary artery calcification can be found.
Elevated levels of total cholesterol and low density lipoprotein cholesterol (LDL-C) are associated with excessive calcification of coronary arteries, which is again more pronounced in women than in men [32]. Women with LDL cholesterol below 100 mg/dl show nearly no calcification at all ages, whereas women with LDL cholesterol >190 mg/dl demonstrate an excessive calcification process that starts very early.
The signs of coronary arteriosclerosis give a nice opportunity to analyse whether or not other parameters of lipoprotein metabolism or ratios may improve the association with CAC. Apolipoprotein B (Apo B) was found to give the closest association with CAC in comparison with all other lipoprotein parameters tested, even when compared with lipoprotein (a). Neither the ratio LDL-C / high density lipoprotein cholesterol (HDL-C), non-Apo B/Apo A1 nor non-HDL-C yielded stronger values than Apo B or LDL-C. The association to triglyceride levels was only weak and only positive for the highest quartile compared to the lowest in men and women [32].
For newer risk factors such as psychosocial factors [33, 34] as well as pollution [35, 36] and signs of inflammation [37], a strong association could be demonstrated, meaning that negative psychosocial effects do result in higher calcium values, which could be related to income as well as to education. High traffic levels and pollution were associated with a significant increase of coronary artery calcification in comparison with control groups. The effect of highsensitivity C-reactive protein was not as high as expected.
Chronic kidney disease has to be regarded in a different way, as the medial sclerosis (Mönckeberg type atherosclerosis) is much more prominent, so that calcification is extensive or already present in young adults. The increase seems to be related to the estimated glomerular filtration rate [38].
Cardiovascular risk prediction with coronary artery calcification
Many risk scores have been proposed in order to support physicians in the assessment of patients' risk for developing acute myocardial infarction or other cardiovascular diseases [39, 40]. An overview comparison has been presented previously [41]. The major limitation of these scores is the absence of corrections for the lifetime exposure to risk factors, genetic as well as heritable risk factors.
The use of the different risk scores presents information about risk according to three major categories (low risk, intermediate risk, high risk). This differentiation is again different in the different algorithms proposed, but generally for low-risk individuals a healthy lifestyle is advised, whereas in high-risk individuals intensive therapy and risk factor modification is recommended. In those with intermediate risk, defined as 10%–20% risk of hard events within 10 years (alternative 6%–20%), imaging and nonimaging techniques are proposed for better discrimination. In addition to a stress electrocardiogram in men, biomarkers, ankle-brachial-index and carotid ultrasound as well as computed tomography are recommended [40].
No coronary artery calcification
The event rate increases with the amount of coronary artery calcium, and no calcium provides an excellent longtime prognosis. The observed event rate during the first 5-year follow-up in the HNR study demonstrated an event rate of only 0.18% in men and 0.16% in women [27]. Even the all-cause mortality in the absence of CAC is very low reaching in 19,898 patients a value of 0.52% (0.09%/year) during a followup time of 5.6 years [41]. Thus, in those with no signs of coronary calcification the risk is very low and imaging should be performed after 5 years in order to see if any change has occurred. This may show a conversion in 6.2% at 4 years and 11.6% at 5 years. However, it has to be taken into account that conversion does not mean a clinical event, because it cannot be expected that the CAC value is >100 within a timeframe of 5 years in case of a zero CAC at baseline [42, 43].
Reclassification using coronary artery calcification as a parameter for assessment of cardiovascular events
The high value of CAC for risk prediction can be seen in the comparison of the HNR study to meta-analysis provided by Greenland et al. (fig. 4), which demonstrates quite similar distributions and risk ratios, supporting the diagnostic value for the CAC measurements depending on the amount of calcification [21, 44].
A high amount of coronary calcification means a high risk, which is similar for both genders and reaches 8% in those who have a CAC ≥400, which was found in 16.8% of men and 4.5% of women in a total cohort of 4,157 individuals in the HNR study. On the other hand both, men and women showed a very low event rate if the CAC value was <100, which was found in 59% of men and 85% of women with an event rate <3% within 5 years.
- In low-risk individuals (51.5%) according to the NECP AT III score (<10% /10-year risk), which also means no diabetes, stroke or aneurysm, the assessment of coronary artery calcification does not demonstrate an increase of risk dependent on the amount of CAC, which is in part owing to the fact that only 3.4% of the total cohort showed a CAC ≥400 and only 9.3% a value between 100–399 [28].
- The situation is different in high-risk (>20%/10year risk) individuals (19.7% ) according to the NECP AT III score . Taking into account risk factors as well as those with diabetes, stroke or aortic aneurysms plus low CAC, a CAC <100 was found in 49.8%. The risk was nearly as low (<0.4%/year) as in the group with low (NECP AT III) or intermediate risk (Figure 5). Therapeutic consequences are still not possible to determine, because such a down grading is not possible owing to a lack of prospective studies. This categories of CAC >100–399 (27.4%) and CAC ≥400 (22.9%) demonstrate again the risk gradient preceeded by the amount of CAC plaque burden.
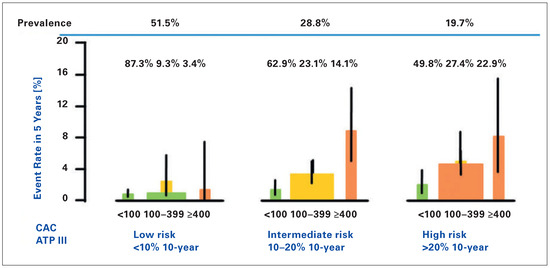 Figure 5. Observed 5-year rate of hard events (nonfatal and fatal myocardial infarction) in the Heinz Nixdorf Recall study. Reclassification of the NCEP ATP III categories using the coronary artery classification (CAC) categories (<100, 100–399, ≥400). The additional level of accuracy reached between the categories and the total cohort for men as well as women is listed. The percentages of participants in each category are given in the upper line as well as the prevalence. (Erbel et al. [28]).
 - In those individuals with intermediate risk (28.8%), assessment of the amount of coronary artery calcification was very helpful to separate those with low and high risk (62.9% vs 14.1%) (Figure 5). In 23.1% (6.6% of the total group) the degree of CAC was between 100–399 and showed an intermediate risk 2.8% in 5 years (0.55%/year). In the category with CAC <100 the risk was 2.7% in 5 years (0.27% /year), in CAC≥400 8.7% in 5 years (1.7% /year).
The negative predictive accuracy reached a level of 98% with a positive predictive accuracy for events of 12.7% in those with CAC >1000 [21].
Recently many attempts have been presented with imaging and nonimaging parameters in order to improve the classical risk assessment by use of scores like the Framingham and Heart Score. For coronary artery calcification, the reclassification rate reached a high level and was superior to other parameters (Figure 6) [30]. Compared with other parameters like high-sensitivity C-reactive protein, HDL-cholesterol and combinations of biomarkers, the reclassification improvement with CAC yielded superior results, reaching 30%. In direct comparison with ankle-brachial index, high-sensitivity C-reactive protein and family history, as well as brachial flow-mediated dilatation on carotid intima-media thickness, CAC provided superior discrimination and risk reclassification [46].
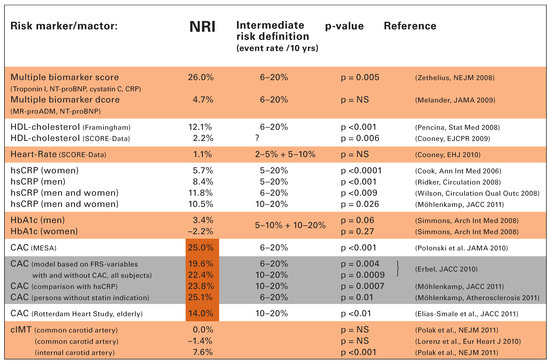
Figure 6.
Reclassification improvement by use of different valuables in order to extend the risk stratification. Modified from Erbel et al. [28] and Cooney et al. [30]. The different publications are related to biomarkers, HDL-cholesterol, heart rate and signs of diabetes as well as signs of inflammation. In addition the results of the HNR study are listed related to CAC and hs-CRP. hs-CRP = high sensitivity C-reactive protein; HbA1c = glycated hemoglobin; MR-pro ADM = mid-regional pro-adrenomedullin; NRI = net reclassification improvement; NT-proBNP = N-terminal pro-B-type natriuretic peptide; HDL-cholesterol = high density lipoprotein cholesterol.
CAC is highly predictive not only for coronary but also for cardiovascular events and all-cause mortality [32, 38]. The higher the CAC the higher the risk for strokes [46]. Meanwhile, it could be demonstrated that CAC is superior to carotid ultrasound assessment of intima-media thickness. Ankle-brachial index was also provided, but is found <0.9 in <5% of the HNR cohort [48].
Practical hints
In order to use calcium scoring in daily life, the Agatston score should be used for quantifying coronary artery calcification detected with CT. The total amount of coronary artery calcification presents a very good tool to assess the individual risk, which increases beyond 100 but particularly beyond 400 or even 1000. Of course, the age of the patient has to be taken into account, as during ageing coronary calcification increases. However, the total plaque burden determines the risk, which is dependent on risk factors including age and gender. Using the percentiles of CAC distribution, the increase of the plaque burden over time can be estimated, which is mainly genetically determined and seems to be inevitable. In addition the ethnicity of the patient has to be taken into account, as the prevalence is lowest in Blacks, higher in Hispanic and Chinese but highest in Caucasian. For the European population the Internet-based calculation algorithms of the HNR study can be used (www.uni-due.de/recall-studie) in order to estimate the degree of calcification in comparison with the general population, thus improving the individual risk assessment.
Funding/potential competing interests
No financial support and no other potential conflict of interest relevant to this article was reported.
References
The full list of references is included in the online version of the article at www.cardiovascmed.ch.
© 2015 by the author. Attribution Non-Commercial NoDerivatives 4.0.