Abstract
The olive fruit is recognized for being a significant source of phenolic compounds, including hydroxytyrosol (H-tyr), tyrosol (Tyr), oleuropein (Ole), and verbascoside (Verb). The maturity index (MI) significantly influences the phenolic profile, which is a cultivar-specific trait. A study was conducted to assess the evolution of the phenolic profile in seven olive cultivars during ripening: ‘Galega vulgar’ (Gv), ‘Azeiteira’ (Az), ‘Cobrançosa’ (Cob), ‘Picual’ (Pic), ‘Carrasquenha’ (Car), ‘Redondil’ (Red), and ‘Arbequina’ (Arb). The results indicate a declining trend in total phenolic compounds (TPC) across all cultivars, with Cob and Car exhibiting the highest values, over 60 g GAE kg−1 at T1 and above 30 g GAE kg−1 at T7, respectively. In Ole quantitation, Red demonstrated the highest values, recording 39 g kg−1 in T1 and 15 g kg−1 at T7, with per olive fruit unit measurements ranging from 19.7 mg at T1 to 22.7 mg at T7. These findings underscore olive fruit as an exceptional source of bioactive compounds and their advantageous health-promoting effects, which might be utilized as a functional food source, validating the unique phenolic profiles of each cultivar in relation to ripening.
1. Introduction
Over the past two decades, Portugal has experienced a significant surge in olive cultivation, establishing itself as one of the leading global producers, primarily focused on virgin olive oil (VOO) rather than table olives (TO), with an overall production increase of approximately 400% during this period (Figure 1).
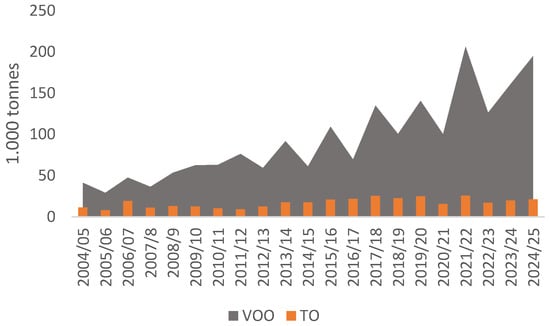
Figure 1.
Portuguese figures for the virgin olive oil (VOO) and table olive (TO) production from 2004/5 to 2024/25 [1].
The increase in production has mostly been observed in the Alentejo region, marked by a steady expansion of the total olive cultivated area and sector modernization, mainly by orchard intensification. Portugal is currently leading a new era in olive oil production by employing large-scale farming with high-density hedgerow systems. This has enabled an increase in productivity and reduced production costs through improved mechanization of orchard management techniques. Nevertheless, small-scale producers still retain their place in the national scenario of olive oil production, in part due to the simple fact that these are the sole guardians of the valuable germplasm of the traditional olive cultivars that still characterize the sensorial profile of Portuguese VOO and TO. Traditional olive cultivars are usually associated with a specific region, where they have adapted and thrived throughout the centuries, so these are the cultivars with the most resilience and well-adapted features for a given environment.
The olive fruit is a valuable source of various nutraceuticals, including antioxidants, vitamins, and minerals, which strongly contribute to its health-promoting properties [2]. Among these nutraceutical compounds, the phenolic compounds have been shown to play an important role in human health. Their value has been shown mainly through their modulation pathways associated with inflammatory reactions and oxidative stress regulation [3,4], with the olive fruit being well recognized as a significant source of phenolic compounds [5]. There are numerous phenolic compounds present in the olive fruit, which can comprise up to 1−3% of the total fruit pulp fresh weight, ranging from simple monophenolics to more complex compounds with multiple aromatic rings [6]. Among all, oleuropein (Ole), a secoiridoid glucoside, is the predominant phenolic compound in olive fruit [7], which can reach up to 14% on dry weight (DW) basis in total composition [8], whereas verbascoside (Verb) is the main hydroxycinnamic derivative present [9]. Along with the fruit maturation process, Ole undergoes several hydrolysis processes, yielding different compounds, with hydroxytyrosol (H-tyr) being one of the most relevant [10]. During this process, three phases may be distinguished: (1) a growth phase, where accumulation of Ole occurs; (2) a green maturation phase, where levels of Ole start to reduce; and (3) a black maturation phase, which is characterized by the appearance of anthocyanins, leading to a continuous falloff of Ole levels [8]. It is in this last phase where H-tyr and tyrosol (Tyr) start to increase their concentration, mainly due to the hydrolysis of Ole and other secoiridoid derivatives. In olives, these compounds are of significant relevance, since they provide a primary source of protection to the plant against external agents, such as bacteria, fungi, and viruses [11]. Furthermore, in human nutrition, these specific phenolic compounds play a major role due to their antioxidant and anti-inflammatory properties [12].
Cultivar specificity is considered of great relevance since the specific genetic makeup of a cultivar determines its potential to synthesize and accumulate specific phenolic compounds [13], with the concentration of phenolic composition being strongly related to this trait. Additionally, agricultural practices, such as irrigation and pruning, have been shown to significantly influence the concentration of bioactive compounds in both olive fruit [5,14] and VOO [15,16]. This has shown particular relevance when comparing organic and integrated practices [17], as well as when considering the specific edaphoclimatic conditions of the olive orchard [18]. Therefore, to affirm olive fruit as a functional food rich in bioactive compounds that promote health, these factors must be considered.
This study aims to investigate how cultivar specificity and fruit ripeness affect the phenolic profile of olive fruit, considering the importance of olives as a source of nutraceuticals in the Mediterranean diet. For this, seven distinct cultivars were considered, comprising five of the most relevant traditional Portuguese varieties, ‘Galega vulgar’ (Gv), ‘Redondil’ (Red), ‘Carrasquenha’ (Car), ‘Cobrançosa’ (Cob), and ‘Azeiteira’ (Az), alongside two Spanish varieties, ‘Picual’ (Pic) and ‘Arbequina’ (Arb), with seven sampling points throughout the fruit maturation process. Thus, we aim to acknowledge the effective concentration of phenolic compounds in various olive cultivars with high expression in Portugal throughout their maturation process. To eliminate other influencing factors in this study, all considered cultivars were sourced from the same orchard and subjected to similar agricultural practices. With this study, we aim to provide some preliminary new information regarding the potential of distinct cultivars as a source of important nutraceutical compounds, showing the olive fruit, among its distinct cultivars and ripening stages, as a functional food rich in bioactive phenolic compounds.
2. Materials and Methods
2.1. Chemicals and Reagents
All reagents were of analytical or HPLC (High Performance Liquid Chromatography) grade and used as received. Methanol and acetonitrile were acquired from Merck (Darmstadt, Germany), acetic acid from Sigma-Aldrich (St. Louis, MO, USA), Folin–Ciocalteu reagent from VWR International (Rosny-sous-Bois, France). Double-deionized water was obtained with a Milli-Q water purification system (Millipore, Bedford, MA, USA). Standard compounds Tyr, H-tyr, and Ole were purchased from Molekula (Gillingham, Dorset, UK), while Verb and gallic acid were acquired from Sigma-Aldrich (St. Louis, MO, USA).
2.2. Olive Sample Collection
Sampling of olive fruits was conducted at a commercially operated olive orchard located at Herdade Álamo de Cima (38°29′49.44″ N, 7°45′8.83″ W) in southern Alentejo, Portugal. The orchard was established in 2001 within the characteristics of an irrigated intensive olive orchard, with a distance between trees of 8 × 4.2 m. Sampling comprised the cultivars Gv, Cob, Car, Red, Az, Arb, and Pic and took place during the year 2019. Samples were taken biweekly, excluding the initial collection point (T1), commencing at an early ripening stage on 18 July and concluding on 30 October (Table 1). For all sampling periods, 100 olives were randomly harvested at an average height of 1.80 m ± 0.20 m from the same 10 designated trees per cultivar.

Table 1.
Relation of the sampling periods (T) with specific recollection date (day).
2.3. Fruit Caliber, Pulp-to-Stone Ratio, Moisture and Maturity Index
Fruit caliber and stone weight were measured by calculating the average weight of 20 randomly selected olives and their respective stones. The fruit pulp was obtained by subtracting stone weight from the fruit caliber. The fruit pulp-to-stone ratio was calculated by dividing the fruit pulp by the stone weight. Fruit moisture was calculated by drying the fruit pulp of 20 randomly selected olives at 50 °C over a 24 h period, measuring the % of mass loss by weighing the fruit pulp before and after drying. The maturity index (MI) was calculated following the International Olive Council (IOC) guidelines [19], which involved randomly collecting 100 fruits and scoring them from 0 to 7 based on the coloring stage of both skin and flesh, where 0 represents deep green skin color and 7 indicates black skin color with all flesh purple up to the stone. Then, the maturity index was obtained by applying the following formula.
where A–H represents the number of fruits, and 0–7 the respective ripening categories.
2.4. Hydrophilic Phenolic Extraction
For the hydrophilic extraction of olive fruits, a previously reported procedure by Ferro et al. [20] was followed, where the pulp of 20 randomly collected olives was cut into fine pieces with a scalpel. Then, 2.0 ± 0.1 g was weighed in a 50 mL Falcon tube, and 20 mL of methanol was added. The mixture was then homogenized with an Ultra-Turrax® (T25 digital Ultra-Turrax, IKA, Staufen, Germany) for 1 min at 20,000 rpm. The phase separation was made by centrifugation (10 min at 8000 rpm). The methanolic fraction was collected, and the solid fraction was re-extracted twice, following the same process. The hydrophilic extract was then evaporated to dryness in a rotary evaporator (Z 323 K, Hermle, Wehingen, Germany) under low pressure (100 mbar) at 35 °C. The final extract was dissolved in 2.0 mL of methanol and filtered through a Polytetrafluoroethylene (PTFE) 0.22 µm syringe filter and stored at −20 °C before analysis. Triplicates were performed in three independent extractions.
2.5. Total Phenolic Compounds and HPLC Analyses
Total phenolic compounds (TPC) were determined by the Folin–Ciocalteu assay, an adaptation of the Falleh et al. method [21]. 150 μL of 10% (v/v) Folin–Ciocalteu reagent solution was added to an aliquot of 10 μL of sample extract. Next, 100 μL of 60 g L−1 Na2CO3 was added, the mixture was stirred again, and it rested in the dark for 60 min before being read at 725 nm on a MultiScan FC microplate reader (Thermo Scientific, Waltham, MA, USA). All measurements were performed in three independent experiments. A gallic acid calibration curve was prepared with results expressed as mg of GAE (Gallic Acid Equivalent) per mL of extract.
For the chromatographic separation, an HPLC method previously published by Ferro et al. [22] was followed. The HPLC (Merck Hitachi LaChrome, Tokyo, Japan) consisted of an L7000 interface module, an L7200 autosampler, an L7350 column oven, an L7100 pump and an L-7420 UV detector, controlled by the D-7000 HSM software (version 3.1). Compound separation was monitored at a wavelength of 280 nm. Compound identification was performed based on its retention time and by comparison with the pure standard compounds under the same conditions, and quantifications were performed based on calibration curves that were prepared for each standard compound, ranging from 0.5 to 100 mg L−1 and composed of 6 concentrations, with three replicates per concentration (all obtained R2 ≥ 0.990). All concentrations were then calculated based on the dry weight (DW). The method recovery was calculated by spiking a randomly selected sample with a known concentration of 50 mg L−1 of H-tyr (performed in triplicate) and evaluating its recovery, according to the equation below (Equation (2)).
where apparent added amount is the amount of spiked sample minus the amount of unspiked sample (all recoveries were ≥0.93). Limit of detection (LOD) and limit of quantification (LOQ) were determined based on the standard deviation of the response and the slope of the calibration curve, according to Equations (3) and (4), respectively, represented below.
where σ is the standard deviation of the response and S is the slope of the calibration curve. Reproducibility of the methos was checked by injecting the same sample under the same experimental conditions 5 times (n = 5), with obtained relative standard deviation (RSD) of 1.8%.
2.6. Statistical and Multivariate Analysis
For the statistical analyses and evaluation of the experimental data, analysis of variance (ANOVA) was applied, for a confidence interval of 95%. All analyses were performed using the XLSTAT software (version 2022.4.1).
3. Results and Discussion
For this study, seven olive fruit cultivars were selected, five of them being among the most widespread Portuguese traditional cultivars, namely Gv, Cob, Car, Red, and Az, and the two most widespread cultivars worldwide, the Spanish Pic and Arb. The MI was measured, according to the IOC guidelines [19] and following Equation 1, over a period of approximately 14 weeks (from 18 July to 30 October), with a total of seven sampling points distributed throughout this period (Table 1). Table 2 illustrates the MI evolution of each cultivar during ripening, highlighting the distinct maturation profiles for all cultivars, with Gv identified as the earliest maturing cultivar. As shown, Gv reached an MI of 4—fruits with fully black skin—at T7, followed by Az, Cob, and Pic, with MI between 2 and 3, also at T7. Car, Arb, and Red demonstrated a significantly delayed maturation process, with MI around 2—more than half of the fruit has a green color—at T7. As a more standardized and visual parameter, MI may provide us with useful information regarding both at a morphological and chemical level. MI may be used to predict the best harvesting period for specific cultivars, being able to relate not only information regarding fat accumulation content but also qualitative parameters, such as bioactive compounds [20,23]. Being MI, a value obtained by visual observation of the olive fruits, this parameter relates specifically to the natural maturation process of each cultivar. As shown in Table 2, both T1 and T2 presented MI values of 0, with the first fruit coloration, changing from deep green to yellow-green skin, only starting to occur by the beginning of September. From T2 onward, it is clear that different cultivars follow a distinct maturation process. Gv is a well-known traditional Portuguese cultivar for its early ripening [20,24]; in contrast to others, it gains fully black skin coloration at a considerably early stage.
Table 2.
Maturity index (MI) determination for seven olive fruit cultivars, ‘Galega vulgar’ (Gv), ‘Cobrançosa’ (Cob), ‘Carrasquenha’ (Car), ‘Redondil’ (Red), ‘Azeiteira’ (Az), ‘Picual’ (Pic), and ‘Arbequina’ (Arb), along seven sampling periods (from T1 to T7).
In addition to MI, other significant morphological changes occur during ripening, including fruit caliber, fruit pulp-to-stone ratio, and moisture content (Table 3). These are important parameters to measure and consider when evaluating the cultivars and their potential in nutraceutical components, since they will influence the amount of these compounds per fruit unit. Measuring the amount of “beneficial compounds” by fruit unit can be useful when considering a functional food such as the olive fruit. From this, we may establish a daily intake of olive fruits to accomplish a specific set of nutraceuticals, taking into consideration the particular cultivar and its respective ripeness.
Table 3.
Fruit caliber (g), fruit pulp-to-stone ratio, and fruit moisture (%) for seven olive cultivars, ‘Galega vulgar’ (Gv), ‘Cobrançosa’ (Cob), ‘Carrasquenha’ (Car), ‘Redondil’ (Red), ‘Azeiteira’ (Az), ‘Picual’ (Pic), and ‘Arbequina’ (Arb), along seven sampling periods (from T1 to T7).
As shown (Table 3), Red cultivar presented the highest fruit caliber on average mass at all sampling periods, with values as high as 4.72 ± 1.69 g at T6. Gv and Arb were the cultivars with the lowest fruit caliber during the ripening process. In agreement with this, Red also showed the highest fruit pulp-to-stone ratio, with values of 8.48 ± 4.91, respectively, at T6. These results clearly indicate that Red stands out as an exceptional cultivar for table olive production, owing to its high fruit caliber and pulp-to-stone ratio. Indeed, Red is a highly valued cultivar in traditional Portuguese table olives, along with the Car and Az cultivars, which are specifically associated with the PDO (Protected Designation of Origin) “Azeitonas de Conserva de Elvas e Campo Maior DOP” for table olives [25]. In contrast, the Spanish cultivar Arb exhibited the lowest values for both fruit caliber and pulp-to-stone ratio; its sole purpose is to produce virgin olive oil in super-intensive orchards, as it yields low-caliber fruits with a high fat content [26].
Simultaneously, fruit moisture was also measured (Table 3), showing a notorious decreasing trend for all cultivars along with ripening, with the lowest moisture values observed at T5, the beginning of October. Despite the observed decreasing trend, fruit moisture may be influenced by several external factors, such as climate and agronomic practices. Therefore, for the quantification of phenolic compounds, all measurements were performed on a DW basis to avoid external interferences. First, the TPC were measured, and as shown in Table 4, a general decreasing trend was observed during ripening for all cultivars. Arb showed the lowest concentration of TPC at all sampling points, while Pic, Car, and Cob consistently exhibited the highest TPC throughout all sampling periods. For all cultivars, the highest TPC was obtained at T1, showing significant differences from all other sampling points (p-value < 0.05). At T1, all measure TCP presented no statistically significant differences (p-value > 0.05) among all cultivars, except for Arb.
Table 4.
Total phenols quantification (g GAE kg−1) on dry weight (DW) basis, for seven olive cultivars, ‘Galega vulgar’ (Gv), ‘Cobrançosa’ (Cob), ‘Carrasquenha’ (Car), ‘Redondil’ (Red), ‘Azeiteira’ (Az), ‘Picual’ (Pic) and ‘Arbequina’ (Arb), along seven sampling periods (from T1 to T7).
This data offers some preliminary understanding of how different cultivars affect the synthesis and accumulation of phenolic compounds during ripening. This information can be highly useful for studying the olive fruit as a functional food, particularly due to the incredibly high concentrations of TPC observed at early maturation stages (T1). Considering Cob as an example, at T1, the measured TPC were approximately 61.6 g GAE kg−1, showing a significant decrease during ripening to about half this value at T7 (32.3 g GAE kg−1). Additionally, taking into account the average fruit caliber, pulp-to-stone ratio, and moisture content (Table 3), we can state that at T1, an average olive fruit from the Cob cultivar contains about 22.2 mg of TPC (GAE, on a DW basis) and about 33.7 mg at T7 (Table 5), which represents approximately 3.2% of its total pulp mass. On the other hand, much lower changes were observed if we consider cultivars with reduced fruit caliber that are also less prone to the synthesis and bioaccumulation of phenolic compounds, such as Arb. In contrast to Cob, Arb showed the lowest TPC and fruit caliber, measuring about 6.9 mg of TPC (GAE, on a DW basis) per olive fruit at T1 and 7.9 mg at T7. Thus, to measure the TPC per olive fruit unit—our main goal in evaluating olives as a functional food source rich in important nutraceutical compounds—we considered the average weight of the pulp from 100 fruits per cultivar at each measuring point (T). As shown (Table 5), a slight increasing trend was observed during ripening for most cultivars; however, this increase reached statistical significance (p-value < 0.05) only for the Cob and Red cultivars. These cultivars showed increases of 52% and 33% from T1 to T7, respectively, which was mainly due to the increment in fruit caliber and pulp-to-stone ratio (Table 3). For this reason, both Cob and Red cultivars proved to be the most suitable candidates for being considered a natural food source rich in bioactive compounds, with a higher TPC per fruit unit at T7.
Table 5.
Total phenolic compounds (TPC) per olive fruit unit (mg GAE per olive fruit) on a dry weight (DW) basis along ripening (T1–T7), for seven olive cultivars: ‘Galega vulgar’ (Gv), ‘Cobrançosa’ (Cob), ‘Carrasquenha’ (Car), ‘Redondil’ (Red), ‘Azeiteira’ (Az), ‘Picual’ (Pic) and ‘Arbequina’ (Arb).
Despite being a favorable overall indicator of the potential content in phenolic compounds, the TPC measurement by the Folin–Ciocalteu is a nonspecific method and thus can be affected by other non-phenolic reducing molecules. Furthermore, since it is a colorimetric method, it cannot be used as a measurement of the effective concentration of specific target phenolic compounds. To address this, a specific method using HPLC was used to measure the target phenolic compounds Tyr, H-tyr, Verb, and its precursor Ole, during fruit ripening. Ole, the primary phenolic compound found in olive fruit, serves as the precursor to numerous other bioactive compounds that are strongly linked to health-promoting properties, including H-tyr [7]. Therefore, information about the content of Ole in the fruits and its biotransformation pathway during ripening is highly relevant [27,28]. Ole concentrations in olive fruit are known to vary greatly within cultivars [29,30]. Ranalli et al. [31] reported the Ole concentrations in olive fruits from seven Italian cultivars during their growth and maturation, demonstrating that the cultivar factor can significantly influence Ole concentration, sometimes even more than the maturity index (MI). In our study, the levels of Ole, Verb, Tyr, and H-tyr were evaluated along with ripening for the seven cultivars under study (Table 6). As we can observe from Table 6, all cultivars presented quite distinct phenolic profiles. Alongside TPC, it is of major relevance to acknowledge this information so that we may be able to select the best harvest period for each cultivar to obtain the most proper and nutritious fruits according to the intended purpose. Among all the olive cultivars under study, we can observe a general decrease in Ole concentration during the fruit’s growth and maturation phase (Table 6), with the cultivar being a major influencing factor for this trend. This decrease in Ole during ripening may be due to the rising activity of hydrolytic enzymes, like β-glucosidase and esterase, which first break down Ole into its simpler forms. Conversely to this, the biodegradation of Ole by its enzymatic hydrolysis will produce an increase in H-tyr, reaching its maximum value at fully ripe fruits (MI ≥ 4).
Table 6.
HPLC specific phenolic compound quantification (g kg−1, DW): hydroxytyrosol (H-tyr), tyrosol (Tyr), verbascoside (Verb), and oleuropein (Ole), from seven cultivars, along seven ripening stages (from T1 to T7).
Analyzing Table 6, which presents the HPLC analysis of specific phenolic compounds, we find that Gv, at T1, exhibits one of the highest concentrations of Ole at approximately 32 ± 2 g kg−1, equaled only by Az and surpassed by Red, which showed concentrations of 33 ± 2 and 39 ± 1 g kg−1, respectively. Nevertheless, at T7, Gv reached the lowest concentrations of Ole, measuring 2.6 ± 0.4 g kg−1; this may be due to Gv’s earlier ripening process, as it is the only cultivar to achieve an MI of 4 at this stage. Thus, the present data reveals that Gv can exhibit comparatively high Ole concentrations at early ripening stages. However, due to its early maturation process, it reaches minimal levels much quicker than the other cultivars. Furthermore, it was from T1 to T2 that the most significant Ole concentration drop occurred for all cultivars, still at the growing fruit phase. Despite this general decreasing trend, some cultivars showed some positive peaks of Ole accumulation along with ripening. It is not uncommon to observe some Ole accumulation with increasing ripening. In fact, Fernández-Poyatos et al. [32] reported a significant Ole increase for the ‘Royal’ cultivar, from 15 December (MI 2.5) to 15 January (MI 5.5), from about 0.3 to about 2.8 g kg−1. But since this Ole increase was shown in the last sampling period, it was not possible to see the evolution trend from this point forward. Also, since sampling started already at an advanced ripening stage, it was not possible to assess the Ole concentration at an early ripening stage. Ferro et al. [20] reported a similar behavior for the Cob cultivar, with its maximum Ole concentration being the last sampling point (harvest). For some cultivars, namely Gv, Red, Car, and Arb, an Ole increase at some of the early ripening stages was observed, mainly from T2 to T3, which may be attributed to the growth phase of the fruit that occurs with the start of fruit maturation [33]. Nevertheless, only for the Car cultivar did the Ole increase show to be statistically significant (p-value < 0.05). For all cultivars, both Ole and TPC showed a similar trend, highlighting the relevance that Ole presents in the phenolic fraction of the olive fruit, transversal to the cultivar variability. The decrease in TPC of olive fruits is a well-known process that occurs during ripening that has been documented by other authors on different cultivars [33,34,35]. Despite this, several published reports demonstrate an increase in TPC on olive fruits as they ripen. Bouaziz et al. [36] found that during the maturation of the Tunisian ‘Chemlali’ cultivar, TPC increased from 6 to about 16 g kg−1 of equivalent pyrogallol from July to February. Similar results were observed by Gougoulias et al. [37], who reported an increase from about 4 to about 12 g GAE kg−1 along the maturation of the Greek ‘Amfissis’ cultivar. The diversity of results may help us understand the significant chemical variability and distinct behavior that each cultivar shows during ripening, which, together with all environmental factors, may influence the production and accumulation of phenolic compounds in the olive fruit. These sources of diversity highlight the necessity to deepen our understanding of different olive fruit cultivars, especially the traditional Portuguese ones examined in this study.
Considerable differences in the content of Tyr and H-tyr were found to occur in the fruits of different cultivars during ripening, revealing a general increasing trend but not shaped for all cultivars during the sampling period under study. H-tyr is considered an indicator for the maturation of olives, with an increase in their levels consistently correlating with the hydrolysis of the components with higher molecular weights, such as Ole [7]. In our study, we found that the highest concentrations of H-tyr at T7 were in the Az, Cob, and Gv cultivars, measuring 1.03 ± 0.03, 0.72 ± 0.07, and 0.71 ± 0.06 g kg−1, respectively. These cultivars also exhibited the highest MI at this stage, confirming the intrinsic relationship between H-tyr synthesis and fruit ripening, which may influence the production and accumulation of phenolic compounds in olive fruit.
Regarding Verb, of all cultivars, Cob shows by far the highest concentrations of this compound, reaching its maximum at T7, with values of 4.3 ± 0.6 g kg−1, about four times more than Car, which showed the second-highest Verb concentrations. Gv showed the lowest concentrations for Verb, with 0.4 ± 0.1 g kg−1. These divergencies serve as evidence of each cultivar’s uniqueness, differentiating the specific phenolic profiles shaped along ripeness. Despite the clear differences in phenolic profiles among olive cultivars presented in Table 6, the nutraceutical relevance of these variations remains underexplored. Establishing direct connections between specific cultivars and their potential health benefits would enhance the practical implications and the nutritional relevance of specific olive fruit cultivars. For instance, the notably higher Verb content in the Cob cultivar suggests a greater potential for anti-inflammatory or antioxidant applications [38], while the early but abundant Ole accumulation in Gv highlights its suitability for functional food formulations targeting cardiovascular health [39,40]. Furthermore, understanding the cultivar-dependent phenolic profiles could support more informed dietary recommendations, valorize traditional Portuguese cultivars, and contribute to the development of targeted functional products aligned with Mediterranean dietary patterns.
Figure 2 shows the chromatographic images of two different cultivars, Gv (Figure 2a) and Cob (Figure 2b), at distinct ripening stages (T1 and T7). With this we can highlight how these variables (cultivars and MI) may strongly affect the phenolic profile of the olive fruit. Cob has a noticeable increase in Verb and a slight decrease in Ole as it ripens, while Gv has a sharp drop in Ole but no significant changes in Verb (Figure 2 and Table 6).
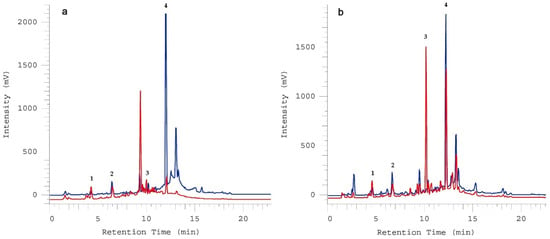
Figure 2.
Chromatographic representation of ‘Galega vulgar’ (a) and ‘Cobrançosa’ (b) at T1 (blue) and T7 (red), respectively, for the identification of hydroxytyrosol (1), tyrosol (2), verbascoside (3) and oleuropein (4).
As shown in Table 6, of all the quantified phenolic compounds, Ole is by far the most abundant, with the most significant decrease occurring from T1 to T3, which corresponds to the start of fruit maturation. Considering Ole quantification per fruit unit, we can observe from Figure 3 that along the entire ripening process, Red cultivar showed the highest Ole amounts per fruit unit, ranging from 19.7 mg to 22.7 mg per olive fruit, from T1 to T7, respectively. These results also reveal that although the concentration of Ole generally decreases during ripening (Table 6), the total amount of specific nutraceutical compounds (such as Ole) can remain constant when measured per fruit unit (Figure 3). From a nutritional standpoint, such data reinforces the relevance of choosing specific cultivars to ensure a consistent source of bioactive compounds, regardless of ripeness. Results observed from Figure 3 also reinforce the factor cultivar as more relevant than the MI factor when considering the amount of Ole per fruit unit. Therefore, one may consider these insights to increment the use of olive fruit as a natural source of specific nutraceutical compounds.
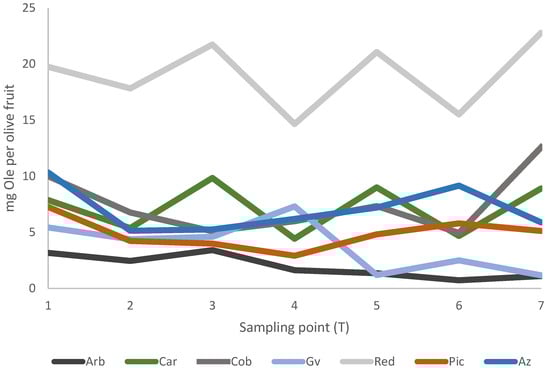
Figure 3.
Amount of oleuropein (Ole, mg) per fruit unit on dry weight (DW) basis, along ripening (T1 to T7), for seven olive cultivars.
4. Conclusions
This study assessed seven olive fruit cultivars for their phenolic makeup along seven ripening stages. Among all cultivars, Cob and Red showed some of the highest TPC concentrations, with the highest values shown at T1, of 61.6 ± 0.2 and 55.2 ± 0.3 g GAE kg−1, respectively, with a general decline observed throughout the maturation process. Nonetheless, an incremental trend in TPC per fruit unit was noted for all cultivars throughout ripening, with statistically significant increases (p < 0.05) reported for Cob and Red cultivars, exhibiting rises of 52% and 33% from T1 to T7, respectively. These cultivars exhibited the highest TPC per olive fruit unit, with levels of 37.1 ± 3.1 and 33.7 ± 1.3 mg at T7, respectively. Ole was identified as the predominant phenolic compound in the olive fruit, highly influencing the general concentration of TPC. Thus, for all cultivars, the highest concentrations were observed at T1, with Red showing the highest values and Arb the lowest, with values of 39 ± 1 and 20 ± 1 g kg−1, respectively. Additionally, when considering the amount of Ole per fruit unit, the Red cultivar exhibited the highest values, ranging from 19.7 mg to 22.7 mg per fruit unit between T1 and T7. Fruit caliber proved to be an important factor in evaluating Ole per fruit unit, as higher-caliber olive fruits were able to maintain similar amounts of Ole throughout the maturation process. These findings suggest that significant health-promoting nutraceutical components, such as Ole, stay stable throughout fruit ripening when assessed per fruit unit, with the Red cultivar exhibiting outstanding results as a natural source of these compounds. Despite these promising results showing the notorious potential of traditional Portuguese cultivars as a natural source of valuable nutraceuticals, further assessments should be performed to further validate these results. Thus, studying other factors, like agronomic practices, is part of our future work.
Author Contributions
Conceptualization, M.D.F. and M.F.D.; methodology M.D.F.; validation, M.F.D., M.J.C.; investigation, M.D.F.; resources, M.J.C.; data curation, M.F.D.; writing—original draft preparation, M.D.F.; writing—review and editing, M.D.F.; supervision, M.F.D. and M.J.C.; project administration, M.J.C. All authors have read and agreed to the published version of the manuscript.
Funding
This research was funded by “Fundação para a Ciência e Tecnologia” (FCT—Portugal), through the research project PTDC/ASP-PLA/30650/2017. The authors further acknowledge Fundação para a Ciência e a Tecnologia for the PhD grant to Miguel Duarte Ferro (SFRH/BD/140083/2018).
Institutional Review Board Statement
Not applicable.
Informed Consent Statement
Not applicable.
Data Availability Statement
The data presented in this study are available on request from the corresponding author.
Acknowledgments
The authors would like to acknowledge Tânia Nobre for making this work possible. Authors also acknowledge Fundação Eugénio de Almeida for making the sampling possible, and Fundação para a Ciência e Tecnologia (FCT—Portugal) for the R&D unit MED—Mediterranean Institute for Agriculture, Environment and Development (https://doi.org/10.54499/UIDB/05183; https://doi.org/10.54499/UIDP/05183) and the Associate Laboratory CHANGE—Global Change and Sustainability Institute (https://doi.org/10.54499/LA/P/0121/2020).
Conflicts of Interest
The authors declare no conflicts of interest.
Abbreviations
The following abbreviations are used in this manuscript:
| Arb | Arbequina |
| Az | Azeiteira |
| Car | Carrasquenha |
| Cob | Cobrançosa |
| DW | Dry weight |
| Gv | Galega vulgar |
| H-tyr | Hydroxytyrosol |
| IOC | International Olive Council |
| MI | Maturity index |
| Tyr | Tyrosol |
| Ole | Oleuropein |
| PDO | Protected Designation of Origin |
| Pic | Picual |
| Red | Redondil |
| TO | Table olive |
| TPC | Total phenolic compounds |
| Verb | Verbascoside |
References
- IOC World Olive Oil and Table Olive Figures. Available online: https://www.internationaloliveoil.org/what-we-do/statistics/#figures (accessed on 29 August 2025).
- Nikou, T.; Sakavitsi, M.E.; Kalampokis, E.; Halabalaki, M. Metabolism and Bioavailability of Olive Bioactive Constituents Based on In Vitro. Nutrients 2022, 14, 3773. [Google Scholar] [CrossRef] [PubMed]
- Martínez-Domínguez, E.; de la Puerta, R.; Ruiz-Gutiérrez, V. Protective effects upon experimental inflammation models of a polyphenol-supplemented virgin olive oil diet. Inflamm. Res. 2001, 50, 102–106. [Google Scholar] [CrossRef]
- de la Puerta, R.; Gutierrez, V.R.; Hoult, J.R.S. Inhibition of Leukocyte 5-Lipoxygenase by Phenolics from Virgin Olive Oil. Biochem. Pharmacol. 1999, 57, 445–449. [Google Scholar] [CrossRef]
- Mousavi, S.; Stanzione, V.; Mariotti, R.; Mastio, V.; Azariadis, A.; Passeri, V.; Valeri, M.C.; Baldoni, L.; Bufacchi, M. Bioactive Compound Profiling of Olive Fruit: The Contribution of Genotype. Antioxidants 2022, 11, 672. [Google Scholar] [CrossRef]
- Charoenprasert, S.; Mitchell, A. Factors influencing phenolic compounds in table olives (Olea europaea). J. Agric. Food Chem. 2012, 60, 7081–7095. [Google Scholar] [CrossRef]
- Soler-Rivas, C.; Espiń, J.C.; Wichers, H.J. Oleuropein and related compounds. J. Agric. Food Chem. 2000, 80, 1013–1023. [Google Scholar] [CrossRef]
- Omar, S.H. Oleuropein in olive and its pharmacological effects. Sci. Pharm. 2010, 78, 133–154. [Google Scholar] [CrossRef]
- Servili, M.; Baldioli, M.; Selvaggini, R.; Macchioni, A.; Montedoro, G. Phenolic compounds of olive fruit: One- and two-dimensional nuclear magnetic resonance characterization of nuzhenide and its distribution in the constitutive parts of fruit. J. Agric. Food Chem. 1998, 47, 12–18. [Google Scholar] [CrossRef]
- Barbaro, B.; Toietta, G.; Maggio, R.; Arciello, M.; Tarocchi, M.; Galli, A.; Balsano, C. Effects of the olive-derived polyphenol oleuropein on human health. Int. J. Mol. Sci. 2014, 15, 18508–18524. [Google Scholar] [CrossRef] [PubMed]
- Faiza, I.; Sarra, B.; Kenza, M.; Imad, E.H.; Nassira, G.B. The role of phenolic compounds in the defense of sooty mold of olive leaves (Olea europea L.). Afr. J. Microbiol. Res. 2015, 9, 1075–1081. [Google Scholar] [CrossRef]
- Mihaylova, D.; Dimitrova-Dimova, M.; Popova, A. Dietary Phenolic Compounds—Wellbeing and Perspective Applications. Int. J. Mol. Sci. 2024, 25, 4769. [Google Scholar] [CrossRef]
- Xu, L.; Wang, X. A Comprehensive Review of Phenolic Compounds in Horticultural Plants. Int. J. Mol. Sci. 2025, 26, 5767. [Google Scholar] [CrossRef] [PubMed]
- Farolfi, C.; Tombesi, S.; Lucini, L. Influence of Fruit Load and Water Deficit on Olive Fruit Phenolic Profiling and Yield. Int. J. Plant Biol. 2024, 15, 895–913. [Google Scholar] [CrossRef]
- Benguennouna, N.; Benabdelmoumene, D.; Dahmouni, S.; Bengharbi, Z.; Bouzouina, M.; Qadi, W.S.M.; Dawoud, E.A.D.; Al-Olayan, E.; Moreno, A.; Mediani, A. Impact of diverse irrigation water sources on olive oil quality and its physicochemical, fatty acids, antioxidant, and antibacterial properties. Sci. Rep. 2025, 15, 15049. [Google Scholar] [CrossRef]
- Bubola, K.B.; Kolega, Š.; Marcelić, Š.; Šikić, Z.; Pinto, A.G.; Zorica, M.; Klisović, D.; Novoselić, A.; Špika, M.J.; Kos, T. Effect of Different Watering Regimes on Olive Oil Quality and Composition of Coratina Cultivar Olives Grown on Karst Soil in Croatia. Foods 2022, 11, 1767. [Google Scholar] [CrossRef]
- Ferro, M.D.; Caño-Carrillo, I.; Gilbert-López, B.; Fernández-García, A.; Cabrita, M.J.; Herrera, J.M.; Duarte, M.F. Agricultural practices as promoters of oleocanthal and oleacein availability in virgin olive oils from three olive cultivars. J. Agric. Food Res. 2025, 22, 102103. [Google Scholar] [CrossRef]
- Yılmaz-Düzyaman, H.; Medina-Alonso, M.G.; Sanz, C.; Pérez, A.G.; de la Rosa, R.; León, L. Influence of Genotype and Environment on Fruit Phenolic Composition of Olive. Horticulturae 2023, 9, 1087. [Google Scholar] [CrossRef]
- International Olive Council. Guide for the Determination of the Characteristics of Oil-Olives; International Olive Council: Madrid, Spain, 2011. [Google Scholar]
- Ferro, M.D.; Lopes, E.; Afonso, M.; Peixe, A.; Rodrigues, F.M.; Duarte, M.F. Phenolic profile characterization of “galega vulgar” and “cobrancosa” portuguese olive cultivars along the ripening stages. Appl. Sci. 2020, 10, 3930. [Google Scholar] [CrossRef]
- Falleh, H.; Ksouri, R.; Chaieb, K.; Karray-Bouraoui, N.; Trabelsi, N.; Boulaaba, M.; Abdelly, C. Phenolic composition of Cynara cardunculus L. organs, and their biological activities. Comptes Rendus Biol. 2008, 331, 372–379. [Google Scholar] [CrossRef] [PubMed]
- Ferro, M.D.; Santos, S.A.O.; Silvestre, A.J.D.; Duarte, M.F. Chromatographic separation of phenolic compounds from extra virgin olive oil: Development and validation of a new method based on a biphenyl HPLC column. Int. J. Mol. Sci. 2019, 20, 201. [Google Scholar] [CrossRef] [PubMed]
- Dag, A.; Kerem, Z.; Yogev, N.; Zipori, I.; Lavee, S.; Ben-David, E. Influence of time of harvest and maturity index on olive oil yield and quality. Sci. Hortic. 2011, 127, 358–366. [Google Scholar] [CrossRef]
- Peres, F.; Martins, L.L.; Mourato, M.; Vitorino, C.; Ferreira-Dias, S. Bioactive Compounds of Portuguese Virgin Olive Oils Discriminate Cultivar and Ripening Stage. J. Am. Oil Chem. Soc. 2016, 93, 1137–1147. [Google Scholar] [CrossRef]
- Pereira, J.A.; Pereira, A.P.G.; Ferreira, I.C.F.R.; Valentão, P.; Andrade, P.B.; Seabra, R.; Estevinho, L.; Bento, A. Table olives from Portugal: Phenolic compounds, antioxidant potential, and antimicrobial activity. J. Agric. Food Chem. 2006, 54, 8425–8431. [Google Scholar] [CrossRef]
- Trentacoste, E.R.; Connor, D.J.; Gómez-Del-Campo, M. Response of oil production and quality to hedgerow design in super-high-density olive cv. Arbequina orchards. Agronomy 2021, 11, 1632. [Google Scholar] [CrossRef]
- Cecchi, L.; Migliorini, M.; Cherubini, C.; Giusti, M.; Zanoni, B.; Innocenti, M.; Mulinacci, N. Phenolic profiles, oil amount and sugar content during olive ripening of three typical Tuscan cultivars to detect the best harvesting time for oil production. Food Res. Int. 2013, 54, 1876–1884. [Google Scholar] [CrossRef]
- Ortega-García, F.; Blanco, S.; Peinado, M.A.; Peragón, J. Polyphenol oxidase and its relationship with oleuropein concentrationin fruits and leaves of olive (Olea europaea) cv. ‘Picual’ trees duringfruit ripening. Tree Physiol. 2008, 28, 45–54. [Google Scholar] [CrossRef]
- Romani, A.; Mulinacci, N.; Pinelli, P.; Vincieri, F.F.; Cimato, A. Polyphenolic content in five tuscany cultivars of Olea europaea L. J. Agric. Food Chem. 1999, 47, 964–967. [Google Scholar] [CrossRef]
- Esti, M.; Cinquanta, L.; La Notte, E. Phenolic Compounds in Different Olive Varieties. J. Agric. Food Chem. 1998, 46, 32–35. [Google Scholar] [CrossRef]
- Ranalli, A.; Marchegiani, D.; Contento, S.; Girardi, F.; Nicolosi, M.P.; Brullo, M.D. Variations of iridoid oleuropein in Italian olive varieties during growth and maturation. Eur. J. Lipid Sci. Technol. 2009, 111, 678–687. [Google Scholar] [CrossRef]
- Fernández-Poyatos, M.P.; Ruiz-Medina, A.; Llorent-Martínez, E.J. Phytochemical profile and mineral content of Royal variety olive fruits. Influence of the ripening stage. J. Food Compos. Anal. 2021, 95, 103671. [Google Scholar] [CrossRef]
- Ryan, D.; Robards, K.; Lavee, S. Changes in phenolic content of olive during maturation. Int. J. Food Sci. Technol. 1999, 34, 265–274. [Google Scholar] [CrossRef]
- Fernandez-Orozco, R.; Roca, M.; Gandul-Rojas, B.; Gallardo-Guerrero, L. DPPH-scavenging capacity of chloroplastic pigments and phenolic compounds of olive fruits (cv. Arbequina) during ripening. J. Food Compos. Anal. 2011, 24, 858–864. [Google Scholar] [CrossRef]
- Briante, R.; Patumi, M.; Limongelli, S.; Febbraio, F.; Vaccaro, C.; Di Salle, A.; La Cara, F.; Nucci, R. Changes in phenolic and enzymatic activities content during fruit ripening in two Italian cultivars of Olea europaea L. Plant Sci. 2002, 162, 791–798. [Google Scholar] [CrossRef]
- Bouaziz, M.; Chamkha, M.; Sayadi, S. Comparative study on phenolic content and antioxidant activity during maturation of the olive cultivar Chemlali from Tunisia. J. Agric. Food Chem. 2004, 52, 5476–5481. [Google Scholar] [CrossRef] [PubMed]
- Gougoulias, N.; Giurgiulescu, L.; Vagelas, I.; Wogiatzi, E.; Ntalla, M.-N. Changes in total phenol content and antioxidant activity of greek table olive cultivar amfissis during maturation. Stud. Univ. Babes-Bolyai Chem. 2017, 62, 387–396. [Google Scholar] [CrossRef]
- Rossi, R.; Mainardi, E.; Vizzarri, F.; Corino, C. Verbascoside-Rich Plant Extracts in Animal Nutrition. Antioxidants 2023, 13, 39. [Google Scholar] [CrossRef]
- Frumuzachi, O.; Gavrilaș, L.I.; Vodnar, D.C.; Rohn, S.; Mocan, A. Systemic Health Effects of Oleuropein and Hydroxytyrosol Supplementation: A Systematic Review of Randomized Controlled Trials. Antioxidants 2024, 13, 1040. [Google Scholar] [CrossRef]
- Omar, S.H. Cardioprotective and neuroprotective roles of oleuropein in olive. Saudi Pharm. J. 2010, 18, 111–121. [Google Scholar] [CrossRef]
Disclaimer/Publisher’s Note: The statements, opinions and data contained in all publications are solely those of the individual author(s) and contributor(s) and not of MDPI and/or the editor(s). MDPI and/or the editor(s) disclaim responsibility for any injury to people or property resulting from any ideas, methods, instructions or products referred to in the content. |
© 2025 by the authors. Licensee MDPI, Basel, Switzerland. This article is an open access article distributed under the terms and conditions of the Creative Commons Attribution (CC BY) license (https://creativecommons.org/licenses/by/4.0/).