Abstract
The Metabolic Syndrome (MetS) is an increasingly prevalent condition globally. Latino populations in the USA have shown an alarming increase in factors associated with MetS in recent years. The objective of the present systematic review was to determine the prevalence of MetS and its risk factors in immigrant Latinos in the USA and perform a meta-analysis of those prevalence. The review included cross-sectional, cohort, or case–control studies involving adult immigrant Latinos in the USA, published during the period 1980–2020 in any language. Studies involving individuals who were pregnant, aged <18 years, immigrant non-Latinos, published outside the 1980–2020 period, or with other design types were excluded. The Pubmed, Web of Science, Embase, Lilacs, Scielo, and Google Scholar databases were searched. The risk of bias was assessed using the checklists of the Joanna Briggs Institute. The review included 60 studies, and the meta-analysis encompassed 52 studies. The pooled prevalence found for hypertension, diabetes, general obesity, and abdominal obesity were 28% (95% Confidence Interval (CI): 23–33%), 17% (95% CI: 14–20%), 37% (95% CI: 33–40%), and 54% (95% CI: 48–59%), respectively. The quality of the evidence of the primary studies was classified as low or very low. Few studies including immigrants from South America were identified. Further studies of those immigrants are needed due to the cultural, dietary, and language disparities among Latin American countries. The research protocol was registered with the Open Science Framework (OSF).
1. Introduction
The last few decades have seen a shift in the morbidity–mortality profile of the population globally, first in developed countries and then in developing nations. The epidemiological transition theory was first put forward by Omran [1] in 1971. According to this theory, the transition stems from long-term changes in patterns of mortality, and illnesses caused by infectious diseases are gradually giving way to an increased occurrence of chronic–degenerative diseases as the leading cause of morbidity and death.
According to Omran [1], the transition from the predominance of infectious–contagious diseases to chronic diseases involves three main groups of determinants: ecobiological determinants, socioeconomic, political and cultural determinants, and public health determinants.
There is currently a steady increase in cardiovascular disease, diabetes, cancers, and obesity. Regarding obesity, it is now considered a global epidemic, with the United States (USA) numbering as one of the first countries to show that rising obesity was becoming epidemic [2,3]. Obesity, together with hypertension, diabetes, and dyslipidemia, is one of the main risk factors for Metabolic Syndrome (MetS), a condition that has been widely described and whose prevalence tends to accompany rises in obesity [4,5].
The MetS was first described by Reaven [6]. The National Cholesterol Education Program (NCEP) [7] later produced the first standardized definition of MetS, updated in 2005 by Grundy et al. [8].
Currently, the diagnostic criterion for MetS is the co-occurrence of three or more of the following factors: high waist circumference (≥102 cm in men and ≥88 cm in women) or body mass index (BMI) > 30 kg/m2 (WHO [9]); high triglycerides (≥150 mg/dL or 1.7 mmol/L) or treatment for high triglycerides; low hide density lipoprotein (HDL) cholesterol (<40 mg/dL or 1.03 mmol/L in men and <50 mg/dL or 1.3 mmol/L in women) or treatment for low HDL cholesterol; high blood pressure (systolic ≥130 mm/Hg and diastolic ≥85 mm/Hg) or treatment for systemic arterial hypertension; and high fasting blood glucose (≥100 mg/dL) or treatment for type 2 diabetes.
In a 2020 study of USA adults [10], the authors found an MetS prevalence of 61.6% in obese individuals, 33.2% in overweight subjects, and 8.6% in adults with normal weight, highlighting the strong link between obesity and MetS. Despite the increasing prevalence of obesity in the general population of the USA over recent years, doubling between 1980 and 2010, this rate has now stabilized at approximately 35%. However, this rise remains alarming among minority populations, especially Latinos and black non-Latinos [5,11]. Similar increases for hypertension, diabetes, and high cholesterol have been documented in Latinos between 2001 and 2020 [12].
The Latino population In the USA is the largest and fastest growing racial/ethnic group in the country. According to USA Census data [13], the Latino population reached a total of 62.5 million people in 2021, a 19% increase from the 50.5 million Latinos in 2010. In California and Texas, Latinos became the largest racial/ethnic group. Florida, Arizona, and New York also had significant increases in the Latino population between the 2010 and 2021 Censuses.
Furthermore, the proportion of Latinos who speak English proficiently and who have a college education have grown since the 2010 Census [13]. However, Latinos in the USA are a very heterogeneous group [14] due to their cultural and socioeconomic differences, which demonstrate important variation according to their country of origin or ancestry. The average family income by Latino nationality, for example, shows that USA Latinos of Argentinian origin have the highest average income (USD 68,000) compared with the average for the USA Latino population (USD 49,010); those of Mexican origin have an average income of USD 49,000, while those of Honduran origin have the lowest average income (USD 41,000) [13].
Since the USA is one of the countries with the highest level of social disparities [15], the socioeconomic and educational disparities found among Latino populations according to nationality or ancestry must be considered in any public health studies of USA Latinos. Similar concerns should also apply to cultural differences between USA Latinos, because the fact that most USA Latinos are fluent in Spanish is not the only cultural aspect to consider regarding the determinants of MetS.
High rates of the factors associated with MetS in immigrant Latinos in the USA have been observed in previous studies, particularly among Mexicans [14,15,16]. Two systematic reviews [17,18] found increased obesity in Latinos, attributing this rise to higher levels of acculturation and residence in the USA, as well as immigrant generational and nativity status. The increase in obesity and in the other diseases defining MetS seen among immigrant populations is often associated with the nutritional transition occurring in developing countries, together with shifts in dietary habits and levels of physical activity, highlighted in both reviews [16,17]. For Brazil, a country which has been undergoing a process of nutritional transition since the 1970s [18], data from the Vigitel Brasil system [19] reveal an increase in the risk factors for chronic diseases, particularly overweight and obesity, indicating an increased risk of developing MetS.
Immigrants from developing countries undergoing a process of nutritional transition who emigrate to developed countries with a highly obesogenic environment are subject to an acceleration in the process of nutritional transition, favoring the development of obesity and its associated factors [17]. Nonetheless, when assessing such factors, it is important that cultural, language, economic, and social characteristics of the immigrants be taken into account, as well as origin.
Another key point is the very high likelihood that Brazilian immigrants were not included in samples of most studies conducted in the USA, owing to the classification adopted by the USA Census for the Latino population. Individuals with Cuban, Mexican, or Puerto Rican background/origin are usually classified as Hispanic or Latinos, whereas those from other Central and South American countries are identified as “others with Hispanic, Latino, or Spanish origin” [20]. Thus, the generalization for Brazilian immigrants of health information identified in studies of immigrants in the USA, using the term “Latino” as a reference, is not appropriate unless one can ascertain that Brazilians were included in the data sources.
Given the growth in diseases associated with MetS in immigrant Latinos in the USA and the epidemiological transition that has taken place and is still underway globally, in which chronic diseases feature as the leading cause of morbidity–mortality, identifying the publications involving this population to accurately determine the prevalence of MetS and its components is crucial.
However, the vast majority of publications on health conditions of immigrant Latinos in the USA address only immigrants from Mexico and Central America. Thus, how or whether South American immigrants are included in those studies remains unclear. Taking into account the cultural and economic heterogeneity that exists across Latin America, where Brazil has different language, culture, customs, and eating habits from other Spanish-speaking nations, analyses centering on the Brazilian population are important.
Therefore, the objective of our systematic review was to determine the prevalence of MetS and its risk factors among immigrant Latinos in the USA and perform a meta-analysis of those rates. This review also sought to ascertain which Latino groups are included and the extent to which Brazilians feature in those published studies.
2. Materials and Methods
2.1. Protocol
Our systematic review was carried out according to the PICO (Population, Intervention/Exposure, Comparator(s)/Control and Outcomes) strategy, where:
- Population: Immigrants from Latin America, residing in the USA, aged >18 years;
- Intervention/Exposure: Immigration;
- Comparator(s)/control: US-born Latino population;
- Outcomes: MetS and/or its components (primary) and sleep disorders (secondary).
The study protocol was based on the criteria established by PROSPERO, an International Prospective Register of Systematic Reviews, and registered with the Open Science Framework (OSF) before starting the review (https://doi.org/10.17605/OSF.IO/JFM7G (accessed on 7 January 2023)). The systematic review yielded sufficient data to perform a meta-analysis of prevalence, which was subsequently incorporated into the review. The systematic review was reported according to Preferred Reporting Items for Systematic Reviews and Meta-Analyses (PRISMA) 2020 statement [21] (Tables S1 and S2).
2.2. Definition of Disease and Disease Codes
The primary outcomes included in our review were the MetS and/or its risk factors: high blood pressure or diagnosis/treatment of arterial hypertension; high fasting blood glucose or diagnosis/treatment of type 2 diabetes mellitus; low HDL-c or treatment for low HDL-c; high triglycerides or treatment for high triglycerides; and high waist circumference or BMI > 30 kg/m2 [7,9]. Sleep disorders were the secondary outcomes.
Based on the codes of the International Statistical Classification of Diseases and Related Health Problems (ICD-10) [22], the relevant categories for the review were: E88.8—other specified metabolic disorders (MetS), I10—essential hypertension (primary), E78—disorders of lipoprotein metabolism and other lipidemias, E11—type 2 diabetes mellitus, E66—obesity, and G47—sleep disorders.
2.3. Search Strategy
The search strategy was devised to include all important descriptors needed to retrieve the relevant studies for the review (Table S3).
The PubMed, Web of Science, Embase, Lilacs, and Scielo databases were searched, along with Google Scholar as a complementary source, with no restrictions regarding language of publication. The search strategy was applied for the last time on 3 June 2020.
2.4. Study Selection
Studies that met the inclusion criteria listed below were selected for inclusion in the review:
- Cross-sectional, cohort, or case–control type study;
- Involving adults (>18 years);
- Investigating immigrant Latinos residing in the USA;
- Published during the period 1980–2020 in any language.
Studies involving pregnant women, immigrants from countries other than Latin America, children and adolescents (<18 years), published outside the 1980–2020 period or based on data collected prior to 1980, qualitative or case studies, and those with non-original data were excluded from the review.
Two reviewers (TP, DS) independently screened titles and abstracts of the articles retrieved using the search strategy by applying the Rayyan [23] app and Excel® spreadsheets. The full texts of the articles selected were then obtained, reviewed, and categorized as “included” or “excluded” by the same reviewers (TP, DS) in a double-blind analysis, according to the predefined inclusion criteria. The reasons for exclusion were documented using the Rayyan app [23]. At both stages, any discrepancies were checked by a third reviewer (LT).
2.5. Data Extraction
For all articles included in the previous stage, three reviewers (TP, DS, CN) extracted the data independently using an extraction spreadsheet previously created and validated by the research team, containing the following parameters:
- Study characteristics: authors, year of publication, author affiliations, e-mail of corresponding author, and study title;
- Study population: total number of participants, total number of women and men, whether study stratified analyses by Brazilian immigrants, immigrant group studies, age, country of origin, comparative group, and length of residence in the USA;
- Study design: design type and study period;
- Exposures;
- Other risk factors: work, shift work, documented or otherwise, and health insurance;
- Outcomes: MetS, hypertension or high blood pressure, type 2 diabetes or high fasting glucose, low HDL-c, high triglycerides, abdominal obesity or BMI > 30 kg/m2 (primary), and sleep disorders (secondary).
2.6. Risk of Bias
The risk of bias of the studies included was assessed using the checklists of the Joanna Briggs Institute (JBI) titled “Critical Appraisal Checklist for Analytical Cross-Sectional Studies, Checklist for Case-Control Studies, and Checklist for Cohort Studies” [24]. Located within the Faculty of Health Sciences of Adelaide University, the JBI is an international research and development organization world-renowned for evidence-based healthcare [24].
Given that systematic reviews represent a summary of core evidence, the JBI developed processes for the critical evaluation and synthesis of evidence to aid decision-making in health. The eight domains of risk of bias included in the JBI Critical Appraisal Checklist for Analytical Cross-Sectional Studies are: (i) clearly defined criteria for inclusion; (ii) description of study subjects and setting; (iii) valid and reliable measurement of exposure; (iv) use of objective, standard criteria; (v) identification of confounding factors; (vi) strategies for dealing with confounding factors; (vii) measurement of outcomes; and (viii) appropriate statistical analysis [24].
The JBI Critical Appraisal Checklist for Case Control Studies has 10 domains: (i) comparability of the groups; (ii) appropriateness of matching of cases and controls; (iii) criteria used for identification of cases and controls; (iv) valid and reliable measurement of exposure; (v) identification of confounding factors; (vi) identification of confounding factors; (vii) strategies for dealing with confounding factors; (viii) measurement of outcomes; (ix) length of exposure period of interest; and (x) appropriate statistical analysis [24].
The JBI Critical Appraisal Checklist for Cohort Studies has 11 domains: (i) similarity between groups and recruitment in the same population; (ii) similarity in measurement of exposures in assigning participants to the exposed and unexposed groups; (iii) valid and reliable measurement of exposure; (iv) identification of confounding factors; (v) strategies for dealing with confounding factors; (vi) outcome-free groups or participants at study baseline or exposure; (vii) measurement of outcomes; (viii) appropriate follow-up time; (ix) description of conclusion of follow-up or reason for loss to follow-up; (x) use of strategies to address incomplete follow-up; and (xi) appropriate statistical analysis [24].
For each study included the questions from the respective JBI Checklist were answered with a “yes”, “no”, “unclear”, or “not applicable”. The general risk of bias for each study was determined according to the following cut-off points [24]:
- ≥70% “yes” answers: low risk of bias;
- 50–69% “yes” answers: moderate risk of bias;
- <50% “yes” answers: high risk of bias.
Three of the study’s reviewers (TP, DS, CN) independently rated the risk of bias for each study included in the review, and a fourth reviewer (LT) settled any disagreements or discrepancies.
2.7. Analysis and Presentation of Results
The results obtained in the systematic review were first presented as a map of evidence, in which all articles reviewed were included according to study design, number of participants, characteristics of population, study site, and outcome for later analysis and discussion of findings.
A meta-analysis of the prevalence of risk factors for the MetS was then conducted. The clinical heterogeneity of studies that had the same outcome was assessed independently by two authors, with a third author settling any disagreements. Since studies assessed many different, yet related, effects, they were pooled using the inverse variance technique employing random-effect models. The software Stata version 15.0 was used for statistical analysis. The I2 statistic was used to analyze the statistical heterogeneity of the studies. Pooled effect estimates were presented on the basis of the meta-analysis, even when the statistical heterogeneity was high (I2 > 70%), because high levels of statistical heterogeneity were expected. A subgroup and sensitivity analysis was performed comparing immigrant Latinos with US-born Latinos—including sample size, extreme estimates, and study design for the outcomes arterial hypertension or high blood pressure, type-2 diabetes mellitus or high blood glucose, and general obesity—to check their influence on the pooled estimate. We could not conduct sensitivity analysis for the other outcomes due to the limited number of articles included in the meta-analysis.
The quality of the evidence was analyzed using the assessment criteria of the Grading of Recommendations Assessment, Development and Evaluation (GRADE) system, the most widely used instrument for assessing the quality of evidence of studies included in systematic reviews [25]. GRADE differs from other evaluation instruments by separating quality of evidence and strength of recommendation, rating quality of evidence for each outcome of interest, and allowing the level of quality of evidence of observational studies to be rated up if three criteria are met. The latter are large effect size, presence of dose–response gradient, and residual confounding factors, which increase confidence in estimates [25]. Forest plots were used in the meta-analyses for outcomes rated as very low quality of evidence, although combined estimates are not shown. The results of the synthesis of the evidence are shown in the summary table of findings.
3. Results
3.1. Study Selection
Of the 2497 unique studies retrieved after applying the search strategy, 60 studies met the criteria for inclusion in the systematic review. Of this total, 52 studies were subsequently included in the meta-analysis, according to the model established by the PRISMA statement [21] (Figure 1). The eight studies excluded from the meta-analysis lacked the parameters required to estimate prevalence.
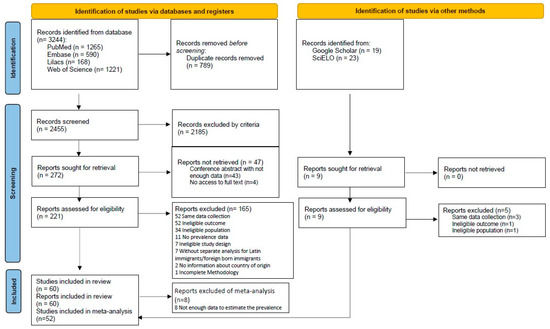
Figure 1.
Flow diagram of study selection process following the PRISMA 2020 flow diagram for new systematic reviews which included searches of databases, registers and other sources. Source: model extracted from Page et al. [21].
3.2. Study Characteristics
The total number of participants from all studies included in the review was 2,709,490. Most studies had a cross-sectional design (55) [15,16,26,27,28,29,30,31,32,33,34,35,36,37,38,39,40,41,42,43,44,45,46,47,48,49,50,51,52,53,54,55,56,57,58,59,60,61,62,63,64,65,66,67,68,69,70,71,72,73,74,75,76,77,78], followed by four cohort studies [14,79,80,81] and one case–control [82] study. Only two studies stratified Brazilian immigrants in their analyses [30,47]. Regarding country of origin of the immigrants studied, 14 studies involved Mexicans only [15,26,27,42,43,52,64,65,74,75,76,77,79,81], 11 Mexicans and other Latinos [16,33,34,36,49,51,54,61,63,66,67], 10 investigated immigrants from South and Central America (Brazil [30,47], Haiti [30,32], El Salvador [30,40], Colombia [30], Guatemala [30,40], Dominican Republic [30,46], Honduras [30,40], Peru [40], Bolivia [40], Puerto Rico [32,46], Mexico [46], Guyana [82] and other unspecified countries [32,35,38,39,45,46,82]), and 7 studied immigrants from Central America (Dominican Republic [69,72,80], Puerto Rico [69,72,80], Cuba [69,72], Mexico [72,78], El Salvador [78], Guatemala [78], Honduras [78], Haiti [56,59], and other unspecified countries [37,69,80]).
Participant age ranged from 0 to 91 years. Only one study included children and adolescents in its sample [56], age group 0 to ≥75 years. However, the analysis was stratified by age group, allowing data for subjects aged >18 years to be extracted.
Length of residence of the immigrants in the USA was assessed in 36 studies. Of these publications, 12 stratified length of residence into <10 years and >10 years [26,28,32,34,35,38,39,42,58,70,78,81]. The other studies included immigrants with <10 years of residence in the USA [30,65], <15 and >15 years [29,44,53,54,56], <20 and >20 years [41,50,66,74,80], or <25 and >25 years of residence [14]. Eleven studies [16,40,47,51,52,55,61,64,67,75,77] reported only average years of residence.
The exposures assessed in the studies were grouped under four categories related to immigration; immigrant; health, diet and lifestyle; and community. The distribution of exposures for the different categories is presented in Table 1.

Table 1.
Exposures Assessed in Studies Reviewed.
In total, 17 articles analyzed work-related factors [16,31,33,39,41,43,44,46,47,53,55,61,64,66,67,68,70] and 9 described participant occupations, of which 4 involved rural or agricultural workers [31,33,61,70], 2 taxi/for-hire vehicle drivers, 1 professional/management and support services workers [44], and 1 female homemakers and others [66], while 1 encompassed a broad group of workers [16], dividing participants into: skilled professional, semiskilled white-collar, clerical, semiskilled blue-collar, unskilled service, laborer, or farmworker; homemaker; and unemployed or student. Four studies addressed the issue of immigrant documentation in their results [43,46,61,76] and 19 included information on holding health insurance or otherwise [28,31,33,36,37,39,40,45,46,49,54,55,56,57,63,68,75,78,80]. The characteristics of the studies included in the review are presented in Table 2.
Table 2.
Characteristics of Latinos in the USA studies reviewed.
3.3. Risk of Bias
For the 55 cross-sectional studies included in the systematic review, the overall scoring of risk of bias ranged from 25.5 to 100% for the eight domains of the JBI Critical Appraisal Checklist for Analytical Cross-Sectional Studies (Table 3). Most of the studies (50) had low risk of bias, three had moderate risk, and two had high risk of bias (Table 3).
Table 3.
JBI Critical Appraisal Checklist for Analytical Cross-Sectional Studies.
Of the four cohort studies included and rated using the JBI Critical Appraisal Checklist for Cohort Studies (Table 4), two had low risk and two had moderate–high risk. The single case–control study included had low risk of bias according to the rating determined on the JBI Critical Appraisal Checklist for Case–Control Studies (Table 5).
Table 4.
JBI Critical Appraisal Checklist for Cohort Studies.
Table 5.
JBI Critical Appraisal Checklist for Case–Control Studies.
3.4. Findings
3.4.1. Outcomes for Latinos in the USA
Of the primary outcomes observed in the present review, 36 studies investigated hypertension [14,15,16,28,31,33,38,39,40,44,46,48,49,50,53,54,55,56,57,58,59,60,61,62,63,64,65,67,68,69,70,74,77,78,81,82], 34 assessed type 2 diabetes mellitus [14,15,16,31,33,34,36,37,38,39,40,43,44,46,50,52,54,56,57,59,60,61,63,64,65,67,68,69,70,75,77,78,80,82], 40 obesity (BMI ≥ 30 kg/m2) [14,15,16,26,27,29,30,31,32,33,34,35,37,40,41,42,43,44,46,47,50,51,52,54,58,60,61,63,64,65,66,67,70,71,72,73,74,76,78,79], 8 abdominal obesity (waist circumference) [15,26,39,60,64,65,72,77], 7 low cholesterol HDL [15,37,40,45,60,65,77], 7 high triglycerides [15,34,40,45,60,65,77], and 7 MetS [16,40,60,64,65,77]. Of the total studies reviewed, 21 analyzed at least three factors of MetS [14,15,16,33,34,37,39,40,44,46,50,54,60,61,63,64,65,67,70,77,78]. With regard to secondary outcomes, only two studies assessed sleep duration [34,44] (Table 6).
Table 6.
Outcomes Assessed for the Latinos in the USA Studies.
Arterial Hypertension or High Blood Pressure for Latinos in the USA
Of the 36 studies that assessed arterial hypertension, 24 measured blood pressure [14,15,28,31,33,38,39,40,48,50,53,57,59,60,61,63,64,65,67,69,74,77,78,82], 11 collected information based on self-reports [16,44,46,49,54,56,58,62,68,70,81], and 1 employed both methods [55].
The prevalence of arterial hypertension or high blood pressure in the studies reviewed in Latinos was 28% (95% CI: 23%-33%, I2: 99.6%). Of the studies included in the meta-analysis, 23 were heterogeneous (Figure 2). Within this group, some studies [16,39,50,53,68,70,78,82] differed more with respect to population size, measurement approach (objective or subjective), design (one case–control study) and characteristics of the population (ethnicity, age, and country of origin).
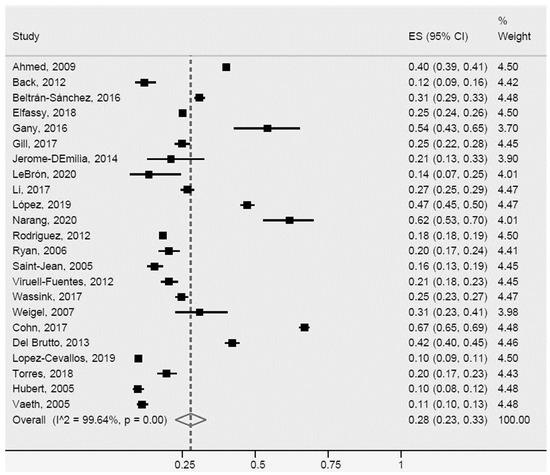
Figure 2.
Arterial hypertension or high blood pressure for Latinos in the US. ES = Estimated proportion/prevalence; CI = Confidence interval; I^2 = I2 index.
Additionally, a meta-analysis of the prevalence of arterial hypertension or high blood pressure for non-US-born Latinos (immigrants) and US-born Latinos was carried out (Figure 3). We found slightly higher prevalence for US-born Latinos (32% (95% CI: 19–45%, I2: 99.7%)), than for immigrant Latinos (28% (95% CI: 22–33%, I2: 99.3%)). The seven studies of immigrant Latinos and four of US-born Latinos included in the meta-analysis were heterogeneous. Greater differences were identified in two studies of immigrant Latinos [39,54] and two of US-born immigrants [14,54], possibly explained by population size, study design, or outcome measurement method.
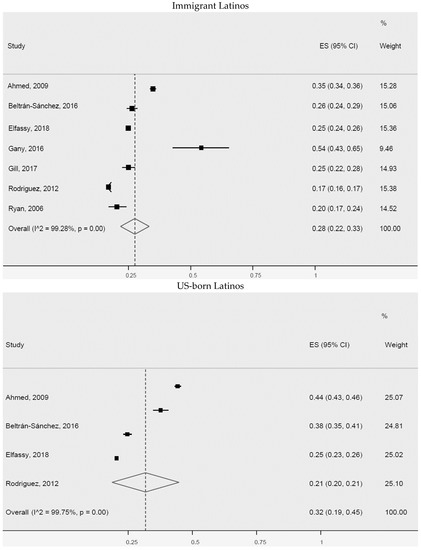
Figure 3.
Arterial hypertension or high blood pressure for immigrant Latinos and US-born Latinos. ES = Estimated proportion/prevalence; CI = Confidence interval; I^2 = I2 index.
Type 2 Diabetes Mellitus or High Blood Glucose for Latinos in the USA
Of the 34 studies which evaluated type 2 diabetes mellitus or high blood glucose, 21 analyzed blood samples to determine glucose levels [14,15,31,34,37,38,39,40,43,50,52,57,59,60,61,63,64,65,77,80,82], while 13 collected self-report information in interviews [16,33,36,44,46,54,56,67,68,69,70,75,78].
A total of 24 studies were included in the meta-analysis of the prevalence of type 2 diabetes mellitus or high blood glucose (Figure 4), although those were heterogeneous. The prevalence of those conditions in Latinos was 17% (95% CI: 14–20%, I2: 99.3%). Notably, a number of studies [16,37,39,43,52,65,70,78,80,82] exhibited greater heterogeneity compared with the others regarding population size, outcome measurement method, study design, and country of origin of immigrant Latinos.
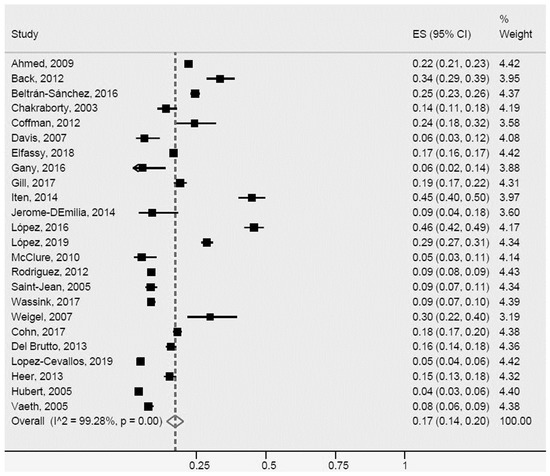
Figure 4.
Type 2 diabetes mellitus or high blood glucose for Latinos in the US. ES = Estimated proportion/prevalence; CI = Confidence interval; I^2 = I2 index.
In the further analyses, a meta-analysis of the prevalence of type 2 diabetes mellitus or high blood glucose was conducted on seven studies for immigrant Latinos and five for US-born Latinos (Figure 5). However, population size and outcome measurement methods differed in three of the studies for immigrant Latinos [39,43,54] and three for US-born Latinos [38,43,54]. A higher prevalence of the conditions was found for US-born Latinos (25% (95% CI: 16–33%, I2: 99.6%)) compared with immigrant Latinos (19% (95% CI: 14–24%, I2: 99.3%)).
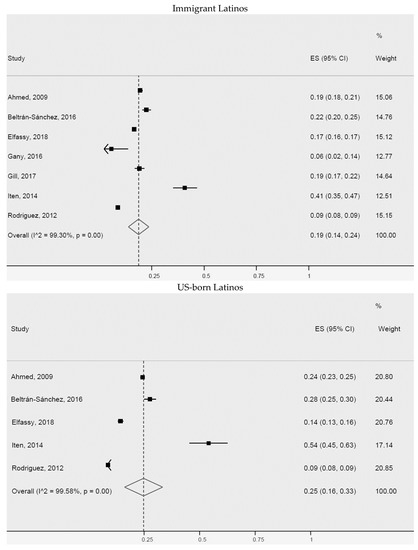
Figure 5.
Type 2 diabetes mellitus or high blood glucose for immigrant Latinos and US-born Latinos. ES = Estimated proportion/prevalence; CI = Confidence interval; I^2 = I2 index.
General Obesity and Abdominal Obesity for Latinos in the USA
Of the 41 studies assessing general obesity (BMI ≥ 30 kg/m2), 26 collected measurements of weight and height of participants [14,15,26,27,30,31,32,33,34,37,40,43,46,50,51,52,60,61,63,64,65,66,67,72,73,74] (one study classified participants as “overweight or obese” [31] on the basis of a BMI ≥ 25 kg/m2), 12 obtained the parameters from self-reports [16,29,35,41,44,47,54,58,70,71,76,79], while 2 studies employed both collection methods [42,78]. All eight studies assessing abdominal obesity performed waist circumference measurements.
For general obesity, the 28 studies included in the meta-analysis (Figure 6) were heterogeneous, revealing a general obesity rate of 37% (95% CI: 34–40%, I2: 99.6%) in Latinos. A total of eleven [16,29,34,35,37,43,54,65,66,70,74] studies showed greater heterogeneity, particularly for population sample size, age, country of origin, and outcome measures.
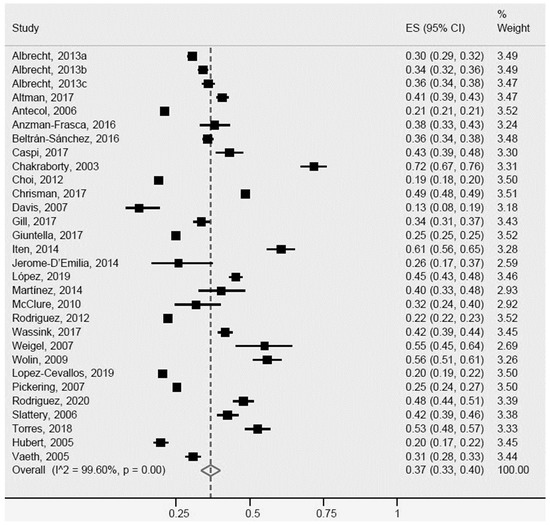
Figure 6.
General obesity for Latinos in the US. ES = Estimated proportion/prevalence; CI = Confidence interval; I^2 = I2 index.
For abdominal obesity, the prevalence for Latinos determined by the meta-analysis of five studies was 54% (95% CI: 48–59%, I2: 96.7%). Notably, all five studies were heterogeneous (Figure 7).
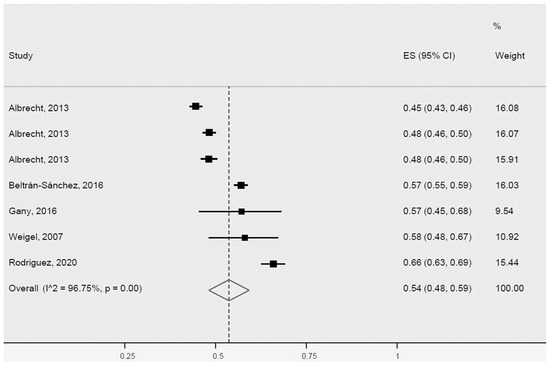
Figure 7.
Abdominal obesity for Latinos in the USA. ES = Estimated proportion/prevalence; CI = Confidence interval; I^2 = I2 index.
In our analyses of general obesity rates in immigrant Latinos and US-born Latinos, 13 studies were included in the meta-analysis for immigrants and 10 for US-born Latinos (Figure 8). We observed a higher prevalence of general obesity in immigrants (23%, 95% CI: 19–26%, I2: 99.7%) compared with US-born Latinos (15%, 95% CI: 13–16%, I2: 99%). All articles included in the meta-analysis involving immigrants, as well as those of US-born immigrants, were heterogeneous. However, five studies of immigrant Latinos [30,37,43,51,72] and one of US-born Latinos [72] exhibited greater heterogeneity for population size, age, and country of origin.
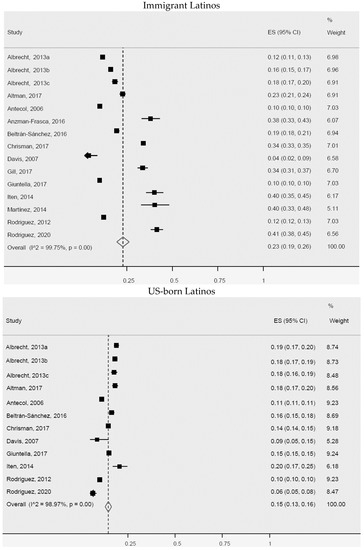
Figure 8.
General obesity for immigrant Latinos and US-born Latinos. ES = Estimated proportion/prevalence; CI = Confidence interval; I^2 = I2 index.
HDL Cholesterol and Triglycerides for Latinos in the USA
All studies that determined HDL cholesterol HDL (7) and triglycerides (7) collected data through blood workups. Five studies were included in the meta-analysis of the prevalence of low HDL cholesterol in Latinos (Figure 9), revealing a prevalence of 42% (95% CI: 35–49%, I2: 92.2%). The studies were heterogeneous, maybe due to different sample sizes.
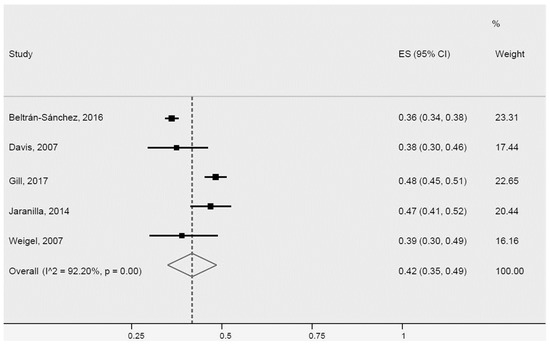
Figure 9.
Low HDL cholesterol for Latinos in the USA. ES = Estimated proportion/prevalence; CI = Confidence interval; I^2 = I2 index.
For high triglycerides, the five studies included in the meta-analysis were also heterogeneous (Figure 10). Two of the studies [34,65] differed more for population size and country of origin of immigrant Latinos. The prevalence of high triglycerides in Latinos was 38% (95% CI: 24–51%, I2: 98.6%).
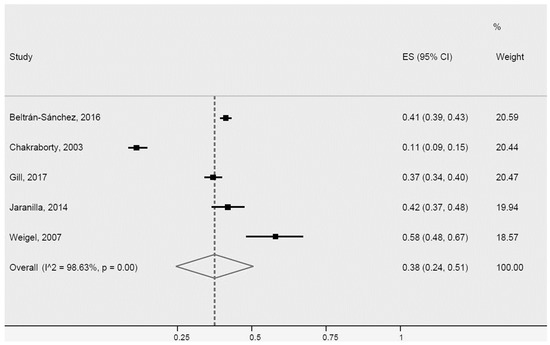
Figure 10.
High triglycerides for Latinos in the USA. ES = Estimated proportion/prevalence; CI = Confidence interval; I^2 = I2 index.
Metabolic Syndrome for Latinos in the USA
Of the six studies assessing the MetS, five used objective measures for obtaining data [40,60,64,65,77], while one collected data using self-reports [16].
Despite the greater heterogeneity of two studies [40,65], attributed to population size and country of origin of immigrant Latinos, they were included, together with three other studies in the meta-analysis of the prevalence rate of MetS in Latinos (Figure 11), which results showed a prevalence of 39% (95% CI: 32–45%, I2: 93.2%).
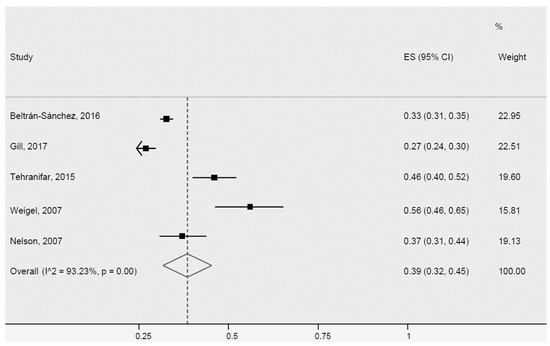
Figure 11.
Metabolic Syndrome for Latinos in the USA. ES = Estimated proportion/prevalence; CI = Confidence interval; I^2 = I2 index.
3.4.2. Further Sensitivity Analyses
Sensitivity analyses considering sample size, extreme estimates, and study design did not show substantial changes in the results of the meta-analyses for almost all analyses of the outcomes hypertension or high blood pressure, type 2 diabetes mellitus or high blood glucose, and overall obesity. However, a statistically significant difference was observed between groups (data not shown) when considering study design (longitudinal and cross-sectional) for type 2 diabetes mellitus or high blood glucose (p = 0.02, prevalence of 34% for longitudinal and 15% for cross-sectional) and sample size (≤1000 participants and >1000 participants) for general obesity (p = 0.007, prevalence of 45% for ≤1000 and 32% for >1000). The difference observed for the study design may have occurred because longitudinal studies have greater methodological rigor and control for potential confounders than cross-sectional ones.
Further sensitivity analyses including sex, age, country of birth, length of residence in the USA, migration status, occupation, and health insurance, which could explain other differences, could not be conducted because insufficient studies had the necessary data for the estimates.
3.4.3. Quality of Evidence
After applying the GRADE system criteria (Table 7), the categories risk of bias (heterogeneity) and imprecision were downgraded by one point for the outcomes arterial hypertension, type 2 diabetes mellitus, general obesity, and abdominal obesity. Publication bias was not downgraded, not even for indirect evidence, since the surrogate outcomes observed (high blood pressure and glucose, and BMI and waist measures) were strongly associated with the outcomes of interest.
Table 7.
Summary of Findings.
The quality of evidence for the assessment of high triglycerides and low HDL cholesterol was downgraded by one point for risk of bias, inconsistency (heterogeneity), and publication bias, and by two points for imprecision, because we found only a few studies assessing those outcomes. Most studies showed major differences in sample size and broad confidence intervals in the meta-analysis. No downgrades for indirect evidence were made since no surrogate outcomes were identified.
For MetS, the risk of bias and publication bias categories were each downgraded by one level, whereas the inconsistency (heterogeneity) and imprecision categories were each downgraded by two levels. The quality of evidence was downgraded for publication bias because few studies were found assessing the MetS in immigrant Latinos, which may have led to overestimation of the measure.
The studies included in the review were expected to be heterogeneous, chiefly owing to cultural disparities, such as dietary habits and different lifestyles, among immigrant populations. Those differences can impact the outcomes observed, confirmed by I2 results exceeding 90%. Other factors, such as socioeconomic differences, migration status, education, acculturation, and length of residence in the USA, can also affect heterogeneity. Those factors, however, could not be explored further in our review because few studies reported those characteristics. The downgrading of quality by one level due to risk of bias for all outcomes observed was based on the individual assessment of risk of bias by the JBI.
In conclusion, the quality of evidence for the outcomes of interest of this systematic review and meta-analysis was defined as low for systemic arterial hypertension, type 2 diabetes mellitus, general obesity, and abdominal obesity and as very low for high triglycerides, low HDL cholesterol, and MetS. It is likely that further research may impact this conclusion and change it.
4. Discussion
4.1. Summary of Evidence
A total of 60 sixty studies were included in this systematic review, of which 52 were included in the meta-analysis. The overall population of the 52 studies was 436,654 immigrant Latinos in the US. The pooled prevalence obtained for arterial hypertension, type 2 diabetes mellitus, general obesity, and abdominal obesity were 28% (95% CI: 23–33%), 17% (95% CI: 14–20%), 37% (95% CI: 33–40%) and 54% (95% CI: 48–59%), respectively (Table 7). The prevalence for the other outcomes are not shown because of uncertainty regarding those outcomes in immigrant Latinos and the very low quality of the evidence.
Higher prevalence for the outcomes arterial hypertension or high blood pressure and type 2 diabetes mellitus or high blood glucose were found in US-born Latinos compared with immigrant Latinos. By contrast, the prevalence for general obesity was higher in immigrants. Data from the USA Centers for Disease Control and Prevention (CDC) [12] show an alarming rise in obesity, hypertension, and diabetes in the Latino population. The evidence found in this review demonstrates an increased cardiovascular risk in Latino populations in the USA and supports the notion of increased weight and chronic conditions in this group as a result of the accelerated process of nutrition transition occurring in many countries of Latin America and other developing countries. Secondly, the evidence suggests that exposure to a highly obesogenic environment such as the USA should be taken into account in studies on obesity and associated factors [37,51]. Thirdly, the evidence supports the potential association of socioeconomic status, variations in physical activity behavior, and significant cultural variations among Latin American countries with the development of chronic diseases.
Comparison of the prevalence found in our meta-analysis with those of the CDC for the Latino population in the six states with the largest concentration of Latino and Brazilians (Florida, Massachusetts, New Jersey, New York, California, and Connecticut) [12], based on 2019 American Community Survey (ACS) data [83], revealed higher prevalence in our meta-analysis for hypertension (CDC prevalence range: 22.4–27.4%), diabetes (CDC range: 8.3–13.9%), and high cholesterol (CDC range: 27.3–31.8% based on meta-analysis rates for triglycerides and HDL cholesterol). The meta-analysis prevalence rate for obesity was similar to the 2020 CDC prevalence [12] for general obesity (range: 27.1–41.4%) but lower only for the rate observed in California.
4.2. Comparison with Previous Systematic Reviews and Meta-Analyses
To the best of our knowledge, there have been no previous systematic reviews or meta-analyses assessing factors associated with MetS in immigrant Latinos in the USA, precluding any meaningful comparisons. However, two systematic reviews assessing obesity alone [17,18] in immigrant populations were conducted. Those reviews suggested a potential relationship between increased obesity and higher level of acculturation, sex, nativity, length of residence in the USA, and generational status of immigrants. Nevertheless, the prevalence of obesity in this population was not addressed in those reviews, preventing any comparisons with obesity data we found in our review and meta-analysis.
The review by Delavari et al. [17] explored the relationship between acculturation and overweight/obesity in adult immigrants from low- and middle-income countries. Overall, of the nine studies reviewed, seven identified a positive association between level of acculturation and bodyweight variables. Among the studies reviewed by those authors involving immigrant Latino populations (Mexican-Americans) in the USA, significant BMI differences were found according to acculturation levels, sex, nativity, length of residence in the country, and generational status of immigrants. That review [17] showed that higher levels of acculturation were associated with greater BMI in immigrant Latinos, and also identified an association of sex, immigrant generational status, and nativity with increased obesity.
In the analyses stratified by sex, women immigrants residing in the USA for over 15 years had a mean BMI that was 2.38 kg/m2 greater than the average found for women with less than 5 years of residence. A similar result was found for men living in the USA for over 15 years compared with those residing in the country for less than 5 years (1.10 kg/m2 higher mean BMI in former group). To assess the risk of developing obesity associated with increased level of acculturation, the same review found a 4% and 3% higher risk of obesity in immigrant men and women with a high level of acculturation, respectively. With regard to the generational status of immigrants, Delavari et al. [17] found that second and third generations of Mexican-Americans had higher BMIs than their first generation counterparts.
The review by Oza-Frank and Cunningham [18] investigated the relationship between length of residence of immigrants in the USA and BMI. For the majority of the studies reviewed, the authors identified a positive association between time of residence in the USA and BMI. Some of the study results showed that a length of residence of up to 10 years promoted no major change in the BMI of immigrants, whereas others identified peak BMI growth after 21 years of residence for men and 15 years for women. The same review [18] included four studies involving immigrant Latinos, all of which reported a significant association between BMI and length of residence in the US.
4.3. Limitations
Our systematic review and meta-analysis have some limitations. First, there is high statistical heterogeneity for all outcomes. Immigrant populations differ in many ways, e.g., country of origin, migration status, degree of acculturation, and educational and socioeconomic levels, and those differences might explain the high inconsistencies found. Thus, the pooled estimates in this study should be regarded as suggestive as opposed to conclusive.
Second, most studies reviewed specifying the origin of the immigrant Latino population included only immigrants from Mexico or Central America. As a result, much of the evidence found in our review is limited to a subpopulation of immigrants from Latin America. There is scant scientific evidence on components of the MetS in immigrants from South America. Thus, the evidence found in this review and meta-analysis may not be representative of those countries which exhibit major sociocultural and economic differences that can impact the development of chronic diseases.
Third, it was not possible to stratify analyses for other key characteristics, such as sex, age, country of birth, length of residence in the USA, migration status, occupation, and health insurance, because not all studies reported the detailed information needed to calculate such estimates.
Fourth, some studies reported results for more than one outcome of interest. However, it was not possible to extract information for all outcomes in some cases, as not all studies provided the data needed for that.
Fifth, some studies used measures derived from self-reports, particularly for general obesity, which are known to be subject to information bias, typically leading to an underestimation of own weight by women and overestimation by men [84].
Lastly, the studies were pooled in the meta-analyses, irrespective of risk of individual bias associated with them in order to prevent selection bias in meta-analyses due to stratification by quality of study [85].
5. Conclusions
This systematic review and meta-analysis were conducted in collaboration with researchers from the USA and Brazil to compile the available evidence on MetS and its risk factors in the immigrant Latino population. A large body of evidence was identified encompassing numerous studies, particularly pertaining to hypertension, type 2 diabetes, and both general and abdominal obesity. However, the evidence was classified as low or very low depending on the outcome. This rating suggests that future reviews and meta-analyses may reach different conclusions when more studies assessing MetS and its components become available, particularly HDL cholesterol and triglycerides, factors which featured less in the studies reviewed.
The pooled prevalence obtained were 28% (95% CI: 23–33%) for arterial hypertension, 17% (95% CI: 14–20%) for type 2 diabetes mellitus, 37% (95% CI: 33–40%) for general obesity, and 54% (95% CI: 48–59%) for abdominal obesity. Greater prevalence of arterial hypertension and type 2 diabetes mellitus were found for US-born Latinos, while general obesity rates were higher for immigrant Latinos.
The production of prevalence estimates of the MetS and its risk factors in the immigrant population appears to be justified and evidence-based, considering the cultural, dietary, and lifestyle differences encountered by migrants, which promote increased obesity (strongly associated with MetS) and chronic diseases associated with the condition.
However, few studies were available that included, or analyzed separately, information on immigrant Latinos from South America, including Brazil, a region for which only two studies were found. Therefore, further studies are needed addressing MetS and its factors in immigrants from South America, particularly Brazil, in view of the particularities regarding the culture, language, and diet compared with other Latin American nations.
Supplementary Materials
The following supporting information can be downloaded at: https://www.mdpi.com/article/10.3390/ijerph20021307/s1, Table S1: PRISMA 2020 Checklist; Table S2: PRISMA 2020 Abstract Checklist; Table S3: Search Strategy.
Author Contributions
Conceptualization, T.M.P., L.R.T. and C.E.G.S.; methodology, T.M.P., L.R.T., C.A.F.d.A. and C.E.G.S.; protocol and search strategy, T.M.P., L.R.T., M.M.-S. and C.E.G.S.; investigation, T.M.P., L.R.T., D.S. and C.N.; formal analysis, T.M.P., L.R.T. and C.A.F.d.A.; writing—original draft preparation, T.M.P. and L.R.T.; writing—review and editing, T.M.P., L.R.T., C.A.F.d.A., M.M.-S., D.S., C.N. and C.E.G.S.; funding acquisition, T.M.P. and L.R.T. All authors have read and agreed to the published version of the manuscript.
Funding
This study was partially supported by the Coordenação de Aperfeiçoamento de Pessoal de Nível Superior—CAPES—Finance Code 001.
Institutional Review Board Statement
Not applicable.
Informed Consent Statement
Not applicable.
Data Availability Statement
The protocol of the systematic review is available at: https://osf.io/jfm7g (accessed on 2 November 2022).
Acknowledgments
The authors would like to thank the Oswaldo Cruz Foundation (Fiocruz) for the doctoral fellowship granted to the main author of the article during the study period; the authors also thank the Carlos Chagas Filho Foundation Research Funding Body of Rio de Janeiro state (FAPERJ) for the financial support provided for the review and translation of the article (grant E-26./210.882/2021).
Conflicts of Interest
The authors declare no conflict of interest. The funders had no role in the design of the study; in the collection, analyses, or interpretation of data; in the writing of the manuscript; or in the decision to publish the results.
References
- Omran, A.R. The Epidemiologic Transition: A Theory of the Epidemiology of Population Change. Milbank Q 2005, 83, 731–757. [Google Scholar] [CrossRef] [PubMed]
- World Health Organization. Obesity: Preventing and Managing the Global Epidemic: Report of a WHO Consultation; WHO Technical Report Series; World Health Organization: Geneva, Switzerland, 2000; ISBN 978-92-4-120894-9. [Google Scholar]
- World Health Organization. Obesity and Overweight. Available online: https://www.who.int/news-room/fact-sheets/detail/obesity-and-overweight (accessed on 25 August 2022).
- Zimmet, P.; Magliano, D.; Matsuzawa, Y.; Alberti, G.; Shaw, J. The Metabolic Syndrome: A Global Public Health Problem and a New Definition. J. Atheroscler. Thromb. 2005, 12, 295–300. [Google Scholar] [CrossRef] [PubMed]
- Hruby, A.; Hu, F.B. The Epidemiology of Obesity: A Big Picture. PharmacoEconomics 2015, 33, 673–689. [Google Scholar] [CrossRef]
- Reaven, G.M. Role of Insulin Resistance in Human Disease. Diabetes 1988, 37, 1595–1607. [Google Scholar] [CrossRef] [PubMed]
- NCEP. Third Report of the National Cholesterol Education Program (NCEP) Expert Panel on Detection, Evaluation, and Treatment of High Blood Cholesterol in Adults (Adult Treatment Panel III) Final Report. Circulation 2002, 106, 3143–3421. [Google Scholar] [CrossRef]
- Grundy, S.M.; Cleeman, J.I.; Daniels, S.R.; Donato, K.A.; Eckel, R.H.; Franklin, B.A.; Gordon, D.J.; Krauss, R.M.; Savage, P.J.; Smith, S.C.; et al. Diagnosis and Management of the Metabolic Syndrome: An American Heart Association/National Heart, Lung, and Blood Institute Scientific Statement. Circulation 2005, 112, 2735–2752. [Google Scholar] [CrossRef] [PubMed]
- World Health Organization. Definition, Diagnosis and Classification of Diabetes Melittus and Its Complications. Part 1: Diagnosis and Classification of Diabetes Melittus. Geneva. 1999. Available online: https://apps.who.int/iris/handle/10665/66040 (accessed on 16 September 2022).
- Shi, T.H.; Wang, B.; Natarajan, S. The Influence of Metabolic Syndrome in Predicting Mortality Risk Among USA Adults: Importance of Metabolic Syndrome Even in Adults with Normal Weight. Prev. Chronic Dis. 2020, 17, 200020. [Google Scholar] [CrossRef]
- Malik, V.S.; Willett, W.C.; Hu, F.B. Global Obesity: Trends, Risk Factors and Policy Implications. Nat. Rev. Endocrinol. 2013, 9, 13–27. [Google Scholar] [CrossRef] [PubMed]
- CDC. BRFSS Prevalence & Trends Data. Available online: https://www.cdc.gov/brfss/brfssprevalence/ (accessed on 7 July 2022).
- US Census Bureau. USA Census Bureau: Explore Data. Available online: https://data.census.gov/mdat/#/ (accessed on 2 January 2023).
- Ahmed, A.T.; Quinn, V.P.; Caan, B.; Sternfeld, B.; Haque, R.; Van Den Eeden, S.K. Generational Status and Duration of Residence Predict Diabetes Prevalence among Latinos: The California Men’s Health Study. BMC Public Health 2009, 9, 392. [Google Scholar] [CrossRef]
- Beltrán-Sánchez, H.; Palloni, A.; Riosmena, F.; Wong, R. SES Gradients Among Mexicans in the United States and in Mexico: A New Twist to the Hispanic Paradox? Demography 2016, 53, 1555–1581. [Google Scholar] [CrossRef]
- Hubert, H.; Snider, J.; Winkleby, M. Health Status, Health Behaviors, and Acculturation Factors Associated with Overweight and Obesity in Latinos from a Community and Agricultural Labor Camp Survey. Prev. Med. 2005, 40, 642–651. [Google Scholar] [CrossRef] [PubMed]
- Delavari, M.; Sønderlund, A.L.; Swinburn, B.; Mellor, D.; Renzaho, A. Acculturation and Obesity among Migrant Populations in High Income Countries--a Systematic Review. BMC Public Health 2013, 13, 458. [Google Scholar] [CrossRef] [PubMed]
- Oza-Frank, R.; Cunningham, S.A. The Weight of USA Residence among Immigrants: A Systematic Review. Obes. Rev. 2010, 11, 271–280. [Google Scholar] [CrossRef] [PubMed]
- Brasil. Ministério Da Saúde. Secretaria de Vigilância Em Saúde. Vigitel Brasil: Vigilância de Fatores de Risco e Proteção Para Doenças Crônicas Por Inquérito Telefônico. Publicações 2010–2020. Available online: https://www.gov.br/saude/pt-br/centrais-de-conteudo/publicacoes/publicacoes-svs/vigitel (accessed on 5 July 2022).
- United States Census Bureau. Hispanic or Latino Origin. Available online: https://www.census.gov/acs/www/about/why-we-ask-each-question/ethnicity/ (accessed on 19 September 2022).
- Page, M.J.; McKenzie, J.E.; Bossuyt, P.M.; Boutron, I.; Hoffmann, T.C.; Mulrow, C.D.; Shamseer, L.; Tetzlaff, J.M.; Akl, E.A.; Brennan, S.E.; et al. The PRISMA 2020 Statement: An Updated Guideline for Reporting Systematic Reviews. BMJ 2021, 372, n71. [Google Scholar] [CrossRef] [PubMed]
- WHO. ICD-10 Version: 2019; WHO: Geneva, Switzerland, 2019. [Google Scholar]
- Ouzzani, M.; Hammady, H.; Fedorowicz, Z.; Elmagarmid, A. Rayyan-a Web and Mobile App for Systematic Reviews. Syst. Rev. 2016, 5, 210. [Google Scholar] [CrossRef]
- Moola, S.; Munn, Z.; Tufanaru, C.; Aromataris, E.; Sears, K.; Sfetcu, R.; Currie, M.; Qureshi, R.; Mattis, P.; Lisy, K.; et al. Chapter 7: Systematic Reviews of Etiology and Risk. In JBI Manual for Evidence Synthesis; Aromataris, E., Munn, Z., Eds.; JBI: Adelaide, Australia, 2020. [Google Scholar]
- Goldet, G.; Howick, J. Understanding GRADE: An Introduction. J. Evid. Based Med. 2013, 6, 50–54. [Google Scholar] [CrossRef]
- Albrecht, S.S.; Diez Roux, A.V.; Aiello, A.E.; Schulz, A.J.; Abraido-Lanza, A.F. Secular Trends in the Association between Nativity/Length of USA Residence with Body Mass Index and Waist Circumference among Mexican-Americans, 1988–2008. Int. J. Public Health 2013, 58, 573–581. [Google Scholar] [CrossRef]
- Altman, C.E.; Van Hook, J.; Gonzalez, J. Becoming Overweight without Gaining a Pound: Weight Evaluations and the Social Integration of Mexicans in the United States. Int. Migr. Rev. 2017, 51, 3–36. [Google Scholar] [CrossRef]
- Angel, R.J.; Angel, J.L.; Hill, T.D. A Comparison of the Health of Older Hispanics in the United States and Mexico: Methodological Challenges. J. Aging Health 2008, 20, 3–31. [Google Scholar] [CrossRef]
- Antecol, H.; Bedard, K. Unhealthy Assimilation: Why Do Immigrants Converge to American Health Status Levels? Demography 2006, 43, 337–360. [Google Scholar] [CrossRef]
- Anzman-Frasca, S.; Economos, C.D.; Tovar, A.; Boulos, R.; Sliwa, S.; Gute, D.M.; Pirie, A.; Must, A. Depressive Symptoms and Weight Status Among Women Recently Immigrating to the US. Matern. Child Health J. 2016, 20, 1578–1585. [Google Scholar] [CrossRef] [PubMed]
- Boggess, B.; Bogue, H.O. The Health of U.S. Agricultural Worker Families: A Descriptive Study of over 790,000 Migratory and Seasonal Agricultural Workers and Dependents. J. Health Care Poor Underserved 2016, 27, 778–792. [Google Scholar] [CrossRef] [PubMed]
- Caspi, C.E.; Tucker-Seeley, R.D.; Adamkiewicz, G.; Roberto, C.A.; Stoddard, A.M.; Sorensen, G.C. Food Hardship and Obesity in a Sample of Low-Income Immigrants. J. Immigr. Minor. Health 2017, 19, 130–137. [Google Scholar] [CrossRef] [PubMed]
- Castañeda, S.F.; Rosenbaum, R.P.; Holscher, J.T.; Madanat, H.; Talavera, G.A. Cardiovascular Disease Risk Factors Among Latino Migrant and Seasonal Farmworkers. J. Agromed. 2015, 20, 95–104. [Google Scholar] [CrossRef]
- Chakraborty, B.M.; Mueller, W.H.; Reeves, R.; Poston, W.S.C.; Holscher, D.M.; Quill, B.; Hanis, C.L.; Foreyt, J.P. Migration History, Health Behaviors, and Cardiovascular Disease Risk Factors in Overweight Mexican-American Women. Ethn. Dis. 2003, 13, 94–108. [Google Scholar]
- Choi, J.Y. Prevalence of Overweight and Obesity Among USA Immigrants: Results of the 2003 New Immigrant Survey. J. Immigr. Minor. Health 2012, 14, 1112–1118. [Google Scholar] [CrossRef]
- Coffman, M.J.; Norton, C.K.; Beene, L. Diabetes Symptoms, Health Literacy, and Health Care Use in Adult Latinos with Diabetes Risk Factors. J. Cult. Divers. 2012, 19, 4–9. [Google Scholar]
- Davis, E.E.; Huffman, F.G. Differences in Coronary Heart Disease Risk Markers among Apparently Healthy Individuals of African Ancestry. J. Natl. Med. Assoc. 2007, 99, 658–664. [Google Scholar]
- Elfassy, T.; Mossavar-Rahmani, Y.; Van Horn, L.; Gellman, M.; Sotres-Alvarez, D.; Schneiderman, N.; Daviglus, M.; Beasley, J.M.; Llabre, M.M.; Shaw, P.A.; et al. Associations of Sodium and Potassium with Obesity Measures Among Diverse USA Hispanic/Latino Adults: Results from the Hispanic Community Health Study/Study of Latinos: Sodium, Potassium, and Obesity. Obesity 2018, 26, 442–450. [Google Scholar] [CrossRef]
- Gany, F.; Bari, S.; Gill, P.; Ramirez, J.; Ayash, C.; Loeb, R.; Aragones, A.; Leng, J. Step On It! Workplace Cardiovascular Risk Assessment of New York City Yellow Taxi Drivers. J. Immigr. Minor. Health 2016, 18, 118–134. [Google Scholar] [CrossRef]
- Gill, R.M.; Khan, S.A.; Jackson, R.T.; Duane, M. Prevalence of the Metabolic Syndrome in Central and South American Immigrant Residents of the Washington, DC, Area. J. Nutr. Metab. 2017, 2017, 9531964. [Google Scholar] [CrossRef] [PubMed]
- Giuntella, O.; Stella, L. The Acceleration of Immigrant Unhealthy Assimilation: Immigrant Obesity Assimilation. Health Econ. 2017, 26, 511–518. [Google Scholar] [CrossRef] [PubMed]
- Glick, J.E.; Yabiku, S.T. A Moving Paradox: A Binational View of Obesity and Residential Mobility. J. Immigr. Minor. Health 2015, 17, 489–497. [Google Scholar] [CrossRef]
- Iten, A.E.; Jacobs, E.A.; Lahiff, M.; Fernández, A. Undocumented Immigration Status and Diabetes Care Among Mexican Immigrants In Two Immigration “Sanctuary” Areas. J. Immigr. Minor. Health 2014, 16, 229–238. [Google Scholar] [CrossRef][Green Version]
- Jackson, C.L.; Hu, F.B.; Redline, S.; Williams, D.R.; Mattei, J.; Kawachi, I. Racial/Ethnic Disparities in Short Sleep Duration by Occupation: The Contribution of Immigrant Status. Soc. Sci. Med. 2014, 118, 71–79. [Google Scholar] [CrossRef]
- Jaranilla, J.; DeFor, T.; Vazquez Benitez, G.; Kottke, T.E. Lipid Abnormalities in Foreign-Born and US-Born Patients in a Medical Group. J. Clin. Lipidol. 2014, 8, 77–85. [Google Scholar] [CrossRef] [PubMed]
- Jerome-D’Emilia, B.; Dunphy Suplee, P.; Gardner, M.R. Understanding Access to Care and Health Needs of Hispanic Women From an Urban Community. Hisp. Health Care Int. 2014, 12, 71–80. [Google Scholar] [CrossRef] [PubMed]
- Klabunde, R.A.; Neto, F.L.; Louzada, A.; de Moura, R.F.; Calixto, F.M.; Danaei, G.; Castro, M.C. Prevalence and Predictors of Overweight and Obesity in Brazilian Immigrants in Massachusetts. BMC Public Health 2020, 20, 42. [Google Scholar] [CrossRef]
- LeBrón, A.M.W.; Schulz, A.J.; Mentz, G.; Reyes, A.G.; Gamboa, C.; Israel, B.A.; Viruell-Fuentes, E.A.; House, J.S. Impact of Change over Time in Self-Reported Discrimination on Blood Pressure: Implications for Inequities in Cardiovascular Risk for a Multi-Racial Urban Community. Ethn. Health 2020, 25, 323–341. [Google Scholar] [CrossRef]
- Li, K.; Wen, M.; Henry, K.A. Ethnic Density, Immigrant Enclaves, and Latino Health Risks: A Propensity Score Matching Approach. Soc. Sci. Med. 2017, 189, 44–52. [Google Scholar] [CrossRef]
- López, L.; Swett, K.; Rodriguez, F.; Kizer, J.R.; Penedo, F.; Gallo, L.; Allison, M.; Arguelles, W.; Gonzalez, F.; Kaplan, R.C.; et al. Association of Acculturation with Cardiac Structure and Function among Hispanics/Latinos: A Cross-Sectional Analysis of the Echocardiographic Study of Latinos. BMJ Open 2019, 9, e028729. [Google Scholar] [CrossRef] [PubMed]
- Martínez, A.D.; Juon, H.; Levine, D.M.; Lyford-Pike, V.; Peters, S. The Association between Nutrition Transition Score and Measures of Obesity: Results from a Cross-Sectional Study among Latina/o Immigrants in Baltimore. Glob. Health 2014, 10, 57. [Google Scholar] [CrossRef] [PubMed]
- McClure, H.H.; Snodgrass, J.J.; Martinez, C.R.; Eddy, J.M.; Jiménez, R.A.; Isiordia, L.E. Discrimination, Psychosocial Stress, and Health among Latin American Immigrants in Oregon. Am. J. Hum. Biol. 2010, 22, 421–423. [Google Scholar] [CrossRef]
- Narang, B.; Mirpuri, S.; Kim, S.Y.; Jutagir, D.R.; Gany, F. Lurking in Plain Sight: Hypertension Awareness and Treatment among New York City Taxi/For-hire Vehicle Drivers. J. Clin. Hypertens. 2020, 22, 962–969. [Google Scholar] [CrossRef]
- Rodriguez, F.; Hicks, L.S.; López, L. Association of Acculturation and Country of Origin with Self-Reported Hypertension and Diabetes in a Heterogeneous Hispanic Population. BMC Public Health 2012, 12, 768. [Google Scholar] [CrossRef] [PubMed]
- Ryan, A.M.; Gee, G.C.; Laflamme, D.F. The Association between Self-Reported Discrimination, Physical Health and Blood Pressure: Findings from African Americans, Black Immigrants, and Latino Immigrants in New Hampshire. J. Health Care Poor Underserved 2006, 17, 116–132. [Google Scholar] [CrossRef]
- Saint-Jean, G.; Crandall, L.A. Utilization of Preventive Care by Haitian Immigrants in Miami, Florida. J. Immigr. Minor. Health 2005, 7, 283–292. [Google Scholar] [CrossRef]
- Shelley, D.; Tseng, T.-Y.; Andrews, H.; Ravenell, J.; Wu, D.; Ferrari, P.; Cohen, A.; Millery, M.; Kopal, H. Predictors of Blood Pressure Control Among Hypertensives in Community Health Centers. Am. J. Hypertens. 2011, 24, 1318–1323. [Google Scholar] [CrossRef][Green Version]
- Shi, L.; Zhang, D.; van Meijgaard, J.; MacLeod, K.E.; Fielding, J.E. The Interaction Between an Individual’s Acculturation and Community Factors on Physical Inactivity and Obesity: A Multilevel Analysis. Am. J. Public Health 2015, 105, 1460–1467. [Google Scholar] [CrossRef]
- Singh-Franco, D.; Perez, A.; Wolowich, W.R. Improvement in Surrogate Endpoints by a Multidisciplinary Team in a Mobile Clinic Serving a Low-Income, Immigrant Minority Population in South Florida. J. Health Care Poor Underserved 2013, 24, 67–77. [Google Scholar] [CrossRef]
- Tehranifar, P.; Protacio, A.; Schmitt, K.M.; Desperito, E.; Oskar, S.; Potter, A.J.; Engmann, N.J.; Terry, M.B. The Metabolic Syndrome and Mammographic Breast Density in a Racially Diverse and Predominantly Immigrant Sample of Women. Cancer Causes Control 2015, 26, 1393–1403. [Google Scholar] [CrossRef] [PubMed]
- Villarejo, D.; McCurdy, S.A.; Bade, B.; Samuels, S.; Lighthall, D.; Williams, D. The Health of California’s Immigrant Hired Farmworkers. Am. J. Ind. Med. 2010, 53, 387–397. [Google Scholar] [CrossRef] [PubMed]
- Viruell-Fuentes, E.A.; Ponce, N.A.; Alegría, M. Neighborhood Context and Hypertension Outcomes Among Latinos in Chicago. J. Immigr. Minor. Health 2012, 14, 959–967. [Google Scholar] [CrossRef] [PubMed]
- Wassink, J.; Perreira, K.M.; Harris, K.M. Beyond Race/Ethnicity: Skin Color and Cardiometabolic Health Among Blacks and Hispanics in the United States. J. Immigr. Minor. Health 2017, 19, 1018–1026. [Google Scholar] [CrossRef] [PubMed]
- Weigel, M.M.; Armijos, R.X. Food Insecurity, Cardiometabolic Health, and Health Care in U.S.-Mexico Border Immigrant Adults: An Exploratory Study. J. Immigr. Minor. Health 2019, 21, 1085–1094. [Google Scholar] [CrossRef]
- Weigel, M.M.; Armijos, R.X.; Hall, Y.P.; Ramirez, Y.; Orozco, R. The Household Food Insecurity and Health Outcomes of U.S.–Mexico Border Migrant and Seasonal Farmworkers. J. Immigr. Minor. Health 2007, 9, 157–169. [Google Scholar] [CrossRef]
- Wolin, K.Y.; Colangelo, L.A.; Chiu, B.C.-H.; Gapstur, S.M. Obesity and Immigration among Latina Women. J. Immigr. Minor. Health 2009, 11, 428–431. [Google Scholar] [CrossRef]
- Dawson, A.Z.; Walker, R.J.; Gregory, C.; Egede, L.E. Relationship between Social Determinants of Health and Systolic Blood Pressure in United States Immigrants. Int. J. Cardiol. Hypertens. 2019, 2, 100011. [Google Scholar] [CrossRef]
- Cohn, T.; Miller, A.; Fogg, L.; Braun, L.T.; Coke, L. Impact of Individual and Neighborhood Factors on Cardiovascular Risk in White Hispanic and Non-Hispanic Women and Men: Ethnicity and Individual and Neighborhood Cardiovascular Risk. Res. Nurs. Health 2017, 40, 120–131. [Google Scholar] [CrossRef]
- Del Brutto, O.H.; Dong, C.; Rundek, T.; Elkind, M.S.V.; Del Brutto, V.J.; Sacco, R.L. Cardiovascular Health Status Among Caribbean Hispanics Living in Northern Manhattan and Ecuadorian Natives/Mestizos in Rural Coastal Ecuador: A Comparative Study. J. Community Health 2013, 38, 634–641. [Google Scholar] [CrossRef]
- López-Cevallos, D.F.; Escutia, G.; González-Peña, Y.; Garside, L.I. Cardiovascular Disease Risk Factors among Latino Farmworkers in Oregon. Ann. Epidemiol. 2019, 40, 8–12.e1. [Google Scholar] [CrossRef] [PubMed]
- Pickering, R.P.; Grant, B.F.; Chou, S.P.; Compton, W.M. Are Overweight, Obesity, and Extreme Obesity Associated With Psychopathology?: Results From the National Epidemiologic Survey on Alcohol and Related Conditions. J. Clin. Psychiatry 2007, 68, 998–1009. [Google Scholar] [CrossRef] [PubMed]
- Rodriguez, C.B.; Wei, Y.; Terry, M.B.; Wyka, K.; Athilat, S.; Albrecht, S.S.; Tehranifar, P. Associations of Nativity, Age at Migration, and Percent of Life in the U.S. with Midlife Body Mass Index and Waist Size in New York City Latinas. Int. J. Environ. Res. Public Health 2020, 17, 2436. [Google Scholar] [CrossRef] [PubMed]
- Slattery, M.L.; Sweeney, C.; Edwards, S.; Herrick, J.; Murtaugh, M.; Baumgartner, K.; Guiliano, A.; Byers, T. Physical Activity Patterns and Obesity in Hispanic and Non-Hispanic White Women. Med. Sci. Sport. Exerc. 2006, 38, 33–41. [Google Scholar] [CrossRef] [PubMed]
- Torres, J.M.; Deardorff, J.; Gunier, R.B.; Harley, K.G.; Alkon, A.; Kogut, K.; Eskenazi, B. Worry About Deportation and Cardiovascular Disease Risk Factors Among Adult Women: The Center for the Health Assessment of Mothers and Children of Salinas Study. Ann. Behav. Med. 2018, 52, 186–193. [Google Scholar] [CrossRef]
- de Heer, H.D.; Salinas, J.; Lapeyrouse, L.M.; Heyman, J.; Morera, O.F.; Balcazar, H.G. Binational Utilization and Barriers to Care among Mexican American Border Residents with Diabetes. Rev. Panam. Salud Pública 2013, 34, 147–154. [Google Scholar] [PubMed]
- Vega Briones, G. Problemas actuales de sobrepeso entre los migrantes mexicanos. Migr. Int. 2016, 8, 201–230. [Google Scholar]
- Nelson, T.; Perez, A.; Alcaraz, J.; Talavera, G.; McCarthy, J.J. Family History of Diabetes, Acculturation, and the Metabolic Syndrome among Mexican Americans: Proyecto SALSA. Metab. Syndr. Relat. Disord. 2007, 5, 262–269. [Google Scholar] [CrossRef]
- Vaeth, P.A.C.; Willett, D.L. Level of Acculturation and Hypertension among Dallas County Hispanics: Findings from the Dallas Heart Study. Ann. Epidemiol. 2005, 15, 373–380. [Google Scholar] [CrossRef]
- Chrisman, M.; Chow, W.-H.; Daniel, C.R.; Wu, X.; Zhao, H. Associations between Language Acculturation, Age of Immigration, and Obesity in the Mexican American Mano A Mano Cohort. Obes. Res. Clin. Pract. 2017, 11, 544–557. [Google Scholar] [CrossRef]
- López, L.; Grant, R.W.; Marceau, L.; Piccolo, R.; McKinlay, J.B.; Meigs, J.B. Association of Acculturation and Health Literacy with Prevalent Dysglycemia and Diabetes Control Among Latinos in the Boston Area Community Health (BACH) Survey. J. Immigr. Minor. Health 2016, 18, 1266–1273. [Google Scholar] [CrossRef] [PubMed]
- Salinas, J.J.; Abdelbary, B.; Rentfro, A.; Fisher-Hoch, S.; McCormick, J. Cardiovascular Disease Risk Among the Mexican American Population in the Texas-Mexico Border Region, by Age and Length of Residence in United States. Prev. Chronic Dis. 2014, 11, 130253. [Google Scholar] [CrossRef] [PubMed]
- Back, E.E.; Bachwani, A.S.; Strogatz, D.S.; Sherman, Z.M.V. Profile of Diabetes Mellitus among Immigrants from Guyana: Epidemiology and Implications for Community Action. Ethn. Dis. 2012, 22, 473–478. [Google Scholar] [PubMed]
- US Census Bureau. ACS 5-Year Estimates Public Use Microdata Sample. Available online: https://data.census.gov/mdat/#/search?ds=ACSPUMS5Y2019&cv=ANC1P(360)&rv=ucgid&wt=PWGTP&g=0400000US05,06,08,09,10,11,12,13,15,16,17,18,19,20,21,22,23,24,25,26,27,28,29,30,31,32,33,34,35,36,37,38,39,40,41,42,44,45,46,47,48,49,50,51,53,54,55,56 (accessed on 22 August 2022).
- Rowland, M.L. Self-Reported Weight and Height. Am. J. Clin. Nutr. 1990, 52, 1125–1133. [Google Scholar] [CrossRef] [PubMed]
- Stone, J.; Gurunathan, U.; Glass, K.; Munn, Z.; Tugwell, P.; Doi, S.A.R. Stratification by Quality Induced Selection Bias in a Meta-Analysis of Clinical Trials. J. Clin. Epidemiol. 2019, 107, 51–59. [Google Scholar] [CrossRef] [PubMed]


Disclaimer/Publisher’s Note: The statements, opinions and data contained in all publications are solely those of the individual author(s) and contributor(s) and not of MDPI and/or the editor(s). MDPI and/or the editor(s) disclaim responsibility for any injury to people or property resulting from any ideas, methods, instructions or products referred to in the content. |
© 2023 by the authors. Licensee MDPI, Basel, Switzerland. This article is an open access article distributed under the terms and conditions of the Creative Commons Attribution (CC BY) license (https://creativecommons.org/licenses/by/4.0/).