


Longitudinal Analysis of Social Isolation and Cognitive Functioning among Hispanic Older Adults with Sensory Impairments

 ,
,
Abstract
1. Introduction
2. Methods
2.1. Measures
2.1.1. Cognitive Functioning
2.1.2. Sensory Impairment
2.1.3. Social Isolation
2.1.4. Covariates
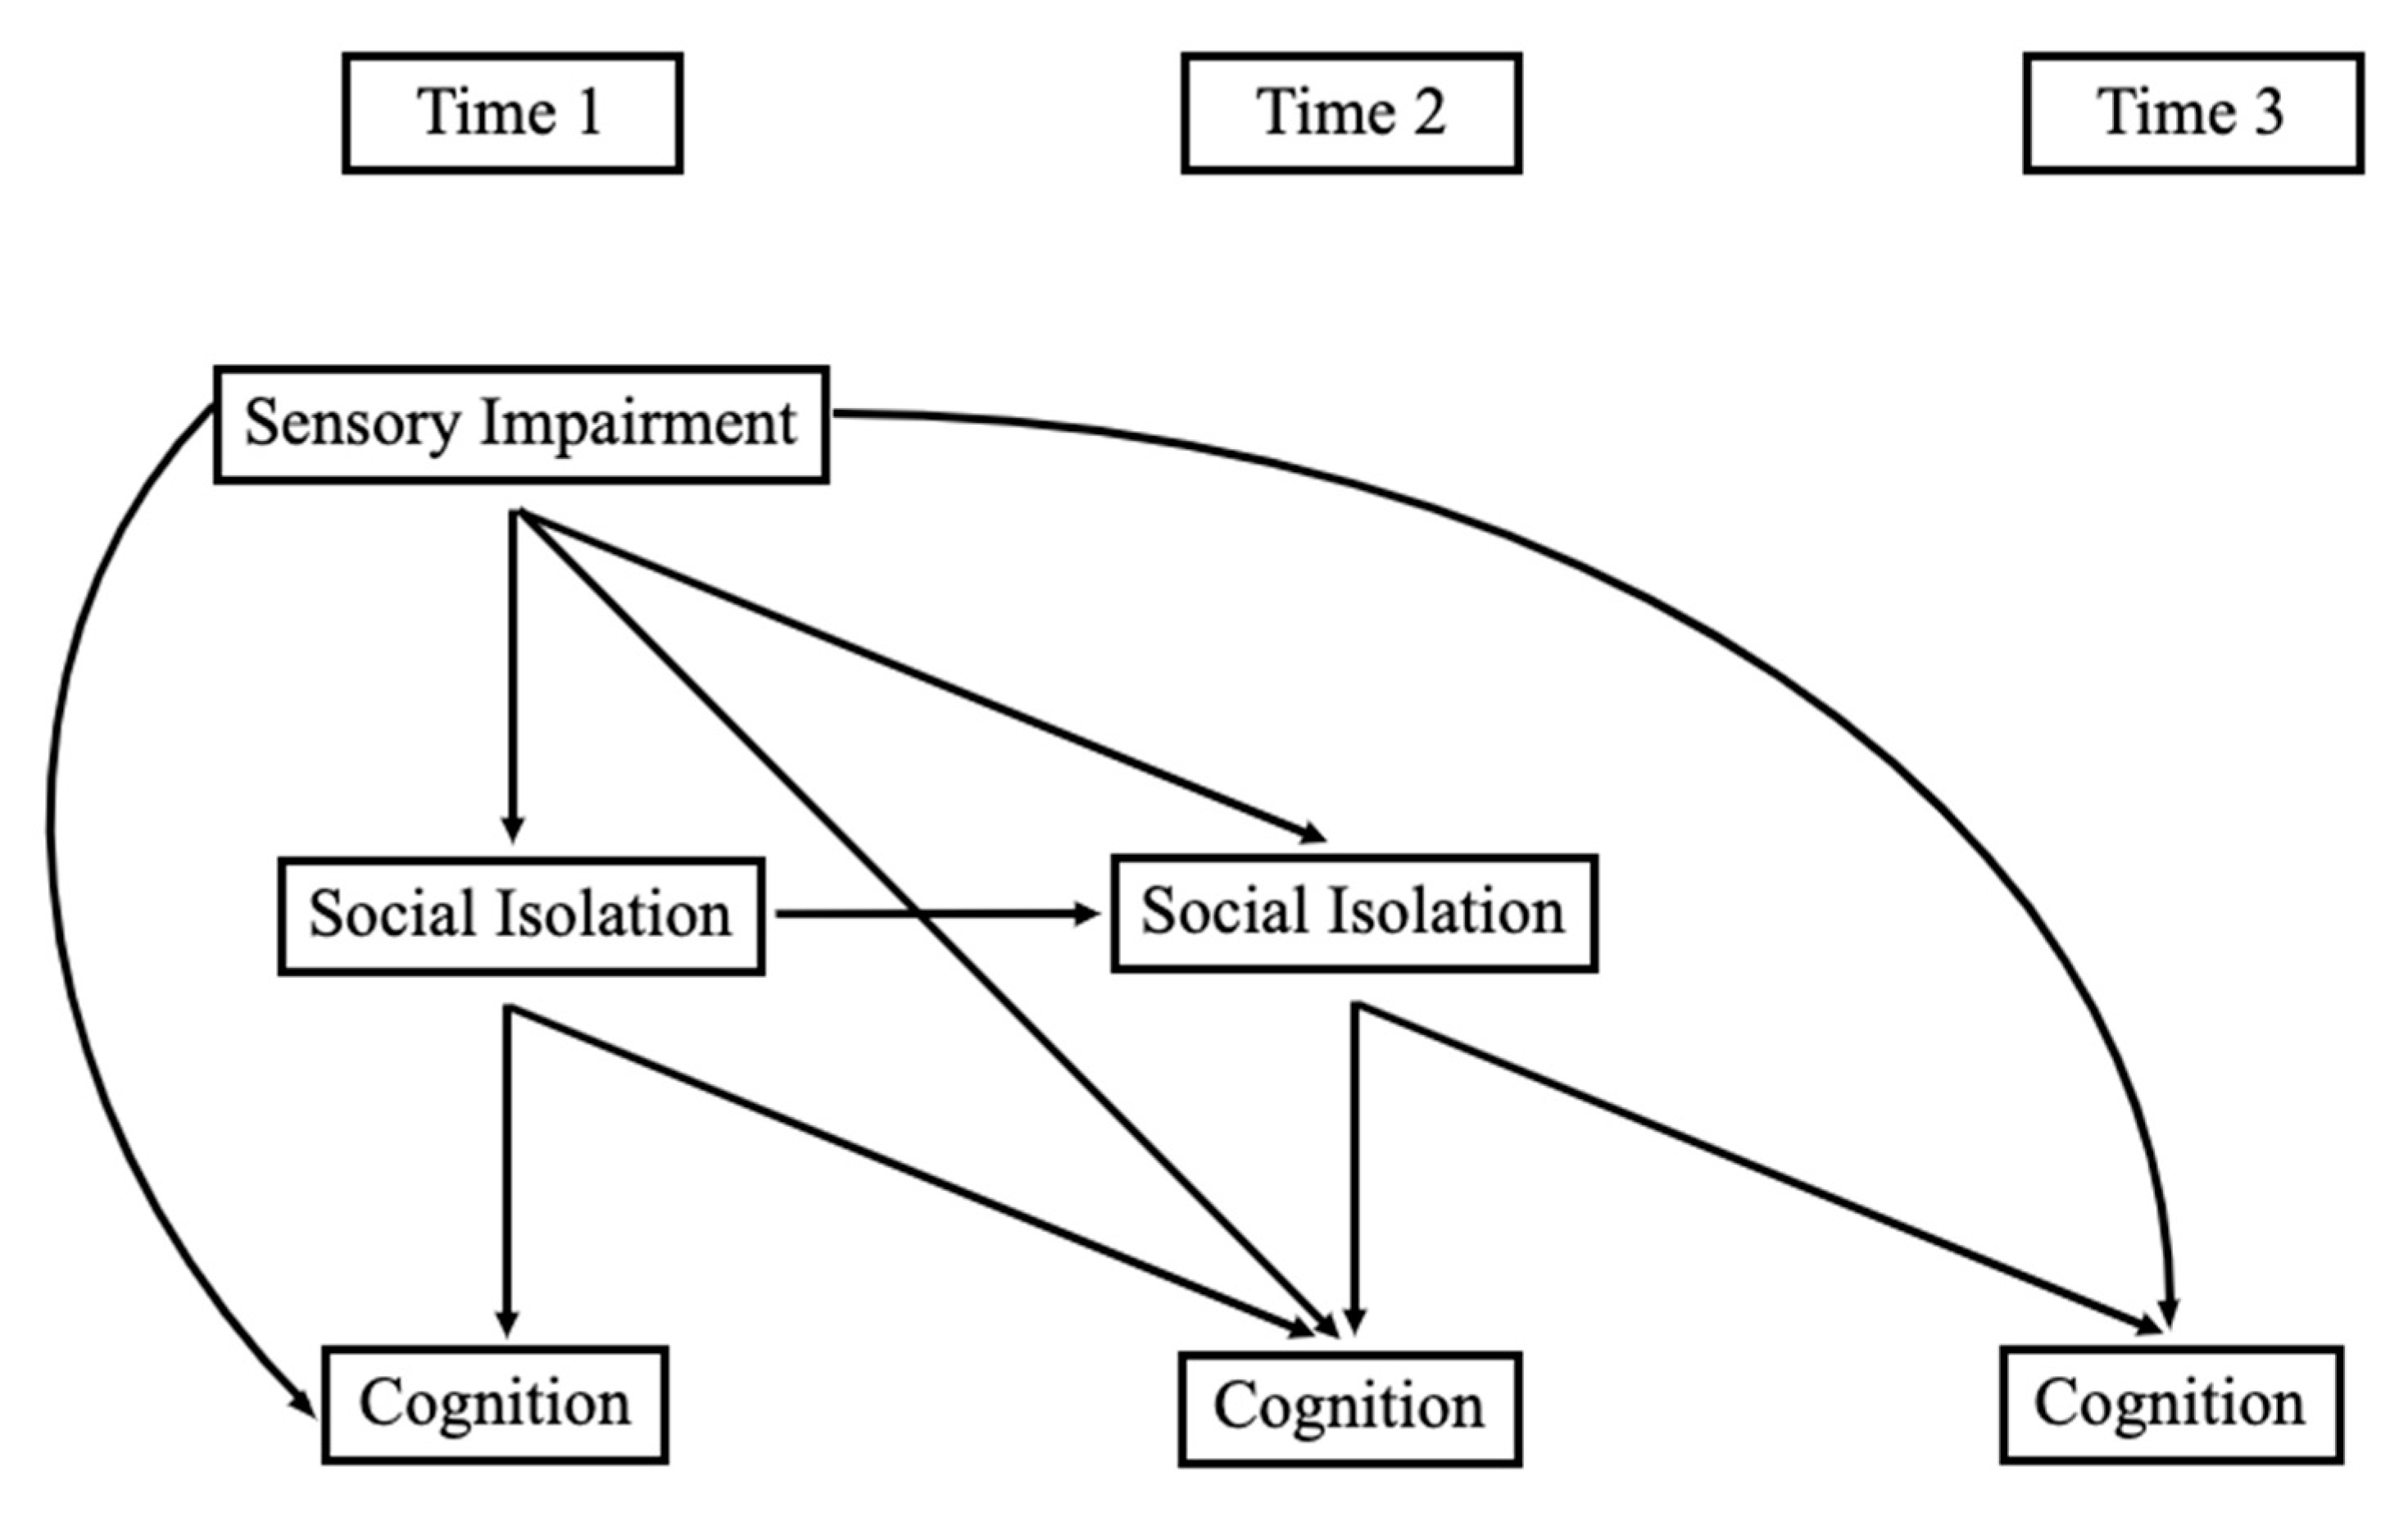
2.2. Analysis
3. Results
3.1. Preliminary Analyses
3.2. Direct Associations
- How do sensory impairments relate to social isolation concurrently and across time? Contrary to our expectations, neither VI nor HI were significantly associated with social isolation concurrently or across time. Unlike VI and HI alone, DSI was associated with higher social isolation one year later in both Model 1 (β = 0.079, p < 0.05) and Model 2 (β = 0.086, p < 0.05).
- How do sensory impairments relate to cognitive functioning across time among Hispanic older adults? As seen in Model 1 of Table 3, VI was negatively associated with concurrent orientation (β = −0.111, p < 0.01) and executive function scores (β = −0.109, p < 0.05), as well as with learning/memory (β = −0.124, p < 0.05) and executive function (β = −0.103, p < 0.01) one year later. VI was also associated with lower executive function scores one year later when covariates were added in Model 2 (β = −0.079, p < 0.05). HI was not associated with measures of cognitive functioning in this sample. As seen in Table 4, DSI was negatively associated with orientation scores concurrently in Model 1 (β = −0.094, p < 0.05) and with learning/memory across one year in Model 1 (β = −0.143, p < 0.01) and Model 2 (β = −0.091, p < 0.05).
- 3.
- What is the relationship between social isolation and cognitive functioning among Hispanic older adults? As displayed in Table 3, social isolation was negatively associated with concurrent orientation in Model 2 (β = −0.091, p < 0.05) and executive function in Model 1 (β = −0.099, p < 0.05) and Model 2 (β = −0.113, p < 0.05). Social isolation was also related to lower learning/memory across one year in Model 1 (β = −0.084, p < 0.05) and Model 2 (β = −0.111, p < 0.01).
3.3. Indirect Associations
- 4.
- Are sensory impairments related indirectly to cognitive functioning through social isolation? There were no significant indirect associations between VI, HI, or DSI and cognitive functioning through social isolation.
4. Discussion
4.1. Summary of Findings
4.2. Strengths and Limitations
4.3. Future Directions
5. Conclusions
Author Contributions
Funding
Institutional Review Board Statement
Informed Consent Statement
Data Availability Statement
Acknowledgments
Conflicts of Interest
References
- Noe-Bustamante, L.; Lopez, M.H.; Krogstad, J.M.U.S. Hispanic Population Surpassed 60 Million in 2019, But Growth Has Slowed. Pew Research Center. Available online: https://www.pewresearch.org/fact-tank/2020/07/07/u-s-hispanic-population-surpassed-60-million-in-2019-but-growth-has-slowed/ (accessed on 3 July 2023).
- US Census, B. Hispanic Population to Reach 111 Million by 2060. Available online: https://www.census.gov/library/visualizations/2018/comm/hispanic-projected-pop.html#:~:text=Hispanic%20Population%20to%20Reach%20111%20Million%20by%202060 (accessed on 3 July 2023).
- Patel, N.; Stagg, B.C.; Swenor, B.K.; Zhou, Y.; Talwar, N.; Ehrlich, J. Association of Co-occurring Dementia and Self-reported Visual Impairment with Activity Limitations in Older Adults. JAMA Ophthalmol. 2020, 138, 756–763. [Google Scholar] [CrossRef] [PubMed]
- Campos, C.L.; Rodriguez, C.J. High blood pressure in Hispanics in the United States. Curr. Opin. Cardiol. 2019, 34, 350–358. [Google Scholar] [CrossRef] [PubMed]
- Cheng, Y.J.; Kanaya, A.M.; Araneta, M.R.G.; Saydah, S.H.; Kahn, H.S.; Gregg, E.W.; Fujimoto, W.Y.; Imperatore, G. Prevalence of Diabetes by Race and Ethnicity in the United States, 2011–2016. JAMA 2019, 322, 2389–2398. [Google Scholar] [CrossRef] [PubMed]
- Nathan, N.; Joos, K.M. Glaucoma Disparities in the Hispanic Population. Semin. Ophthalmol. 2016, 31, 394–399. [Google Scholar] [CrossRef]
- Herren, D.J.; Kohanim, S. Disparities in Vision Loss Due to Cataracts in Hispanic Women in the United States. Semin. Ophthalmol. 2016, 31, 353–357. [Google Scholar] [CrossRef]
- Brown, M.M. Prevalence of open-angle glaucoma and ocular hypertension in latinos: The los angeles latino eye study. Evid.-Based Eye Care 2005, 6, 14–15. [Google Scholar] [CrossRef]
- Varma, R. The Los Angeles Latino Eye Study*1design, methods, and baseline data. Ophthalmology 2004, 111, 1121–1131. [Google Scholar] [CrossRef]
- Uribe, J.A.; Swenor, B.K.; Muñoz, B.E.; West, S.K. Uncorrected Refractive Error in a Latino Population: Proyecto VER. Ophthalmology 2011, 118, 805–811. [Google Scholar] [CrossRef]
- Goman, A.M.; Lin, F.R. Prevalence of Hearing Loss by Severity in the United States. Am. J. Public Health 2016, 106, 1820–1822. [Google Scholar] [CrossRef]
- Cruickshanks, K.J.; Dhar, S.; Dinces, E.; Fifer, R.C.; Gonzalez, F.; Heiss, G.; Hoffman, H.J.; Lee, D.J.; Newhoff, M.; Tocci, L.; et al. Hearing Impairment Prevalence and Associated Risk Factors in the Hispanic Community Health Study/Study of Latinos. JAMA Otolaryngol. Neck Surg. 2015, 141, 641–648. [Google Scholar] [CrossRef]
- West, J.S.; Lynch, S.M. Demographic and Socioeconomic Disparities in Life Expectancy with Hearing Impairment in the United States. J. Gerontol. Ser. B 2020, 76, 944–955. [Google Scholar] [CrossRef]
- Arnold, M.L.; Hyer, K.; Small, B.J.; Chisolm, T.; Saunders, G.H.; McEvoy, C.L.; Lee, D.J.; Dhar, S.; Bainbridge, K.E. Hearing Aid Prevalence and Factors Related to Use Among Older Adults from the Hispanic Community Health Study/Study of Latinos. JAMA Otolaryngol. Neck Surg. 2019, 145, 501–508. [Google Scholar] [CrossRef]
- Swenor, B.K.; Ramulu, P.Y.; Willis, J.R.; Friedman, D.; Lin, F.R. Research letters: The Prevalence of Concurrent Hearing and Vision Impairment in the United States. JAMA Intern. Med. 2013, 173, 312–313. [Google Scholar] [CrossRef]
- Kuo, P.-L.; Huang, A.R.; Ehrlich, J.R.; Kasper, J.; Lin, F.R.; McKee, M.M.; Reed, N.S.; Swenor, B.K.; Deal, J.A. Prevalence of Concurrent Functional Vision and Hearing Impairment and Association with Dementia in Community-Dwelling Medicare Beneficiaries. JAMA Netw. Open 2021, 4, e211558. [Google Scholar] [CrossRef]
- Davidson, J.G.S.; Guthrie, D.M. Older Adults with a Combination of Vision and Hearing Impairment Experience Higher Rates of Cognitive Impairment, Functional Dependence, and Worse Outcomes Across a Set of Quality Indicators. J. Aging Health 2017, 31, 85–108. [Google Scholar] [CrossRef]
- Liu, Y.; Sun, Q.; Abuduxukuer, K.; Hou, Y.; Wei, J.; Liu, H.; Luo, J.; Gao, G.; Zhou, Y. Is there a correlation between sensory impairments and social isolation in middle-aged and older Chinese population? Cross-sectional and longitudinal evidence from a nationally representative survey. Front. Public Health 2023, 11, 1098109. [Google Scholar] [CrossRef]
- Livingston, G.; Huntley, J.; Sommerlad, A.; Ames, D.; Ballard, C.; Banerjee, S.; Brayne, C.; Burns, A.; Cohen-Mansfield, J.; Cooper, C.; et al. Dementia prevention, intervention, and care: 2020 report of the Lancet Commission. Lancet 2020, 396, 413–446. [Google Scholar] [CrossRef]
- Lin, F.R.; Albert, M. Hearing loss and dementia—Who is listening? Aging Ment. Health 2014, 18, 671–673. [Google Scholar] [CrossRef]
- Whitson, H.E.; Cronin-Golomb, A.; Cruickshanks, K.J.; Gilmore, G.C.; Owsley, C.; Peelle, J.E.; Recanzone, G.; Sharma, A.; Swenor, B.; Yaffe, K.; et al. American Geriatrics Society and National Institute on Aging Bench-to-Bedside Conference: Sensory Impairment and Cognitive Decline in Older Adults. J. Am. Geriatr. Soc. 2018, 66, 2052–2058. [Google Scholar] [CrossRef]
- Nagarajan, N.; Assi, L.; Varadaraj, V.; Motaghi, M.; Sun, Y.; Couser, E.; Ehrlich, J.R.; Whitson, H.; Swenor, B.K. Vision impairment and cognitive decline among older adults: A systematic review. BMJ Open 2022, 12, e047929. [Google Scholar] [CrossRef]
- Shah, K.; Frank, C.R.; Ehrlich, J.R. The association between vision impairment and social participation in community-dwelling adults: A systematic review. Eye 2020, 34, 290–298. [Google Scholar] [CrossRef] [PubMed]
- Shukla, A.; Harper, M.; Pedersen, E.; Goman, A.; Suen, J.J.; Price, C.; Applebaum, J.; Hoyer, M.; Lin, F.R.; Reed, N.S. Hearing Loss, Loneliness, and Social Isolation: A Systematic Review. Otolaryngol. Neck Surg. 2020, 162, 622–633. [Google Scholar] [CrossRef]
- Delardas, O.; Giannos, P. Cognitive Performance Deficits Are Associated with Clinically Significant Depression Symptoms in Older US Adults. Int. J. Environ. Res. Public Health 2023, 20, 5290. [Google Scholar] [CrossRef] [PubMed]
- Santini, Z.I.; Jose, P.E.; Cornwell, E.Y.; Koyanagi, A.; Nielsen, L.; Hinrichsen, C.; Meilstrup, C.; Madsen, K.R.; Koushede, V. Social disconnectedness, perceived isolation, and symptoms of depression and anxiety among older Americans (NSHAP): A longitudinal mediation analysis. Lancet Public Health 2020, 5, e62–e70. [Google Scholar] [CrossRef]
- Yorgason, J.B.; Tanner, C.T.; Richardson, S.; Hill, M.M.S.; Stagg, B.; Wettstein, M.; Ehrlich, J.R. The Longitudinal Association of Late-Life Visual and Hearing Difficulty and Cognitive Function: The Role of Social Isolation. J. Aging Health 2022, 34, 765–774. [Google Scholar] [CrossRef]
- Cohn, D.; Passel, J.S. A Record 64 Million Americans Live in Multigenerational Households. Available online: https://www.pewresearch.org/fact-tank/2018/04/05/a-record-64-million-americans-live-inmultigenerational-households/ (accessed on 3 July 2023).
- Hernández, M.M.; Bámaca-Colbert, M.Y. A Behavioral Process Model of Familism. J. Fam. Theory Rev. 2016, 8, 463–483. [Google Scholar] [CrossRef]
- Schwartz, S.J.; Weisskirch, R.S.; Hurley, E.A.; Zamboanga, B.L.; Park, I.J.K.; Kim, S.Y.; Umaña-Taylor, A.; Castillo, L.G.; Brown, E.; Greene, A.D. Communalism, familism, and filial piety: Are they birds of a collectivist feather? Cult. Divers. Ethn. Minor. Psychol. 2010, 16, 548–560. [Google Scholar] [CrossRef]
- Min, J.W.; Barrio, C. Cultural Values and Caregiver Preference for Mexican-American and Non-Latino White Elders. J. Cross-Cult. Gerontol. 2009, 24, 225–239. [Google Scholar] [CrossRef][Green Version]
- Tanner, C.T.; Yorgason, J.B.; Richardson, S.; Redelfs, A.H.; Hill, M.M.Y.S.; White, A.; Stagg, B.; Ehrlich, J.R.; Markides, K.S. Social isolation among Hispanic older adults with sensory impairments: Toward culturally sensitive measurement. J. Gerontol. Ser. B 2022, 77, 2091–2100. [Google Scholar] [CrossRef]
- Campos, B.; Ullman, J.B.; Aguilera, A.; Schetter, C.D. Familism and psychological health: The intervening role of closeness and social support. Cult. Divers. Ethn. Minor. Psychol. 2014, 20, 191–201. [Google Scholar] [CrossRef]
- Locher, J.L.; Ritchie, C.S.; Roth, D.L.; Baker, P.S.; Bodner, E.V.; Allman, R.M. Social isolation, support, and capital and nutritional risk in an older sample: Ethnic and gender differences. Soc. Sci. Med. 2005, 60, 747–761. [Google Scholar] [CrossRef]
- Markides, K.S.; Eschbach, K. Aging, Migration, and Mortality: Current Status of Research on the Hispanic Paradox. J. Gerontol. Ser. B 2005, 60, S68–S75. [Google Scholar] [CrossRef]
- Gallegos, M.L.; Segrin, C. Family Connections and the Latino Health Paradox: Exploring the Mediating Role of Loneliness in the Relationships Between the Latina/o Cultural Value of Familism and Health. Health Commun. 2021, 37, 1204–1214. [Google Scholar] [CrossRef]
- Bustamante, A.V.; Fang, H.; Rizzo, J.A.; Ortega, A.N. Understanding Observed and Unobserved Health Care Access and Utilization Disparities Among U.S. Latino Adults. Med. Care Res. Rev. 2009, 66, 561–577. [Google Scholar] [CrossRef]
- Vega, W.A.; Rodriguez, M.A.; Gruskin, E. Health Disparities in the Latino Population. Epidemiol. Rev. 2009, 31, 99–112. [Google Scholar] [CrossRef]
- Rajan, K.B.; Weuve, J.; Barnes, L.L.; McAninch, E.A.; Wilson, R.S.; Evans, D.A. Population estimate of people with clinical Alzheimer's disease and mild cognitive impairment in the United States (2020–2060). Alzheimer's Dement. 2021, 17, 1966–1975. [Google Scholar] [CrossRef]
- Samper-Ternent, R.; Kuo, Y.F.; Ray, L.A.; Ottenbacher, K.J.; Markides, K.S.; Al Snih, S. Prevalence of Health Conditions and Predictors of Mortality in Oldest Old Mexican Americans and Non-Hispanic Whites. J. Am. Med. Dir. Assoc. 2012, 13, 254–259. [Google Scholar] [CrossRef]
- Chin, A.L.B.; Negash, S.; Hamilton, R. Diversity and Disparity in Dementia: The impact of ethnoracial differences in Alzheimer disease. Alzheimer Dis. Assoc. Disord. 2011, 25, 187–195. [Google Scholar] [CrossRef]
- Kasper, J.D.; Freedman, V.A.; Spillman, B.C. Classification of Persons by Dementia Status in the National Health and Aging Trends Study. 2013. Technical Paper #5. Available online: https://www.nhats.org/sites/default/files/inline-files/DementiaTechnicalPaperJuly_2_4_2013_10_23_15.pdf (accessed on 28 May 2023).
- Xiang, X.; Freedman, V.A.; Shah, K.; Hu, R.X.; Stagg, B.; Ehrlich, J.R. Self-reported Vision Impairment and Subjective Well-being in Older Adults: A Longitudinal Mediation Analysis. J. Gerontol. Ser. A 2019, 75, 589–595. [Google Scholar] [CrossRef]
- Darin-Mattsson, A.; Fors, S.; Kåreholt, I. Different indicators of socioeconomic status and their relative importance as determinants of health in old age. Int. J. Equity Health 2017, 16, 173. [Google Scholar] [CrossRef]
- Heyl, V.; Wahl, H.-W. Experiencing age-related vision and hearing impairment: The psychosocial dimension. J. Clin. Outcomes Manag. 2014, 21, 323–335. [Google Scholar]
- Fuller-Iglesias, H.R.; Antonucci, T.C. Familism, Social Network Characteristics, and Well-being among Older Adults in Mexico. J. Cross-Cult. Gerontol. 2016, 31, 1–17. [Google Scholar] [CrossRef]
- Corona, K.; Campos, B.; Chen, C. Familism Is Associated with Psychological Well-Being and Physical Health. Hisp. J. Behav. Sci. 2016, 39, 46–65. [Google Scholar] [CrossRef]
- Wang, Q.; Zhang, S.; Wang, Y.; Zhao, D.; Zhou, C. Dual Sensory Impairment as a Predictor of Loneliness and Isolation in Older Adults: National Cohort Study. JMIR Public Health Surveill. 2022, 8, e39314. [Google Scholar] [CrossRef] [PubMed]
- Ehrlich, J.R.; Goldstein, J.; Swenor, B.K.; Whitson, H.; Langa, K.M.; Veliz, P. Addition of Vision Impairment to a Life-Course Model of Potentially Modifiable Dementia Risk Factors in the US. JAMA Neurol. 2022, 79, 623–626. [Google Scholar] [CrossRef]
- Cao, G.-Y.; Chen, Z.-S.; Yao, S.-S.; Wang, K.; Huang, Z.-T.; Su, H.-X.; Luo, Y.; De Fries, C.M.; Hu, Y.-H.; Xu, B. The association between vision impairment and cognitive outcomes in older adults: A systematic review and meta-analysis. Aging Ment. Health 2022, 27, 350–356. [Google Scholar] [CrossRef]
- Spielman, B. Encyclopedia of Applied Ethics, 2nd ed.; Elsevier Inc.: Amsterdam, The Netherlands, 2012. [Google Scholar]
- Li, Y.; Guo, M. Filial piety matters: A study of intergenerational supports and parental health. SSM-Popul. Health 2022, 18, 101096. [Google Scholar] [CrossRef]
- Antonucci, T.C.; Akiyama, H. Convoys of Social Relations: Family and Friendships within a Life Span Context; Greenwood Publishing Group: Westport, CT, USA, 1995; pp. 355–371. [Google Scholar]
- Ying, G.; Vonk, J.M.J.; Sol, K.; Brickman, A.M.; Manly, J.J.; Zahodne, L.B. Family Ties and Aging in a Multiethnic Cohort. J. Aging Health 2020, 32, 1464–1474. [Google Scholar] [CrossRef]
- Gallo, L.C.; Penedo, F.J.; Monteros, K.E.d.L.; Arguelles, W. Resiliency in the Face of Disadvantage: Do Hispanic Cultural Characteristics Protect Health Outcomes? J. Pers. 2009, 77, 1707–1746. [Google Scholar] [CrossRef]


| Variable | n (%) or Mean (SD) | Range |
|---|---|---|
| Age Groups | ||
| 65–69 | 151 (27.11%) | |
| 70–74 | 141 (25.31%) | |
| 75–79 | 106 (19.03%) | |
| 80–84 | 88 (15.80%) | |
| 85–89 | 46 (8.26%) | |
| ≥90 | 25 (4.49%) | |
| Sex | ||
| Male (coded as 1) | 246 (44.17%) | |
| Female (coded as 0) | 311 (55.83%) | |
| Education Level | ||
| Less than High School | 318 (57.09%) | |
| High School | 87 (15.62%) | |
| Trade/Some college | 83 (14.90%) | |
| College degree | 69 (12.39%) | |
| Marital Status | ||
| Married | 276 (49.64%) | |
| Not Married | 280 (50.36%) | |
| Intergenerational household | 320 (54.45%) | |
| Smoking Status | ||
| Smoker | 19 (5.57%) | |
| Non-Smoker | 322 (94.43%) | |
| Hearing Disability | ||
| Hearing Loss | 117 (21.47%) | |
| No Hearing Loss | 417 (78.53%) | |
| Vision Disability | ||
| Vision Loss | 85 (15.29%) | |
| No Vision Loss | 471 (84.71%) | |
| Dual Sensory Disability | ||
| Hearing/Vision Loss | 37 (6.98%) | |
| No Hearing/Vision Loss | 493 (93.02%) | |
| Social Isolation | 0–4 | |
| Time 1 | 1.88 (0.98) | |
| Time 2 | 1.81 (0.98) | |
| Executive Function | 0–5 | |
| Time 1 | 3.19 (1.17) | |
| Time 2 | 3.22 (1.32) | |
| Time 3 | 3.10 (1.37) | |
| Learning/Memory | 0–9 | |
| Time 1 | 3.01 (1.76) | |
| Time 2 | 2.95 (1.87) | |
| Time 3 | 2.83 (1.89) | |
| Orientation | 0–8 | |
| Time 1 | 5.50 (1.42) | |
| Time 2 | 5.63 (1.58) | |
| Time 3 | 5.42 (1.62) | |
| Health | 1.20 (0.89) | 0–4 |
| 1 | 2 | 3 | 4 | 5 | 6 | 7 | 8 | 9 | 10 | 11 | 12 | 13 | |
|---|---|---|---|---|---|---|---|---|---|---|---|---|---|
| 1. T1 HL | 1 | ||||||||||||
| 2. T1 VL | 0.25 *** | 1 | |||||||||||
| 3. T1 DI | 0.52 ** | 0.65 ** | 1 | ||||||||||
| 4. T1 Social Iso | 0.04 | −0.05 | −0.05 | 1 | |||||||||
| 5. T2 Social Iso | 0.06 | 0.00 | 0.06 | 0.56 *** | 1 | ||||||||
| 6. T1 Exec Fun | −0.00 | −0.08 * | −0.05 | −0.08 * | −0.10 * | 1 | |||||||
| 7. T2 Exec Fun | −0.02 | −0.15 ** | −0.10 * | −0.13 ** | −0.06 | 0.56 *** | 1 | ||||||
| 8. T3 Exec Fun | −0.04 | −0.12 * | −0.06 | −0.04 | 0.01 | 0.50 *** | 0.56 *** | 1 | |||||
| 9. T1 Learning | −0.07 | −0.05 | −0.04 | 0.01 | 0.04 | 0.14 ** | 0.16 *** | 0.15 ** | 1 | ||||
| 10. T2 Learning | −0.11 * | −0.15 ** | −0.17 *** | −0.05 | −0.07 | 0.16 *** | 0.29 *** | 0.32 *** | 0.44 *** | 1 | |||
| 11. T3 Learning | −0.12 * | −0.01 | −0.08 | −0.05 | −0.06 | 0.18 *** | 0.24 *** | 0.35 *** | 0.37 *** | 0.57 *** | 1 | ||
| 12. T1 Orient | −0.09 * | −0.11 * | −0.07 | −0.04 | −0.01 | 0.20 *** | 0.25 *** | 0.23 *** | 0.20 *** | 0.25 *** | 0.20 *** | 1 | |
| 13. T2 Orient | −0.06 | −0.12 ** | −0.11 * | −0.01 | −0.06 | 0.22 *** | 0.29 *** | 0.34 *** | 0.21 *** | 0.36 *** | 0.32 *** | 0.60 *** | 1 |
| 14. T3 Orient | −0.10 | −0.10 | −0.11 * | 0.04 | 0.01 | 0.28 *** | 0.41 *** | 0.39 *** | 0.17 ** | 0.31 *** | 0.36 *** | 0.41 *** | 0.49 *** |
| Learning/Memory B (SE) | Orientation B (SE) | Executive Function B (SE) | ||||
|---|---|---|---|---|---|---|
| Predictor Variables | Model 1 | Model 2 | Model 1 | Model 2 | Model 1 | Model 2 |
| VI -> T1 CF | −0.035 (0.04) | 0.009 (0.04) | −0.111 ** (0.04) | −0.045 (0.04) | −0.109 * (0.05) | −0.056 (0.04) |
| VI -> T2 CF | −0.124 * (0.05) | −0.077 (0.05) | −0.045 (0.04) | −0.020 (0.04) | −0.103 ** (0.04) | −0.079 * (0.04) |
| VI -> T3 CF | 0.073 (0.05) | 0.093 † (0.05) | −0.046 (0.04) | −0.029 (0.04) | −0.057 (0.05) | −0.046 (0.05) |
| HI -> T1 CF | −0.070 (0.05) | −0.022 (0.05) | −0.076 † (0.05) | −0.030 (0.04) | 0.022 (0.05) | 0.065 (0.04) |
| HI -> T2 CF | −0.037 (0.05) | −0.001 (0.05) | −0.003 (0.04) | 0.020 (0.04) | 0.004 (0.04) | 0.035 (0.04) |
| HI -> T3 CF | −0.080† (0.04) | −0.056 (0.04) | −0.035 (0.05) | −0.017 (0.04) | −0.031 (0.05) | −0.012 (0.05) |
| T1 Social Isolation -> T1 CF | 0.009 (0.04) | 0.008 (0.04) | −0.045 (0.04) | −0.091 * (0.04) | −0.099 * (0.04) | −0.113 * (0.05) |
| T2 Social Isolation -> T2 CF | −0.084 * (0.04) | −0.111 ** (0.04) | −0.047 (0.04) | −0.037 (0.04) | 0.002 (0.04) | −0.042 (0.04) |
| T2 Social Isolation -> T3 CF | −0.010 (0.04) | −0.037 (0.04) | 0.047 (0.05) | −0.017 (0.05) | 0.078 † (0.04) | 0.084 † (0.05) |
| VI -> T1 Social Isolation | −0.066 (0.05) | −0.058 (0.05) | −0.066 (0.05) | −0.056 (0.05) | −0.064 (0.05) | −0.055 (0.05) |
| VI -> T2 Social Isolation | 0.009 (0.04) | 0.022 (0.04) | 0.009 (0.04) | 0.022 (0.04) | 0.009 (0.04) | 0.022 (0.04) |
| HI -> T1 Social Isolation | 0.056 (0.05) | 0.049 (0.05) | 0.057 (0.05) | 0.051 (0.05) | 0.055 (0.05) | 0.048 (0.05) |
| HI -> T2 Social Isolation | 0.044 (0.04) | 0.051 (0.04) | 0.043 (0.04) | 0.050 (0.04) | 0.043 (0.04) | 0.050 (0.04) |
| VI -> T1 Social Isolation -> T1 CF | −0.001 (0.00) | 0.000 (0.00) | 0.003 (0.00) | 0.005 (0.01) | 0.006 (0.01) | 0.006 (0.01) |
| VI -> T2 Social Isolation -> T2 CF | −0.001 (0.00) | −0.002 (0.01) | 0.000 (0.00) | −0.001 (0.00) | 0.000 (0.00) | −0.001 (0.00) |
| VI -> T2 Social Isolation -> T3 CF | 0.000 (0.00) | −0.001 (0.00) | 0.000 (0.00) | 0.000 (0.00) | 0.001 (0.00) | 0.002 (0.00) |
| HI -> T1 Social Isolation -> T1 CF | 0.001 (0.00) | 0.000 (0.00) | −0.003 (0.00) | −0.005 (0.01) | −0.005 (0.01) | −0.005 (0.01) |
| HI -> T2 Social Isolation -> T2 CF | −0.004 (0.01) | −0.006 (0.01) | −0.002 (0.00) | −0.002 (0.00) | 0.000 (0.00) | −0.002 (0.00) |
| HI -> T2 Social Isolation -> T3 CF | 0.000 (0.00) | −0.002 (0.00) | 0.002 (0.00) | −0.001 (0.00) | 0.003 (0.00) | 0.004 (0.01) |
| Sample Size (N) | 557 | 557 | 557 | 557 | 557 | 557 |
| Chi-Square Model Fit | 0.70 | 0.27 | 10.19 | 10.81 | 70.90* | 100.19 * |
| RMSEA | 0.00 | 0.00 | 0.00 | 0.00 | 0.05 | 0.07 |
| CFI | 10.00 | 10.00 | 10.00 | 10.00 | 0.99 | 0.99 |
| R2 of T3 CF | 0.35 *** | 0.43 *** | 0.30 *** | 0.38 *** | 0.37 *** | 0.40 *** |
| Learning/Memory B (SE) | Orientation B (SE) | Executive Function B (SE) | ||||
|---|---|---|---|---|---|---|
| Predictor Variables | Model 1 | Model 2 | Model 1 | Model 2 | Model 1 | Model 2 |
| DSI -> T1 CF | −0.041 (0.04) | 0.013 (0.04) | −0.094 * (0.04) | −0.031 (0.04) | −0.064 (0.05) | −0.015 (0.05) |
| DSI -> T2 CF | −0.143 ** (0.04) | −0.091 * (0.04) | −0.060 (0.05) | −0.026 (0.05) | −0.081 † (0.04) | −0.042 (0.04) |
| DSI -> T3 CF | −0.001 (0.04) | 0.013 (0.04) | −0.050 (0.05) | −0.031 (0.05) | −0.017 (0.05) | 0.000 (0.05) |
| T1 Social Isolation -> T1 CF | 0.006 (0.04) | 0.008 (0.04) | −0.047 (0.04) | −0.091 * (0.04) | −0.097 * (0.04) | −0.110 * (0.05) |
| T2 Social Isolation -> T2 CF | −0.077 * (0.04) | −0.106 * (0.04) | −0.044 (0.04) | −0.034 (0.04) | 0.008 (0.04) | −0.038 (0.04) |
| T2 Social Isolation -> T3 CF | −0.012 (0.04) | −0.039 (0.04) | 0.048 (0.05) | −0.017 (0.05) | 0.077 † (0.04) | 0.083 † (0.05) |
| DSI -> T1 Social Isolation | −0.05 (0.05) | −0.056 (0.05) | −0.052 (0.05) | −0.055 (0.05) | −0.051 (0.05) | −0.056 (0.05) |
| DSI -> T2 Social Isolation | 0.079 * (0.04) | 0.086 * (0.04) | 0.079 * (0.04) | 0.086 * (0.04) | 0.079 * (0.04) | 0.086 * (0.04) |
| DSI -> T1 Social Isolation -> T1 CF | 0.000 (0.00) | 0.000 (0.00) | 0.002 (0.00) | 0.005 (0.01) | 0.005 (0.01) | 0.006 (0.01) |
| DSI -> T2 Social Isolation -> T2 CF | −0.006 (0.01) | −0.009 (0.01) | −0.003 (0.00) | −0.003 (0.00) | 0.001 (0.00) | −0.003 (0.00) |
| DSI -> T2 Social Isolation -> T3 CF | −0.001 (0.00) | −0.003 (0.00) | 0.004 (0.00) | −0.001 (0.01) | 0.006 (0.00) | 0.007 (0.01) |
| Sample Size (N) | 557 | 557 | 557 | 557 | 557 | 557 |
| Chi-Square | 0.90 | 0.27 | 10.05 | 10.80 | 70.94 * | 100.14 * |
| RMSEA | 0.00 | 0.00 | 0.00 | 0.00 | 0.05 | 0.07 |
| CFI | 10.00 | 10.00 | 10.00 | 10.00 | 0.99 | 0.99 |
| R2 of T3 CF | 0.34 *** | 0.42 *** | 0.30 *** | 0.38 *** | 0.36 *** | 0.40 *** |
Disclaimer/Publisher’s Note: The statements, opinions and data contained in all publications are solely those of the individual author(s) and contributor(s) and not of MDPI and/or the editor(s). MDPI and/or the editor(s) disclaim responsibility for any injury to people or property resulting from any ideas, methods, instructions or products referred to in the content. |
© 2023 by the authors. Licensee MDPI, Basel, Switzerland. This article is an open access article distributed under the terms and conditions of the Creative Commons Attribution (CC BY) license (https://creativecommons.org/licenses/by/4.0/).
Share and Cite
Trujillo Tanner, C.; Yorgason, J.; White, A.; Armstrong, C.; Cash, A.; Case, R.; Ehrlich, J.R. Longitudinal Analysis of Social Isolation and Cognitive Functioning among Hispanic Older Adults with Sensory Impairments. Int. J. Environ. Res. Public Health 2023, 20, 6456. https://doi.org/10.3390/ijerph20156456
Trujillo Tanner C, Yorgason J, White A, Armstrong C, Cash A, Case R, Ehrlich JR. Longitudinal Analysis of Social Isolation and Cognitive Functioning among Hispanic Older Adults with Sensory Impairments. International Journal of Environmental Research and Public Health. 2023; 20(15):6456. https://doi.org/10.3390/ijerph20156456
Chicago/Turabian StyleTrujillo Tanner, Corinna, Jeremy Yorgason, Avalon White, Chresten Armstrong, Antonia Cash, Rebekah Case, and Joshua R. Ehrlich. 2023. "Longitudinal Analysis of Social Isolation and Cognitive Functioning among Hispanic Older Adults with Sensory Impairments" International Journal of Environmental Research and Public Health 20, no. 15: 6456. https://doi.org/10.3390/ijerph20156456
APA StyleTrujillo Tanner, C., Yorgason, J., White, A., Armstrong, C., Cash, A., Case, R., & Ehrlich, J. R. (2023). Longitudinal Analysis of Social Isolation and Cognitive Functioning among Hispanic Older Adults with Sensory Impairments. International Journal of Environmental Research and Public Health, 20(15), 6456. https://doi.org/10.3390/ijerph20156456