
COVID-19 Symptoms and Diagnoses among a Sociodemographically Diverse Cohort of Children from New York City: Lessons from the First Wave, Spring 2020

 ,
,
Abstract
:1. Introduction
2. Materials and Methods
2.1. Study Population
2.2. Variables
2.3. Statistical Analysis
3. Results
4. Discussion
5. Conclusions
Supplementary Materials
Author Contributions
Funding
Institutional Review Board Statement
Informed Consent Statement
Data Availability Statement
Conflicts of Interest
References
- Moore, J.T.; Ricaldi, J.N.; Rose, C.E.; Fuld, J.; Parise, M.; Kang, G.J.; Driscoll, A.K.; Norris, T.; Wilson, N.; Rainisch, G.; et al. Disparities in Incidence of COVID-19 among Underrepresented Racial/Ethnic Groups in Counties Identified as Hotspots during 5–18 June 2020–2022 States, February–June 2020. MMWR Morb. Mortal. Wkly. Rep. 2020, 69, 1122–1126. [Google Scholar] [CrossRef] [PubMed]
- Abedi, V.; Olulana, O.; Avula, V.; Chaudhary, D.; Khan, A.; Shahjouei, S.; Li, J.; Zand, R. Racial, Economic, and Health Inequality and COVID-19 Infection in the United States. J. Racial Ethn. Health Disparities 2020, 8, 732–742. [Google Scholar] [CrossRef] [PubMed]
- Rentsch, C.T.; Kidwai-Khan, F.; Tate, J.P.; Park, L.S.; King, J.T.; Skanderson, M.; Hauser, R.G.; Schultze, A.; Jarvis, C.I.; Holodniy, M.; et al. Covid-19 by Race and Ethnicity: A National Cohort Study of 6 Million United States Veterans. medRxiv 2020. [Google Scholar] [CrossRef]
- Goyal, M.K.; Simpson, J.N.; Boyle, M.D.; Badolato, G.M.; Delaney, M.; McCarter, R.; Cora-Bramble, D. Racial and/or Ethnic and Socioeconomic Disparities of SARS-CoV-2 Infection Among Children. Pediatrics 2020, 146, 4. [Google Scholar] [CrossRef] [PubMed]
- Leidman, E.; Duca, L.M.; Omura, J.D.; Proia, K.; Stephens, J.W.; Sauber-Schatz, E.K. COVID-19 Trends Among Persons Aged 0–24 Years—United States, 1 March–12 December 2020. MMWR Morb. Mortal. Wkly. Rep. 2021, 70, 88–94. [Google Scholar] [CrossRef] [PubMed]
- Coronavirus Disease 2019 in Children—United States, 12 February–2 April 2020. MMWR Morb. Mortal. Wkly. Rep. 2020, 69, 422–426. [CrossRef] [PubMed]
- Yasuhara, J.; Kuno, T.; Takagi, H.; Sumitomo, N. Clinical characteristics of COVID-19 in children: A systematic review. Pediatr. Pulmonol. 2020, 55, 2565–2575. [Google Scholar] [CrossRef] [PubMed]
- Lu, X.; Zhang, L.; Du, H.; Zhang, J.; Li, Y.Y.; Qu, J. SARS-CoV-2 Infection in Children. N. Engl. J. Med. 2020, 382, 1663–1665. [Google Scholar] [CrossRef] [PubMed] [Green Version]
- Trasande, L.; Ghassabian, A.; Kahn, L.G.; Jacobson, M.H.; Afanasyeva, Y.; Liu, M.; Chen, Y.; Naidu, M.; Alcedo, G.; Koshy, T.T. The NYU Children’s Health and Environment Study. Eur. J. Epidemiol. 2020, 35, 305–320. [Google Scholar] [CrossRef] [PubMed] [Green Version]
- Thompson, C.N.; Baumgartner, J.; Pichardo, C.; Toro, B.; Li, L.; Arciuolo, R.; Chan, P.Y.; Chen, J.; Culp, G.; Davidson, A.; et al. COVID-19 Outbreak—New York City, February 29–June 1, 2020. MMWR Morb. Mortal. Wkly. Rep. 2020, 69, 1725–1729. [Google Scholar] [CrossRef] [PubMed]
- World Health Organization. WHO COVID-19 Case Definition. 2020. Available online: https://www.who.int/publications/i/item/WHO-2019-nCoV-Surveillance_Case_Definition-2020.2 (accessed on 30 March 2021).
- New York State. COVID-19 Testing 2020. Available online: https://coronavirus.health.ny.gov/covid-19-testing (accessed on 1 April 2021).
- American Academy of Pediatrics and Children’s Hospital Association. Children and COVID-19: State Data Report. 2020. Available online: https://downloads.aap.org/AAP/PDF/AAP%20and%20CHA%20-%20Children%20and%20COVID-19%20State%20Data%20Report%208.27.20%20FINAL.pdf (accessed on 1 April 2021).
- Feagin, J.; Bennefield, Z. Systemic racism and U.S. health care. Soc. Sci. Med. 1982, 103, 7–14. [Google Scholar] [CrossRef] [PubMed]
- Chapman, E.N.; Kaatz, A.; Carnes, M. Physicians and Implicit Bias: How Doctors May Unwittingly Perpetuate Health Care Disparities. J. Gen. Intern. Med. 2013, 28, 1504–1510. [Google Scholar] [CrossRef] [PubMed] [Green Version]
- Khalili, M.; Iranmanesh, B.; Mohammadi, S.; Aflatoonian, M. Cutaneous and histopathological features of coronavirus disease 2019 in pediatrics: A review article. Dermatol. Ther. 2020, 34, e14554. [Google Scholar] [CrossRef] [PubMed]
- Sah, P.; Fitzpatrick, M.C.; Zimmer, C.F.; Abdollahi, E.; Juden-Kelly, L.; Moghadas, S.M.; Singer, B.H.; Galvani, A.P. Asymptomatic SARS-CoV-2 infection: A systematic review and meta-analysis. Proc. Natl. Acad. Sci. USA 2021, 118, e2109229118. [Google Scholar] [CrossRef] [PubMed]


| N | WHO Suspect Case | Healthcare Diagnosed | Tested Positive ᵃ | Case by Any Method ᵇ | Tested ᵃ | Positive Test Rate ᵃ,ᶜ | |
|---|---|---|---|---|---|---|---|
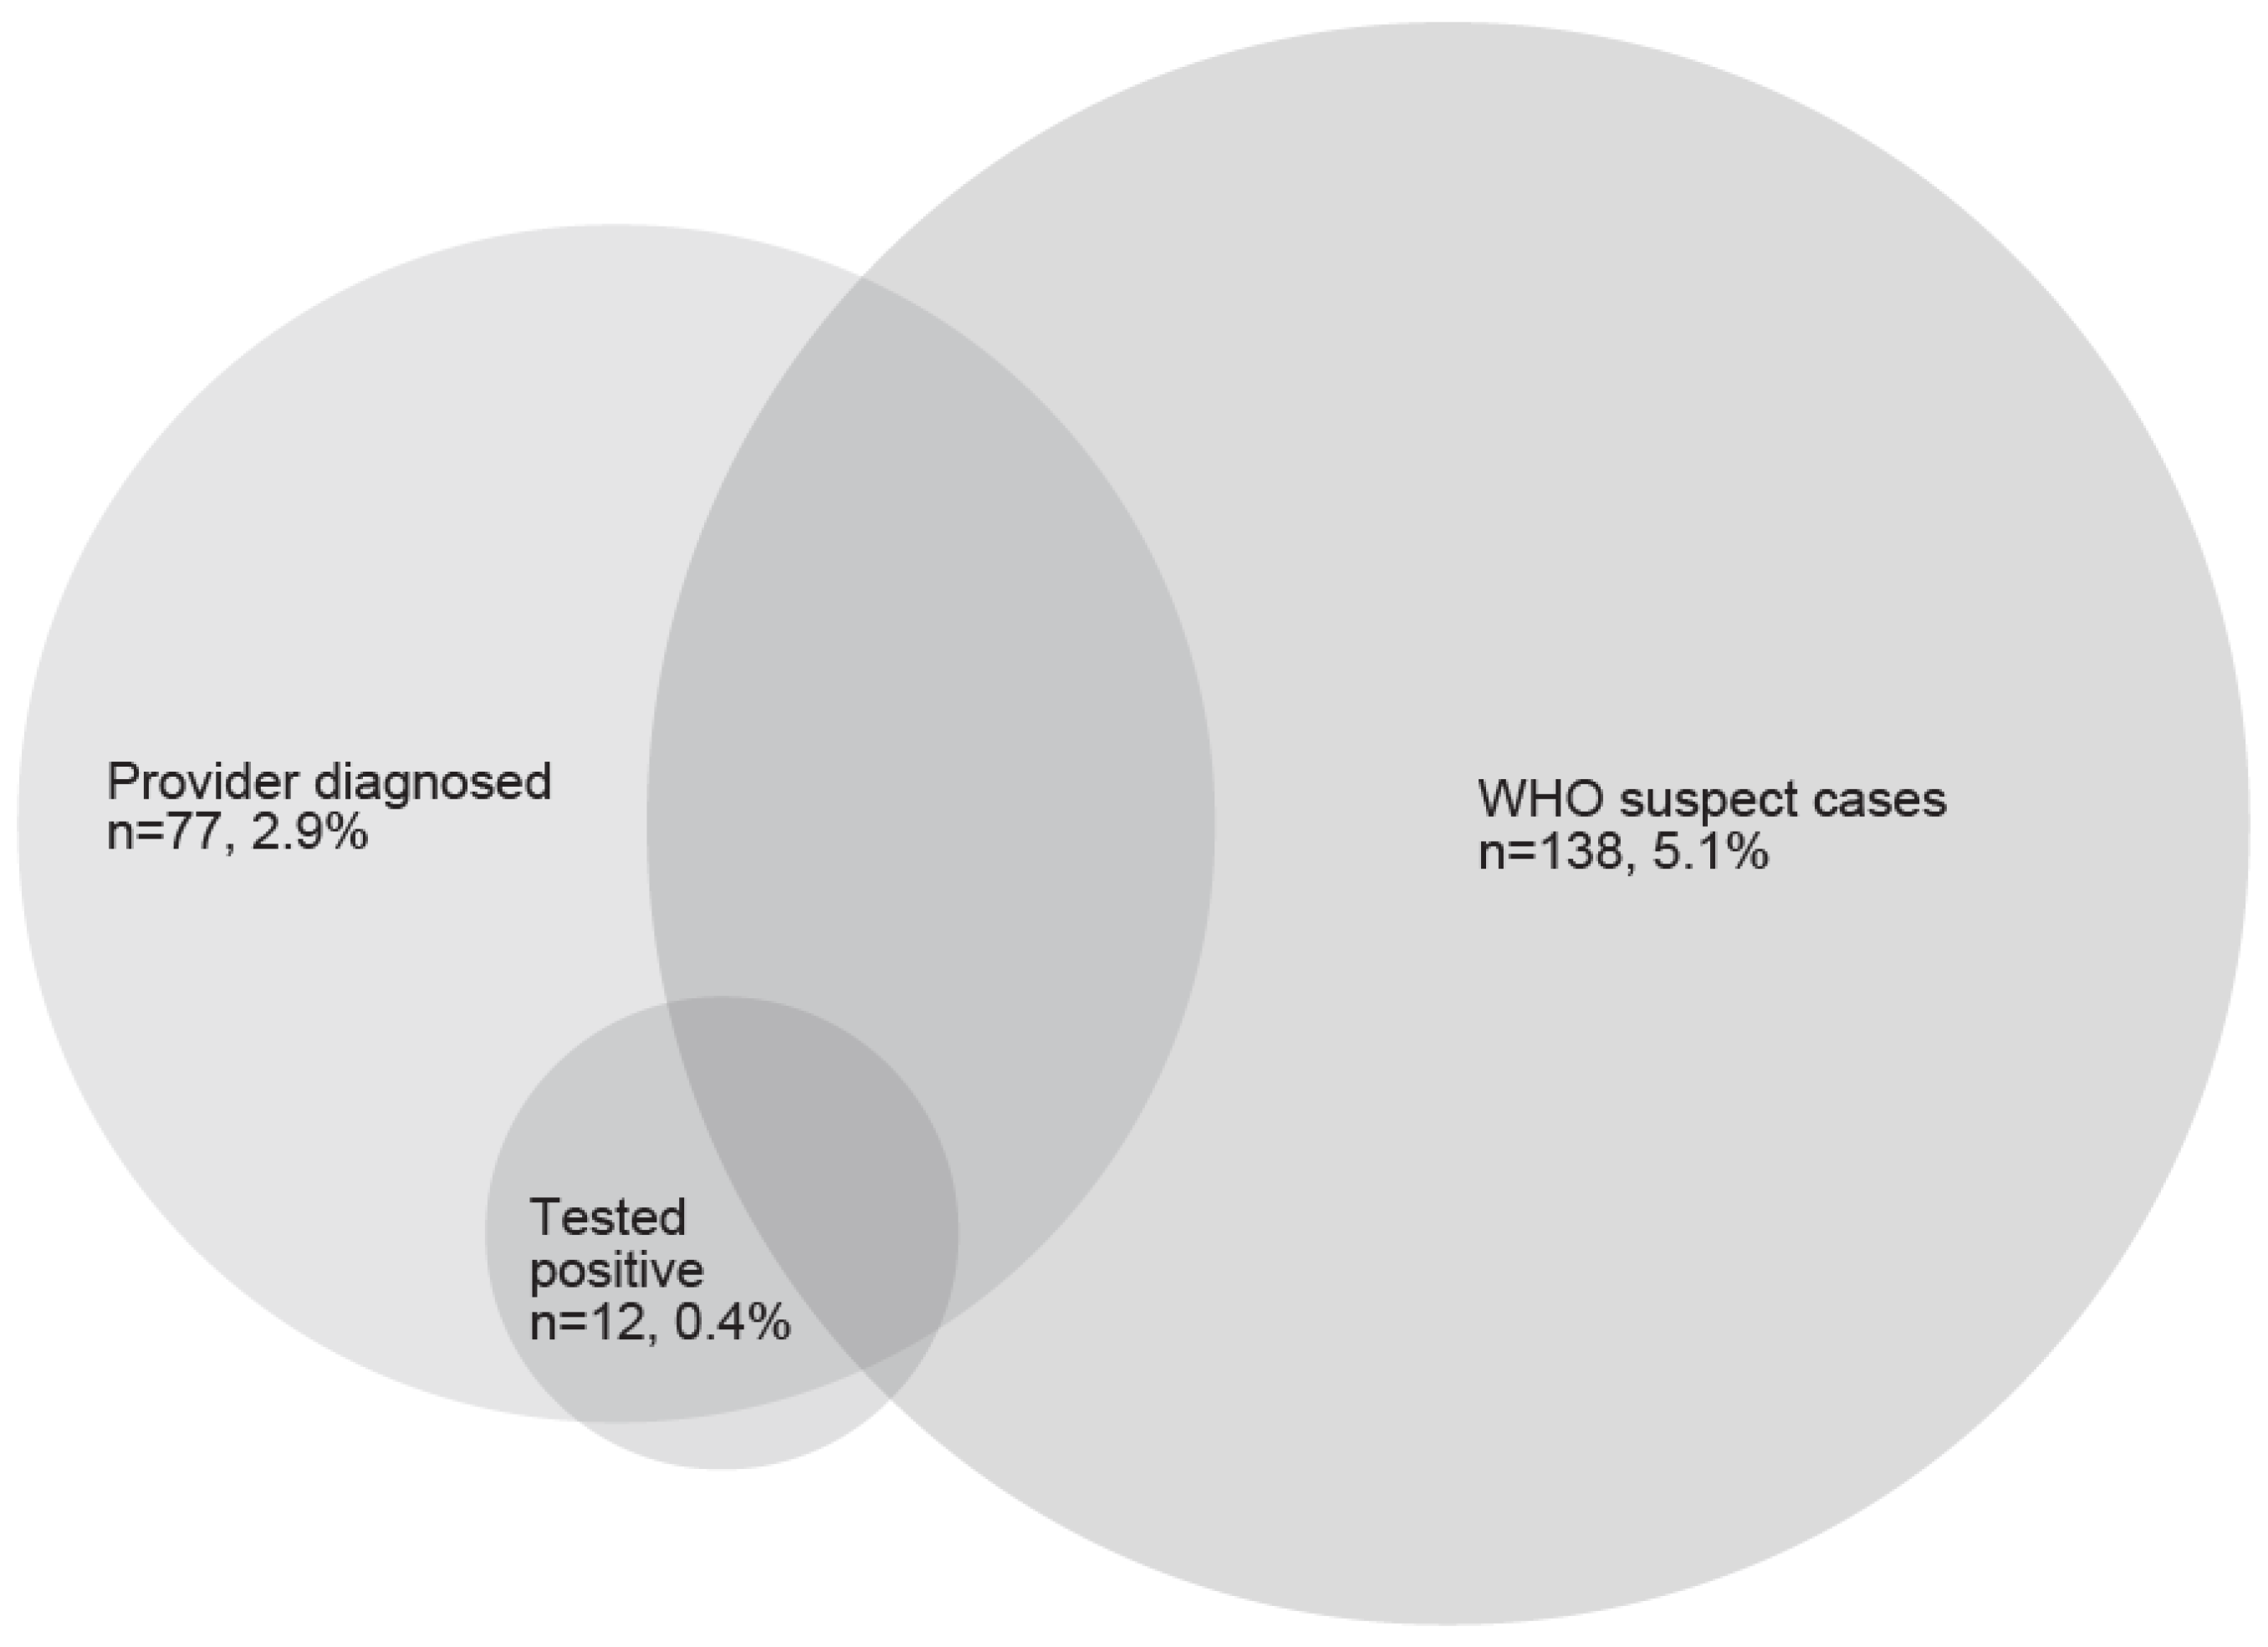
| Total | 2694 | 138 (5.1) | 77 (2.9) | 12 (0.4) | 185 (6.9) | 82 (3.0) | 14.6% |
| Child age (years) | |||||||
| <1 | 508 | 21 (4.1) | 22 (4.4) | 5 (1.0) | 34 (6.7) | 18 (3.5) | 27.8% |
| 1 to 3 | 1166 | 65 (5.6) | 37 (3.2) | 3 (0.3) | 87 (7.5) | 34 (2.9) | 8.8% |
| 4 to 9 | 581 | 28 (4.8) | 9 (1.6) | 1 (0.2) | 33 (5.7) | 16 (2.8) | 6.3% |
| 10 to 18 | 376 | 23 (6.1) | 7 (1.9) | 3 (0.8) | 28 (7.5) | 14 (3.7) | 21.4% |
| p-value | 0.51 | 0.02 | 0.09 | 0.55 | 0.76 | 0.19 | |
| Women’s race/ethnicity | |||||||
| Hispanic | 1565 | 67 (4.3) | 33 (2.1) | 10 (0.6) | 90 (5.8) | 48 (3.1) | 20.8% |
| Non-Hispanic White | 726 | 51 (7.0) | 36 (5.0) | 1 (0.1) | 73 (10.1) | 18 (2.5) | 5.6% |
| Non-Hispanic Black | 119 | 4 (3.4) | 3 (2.6) | 0 (0.0) | 5 (4.2) | 4 (3.4) | 0.0% |
| Non-Hispanic Asian | 200 | 8 (4.0) | 3 (1.5) | 1 (0.5) | 8 (4.0) | 6 (3.0) | 16.7% |
| Other/Multiple | 78 | 8 (10.3) | 2 (2.6) | 0 (0.0) | 9 (4.2) | 6 (3.4) | 0.0% |
| p-value | 0.01 | 0.004 | 0.49 | 0.0003 | 0.20 | 0.70 | |
| Insurance type | |||||||
| Public | 1622 | 64 (3.9) | 26 (1.6) | 6 (0.4) | 83 (5.1) | 40 (2.5) | 15.0% |
| Private | 1034 | 71 (6.9) | 48 (4.7) | 4 (0.4) | 98 (9.5) | 35 (3.4) | 11.4% |
| p-value | 0.001 | <0.0001 | 1.00 | <0.0001 | 0.16 | 0.65 | |
| Annual household income | |||||||
| <$30,000 | 568 | 16 (2.8) | 8 (1.4) | 5 (0.9) | 24 (4.2) | 18 (3.2) | 27.8% |
| $30,000 to $100,000 | 476 | 31 (6.5) | 19 (4.1) | 2 (0.4) | 41 (8.6) | 21 (4.4) | 9.5% |
| ≥$100,000 | 776 | 57 (7.3) | 37 (4.8) | 1 (0.1) | 77 (9.9) | 18 (2.3) | 5.6% |
| Don’t know | 759 | 30 (4.0) | 12 (1.6) | 4 (0.5) | 38 (5.0) | 22 (2.9) | 18.2% |
| p-value | 0.0005 | 0.0001 | 0.23 | <0.0001 | 0.24 | 0.24 | |
| Women’s education | |||||||
| High school or less | 1159 | 25 (2.2) | 23 (2.0) | 7 (0.6) | 60 (5.2) | 33 (2.8) | 21.2% |
| Some college | 414 | 18 (4.3) | 10 (2.5) | 2 (0.5) | 23 (5.6) | 14 (3.4) | 14.3% |
| Bachelor’s degree | 477 | 20 (4.2) | 13 (2.7) | 3 (0.6) | 26 (5.5) | 17 (3.6) | 17.6% |
| Postgraduate degree | 578 | 55 (9.5) | 30 (5.2) | 0 (0.0) | 73 (12.6) | 15 (2.6) | 0.0% |
| p-value | <0.0001 | 0.003 | 0.24 | <0.0001 | 0.77 | 0.61 | |
| Adult with high-risk job | |||||||
| Yes | 656 | 34 (5.2) | 26 (4.0) | 7 (1.1) | 49 (7.5) | 24 (3.7) | 29.2% |
| No | 2038 | 104 (5.1) | 51 (2.5) | 5 (0.2) | 136 (6.7) | 58 (2.8) | 8.6% |
| p-value | 0.94 | 0.05 | 0.01 | 0.48 | 0.29 | 0.045 |
Publisher’s Note: MDPI stays neutral with regard to jurisdictional claims in published maps and institutional affiliations. |
© 2021 by the authors. Licensee MDPI, Basel, Switzerland. This article is an open access article distributed under the terms and conditions of the Creative Commons Attribution (CC BY) license (https://creativecommons.org/licenses/by/4.0/).
Share and Cite
Kahn, L.G.; Ghassabian, A.; Jacobson, M.H.; Yu, K.; Trasande, L. COVID-19 Symptoms and Diagnoses among a Sociodemographically Diverse Cohort of Children from New York City: Lessons from the First Wave, Spring 2020. Int. J. Environ. Res. Public Health 2021, 18, 11886. https://doi.org/10.3390/ijerph182211886
Kahn LG, Ghassabian A, Jacobson MH, Yu K, Trasande L. COVID-19 Symptoms and Diagnoses among a Sociodemographically Diverse Cohort of Children from New York City: Lessons from the First Wave, Spring 2020. International Journal of Environmental Research and Public Health. 2021; 18(22):11886. https://doi.org/10.3390/ijerph182211886
Chicago/Turabian StyleKahn, Linda G., Akhgar Ghassabian, Melanie H. Jacobson, Keunhyung Yu, and Leonardo Trasande. 2021. "COVID-19 Symptoms and Diagnoses among a Sociodemographically Diverse Cohort of Children from New York City: Lessons from the First Wave, Spring 2020" International Journal of Environmental Research and Public Health 18, no. 22: 11886. https://doi.org/10.3390/ijerph182211886
APA StyleKahn, L. G., Ghassabian, A., Jacobson, M. H., Yu, K., & Trasande, L. (2021). COVID-19 Symptoms and Diagnoses among a Sociodemographically Diverse Cohort of Children from New York City: Lessons from the First Wave, Spring 2020. International Journal of Environmental Research and Public Health, 18(22), 11886. https://doi.org/10.3390/ijerph182211886