Abstract
The aim of this study was to explore the tactical effects of different pitch configurations on the collective playing tactics and the creation of goal scoring opportunities (GSO) during small sided soccer games (SSG) in youth players. A total of 22 players performed a 7 vs. 7 + 1 floater (including goalkeepers) under three different pitch configurations (“Standard”, 53 × 38 m; “Long”, 63 × 32 m; and “Wide”, 43 × 47 m). Eleven tactical indicators related to the development and the end of the team possessions were evaluated by systematic observation. Friedman tests (non-parametric ANOVA for repeated measures) revealed that the long and wide configurations produced more counterattacks (p = 0.0028; ES = 0.3), higher offensive penetration (p = 0.007; ES = 0.41), and more GSO (p = 0.018; ES = 0.30) than the standard format. Regarding the creation of GSO, the wide configuration produced more assists in the form of crosses than the long and standard formats (p = 0.025; ES = 0.31), more utilization of wide subspaces to assist the final player (p = 0.022; ES = 0.35), more number of headers as the final action (p = 0.022; ES = 0.32), and less assists in the form of passes in behind the defense (p = 0.034; ES = 0.28), than the long configuration. The modulation of the pitch configuration during SSG produced different tactical demands, requiring players to implement different tactical solutions to create GSO.
1. Introduction
The key offensive aim of soccer is to disorder the defensive organization of the opposing team to achieve goal scoring opportunities (GSO) and goals. During that process, the last actions such as the assist and the final shot are decisive and both depend on the spatial–temporal relationship between the penultimate and the last player as well as the interaction between the offensive and defensive organizations [1,2,3,4]. Due to its complexity and importance, one of the most challenging duties of professional soccer clubs is to develop or recruit players who have the capacity to score or create high amounts of GSO. In fact, recent studies have observed that goal scorers and players with high quantity of assists demonstrated to have higher levels of cognitive functions such as creativity and working memory, compared with other players [5,6]. In addition, the study of Kempe and Memmet [7] observed that showing high creativity in the last two actions before the actual shot on goal proved to be the best predictor for game success in elite soccer.
Regarding the tactical development of GSO and goals, existing literature found that the actions that led to goal were predominantly originated in central and advanced areas of the opposing half, while the crosses have been shown to represent around 30–40% of the goal assists [8]. Furthermore, the majority of goals and GSO seem to be produced by collective plays, so that the individual actions produced less than 20% of them [9,10,11]. For instance, the study of González-Rodenas et al. [12] analyzed 1172 GSO from top European teams and observed that crosses comprised the 19.6% of penultimate actions prior to GSO, while passes comprised the 62.4% and individual actions the 9.1%.
Nevertheless, the tactical actions performed prior to goals or GSO are influenced by the interaction with the opposing team [2,3,13] In this regard, González-Rodenas et al. [4] observed that crosses were more frequent against organized defenses, while passes in behind the defense or actions as dribbling or running with the ball had a greater percentage of goals against circumstantial defenses. Regarding the final action, 70.1% of the goals were scored by using only one contact to the ball in organized defenses but 46.6% in circumstantial defenses. These tactical facts suggest that players should be able to adapt to the defensive context and interact with their teammates to choose the best solution in order to disrupt the opposing team and create a GSO or a goal.
However, despite the growing emergence of research about small sided games (SSG) in soccer [14], there is a lack of studies that specifically focus on how different types of SSG can influence the way GSO and goals are achieved in training. In recent years, the analysis of SSG in soccer has focused on physiological variables [15], motion analysis [16,17], collective behavior [18,19], and technical and tactical performance of players [20,21,22].
Consequently, it seems necessary to explore training methods to optimize the creation of GSO in youth soccer. In this sense, the constraints-led approach based on non-lineal pedagogy has emerged as an optimal framework to create representative learning designs in collective sports [23]. Under this framework, coaches should manipulate task constraints during the SSG such as space, time, rules, goals, or number of players in order to create learning environments where players can interact with their teammates and opponents to explore opportunities for action and adapt to the specific tactical context. This manipulation of task constrains encourage the player’s co-adaptive and exploratory behavior to search for effective solutions, embracing problem-solving situations [24].
One of the easiest constraints for coaches to modify in SSG is the space. In this sense, the effect of the manipulation of the space size on physical and technical demands has been analyzed in multiple studies about SSG [25]. However, no study to date has analyzed the effect of modifying the pitch configuration on the playing tactics and creation of GSO in soccer. In this sense, Coutinho et al. [19] analyzed the effect of different pitch configuration on the physical demands and movement behavior in young players, concluding that using different pitch configurations might help players to improve their ability to identify the most relevant cues that support the emergence of functional behaviors. Likewise, Folgado et al. [26] observed that a longer pitch configuration (40 × 30 m) during a 4 vs. 4 + GKs game registered more distance covered at high intensities, more passes, and dribbles than a wider format (30 × 40 m), which had more lateral passes and shots and a wider team positioning.
According to this background, our hypothesis is that the design of SSG with different pitch configurations (i.e., wide pitch vs. long pitch vs. standard pitch) may modulate the emergence of collective tactical behaviors and encourage players to explore different ways to build and create GSO. Therefore, the aim of this study was to check the tactical effects of different pitch configurations on the collective playing tactics and the creation of GSO during SSG in youth players.
2. Materials and Methods
2.1. Sample
A total of 22 elite youth players (age: 13.80 ± 0.58, years of experience: 6.30 ± 0.95) from an American professional soccer club participated in the study. The participants, parents, and the club were informed about the research procedures and provided written informed consent. This study followed the ethical standards for study in humans as outlined in the Declaration of Helsinki. The sample comprised 296 offensive possessions according to the definition of Pollard and Reep [27] that teams performed during the small sided soccer games.
2.2. Small Sided Games
The players performed the same type of SSG (7 vs. 7 + 1 floater, including goalkeepers) under three different pitch configurations (“Standard”, 53 × 38 m; “Long”, 63 × 32 m; and “Wide”, 43 × 47 m) (Figure 1). The SSG were performed two times per week for a period of 3 weeks as part of the normal routine training sessions of the U14 team [28], following a standardized warm-up protocol consisting of 5 min of dynamic mobility and 5 min of technical actions. All the training sessions took place in the spring season, during the same hours (7.00 p.m.), on the same artificial turf surface. The SSG were recorded with one digital camera (Panasonic HC-V180) from an aerial perspective (10 m above the ground) to capture entirely the collective movements of both teams, following the routine way of filming of the team’s coaching staff.
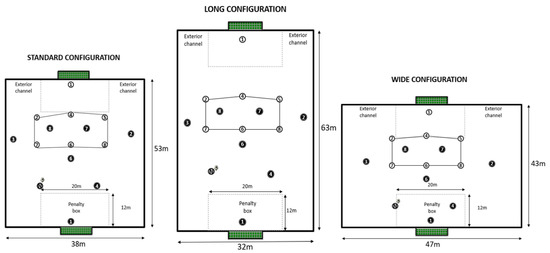
Figure 1.
Different pitch configurations and field sizes of the small sided soccer games.
The order in which the SSG formats were performed during the course of the training sessions was randomized (order in week 1: standard, long, and wide; order in week 2: long, wide, and standard; order in week 3: wide, standard, and long).
Table 1 shows the main features of the SSG conducted in this study. The SSG design included official goals and goalkeepers, and the coach did not provide direct instructions about how to solve the tactical situations or to adapt to the different spatial constraints. In addition, the teams had identical tactical objectives and tactical formations during the SGG

Table 1.
Design of the small sided games.
The SSG implemented were part of the real tactical training of the team during the spring season. To contextualize, the team’s game model was based on building-up from the back, having long ball possessions to disorder the opposing team and creating GSO. This style of play required high passing accuracy and speed but also high amount of patience to decide when and where to break lines of the defensive team to reach the opposing goal. Within this game model, the team’s structure and dynamic encouraged the wingers (forwards in our design) to play in interior channels near the midfielders to create offensive superiority in central spaces. Meanwhile, the full backs were encouraged to advance through the wide channels to reach offensive zones, playing an important role in the attacking process to create GSO.
Due to this tactical context, the objective of the coaching staff was to design representative learning designs [29] for players to experience different spatial scenarios where to dominate the ball possession and to create GSO, while they could interact with their teammates and opponents in their real positions.
Therefore, the team’s system during the SSG (Figure 2B) tried to reproduce the actual game model in the attacking moment, having:
- -
- One goalkeeper and one central back that should lead the process of building-up from the back.
- -
- One midfielder that had the role of connecting the build-up with the finishing process.
- -
- Two forwards that should occupy interior channels to create superiority in the build-up process and to play a relevant role in the finishing process.
- -
- Two full backs that, in addition to build-up, had an important role reaching offensive zones and creating GSO.
- -
- Additionally, one offensive in-floater was added to, according to the existing scientific literature, increase the passing possibilities and interactions of the attacking team [30,31] as well as to encourage the defensive team to stay compact and to prioritize the protection of the goal, [32], as we can observe in Figure 2A.
It is important to mention that although teams were structured in specific positions and roles, players were free to make their own decisions, movements, and actions to solve the different tactical situations during the SSG, in interaction with their teammates.
Regarding the pitch sizes and configurations selected, the coaching staff decided to compare the standard configuration with an extra-wide and an extra-long format, in order to expose players to different spatial constraints. The final design was based on the work of previous studies [19,26,33] that suggested that modifying the pitch configurations by changing the width and length affects team’s spatial and temporal interaction. Although the pitch configuration was changed, the area per player was maintained stable across the three formats. This size (132 m2 per player) was established considering previous literature on SSG [14,25] since most of the studies used pitch sizes that involved a range between 100 and 150 m2 per player.
Furthermore, in order to promote the build-up of GSO from the back, the SSG did not have throw-ins, corner kicks, or free kicks, so that all the restarts were initiated as goal kicks by the team in possession of the ball.
Finally, the teams were balanced according to the technical and tactical ability of the players in order to have very competitive games and teams were maintained throughout the duration of the study.
2.3. Performance Analysis
The study was based on systematic observation [34]. Eleven tactical dimensions (Table 2, Table 3 and Table 4) related to the offensive team possessions were analyzed using the REOFUT theoretical framework [35] that provides a valid and reliable tool to analyze multiple tactical and technical dimensions related to the start, development, penultimate, and last action of teams’ possessions as well as their association with achieving offensive performance [9,12].
For the analysis, a soccer coach/researcher experienced in match performance analyzed each possession post-event as many times as necessary. The Lince software [36] was used to code and register the data. The reliability of data was calculated by the intra and inter-observer agreement (Cohen’s Kappa). For this purpose, the principal researcher, and another researcher with broad experience in soccer tactical analysis (UEFA Pro Soccer Coach and PhD in Sport Sciences) evaluated 100 random possessions (33% of the sample). This analysis showed good and very good level of reliability according to Altman criteria [37] (inter-observer kappa coefficient = 0.82–1.00; intra-observer kappa coefficient = 0.84–1.00).
Table 2.
Description and categories for the dimensions related to the start and development of the team possession.
Table 2.
Description and categories for the dimensions related to the start and development of the team possession.
1-Possession type: way to start a team possession according to if the ball is in play or out of play. Two categories were considered:
|
2-Type of attack: degree of offensive directness and elaboration during the offensive process [38,39,40,41]. Two categories were considered:
|
3-Possession width: occupation of the interior and/or exterior channels within the space of defensive occupation of the opponent (SDO) [42] (Figure 2A). Three categories were considered:
|
| 4-Passes per possession: number of passes performed by the offensive team during the possession. |
Table 3.
Description and categories for the dimensions related to the penultimate and last action of the possession.
Table 3.
Description and categories for the dimensions related to the penultimate and last action of the possession.
5-Penultimate action: technical-tactical action performed immediately before the final action that allows the final player to have the opportunity of shooting at goal. This action may be performed by the same player that shoots at goal (individual action) or by a teammate that pass the ball to the final player (collective play). Four categories were considered:
|
| 6-Penultimate player: specific position of the player that performs the penultimate action. Five categories were considered (A) Goalkeeper, (B) Central defender, (C) Full back, (D) Central midfielder, (EF) Forward |
7-Penultimate invasive subspace: area within the space of defensive occupation (SDO) [42] of the opponent where penultimate action is done (Figure 2A). Three categories were considered:
|
| 8-Last player: specific position of the player that performs the last action. Five categories were considered (A) Goalkeeper, (B) Central defender, (C) Full back, (D) Central midfielder, EF) Forward. |
9-Last action: technical action performed by the last player who had the GSO. Three categories were considered:
|
10-Offensive performance: degree of offensive success of the possession, based on the degree of penetration over the opposing team and the achievement of GSO and goals. Three categories were considered:
|
11-Last invasive zone: area within the space of defensive occupation (SDO) [42] of the opponent where last action is performed (Figure 2A). Three categories and nine sub-categories were considered:
|
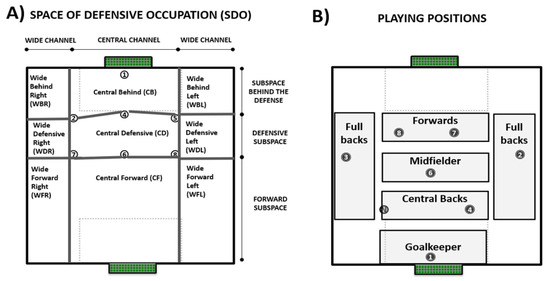
Figure 2.
(A) Space of defensive occupation (SDO) of the defensive team [42]. This spatial organization is defined by Gréhaigne [43] as the “space that is constituted by the positions of the players located, at a given moment, in the periphery of a team in play, except the goalkeeper”. This space is subdivided into 9 different subspaces that define the level of penetration and width in relation to the opponent (adapted from previous studies, [42,43,44]). These subspaces are dynamic and change every second depending on the positioning on the opposing players. (B) Playing positions of players considered in this study.
2.4. Statistical Analysis
Data was transcribed to a database created in the SPSS 20.0 program (SPSS, Chicago, IL, USA). All results are reported as mean, standard deviations (mean ± SD), and medians. Data represents the mean percentage of playing tactics or scoring opportunities implemented or created by the teams in each pitch configuration format. To show the differences between formats in the offensive penetration and creation of GSO, boxplot graphs were displayed to assess and compare the shape, central tendency, and variability of the sample.
The non-normality of the data was verified using the Shapiro–Wilk test. The Friedman test (non-parametric ANOVA for repeated measures) was used to detect tactical differences (dependent variables) between the three pitch configurations (independent variables). Dunn–Bonferroni post hoc tests were carried out to determine the differences between pairs. The confidence interval was set at 95%. The effect sizes were calculated using the Kendall’s W (coefficient of concordance), (0.1–0.3 = small effect; 0.3–0.69 = moderate effect; 0.69–1.0 = large effect size).
3. Results
3.1. Collective Playing Tactics
Table 4 shows the playing tactics implemented by the teams during the SSG with different pitch configurations. The long configuration registered higher percentage of counterattacks (34.6 ± 12.4%) than the standard one (20.7 ± 13.4%) (p ˂ 0.05) and both long and wide had more team possessions that started by means of transition play than the standard format (60.8 ± 15.9% and 62.2 ± 12.4% vs. 45.7 ± 18.8%, respectively) (p ˂ 0.05). Additionally, the wide configuration registered less team possessions that achieved reduced width (10.9 ± 9.9%) in comparison with the standard format (27.3 ± 13.5%) (p ˂ 0.05).
Table 4.
Comparison of playing tactics between the three different pitch configurations.
Table 4.
Comparison of playing tactics between the three different pitch configurations.
| Category | Standard | Long | Wide | p * | ES # |
|---|---|---|---|---|---|
| Mean ± SD (Median) | Mean ± SD (Median) | Mean ± SD (Median) | |||
| Type of attack | |||||
| Counterattack | 20.7 ± 13.4 (17.1) | 34.6 ± 12.4 a (33.3) | 27.4 ± 12.6 (26.8) | 0.028 | 0.30 |
| Positional attack | 79.3 ± 13.4 (82.8) | 65,3 ± 12.4 (67.7) a | 72.6 ± 12.4 (73.2) | 0.028 | 0.30 |
| Passes per possession | 5.0 ± 0.8 (4.9) | 4.2 ± 1.2 (4.2) | 4.53 ± 0.87 (4.6) | 0.105 | 0.18 |
| Transition play | 45.7 ± 18.8 (46.4) | 60.83 ± 15.95 (60.0) a | 62.2 ± 12.4(63.5) a | 0.010 | 0.39 |
| Restart | 54.4 ± 18.8 (54.0) | 39.16 ± 17.21 (40.0) a | 37.7 ± 12.4(36.4) a | 0.010 | 0.39 |
| Offensive width | |||||
| Maximum width | 29.7 ± 11.8 (29.3) | 35.5 ± 19.6(36.6) | 45.8 ± 17.0 (44.4) | 0.083 | 0.21 |
| Medium width | 42.9 ± 17.7 (45.0) | 37.8 ± 13.9 (38.7) | 43.3 ± 18.1 (43.7) | 0.517 | 0.06 |
| Reduced width | 27.3 ± 13.5 (25.0) | 26.7 ± 17.8 (19.4) | 10.9 ± 9.9 (12.5) a | 0.018 | 0.34 |
| Offensive penetration | 49.1± 17.7 (50.0) | 63.0 ± 15.2 (63.3) a | 71.7 ± 17.4 (70.8) a | 0.007 | 0.41 |
| Scoring opportunity | 26.9 ± 14.6 (28.6) | 40.9 ± 21.0 (42.7) a | 43.2 ± 17.8 (43.6) a | 0.026 | 0.30 |
* Friedman Test. Values in bold indicate significant differences between pitch configurations. # Effect size calculated using the Kendall’s W (coefficient of concordance; 0.1–0.3 = small effect; 0.3–0.69 = moderate effect; 0.70–1.0 = large effect size. a = significantly different (p ˂ 0.05) from the “standard” configuration.
3.2. Offensive Performance
Figure 3 shows that both long (63.0 ± 15.2%) and wide (71.7 ± 17.4%) formats achieved more offensive penetration than the standard format (49.1 ± 17.7%) (p ˂ 0.05). In addition, both long (40.9 ± 21.0%) and wide (43.2 ± 17.8%) were more effective in creating GSO than the standard configuration (26.9 ± 14.6%) (p ˂ 0.05).
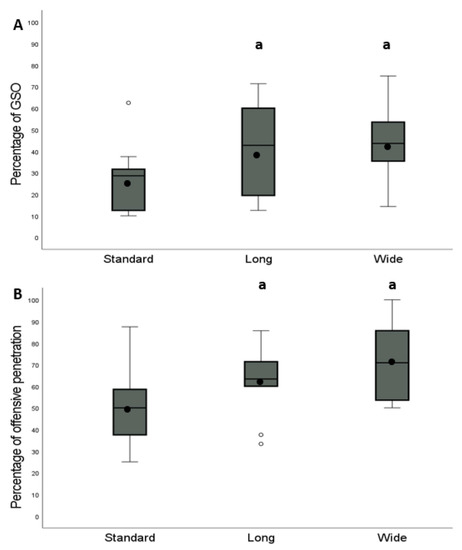
Figure 3.
Box plot of the percentage of team possession that achieved (A) goal scoring opportunities and (B) offensive penetration during the different pitch configuration of the SSG. The box indicates the 25th and 75th quartiles and the central line is the median. The ends of the whiskers are the 2.5% and 97.5% values. Values outside the range of the whiskers are extreme values. Mean is represented with a black dot. a = significantly different (p ˂ 0.05) from the “standard” configuration.
3.3. Goal Scoring Opportunities
Table 5 shows the playing tactics implemented when creating GSO. No significant differences were found for all the dimensions except for the offensive width, where the wide format registered lesser frequency of team possessions that had reduced width (10.9 ± 14.8%) than the long format (30.1 ± 31.8%) (p ˂ 0.05).
Table 5.
Comparison of playing tactics between the three different pitch configurations in the team possessions that led to GS.
Regarding the penultimate action when creating GSO (Table 6), the wide configuration produced more assists in the form of crosses (43.0 ± 25.1%) than the long (13.3 ± 20.5%) and standard formats (16.6 ± 28.6) (p ˂ 0.05). In addition, the wide configuration had more utilization of wide subspaces (65.3 ± 20.8%) to assist the final player than the long configuration (29.2 ± 22.0%) (p ˂ 0.05). Finally, the long configuration registered more passes in behind the defense (30.8 ± 31.5 than the wide format (12.8 ± 24.0%) (p ˂ 0.05).
Table 6.
Comparison of the penultimate action between the three different pitch configurations in the team possessions that led to GSO.
As for the last action when creating GSO, Table 7 shows that no significant differences were found for the final player and the final subspaces either in width or penetration level. As regards the last technical action, a greater number of headers was found in the wide configuration (16.6 ± 18.4%), in comparison with the long format (1.7 ± 5.8%).
Table 7.
Comparison of the final action between the three different pitch configurations in the team possessions that led to GSO.
4. Discussion
The aim of this study was to explore the tactical effects of different pitch configurations on the collective playing tactics and the creation of goal scoring opportunities during SSG in youth soccer players. Our research observed that manipulating the pitch configuration during SSG to make the field “longer” or “wider” can modulate some of the technical and tactical actions performed by players and teams to create GSO.
To our knowledge, this study is the first to analyze the tactical creation of GSO in SSG with different pitch configurations by means of observational methodology. This fact makes it difficult to compare our findings with other studies, since previous studies evaluated the effects of different pitch shapes on physical and physiological variables [45], as well as on collective team behaviors [19,33] and technical actions [26] However, some of their findings may be useful for the interpretation of our results.
First of all, both the long and the wide configurations created more ball transitions between teams in open play, more counterattacks, more offensive penetration, and more GSO than the standard format. These tactical aspects may be due to the change in the space constraints experienced by the players. For instance, the study of Coutinho et al. [19] observed that SSG with standard condition registered higher collective movement synchronization in both longitudinal and lateral directions, in comparison to other formats such as a sided configuration. Although the methodology used in the research of Coutinho et al. [19] is very different from our study, their findings could help in the interpretation of our results. In this regard, a possible higher collective synchronization in the standard format would create a more defensively organized scenario in which penetrating and creating GSO could be more difficult than in the other formats, in which the different spatial constraints may reduce the collective organization and create a more open context to break lines of the opponent.
For example, the long configuration offers a tactical context where the reduced spatial width may provoke teams trying to advance the opposing goal with more verticality. This scenario may cause more ball losses and changes in the ball possessions between teams in open play, but also it could contribute to creating more “attempts” to break opposing lines, which would explain the higher offensive penetration and number of GSO than the standard format. In addition, the long configuration increases the distance that teams need to cover to reach the opposing goal or to move back to defend the own goal. In fact, the study of Folgado et al. [26] observed that increasing the field’s length contributes to an increase in team’s length and the distances between the team’s centroids, which can create more space between the lines of the defensive team. This tactical constraint can increase the opportunities to perform counterattacks to exploit the space left behind by the opponent when trying to attack, which could lead to more offensive penetration and GSO than in the standard configuration.
As for the wide configuration, two main constraints can influence the modulation of the offensive process in comparison with other formats. On one hand, the wide format reduces the length of the field in comparison to the standard or long formats, which reduces the distance between goals and may make it easier to reach shooting areas, explaining the higher degree of offensive penetration and GSO. Our results agree with Folgado et al. [26] who observed more shots per player in a wider field (30 × 40 m) rather than in a standard one (40 × 30 m). On the other hand, this configuration allows the offensive team to have more space to progress in the wide channels, which makes it more demanding for the defensive team to move laterally and prevent the offensive penetration. In this sense, the study of Folgado et al. [26] observed that increasing the field’s width contributes to increases in the team’s width, which indicates that teams need to increase the distance between teammates to cover more space laterally, which can also help the offensive team penetrate through the interior subspaces of the defensive team. In addition to a higher team’s width, Coutinho et al. [19] observed that a sided pitch did not lead to a higher time spent synchronized compared to the standard configuration. These findings defend the idea that in wider fields, the coordination between teammates decreases, which could lead to more opportunities for the offensive team to penetrate and create GSO.
Regarding the team possessions that led to GSO, the main findings of our study revealed that the wide configuration created more GSO by crossing than the rest of the formats, as well as more headers as the final action than the long configuration. Meanwhile, the long format had a higher frequency of penultimate actions in the form of passing in behind the defense than the wide format.
These results indicate that players explored and implemented different solutions to achieve GSO during the different SSG. For example, the long configuration offers a tactical context where the defensive team may not only have more length but they could also leave more space between their defensive line and the goalkeeper. Under these conditions, the offensive team may have more opportunities to make runs in behind the defensive line to try to exploit this subspace and create GSO. Interestingly, Folgado et al. [26] observed that more elongated pitch elicited more distance covered at high intensities, higher number of forward passes, and a larger distance between the goalkeeper and the last defender. In this tactical context, teams seem to play more vertical in order to gain advantage of the unoccupied space between the last defender and the goalkeeper, which makes players explore a different way of creating GSO than in a wider field, where the spatial constraints offer another tactical context.
In the wide configuration, offensive teams took advantage of the higher field width to perform more crosses from exterior channels of the field and wide subspaces of the opponent. Probably due to the higher frequency of crosses, more headers were found in this configuration. In this line, Frencken et al. [33] suggested that the availability of more lateral space at wider pitches offers players the opportunity to move into these regions, increasing teams’ lateral displacement. In this manner, making the field wider seems to increase the importance of crossing and heading to create GSO.
Our study agrees with previous studies [19,26] in suggesting that altering the length and width of the pitch influences players’ tendencies to explore along the goal-to-goal and lateral-to-lateral axes. This modulation of the pitch configuration adds variability to the SSG and promotes the players’ tactical exploration and movement variability, which promotes the emergence of different tactical solutions to create GSO.
Limitations and Practical Applications
This study has several limitations. Firstly, the fact of only using observational methodology may not capture the entire complexity of soccer actions and interactions, as previous studies based on ecological models have claimed [46,47,48]. Secondly, this study did not measure collective and positional variables (team width and length, centroid distance, etc.), physical or physiological variables (heart rate, distance covered, accelerations, decelerations, etc.), or the accumulated training load, as other similar studies did [19,26,33,45,49]. Finally, this study only focused on offensive dimensions, while the possible effects of different pitch configurations on the defensive playing tactics were not analyzed.
Nevertheless, this study has important practical applications. Our findings suggest that soccer coaches should consider the manipulation of the pitch configuration to expose players to different spatial constraints and make them explore multiple solutions to create GSO.
5. Conclusions
In conclusion, the long and wide configurations produced more counterattacks, higher offensive penetration, and more GSO than the standard format. Regarding the creation of GSO, the wide configuration produced more assists in the form of crosses than the long and standard formats, more utilization of wide subspaces to assist the final player, greater number of headers as the final action, and less assists in the form of passes in behind the defense than the standard configuration.
Thus, the modulation of the spatial constraints by changing the pitch configuration during small sided soccer games produces different tactical demands, which requires players to adapt to the spatial context and implement different tactical solutions to create GSO.
Author Contributions
Conceptualization, J.G.-R. and R.A.; methodology, J.G.-R. and R.A.; validation, J.G.-R., R.A.-M., P.d.M.-C. and A.T.-D.; formal analysis, J.G.-R.; investigation, J.G.-R.; writing—original draft preparation, J.G.-R.; writing—review and editing, R.A., P.d.M.-C., A.T.-D. and R.A.-M.; supervision, R.A.; project administration, J.G.-R. and R.A. All authors have read and agreed to the published version of the manuscript.
Funding
This research received no external funding.
Institutional Review Board Statement
The study was conducted according to the guidelines of the Declaration of Helsinki. Ethical approval was not required for this study because the soccer exercises were part of the normal routine training sessions of the team and no invasive, individual, or identifiable measures were performed to obtain the data [28].
Informed Consent Statement
Informed consent was obtained from all subjects involved in the study.
Data Availability Statement
The data that support the findings of this study are available from the corresponding author, upon reasonable request.
Acknowledgments
The authors gratefully acknowledge the support of a Spanish government subproject mixed method approach on performance analysis (in training and competition) in elite and academy sport (PGC2018-098742-B-C33) (2019–2021) (del Ministerio de Ciencia, Innovación y Universidades (MCIU), la Agencia Estatal de Investigación (AEI) y el Fondo Europeo de Desarrollo Regional (FEDER)), that is part of the coordinated project new approach of research in physical activity and sport from mixed methods perspective (NARPAS_MM) (SPGC201800X098742CV0).
Conflicts of Interest
The authors declare no conflict of interest.
References
- Shafizadeh, M.; Sproule, J.; Gray, G. The emergence of coordinative structures during offensive movement for goal-scoring in soccer. Int. J. Perform. Anal. Sport 2013, 13, 612–623. [Google Scholar] [CrossRef]
- Vilar, L.; Araújo, D.; Davids, K.; Travassos, B.; Duarte, R.; Parreira, J. Interpersonal coordination tendencies supporting the creation/prevention of goal scoring opportunities in futsal. Eur. J. Sport Sci. 2014, 14, 28–35. [Google Scholar] [CrossRef]
- Ramos, J.; Lopes, R.J.; Marques, P.; Araújo, D. Hypernetworks Reveal Compound Variables That Capture Cooperative and Competitive Interactions in a Soccer Match. Front. Psychol. 2017, 8, 1379. [Google Scholar] [CrossRef] [Green Version]
- González-Ródenas, J.; López-Bondia, I.; Aranda-Malavés, R.; Tudela, A.; Sanz-Ramírez, E.; Aranda, R. Technical, tactical and spatial indicators related to goal scoring in European elite soccer. J. Hum. Sport Exerc. 2020, 15, 186–201. [Google Scholar] [CrossRef]
- Vestberg, T.; Gustafson, R.; Maurex, L.; Ingvar, M.; Petrovic, P. Executive Functions Predict the Success of Top-Soccer Players. PLoS ONE 2012, 7, e34731. [Google Scholar] [CrossRef]
- Vestberg, T.; Reinebo, G.; Maurex, L.; Ingvar, M.; Petrovic, P. Core executive functions are associated with success in young elite soccer players. PLoS ONE 2017, 12, e0170845. [Google Scholar] [CrossRef]
- Kempe, M.; Memmert, D. «Good, better, creative»: The influence of creativity on goal scoring in elite soccer. J. Sports Sci. 2018, 36, 2419–2423. [Google Scholar] [CrossRef] [PubMed] [Green Version]
- Rodenas, J.G.; Malaves, R.A.; Desantes, A.T.; Ramirez, E.S.; Hervas, J.C.; Malaves, R.A. Past, present and future of goal scoring analysis in professional soccer. Retos 2020, 37, 774–785. [Google Scholar]
- Mitrotasios, M.; Gonzalez-Rodenas, J.; Armatas, V.; Aranda, R. The creation of goal scoring opportunities in professional soccer. Tactical differences between Spanish La Liga, English Premier League, German Bundesliga and Italian Serie A. Int. J. Perform. Anal. Sport 2019, 19, 452–465. [Google Scholar] [CrossRef]
- Durlik, K.; Bieniek, P. Analysis of goals and assists diversity in English Premier League. J. Health Sci. 2014, 4, 047–056. [Google Scholar]
- Armatas, V.; Yiannakos, Á. Analysis and evaluation of goal scored in 2006 world cup. J. Sport Health Res. 2010, 2, 119. [Google Scholar]
- Gonzalez-Rodenas, J.; Mitrotasios, M.; Aranda, R.; Armatas, V. Combined effects of tactical, technical and contextual factors on shooting effectiveness in European professional soccer. Int. J. Perform. Anal. Sport 2020, 20, 280–293. [Google Scholar] [CrossRef]
- Santos, R.; Duarte, R.; Davids, K.; Teoldo, I. Interpersonal Coordination in Soccer: Interpreting Literature to Enhance the Representativeness of Task Design, From Dyads to Teams. Front. Psychol. 2018, 9, 2550. [Google Scholar] [CrossRef] [PubMed] [Green Version]
- Clemente, F.M.; Afonso, J.; Sarmento, H. Small-sided games: An umbrella review of systematic reviews and meta-analyses. PLoS ONE 2021, 16, e0247067. [Google Scholar] [CrossRef] [PubMed]
- Halouani, J.; Chtourou, H.; Dellal, A.; Chaouachi, A.; Chamari, K. Soccer small-sided games in young players: Rule modification to induce higher physiological responses. Biol. Sport 2017, 34, 163–168. [Google Scholar] [CrossRef] [PubMed]
- Hauer, R.; Störchle, P.; Karsten, B.; Tschan, H.; Baca, A. Internal, external and repeated-sprint demands in small-sided games: A comparison between bouts and age groups in elite youth soccer players. PLoS ONE 2021, 16, e0249906. [Google Scholar] [CrossRef] [PubMed]
- Beenham, M.; Barron, D.J.; Fry, J.; Hurst, H.H.; Figueiredo, A.; Atkins, S. A Comparison of GPS Workload Demands in Match Play and Small-Sided Games by the Positional Role in Youth Soccer. J. Hum. Kinet. 2017, 57, 129–137. [Google Scholar] [CrossRef] [Green Version]
- Olthof, B.; Frencken, W.G.; Lemmink, K.A. The older, the wider: On-field tactical behavior of elite-standard youth soccer players in small-sided games. Hum. Mov. Sci. 2015, 41, 92–102. [Google Scholar] [CrossRef] [PubMed]
- Coutinho, D.; Gonçalves, G.; Santos, S.; Travassos, B.; Wong, D.P.; Sampaio, J. Effects of the pitch configuration design on players’ physical performance and movement behaviour during soccer small-sided games. Res. Sports Med. 2019, 27, 298–313. [Google Scholar] [CrossRef] [PubMed]
- Sánchez-Sánchez, J.; Hernández, D.; Casamichana, D.; Martínez-Salazar, C.; Ramirez-Campillo, R.; Sampaio, J. Heart Rate, Technical Performance, and Session-RPE in Elite Youth Soccer Small-Sided Games Played with Wildcard Players. J. Strength Cond. Res. 2017, 31, 2678–2685. [Google Scholar] [CrossRef] [PubMed]
- Práxedes, A.; Moreno, A.; Gil-Arias, A.; Claver, F.; Del Villar, F. The effect of small-sided games with different levels of opposition on the tactical behaviour of young footballers with different levels of sport expertise. PLoS ONE 2018, 13, e0190157. [Google Scholar] [CrossRef] [PubMed]
- Machado, J.C.; Barreira, D.; Teoldo, I.; Serra-Olivares, J.; Góes, A.; José Scaglia, A. Tactical Behaviour of Youth Soccer Players: Differences Depending on Task Constraint Modification, Age and Skill Level. J. Hum. Kinet. 2020, 75, 225–238. [Google Scholar] [CrossRef]
- Ramos, A.; Coutinho, P.; Leitão, J.C.; Cortinhas, A.; Davids, K.; Mesquita, I. The constraint-led approach to enhancing team synergies in sport—What do we currently know and how can we move forward? A systematic review and meta-analyses. Psychol. Sport Exerc. 2020, 50, 101754. [Google Scholar] [CrossRef]
- Davids, K.; Araújo, D.; Shuttleworth, R.; Button, C. Acquiring skill in sport: A constraints-led perspective. Int. J. Comput. Sci. Sport 2003, 2, 31–39. [Google Scholar]
- Sarmento, H.; Clemente, F.M.; Harper, L.D.; Da Costa, I.T.; Owen, A.; Figueiredo, A.J. Small sided games in soccer—A systematic review. Int. J. Perform. Anal. Sport 2018, 18, 693–749. [Google Scholar] [CrossRef]
- Folgado, H.; Bravo, J.; Pereira, P.; Sampaio, J. Towards the use of multidimensional performance indicators in football small-sided games: The effects of pitch orientation. J. Sports Sci. 2019, 37, 1064–1071. [Google Scholar] [CrossRef] [PubMed]
- Pollard, R.; Reep, C. Measuring the effectiveness of playing strategies at soccer. J. R. Stat. Soc. Ser. D 1997, 46, 541–550. [Google Scholar] [CrossRef]
- Winter, E.M.; Maughan, R.J. Requirements for ethics approvals. J. Sports Sci. 2009, 27, 985. [Google Scholar] [CrossRef]
- Passos, P.J.; Davids, K. Learning design to facilitate interactive behaviours in Team Sports. RICYDE 2015, 11, 18–32. [Google Scholar]
- Vilar, L.; Esteves, P.T.; Travassos, B.; Passos, P.; Lago-Peñas, C.; Davids, K. Varying Numbers of Players in Small-Sided Soccer Games Modifies Action Opportunities During Training. Int. J. Sports Sci. Coach. 2014, 9, 1007–1018. [Google Scholar] [CrossRef] [Green Version]
- Praça, G.M.; Clemente, F.M.; Andrade, A.G.P.; De Morales, J.C.P.; Greco, P.J. Network Analysis in Small-Sided and Conditioned Soccer Games: The Influence of Additional Players and Playing Position. Kinesiology 2017, 49, 185–193. [Google Scholar] [CrossRef] [Green Version]
- Padilha, M.B.; Guilherme, J.; Serra-Olivares, J.; Roca, A.; Teoldo, I. The influence of floaters on players’ tactical behaviour in small-sided and conditioned soccer games. Int. J. Perform. Anal. Sport 2017, 17, 721–736. [Google Scholar] [CrossRef]
- Frencken, W.; Van Der Plaats, J.; Visscher, C.; Lemmink, K. Size matters: Pitch dimensions constrain interactive team behaviour in soccer. J. Syst. Sci. Complex. 2013, 26, 85–93. [Google Scholar] [CrossRef]
- Anguera, M.T.; Hernández-Mendo, A. La metodología observacional en el ámbito del deporte [Observational methodology in sport sciences]. E-Balonmano.com Rev. De Cienc. Del Deporte 2013, 9, 135–160. [Google Scholar]
- Aranda, R.; González-Ródenas, J.; López-Bondia, I.; Aranda-Malavés, R.; Tudela-Desantes, A.; Anguera, M.T. “REOFUT” as an Observation Tool for Tactical Analysis on Offensive Performance in Soccer: Mixed Method Perspective. Front. Psychol. 2019, 10, 1476. [Google Scholar] [CrossRef]
- Gabin, B.; Camerino, O.; Anguera, M.T.; Castañer, M. Lince: Multiplatform sport analysis software. Procedia Soc. Behav. Sci. 2012, 46, 4692–4694. [Google Scholar] [CrossRef]
- Altman, D.G. Some common problems in medical research. In Practical Statistics for Medical Research; Altman, D.G., Ed.; Chapman y Hall: London, UK, 1991. [Google Scholar]
- Bangsbo, J.; Peitersen, B. Soccer Systems and Strategies; Human Kinetics: Champaign, IL, USA, 2000. [Google Scholar]
- Tenga, A.; Kanstad, D.; Ronglan, L.T.; Bahr, R. Developing a new method for team match performance analysis in professional soccer and testing its reliability. Int. J. Perform. Anal. Sport 2009, 9, 8–25. [Google Scholar] [CrossRef]
- Sarmento, H.; Anguera, M.T.; Campaniço, J.; Leito, J. Development and validation of a notational system to study the offensive process in football. Medicina 2010, 46, 401–407. [Google Scholar] [CrossRef] [Green Version]
- Lago-Ballesteros, J.; Lago, C.; Rey, E. The effect of playing tactics and situational variables on achieving score-box possessions in a professional soccer team. J. Sports Sci. 2012, 30, 1455–1461. [Google Scholar] [CrossRef]
- Seabra, F.; Dantas, L. Space definition for match analysis in soccer. Int. J. Perform. Anal. Sport 2006, 6, 97–113. [Google Scholar] [CrossRef]
- Gréhaigne, J. La Organización del Juego en el Fútbol [Game Organization in Football]; INDE: Barcelona, Spain, 2001. [Google Scholar]
- Castellano, J.; Hernández Mendo, A. La observación de la acción de juego en fútbol. Contextualización de los acontecimientos [Game action observation in football. Events contextualization]. El Entren. Español 2001, 90, 15–20. [Google Scholar]
- Casamichana, D.; Bradley, P.S.; Castellano, J. Influence of the Varied Pitch Shape on Soccer Players Physiological Responses and Time-Motion Characteristics during Small-Sided Games. J. Hum. Kinet. 2018, 64, 171–180. [Google Scholar] [CrossRef] [PubMed] [Green Version]
- Araújo, D.; Davids, K.; Hristovski, R. The ecological dynamics of decision making in sport. Psychol. Sport Exerc. 2006, 7, 653–676. [Google Scholar] [CrossRef] [Green Version]
- Vilar, L.; Araújo, D.; Davids, K.; Button, C. The Role of Ecological Dynamics in Analysing Performance in Team Sports. Sports Med. 2012, 42, 1–10. [Google Scholar] [CrossRef] [PubMed]
- Travassos, B.; Davids, K.; Araújo, D.; Esteves, T.P. Performance analysis in team sports: Advances from an Ecological Dynamics approach. Int. J. Perform. Anal. Sport 2013, 13, 83–95. [Google Scholar] [CrossRef]
- Teixeira, J.; Forte, P.; Ferraz, R.; Leal, M.; Ribeiro, J.; Silva, A.; Barbosa, T.; Monteiro, A. Monitoring accumulated training and match load in football: A systematic review. Int. J. Environ. Res. Public Health 2021, 18, 3906. [Google Scholar] [CrossRef] [PubMed]
Publisher’s Note: MDPI stays neutral with regard to jurisdictional claims in published maps and institutional affiliations. |
© 2021 by the authors. Licensee MDPI, Basel, Switzerland. This article is an open access article distributed under the terms and conditions of the Creative Commons Attribution (CC BY) license (https://creativecommons.org/licenses/by/4.0/).