
Scenario-Based Analysis of Land Use Competition and Sustainable Land Development in Zhangye of the Heihe River Basin, China

Abstract
:1. Introduction
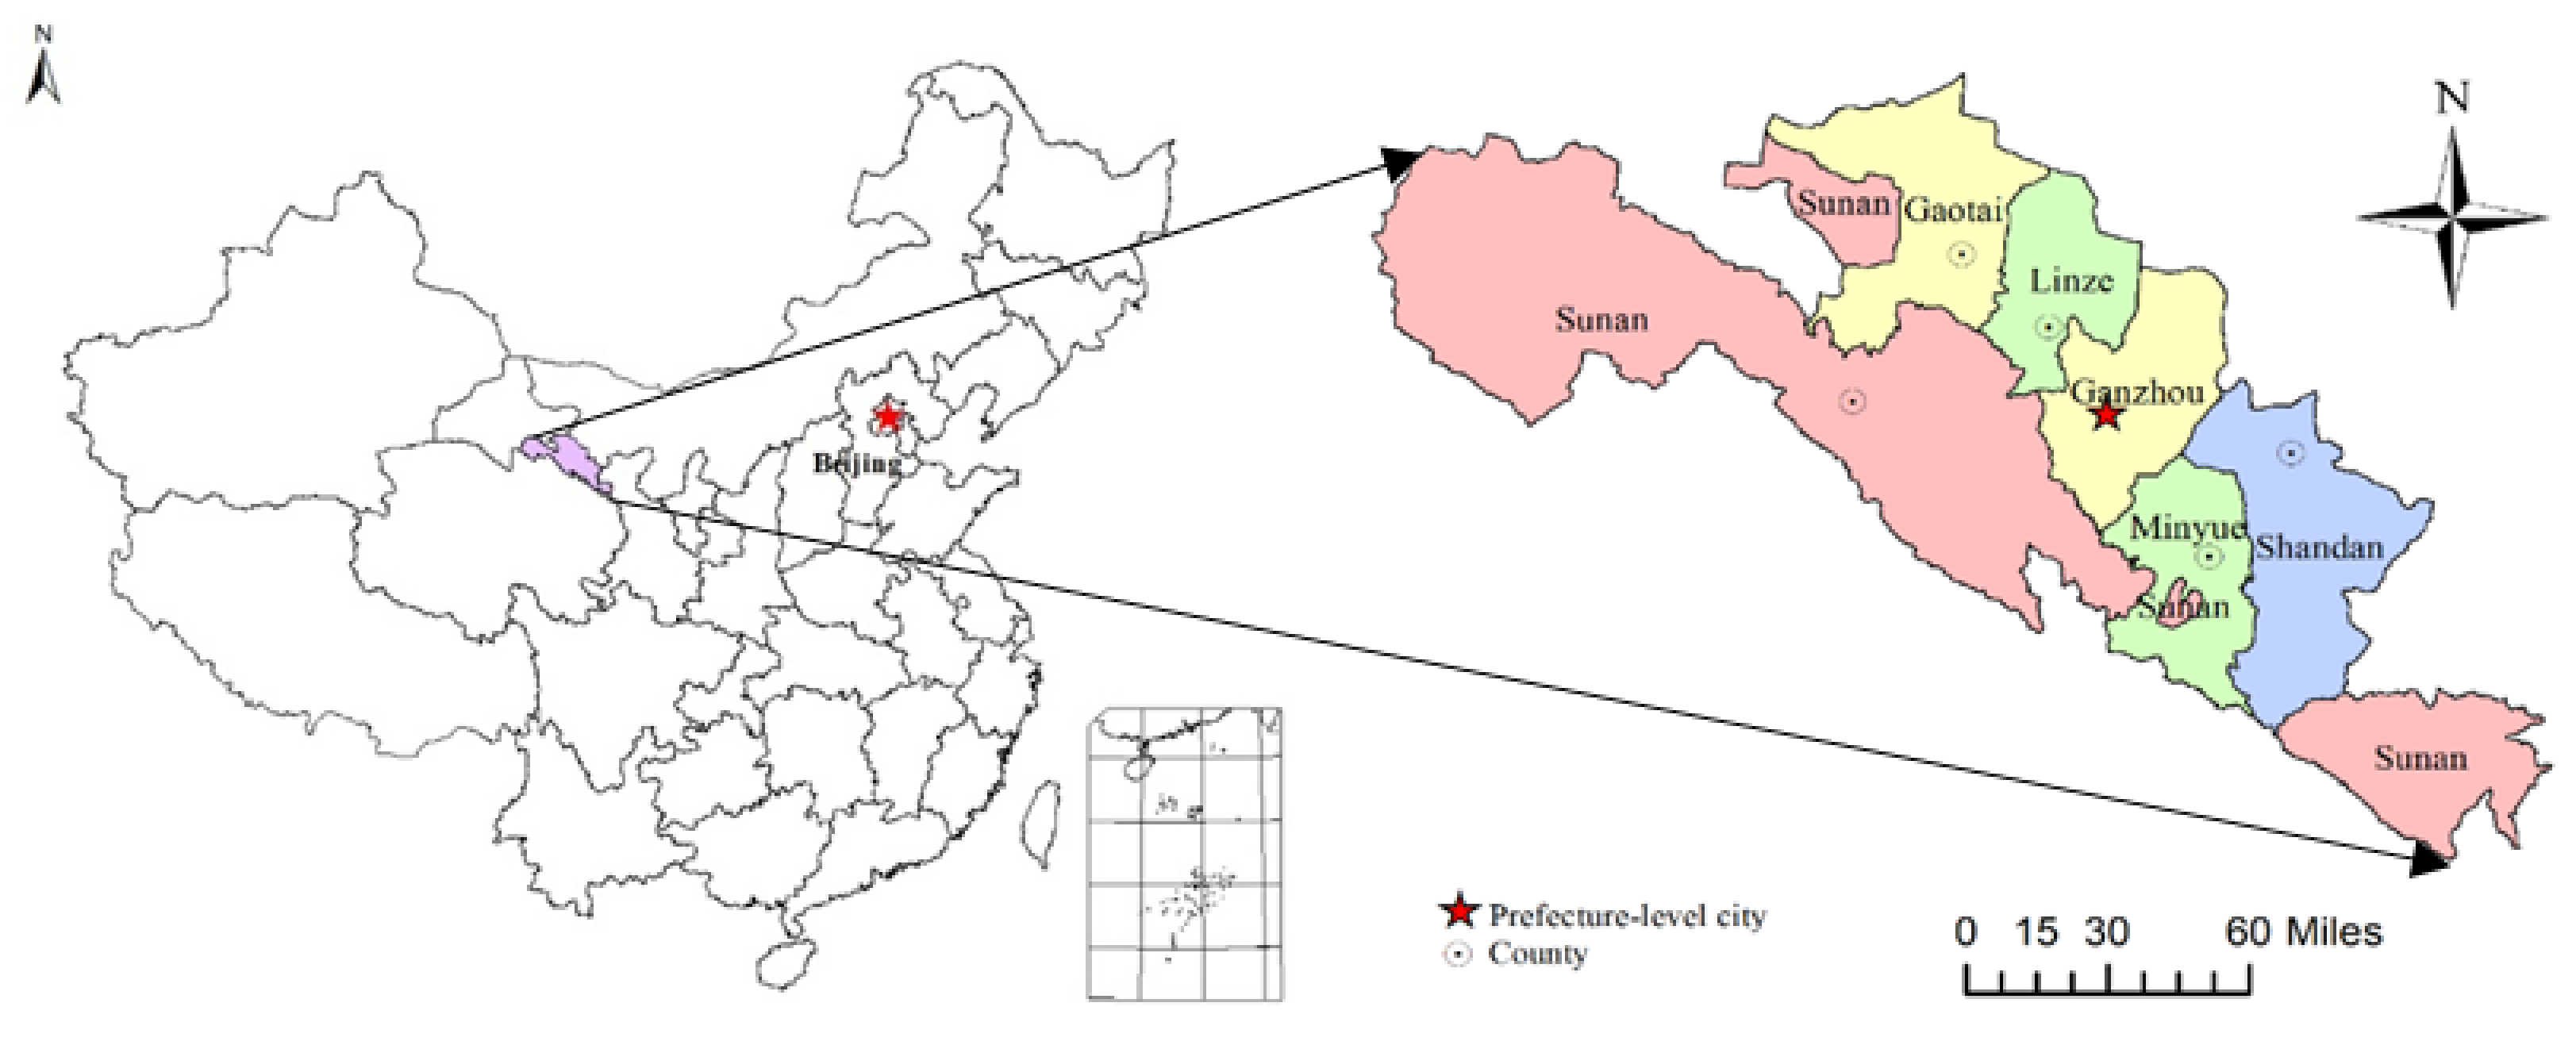
2. Study Area
3. Methodology and Data
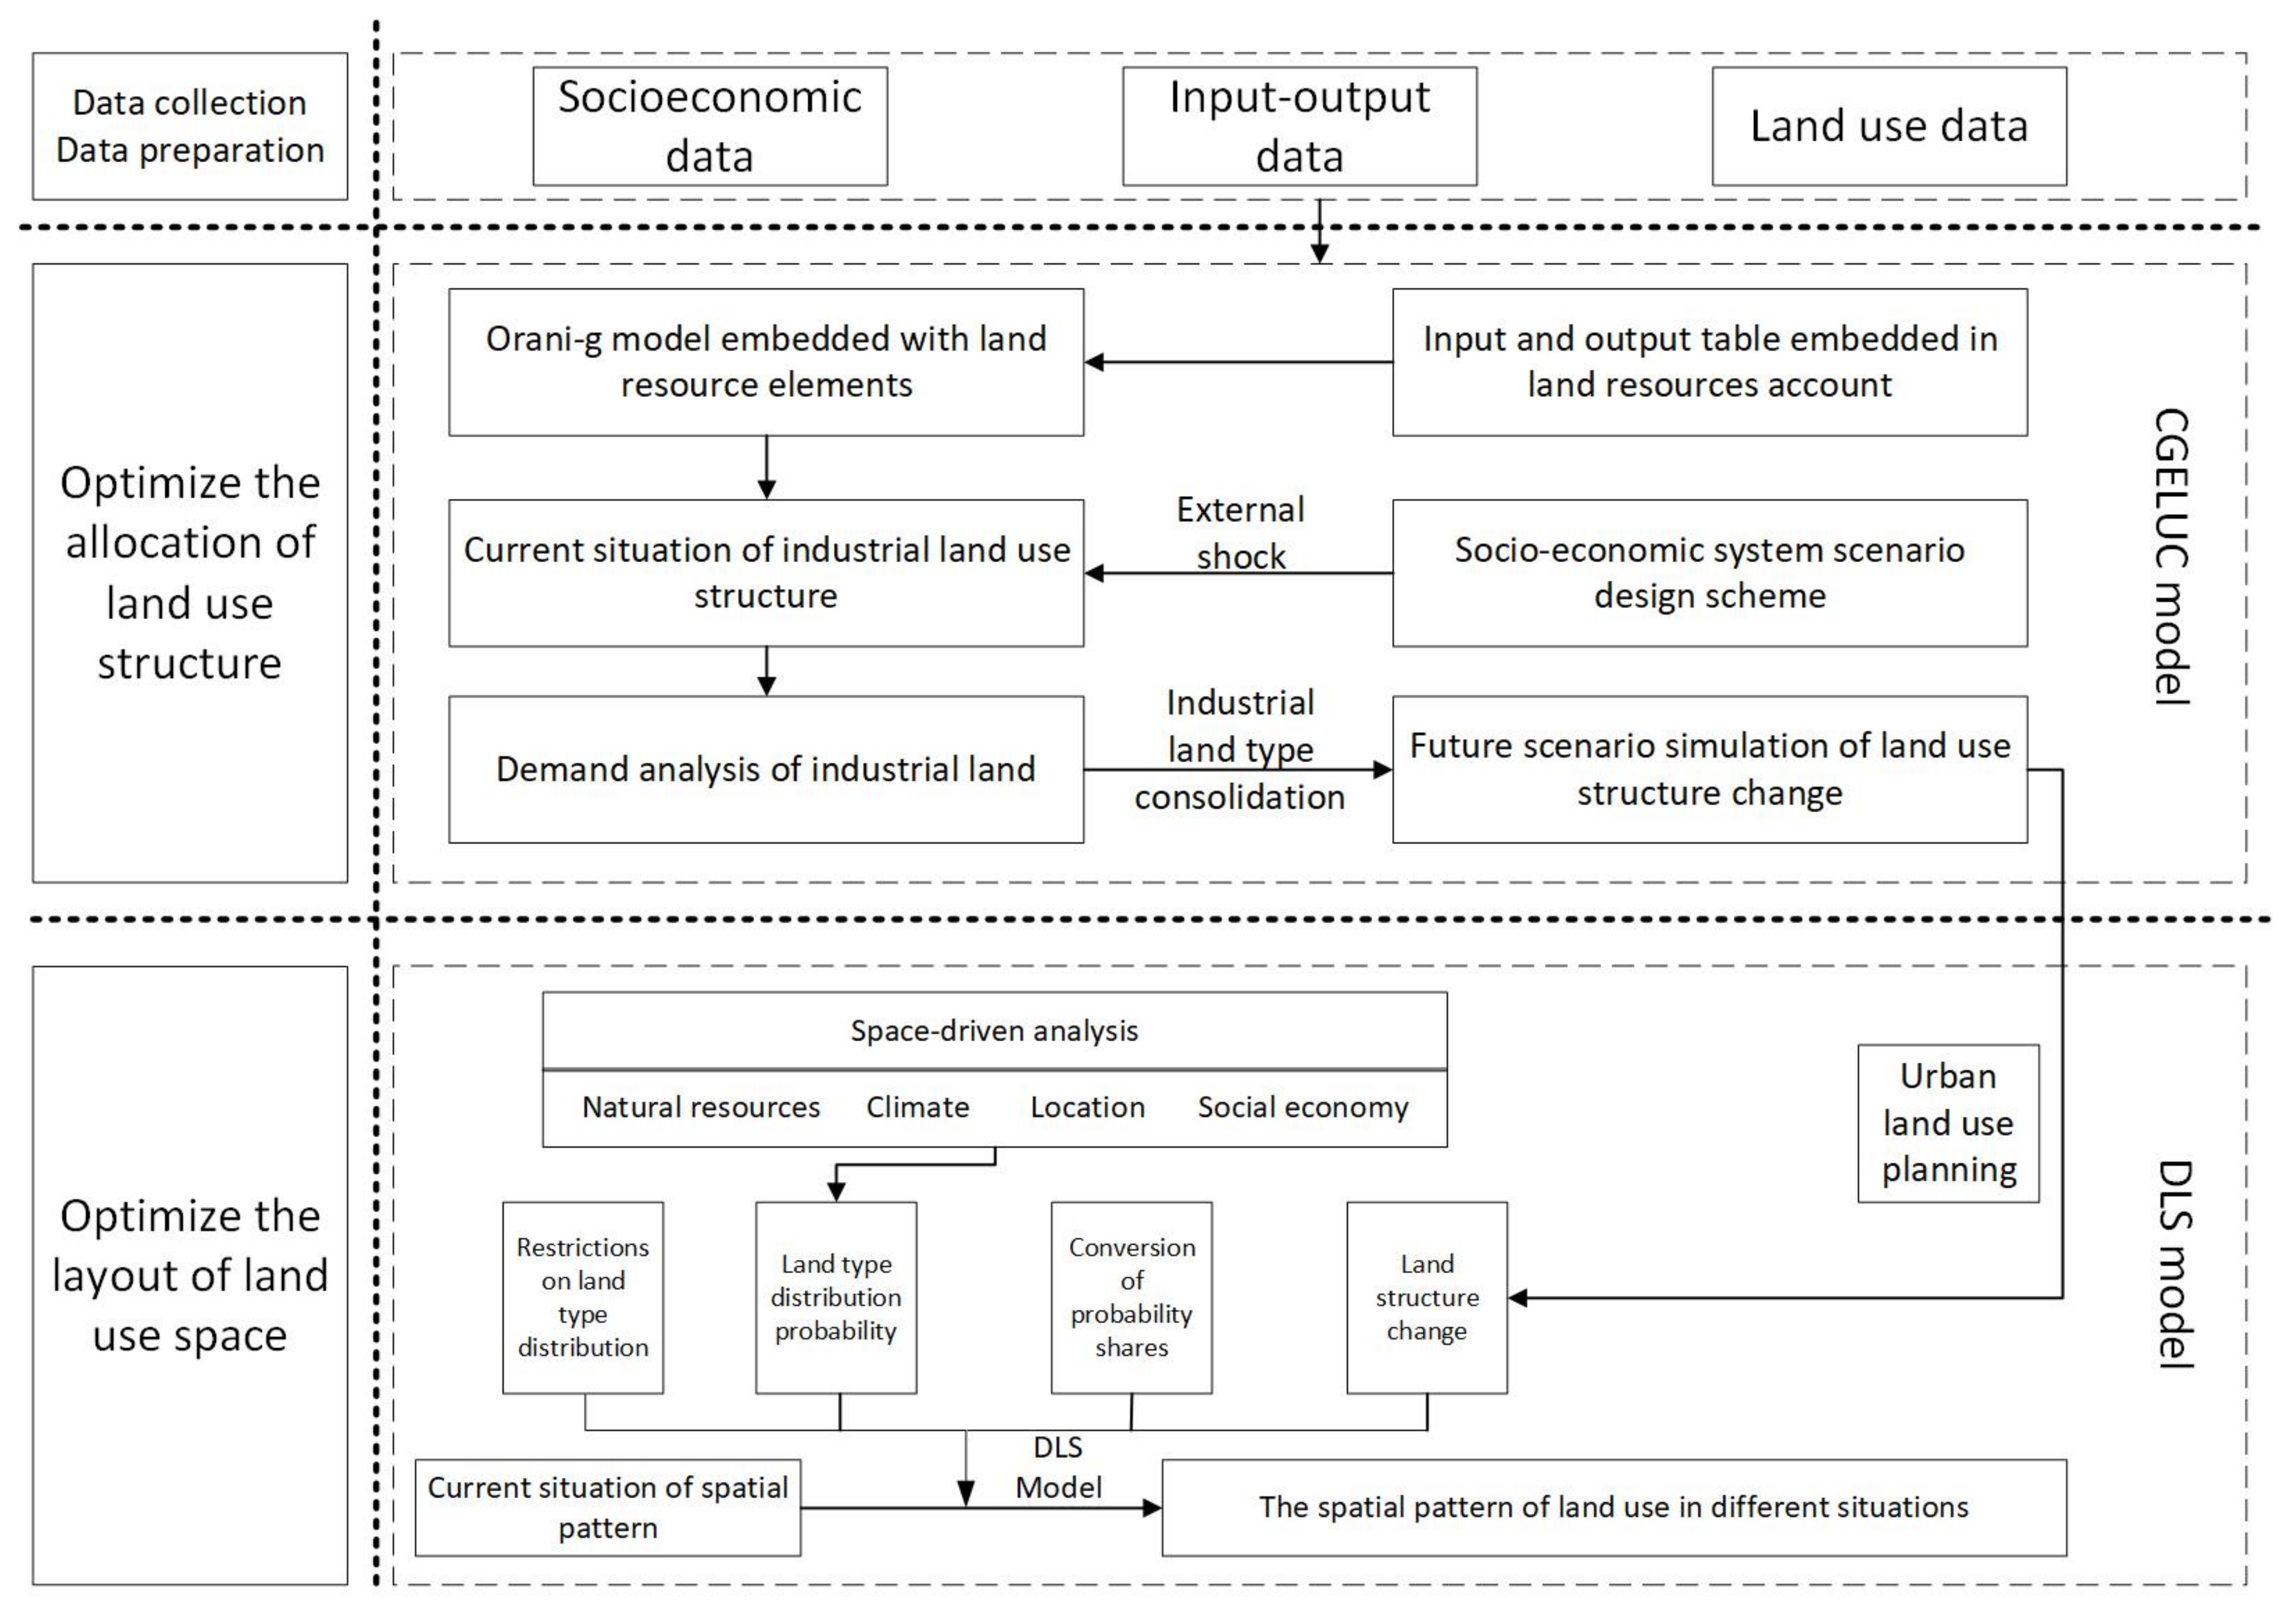
3.1. CGELUC Model
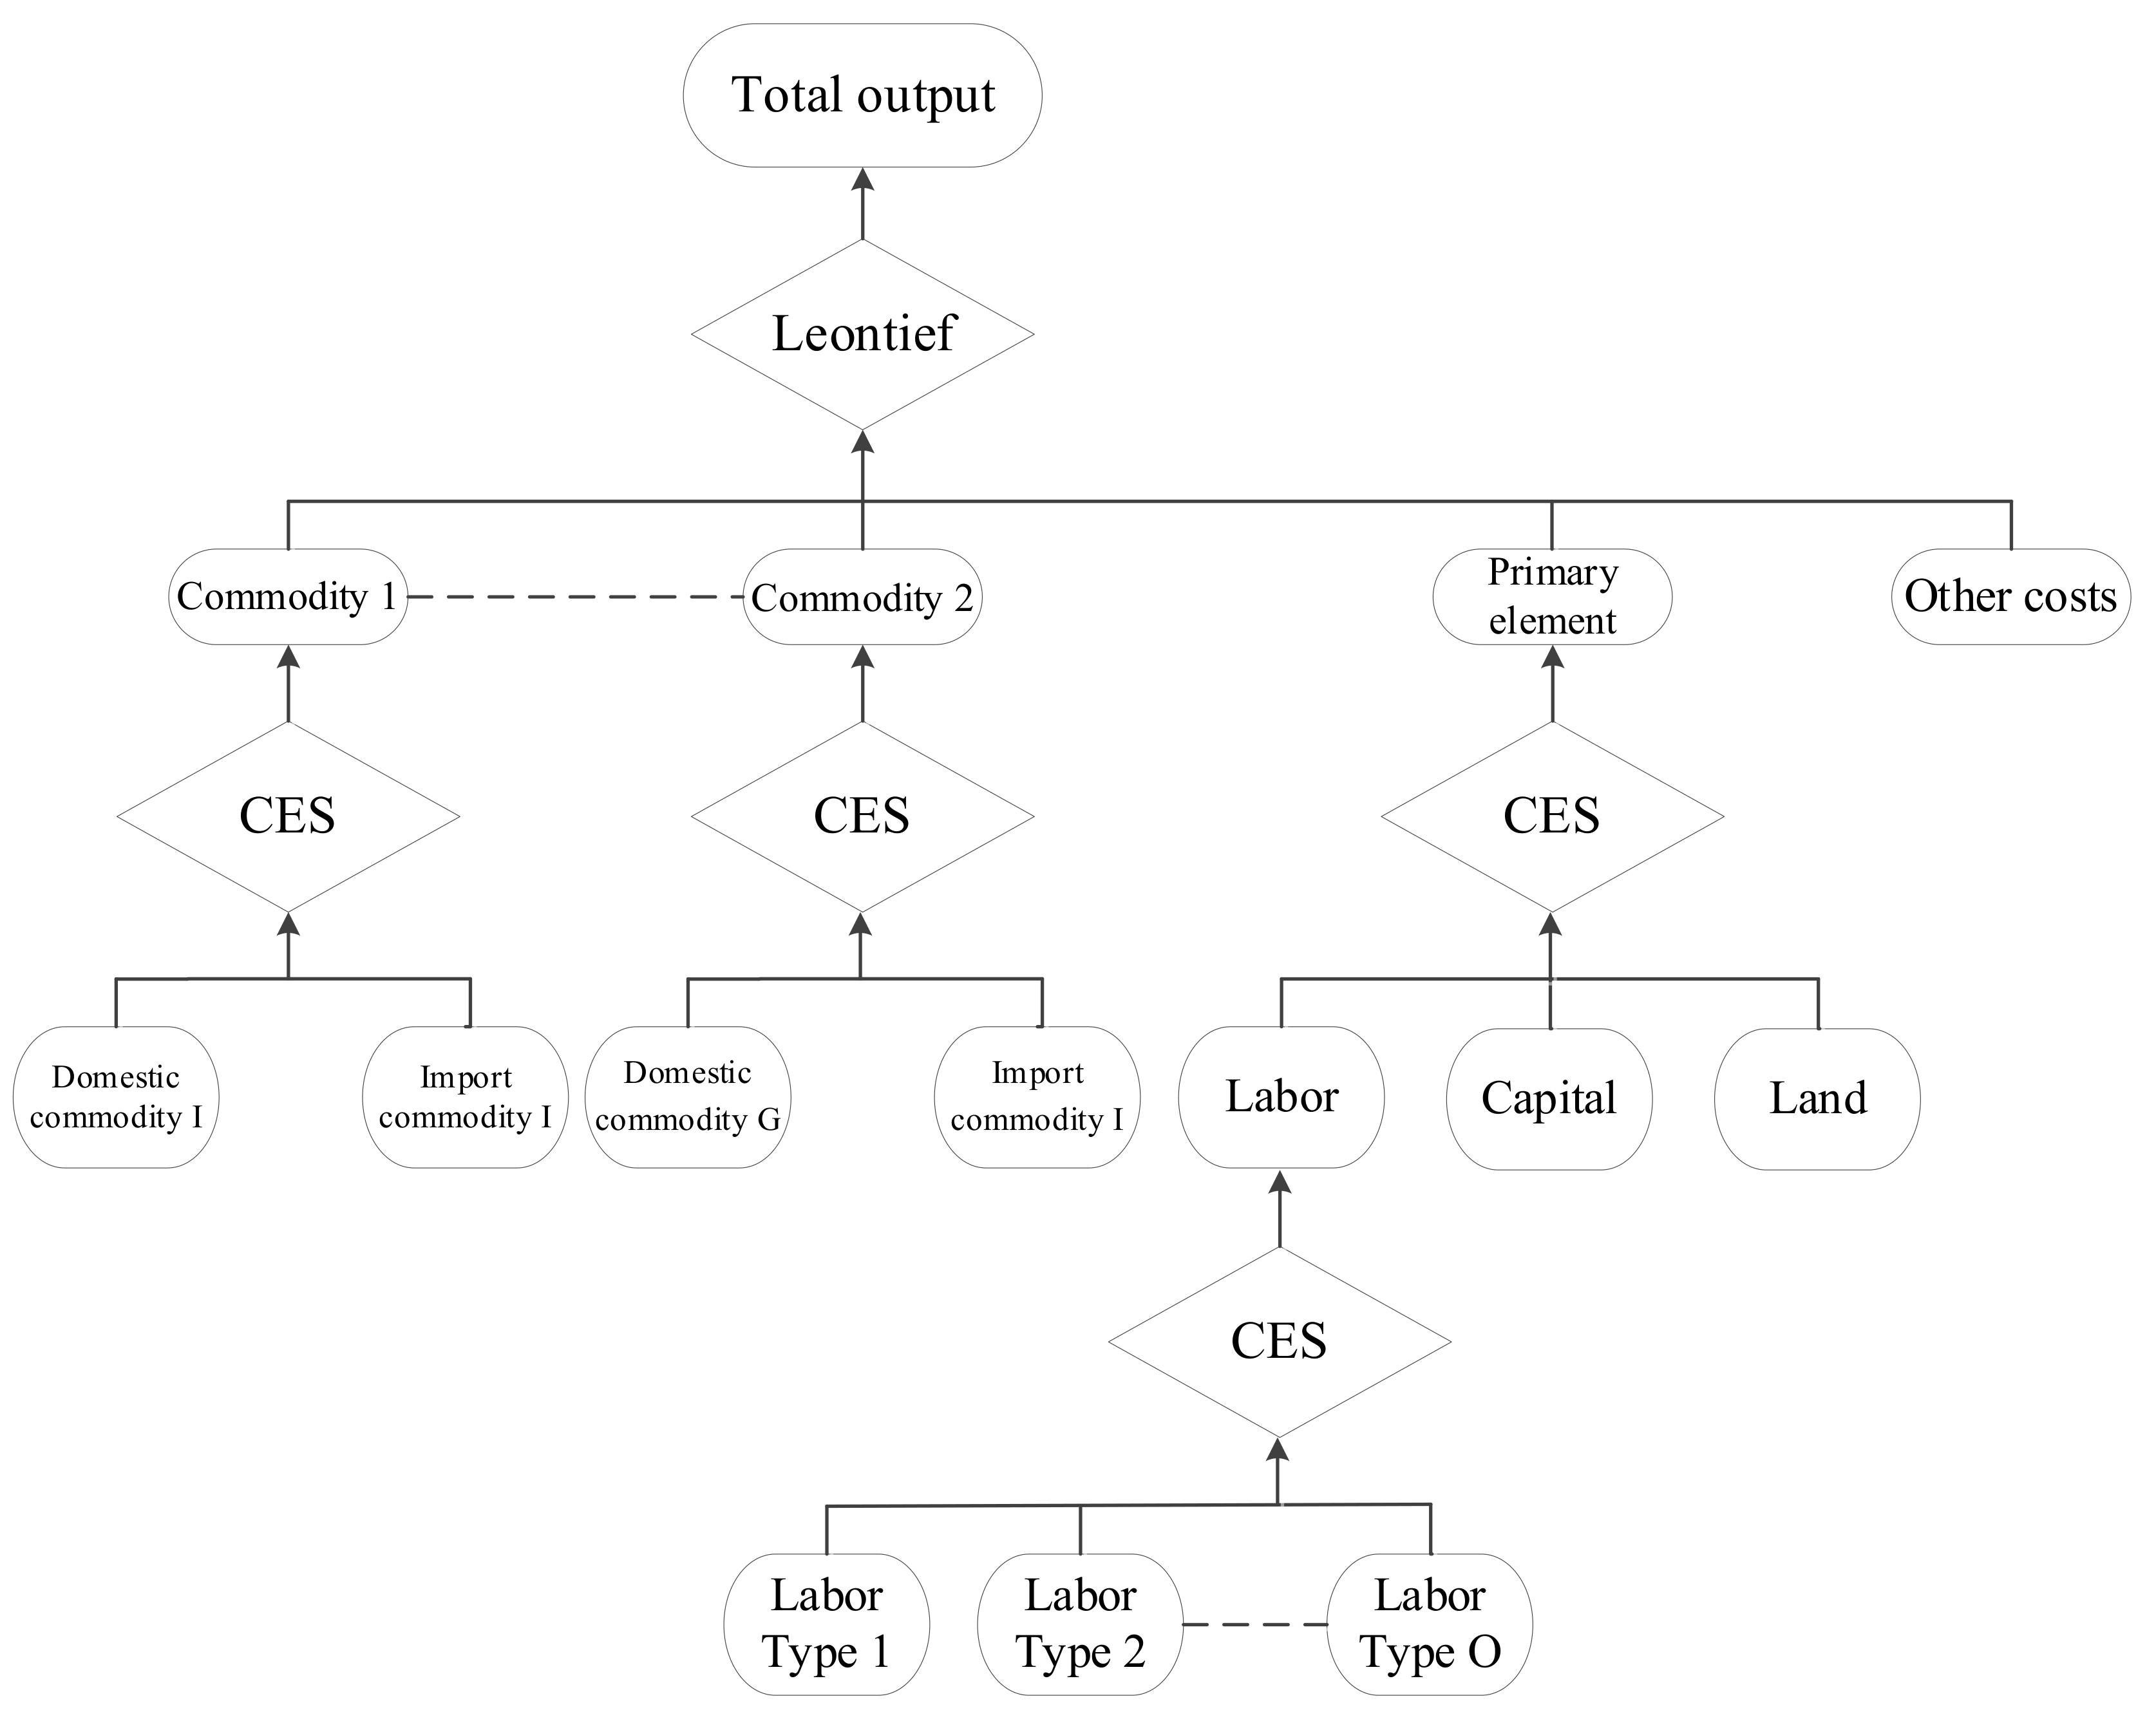
3.1.1. Production Module
3.1.2. Construction of Dynamic Mechanism
3.2. DLS Model
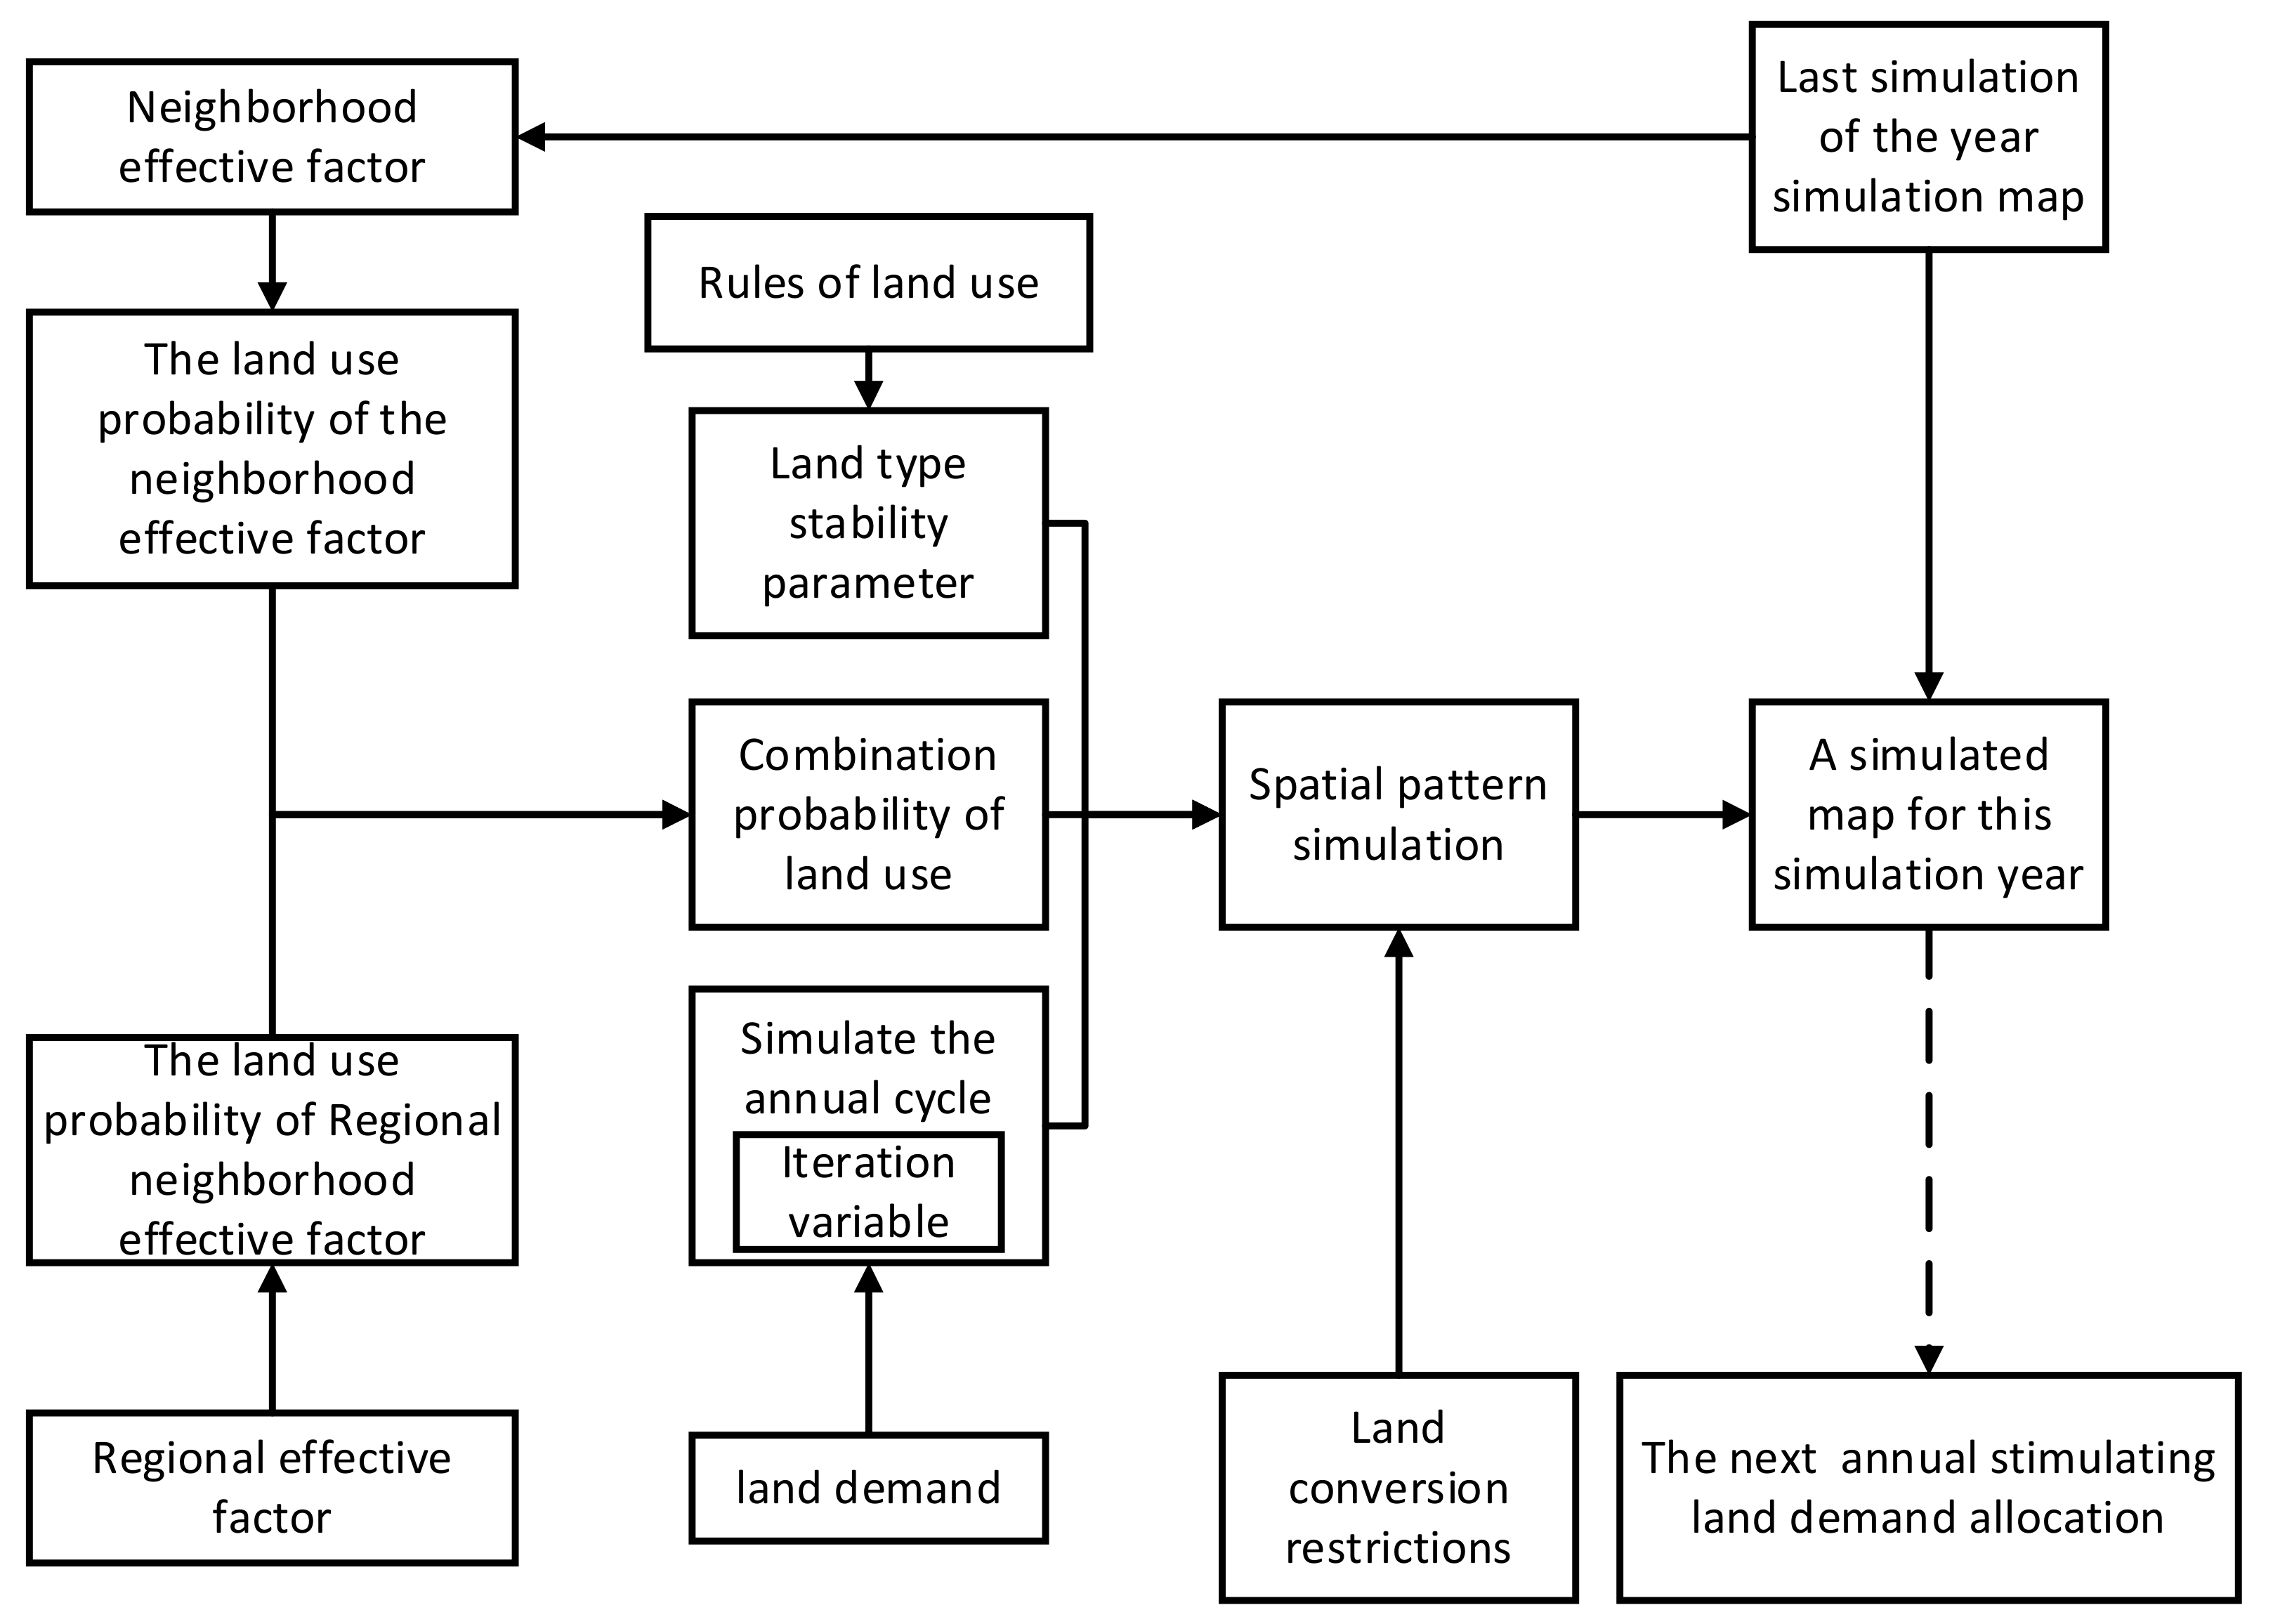
3.2.1. The Structure of DLS
3.2.2. Construction of DLS Model
3.3. Data
3.3.1. Socioeconomic Data
3.3.2. Natural Data
3.3.3. Value Accounting of Land Resources
3.4. Scenario Design
4. Results
4.1. Land Use Change in Social–Economic System under Different Scenarios
4.2. Comparative Analysis of Land Use Structure Changes under Different Scenarios
4.3. Spatial Patterns of Land Use Change under Different Scenarios
5. Discussion
5.1. Industrial Structure Adjustment and Sustainable Land Management
5.2. Urban Development Model Based on Land Use Change
5.3. Future Prospect
- (1)
- The value accounting method of embedding land resources into the value input–output table has a great influence on the accuracy of the model simulation results. Due to the temporal and spatial differences of regional land rent and land transfer price, the value of the three major industrial land types in Zhangye city is relatively simplified by using the unified average price, so it is necessary to carry out more accurate accounting of land resources.
- (2)
- This study addresses three scenarios constrained by socioeconomic development to simulate future land use change in Zhangye city. Combined with the actual situation of the Heihe River Basin, the next step for promoting the research is to carry out scenario design under different environmental development policies, such as water resource constraint scenarios, so as to provide a more comprehensive reference for the optimal allocation of land use for sustainable development.
- (3)
- On the basis of static CGE, the model introduces capital accumulation and future trend of employment to realize a dynamic recursive model for long-term scale simulation and prediction. However, due to the partial delay of capital and investment transformation, the prediction results are unreasonable in the first few years. The model needs to be improved. Besides, we will carry out further studies on land use change and natural resource management on the watershed scale in the Heihe River Basin. Therefore, the CGELUC model will also be improved in cross-regional studies.
6. Conclusions
- (1)
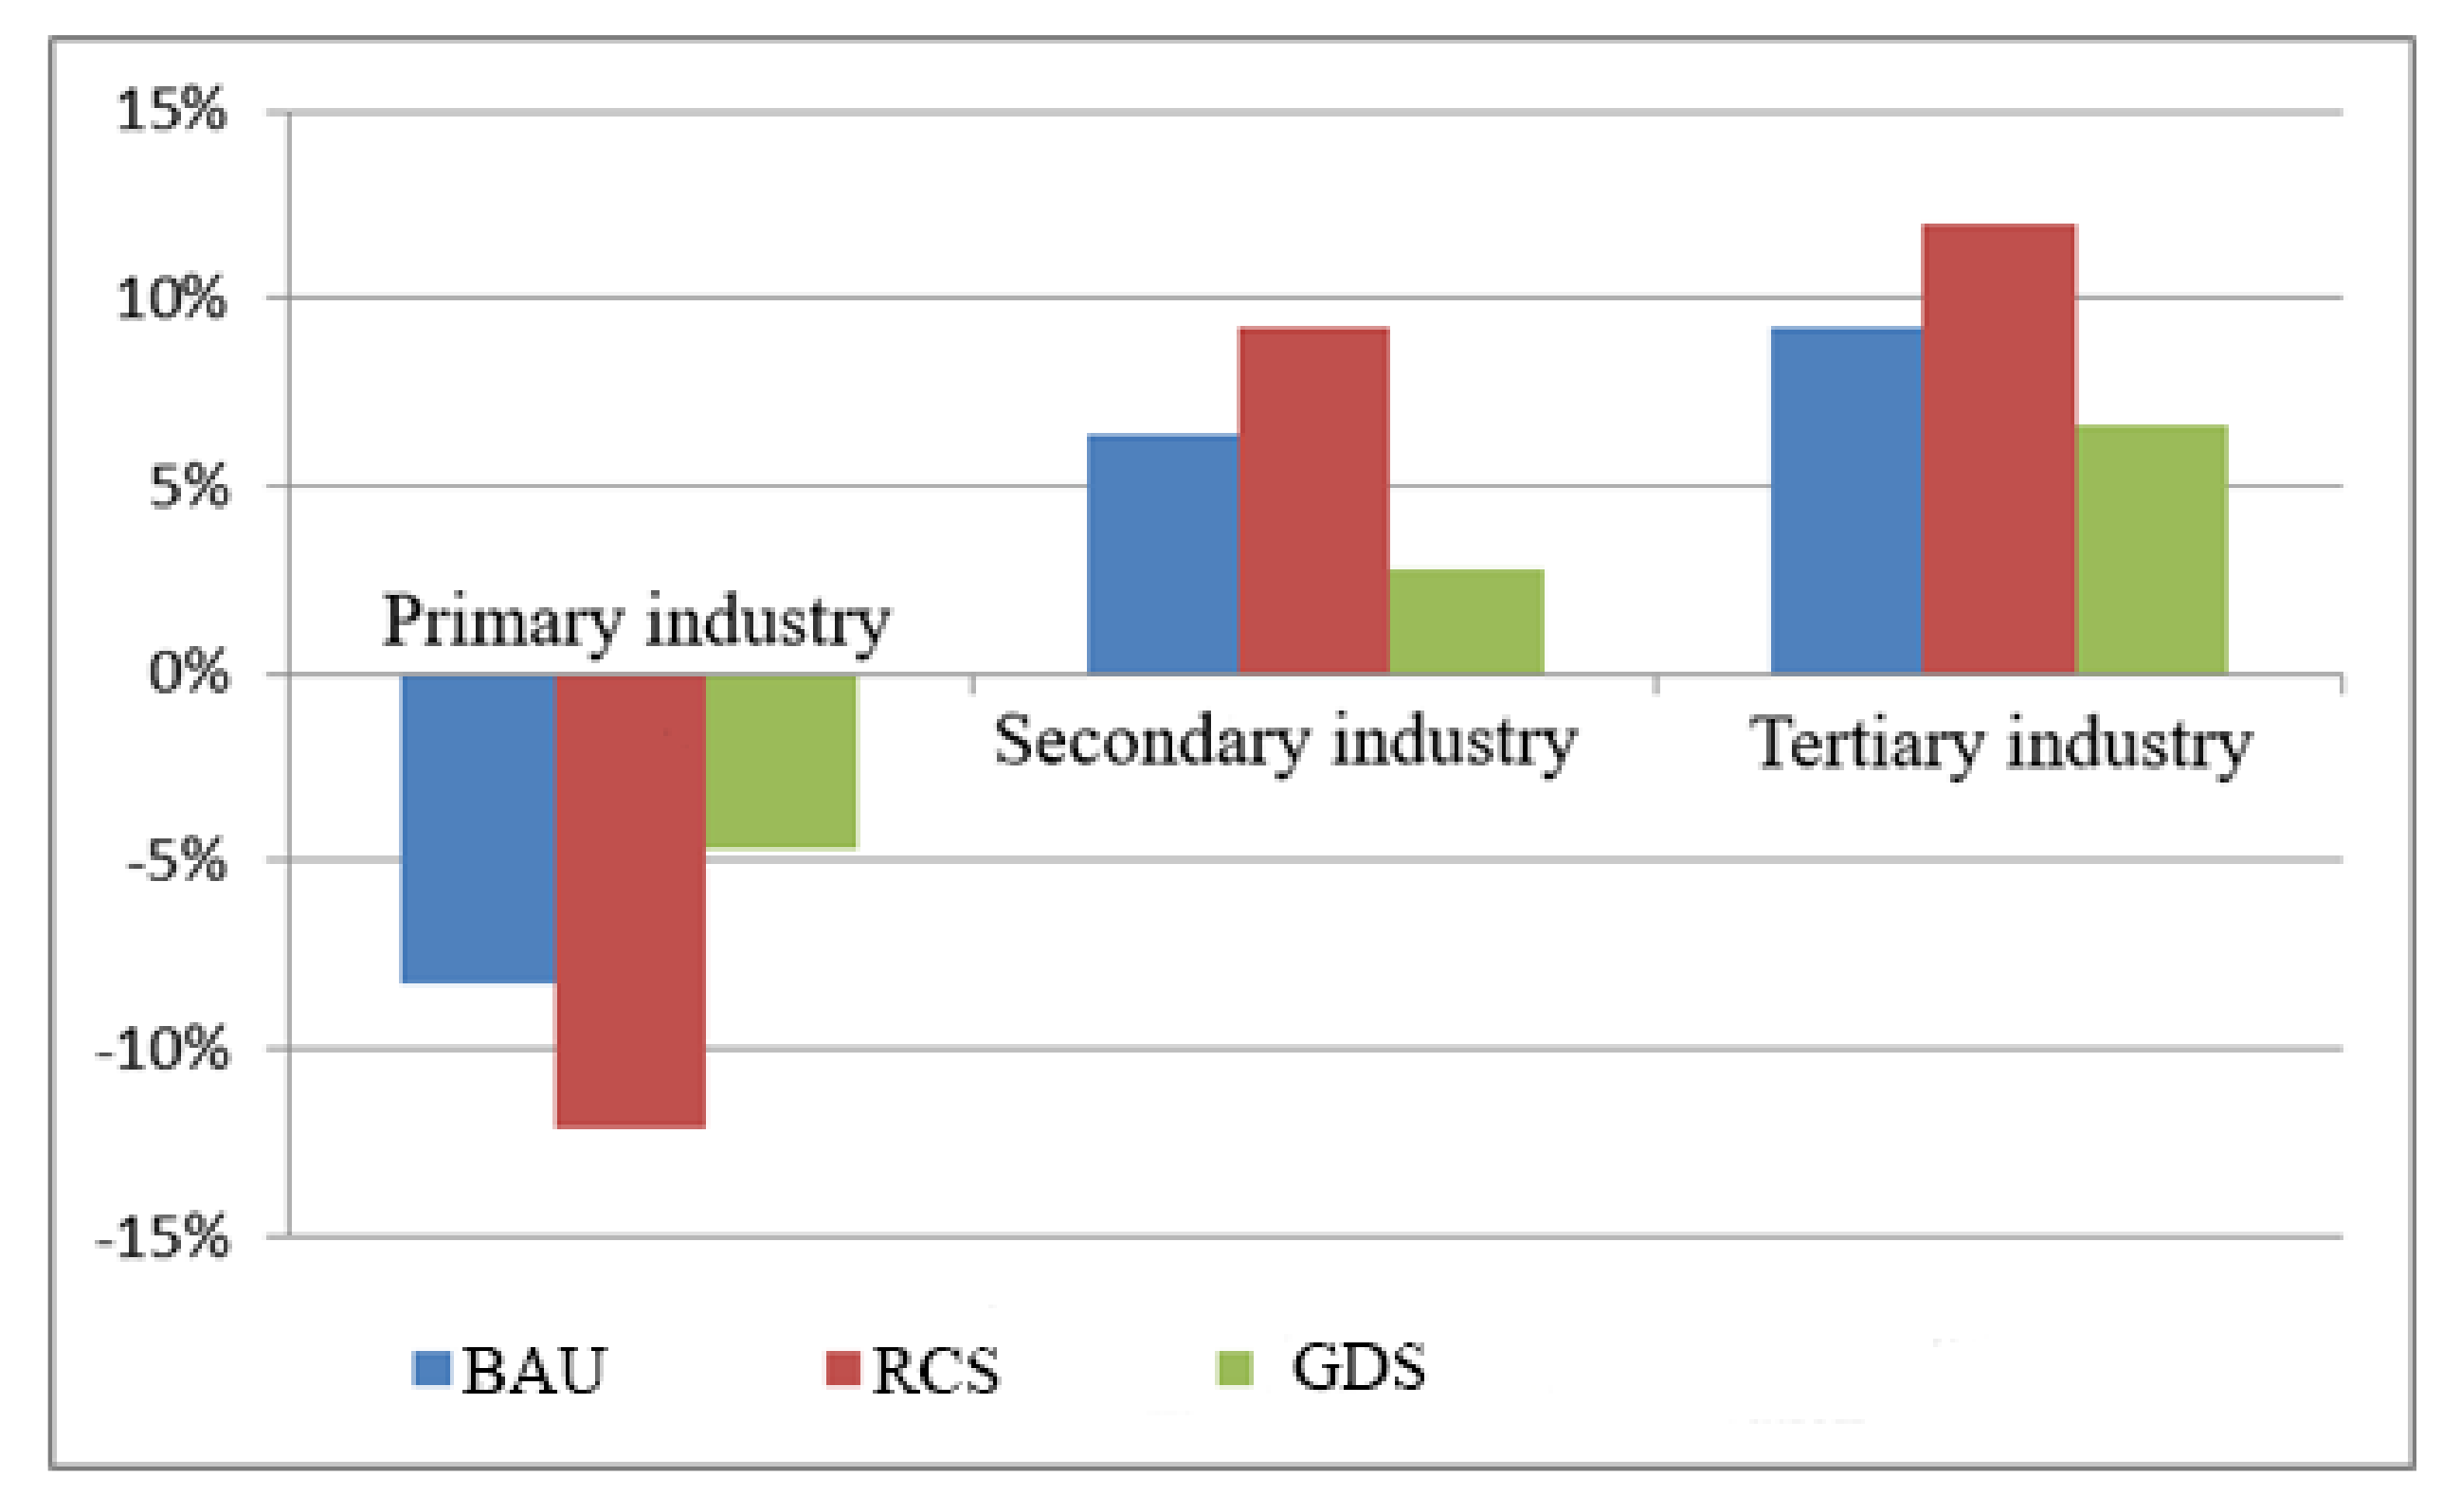
- Analyzing land use demand in the socioeconomic system under future scenarios, it is found that the land use demand in the three scenarios develops in the same development direction, but the degree of change is different—from the least to the greatest, they rank as the green development scenario, the baseline scenario and the resource consumption scenario. From the perspective of industrial structure, the land demand for primary industry is decreasing, the land demand for the secondary and tertiary industries is increasing, and the land demand for the tertiary industry is higher than that of the secondary industry. From the perspective of the internal industrial structure, the land demand for wheat and corn in the agricultural sector is showing a decreasing trend, but the land demand for vegetables and other agricultural sectors is increasing. For the secondary and tertiary industries, except for a few traditional industrial sectors, the land use demand for most sectors is increasing;
- (2)
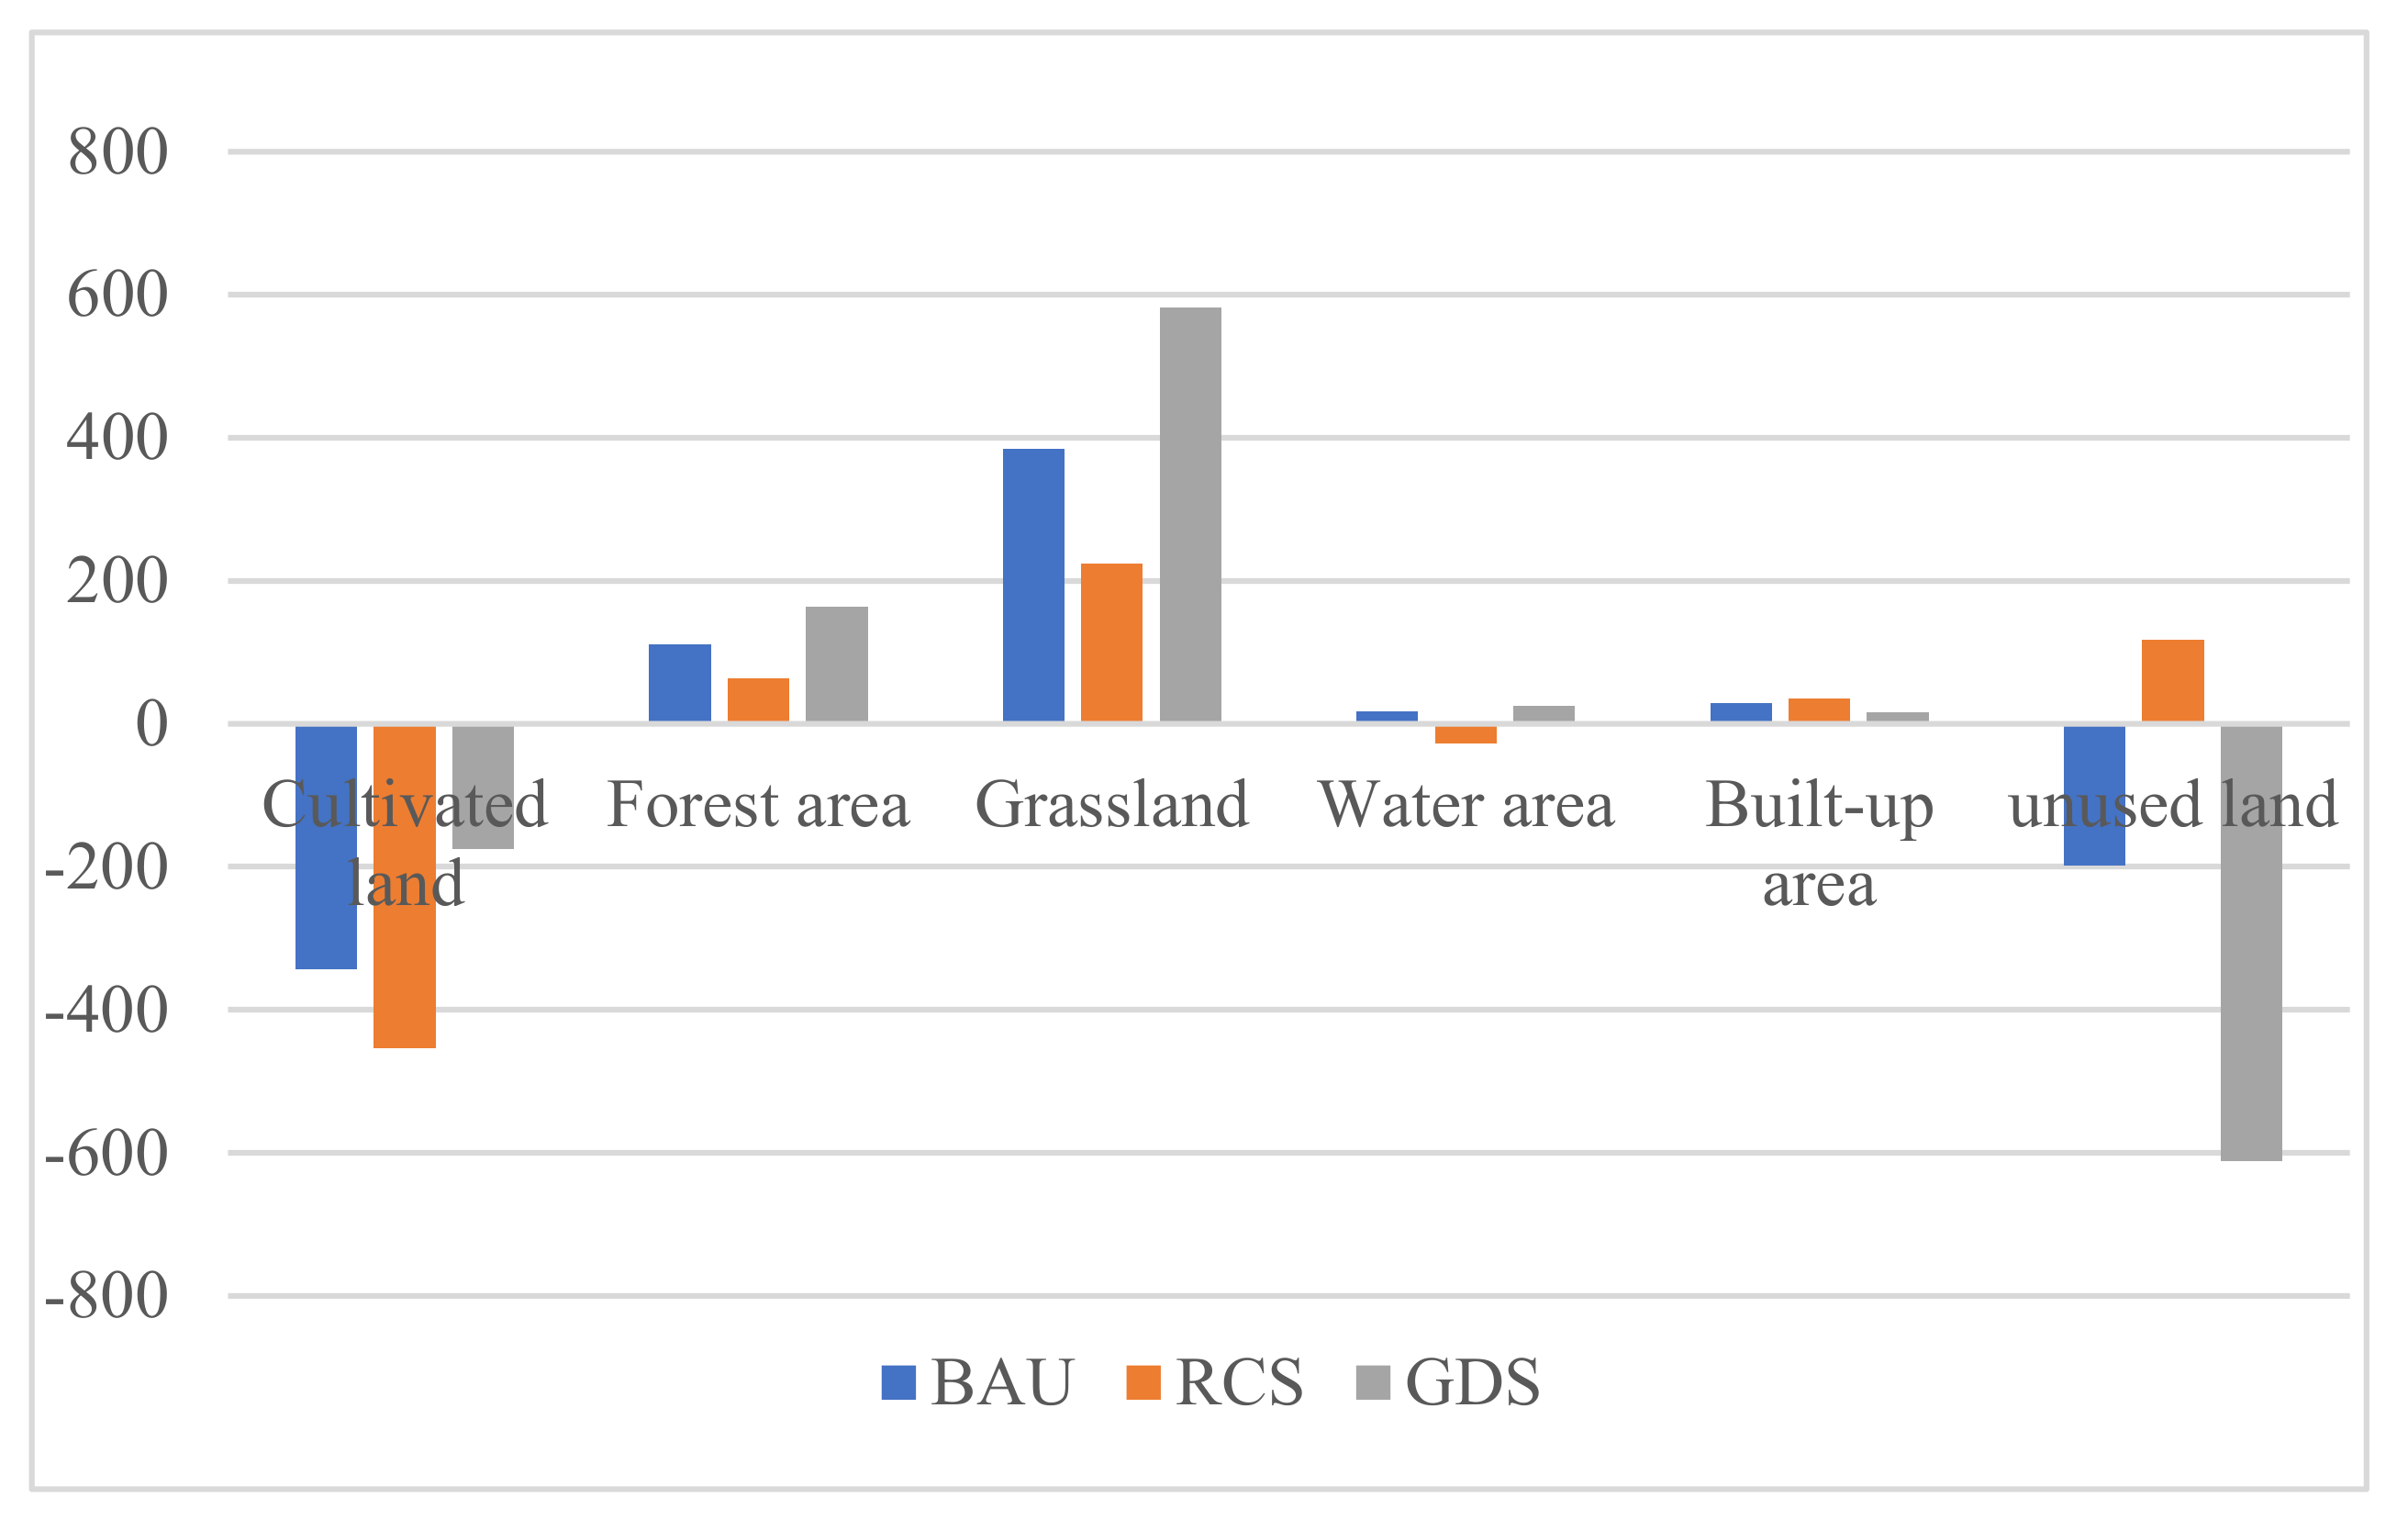
- Analyzing the structure of land use change under future scenarios, it is found that land use change in the three scenarios develops in the same development direction, but the degree of change is different—from the least to the greatest, these are ranked as the green development scenario, the baseline scenario and the resource consumption scenario. The cultivated land decreases by 343 km2 (−8.16%), 453 km2 (−10.89%) and 175 km2 (−4.16%), respectively, under the BAU, RCS and GDS scenarios from 2015 to 2030 in Zhangye city. The built-up area increases by 29 km2 (8.61%), 35 km2 (10.39%) and 16 km2 (4.75%), respectively, under the BAU, RCS and GDS scenarios from 2015 to 2030. To ensure food security, relevant departments should take relevant measures to strengthen the protection of cultivated land and basic farmland, and the cultivated land occupied by construction should be effectively supplemented;
- (3)
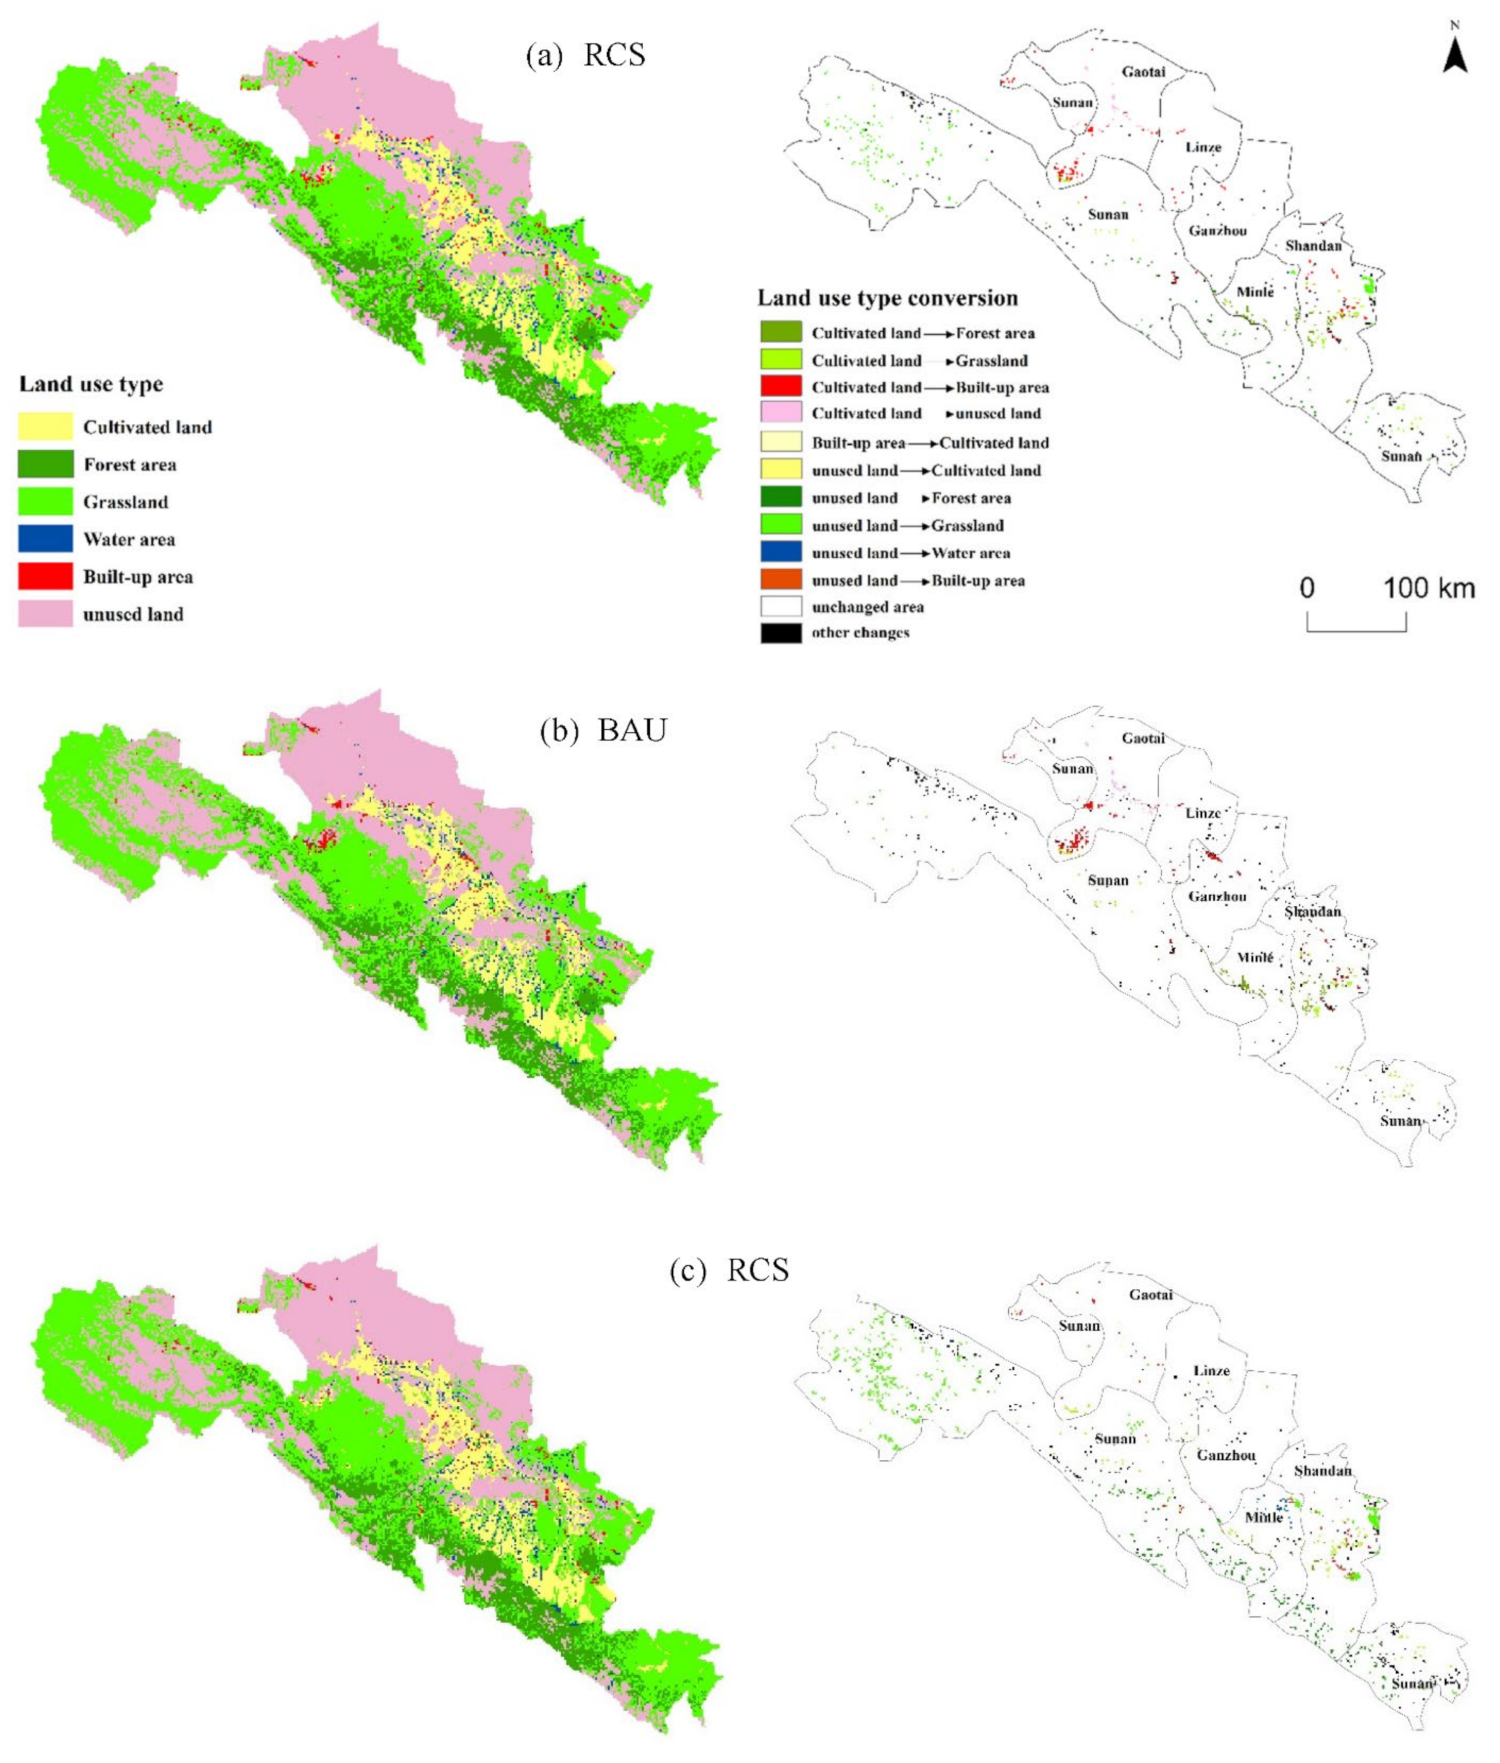
- The simulation results of the spatial patterns of land use in Zhangye city show that the built-up area under the three scenarios undergoes a certain scale of expansion, but the expansion of the resource consumption scenario is the most significant, with contiguous distribution in the northeast of Ganzhou District and the southwest of Gaotai County. The expansion of built-up area under the green development scenario is the slowest, and the spatial patterns are relatively uniform and discrete. Cultivated land has been reduced to a certain extent under three scenarios, especially in the southwest of Gaotai County, Minle County, and central Shandan County. Ecological land is expanding, especially in the green development scenario, with a large reduction in unused land. The conversion of ecological land mainly occurs in Sunan County, the northern part of Gaotai County, and the Heihe Wetland in Ganzhou District and around Dongdashan Nature Reserve. Relevant departments should pay attention to the sensitive areas of land use change, and strictly control the unreasonable conversion of land use, giving consideration to the socioeconomic and ecological benefits of urbanization development.
Author Contributions
Funding
Institutional Review Board Statement
Informed Consent Statement
Data Availability Statement
Conflicts of Interest
Appendix A

| Variables | Description |
|---|---|
| Price of primary factors in sector i | |
| Elasticity of substitution of primary factors in sector i | |
| Price of land in sector i | |
| Price of labor in sector i | |
| Price of capital in sector i | |
| Demand quantity of land in sector i | |
| Demand quantity of labor in sector i | |
| Demand quantity of capital in sector i | |
| Share of land in primary factors in sector i | |
| Share of labor in primary factors in sector i | |
| Share of capital in primary factors in sector i |
Appendix B
| Code | Sector |
|---|---|
| 1 | Wheat |
| 2 | Corn |
| 3 | Oilseed |
| 4 | Cotton |
| 5 | Fruit |
| 6 | Vegetable |
| 7 | Other agriculture |
| 8 | Mining and washing of coal |
| 9 | Extraction of petroleum and natural gas |
| 10 | Mining of metal ores |
| 11 | Mining and processing of nonmetal ores and other ores |
| 12 | Manufacture of foods and tobacco |
| 13 | Manufacture of textiles |
| 14 | Manufacture of textile wearing apparel, footwear, caps, leather, fur, feather (Down) and its products |
| 15 | Processing of timbers and manufacturing of furniture |
| 16 | Papermaking, printing and manufacturing of articles for culture, education and sports activities |
| 17 | Processing of petroleum, coking, processing of nuclear fuel |
| 18 | Chemical industry |
| 19 | Manufacturing of nonmetallic mineral products |
| 20 | Smelting and rolling of metals |
| 21 | Manufacture of metal products |
| 22 | Manufacture of general-purpose and special-purpose machinery |
| 23 | Manufacture of transport equipment |
| 24 | Manufacture of electrical machinery and equipment |
| 25 | Manufacture of communication equipment, computer and other electronic equipment |
| 26 | Manufacture of measuring instrument and machinery for cultural activities and office work |
| 27 | Manufacture of artwork, other manufacture |
| 28 | Scrap and waste |
| 29 | Production and supply of electric power and heat power |
| 30 | Production and distribution of gas |
| 31 | Production and distribution of water |
| 32 | Construction |
| 33 | Traffic, transport and storage |
| 34 | Post |
| 35 | Information transmission, computer services and software |
| 36 | Wholesale and retail trades |
| 37 | Hotels and catering services |
| 38 | Financial intermediation |
| 39 | Real estate |
| 40 | Leasing and business services |
| 41 | Research and experimental development |
| 42 | Comprehensive technical services |
| 43 | Management of water conservancy, environment and public facilities |
| 44 | Services to households and other services |
| 45 | Education |
| 46 | Health, social security and social welfare |
| 47 | Culture, sports and entertainment |
| 48 | Public management and social organization |
References
- Mahmoud, S.H.; Gan, T.Y. Impact of anthropogenic climate change and human activities on environment and ecosystem services in arid regions. Sci. Total Environ. 2018, 633, 1329–1344. [Google Scholar] [CrossRef]
- Bucała, A.; Margielewski, W.; Starkel, L.; Buczek, K.; Zernitskaya, V. The reflection of human activity in the sediments of Iwankowskie Lake from Subatlantic Phase (Polish Outer Carpathians). Geochronometria 2014, 41, 377–391. [Google Scholar] [CrossRef] [Green Version]
- Oldfield, F.; Dearing, J.A. The role of human activities in past environmental change. In Paleoclimate Global Change and the Future; Springer: Berlin/Heidelberg, Germany, 2003; pp. 143–162. [Google Scholar]
- Hou, K.; Wen, J. Quantitative analysis of the relationship between land use and urbanization development in typical arid areas. Environ. Sci. Pollut. Res. 2020, 31, 38758–38768. [Google Scholar] [CrossRef]
- Du, S.; Shi, P.; Van Rompaey, A. The relationship between urban sprawl and farmland displacement in the Pearl River Delta China. Land 2014, 3, 34–51. [Google Scholar] [CrossRef] [Green Version]
- Xie, Y.; Wang, G.; Wang, X.; Fan, P. Assessing the evolution of oases in arid regions by reconstructing their historic spatio-temporal distribution: A case study of the Heihe River Basin, China. Front. Earth Sci. 2017, 11, 629–642. [Google Scholar] [CrossRef]
- Li, Z.; Deng, X.; Jin, G.; Mohmmed, A.; Arowolo, A.O. Tradeoffs between agricultural production and ecosystem services: A case study in Zhangye 2005, Northwest China. Sci. Total. Environ. 2020, 707, 136032. [Google Scholar] [CrossRef] [PubMed]
- Wang, C.; Jiang, Q.O.; Shao, Y.; Sun, S.; Xiao, L.; Guo, J. Ecological environment assessment based on land use simulation: A case study in the Heihe River Basin. Sci. Total. Environ. 2019, 697, 133928. [Google Scholar] [CrossRef]
- Yang, B.; Zheng, W.; Ke, X. Forecasting of Industrial Water Demand Using Case-Based Reasoning—A Case Study in Zhangye City, China. Water 2017, 9, 626. [Google Scholar] [CrossRef] [Green Version]
- Luo, Q.; Luo, L.; Zhou, Q.; Song, Y. Does China’s Yangtze River Economic Belt policy impact on local ecosystem services? Sci. Total. Environ. 2019, 676, 231–241. [Google Scholar] [CrossRef]
- Zhou, S.; Huang, Y.; Yu, B.; Wang, G. Effects of human activities on the eco-environment in the middle Heihe River Basin based on an extended environmental Kuznets curve model. Ecol. Eng. 2015, 76, 14–26. [Google Scholar] [CrossRef]
- Luo, W.; Ren, Y.; Shen, L.; Zhu, M.; Jiang, Y.; Meng, C.; Zhang, P. An evolution perspective on the urban land carrying capacity in the urbanization era of China. Sci. Total. Environ. 2020, 744, 140827. [Google Scholar] [CrossRef]
- Xiong, Y.; Chen, Y.; Peng, F.; Li, J.; Yan, X. Analog simulation of urban construction land supply and demand in Chang-Zhu-Tan Urban Agglomeration based on land intensive use. J. Geogr. Sci. 2019, 29, 1346–1362. [Google Scholar] [CrossRef] [Green Version]
- Liang, J.; Zhong, M.; Zeng, G.; Chen, G.; Hua, S.; Li, X.; Yuan, Y.; Wu, H.; Gao, X. Risk management for optimal land use planning integrating ecosystem services values: A case study in Changsha, Middle China. Sci. Total. Environ. 2017, 579, 1675–1682. [Google Scholar] [CrossRef]
- Xie, H.; Chen, Q.; Lu, F.; Wu, Q.; Wang, W. Spatial-temporal disparities, saving potential and influential factors of industrial land use efficiency: A case study in urban agglomeration in the middle reaches of the Yangtze River. Land Use Policy 2018, 75, 518–529. [Google Scholar] [CrossRef]
- Gao, X.; Zhang, A.; Sun, Z. How regional economic integration influence on urban land use efficiency? A case study of Wuhan metropolitan area, China. Land Use Policy 2020, 90, 104329. [Google Scholar] [CrossRef]
- Liu, Y.; Zhang, Z.; Zhou, Y. Efficiency of construction land allocation in China: An econometric analysis of panel data. Land Use Policy 2018, 74, 261–272. [Google Scholar] [CrossRef]
- Chuvieco, E. Integration of linear programming and GIS for land-use modelling. Int. J. Geogr. Inf. Sci. 1993, 7, 71–83. [Google Scholar] [CrossRef]
- Arthur, J.L.; Nalle, D.J. Clarification on the use of linear programming and GIS for land-use modelling. Int. J. Geogr. Inf. Sci. 1997, 11, 397–402. [Google Scholar] [CrossRef]
- Makowski, D.; Hendrix, E.M.; van Ittersum, M.K.; Rossing, W.A. A framework to study nearly optimal solutions of linear programming models developed for agricultural land use exploration. Ecol. Model. 2000, 131, 65–77. [Google Scholar] [CrossRef] [Green Version]
- Wang, H.; Gao, Y.; Liu, Q.; Song, J. Land use allocation based on interval multi-objective linear programming model: A case study of Pi County in Sichuan Province. Chin. Geogr. Sci. 2010, 20, 176–183. [Google Scholar] [CrossRef]
- Chang, Y.C.; Ko, T.T. An interactive dynamic multi-objective programming model to support better land use planning. Land Use Policy 2014, 36, 13–22. [Google Scholar] [CrossRef] [Green Version]
- Zhang, H.; Zeng, Y.; Jin, X.; Shu, B.; Zhou, Y.; Yang, X. Simulating multi-objective land use optimization allocation using Multi-agent system—A case study in Changsha, China. Ecol. Model. 2016, 320, 334–347. [Google Scholar] [CrossRef]
- Shen, Q.; Chen, Q.; Tang, B.S.; Yeung, S.; Hu, Y.; Cheung, G. A system dynamics model for the sustainable land use planning and development. Habitat Int. 2009, 33, 15–25. [Google Scholar] [CrossRef]
- Rasmussen, L.V.; Rasmussen, K.; Reenberg, A.; Proud, S. A system dynamics approach to land use changes in agro-pastoral systems on the desert margins of Sahel. Agric. Syst. 2012, 107, 56–64. [Google Scholar] [CrossRef]
- Lauf, S.; Haase, D.; Hostert, P.; Lakes, T.; Kleinschmit, B. Uncovering land-use dynamics driven by human decision-making—A combined model approach using cellular automata and system dynamics. Environ. Model. Softw. 2012, 27, 71–82. [Google Scholar] [CrossRef]
- Liu, X.; Ou, J.; Li, X.; Ai, B. Combining system dynamics and hybrid particle swarm optimization for land use allocation. Ecol. Model. 2013, 257, 11–24. [Google Scholar] [CrossRef]
- Hertel, T.W.; Rose, S.; Richard, S. Land use in computable general equilibrium models: An overview. In Economic Analysis of Land Use in Global Climate Change Policy; Routledge Press: London, UK, 2009; pp. 3–30, Chapter 1. [Google Scholar]
- Laborde, D.; Valin, H. Modeling land-use changes in a global CGE: Assessing the EU biofuel mandates with the MIRAGE-BioF model. Clim. Chang. Econ. 2012, 3, 1250017. [Google Scholar] [CrossRef]
- Weng, Y.; Chang, S.; Cai, W.; Wang, C. Exploring the impacts of biofuel expansion on land use change and food security based on a land explicit CGE model: A case study of China. Appl. Energy 2019, 236, 514–525. [Google Scholar] [CrossRef]
- Luo, P.; Cao, X.; Li, H.; Li, M. Dynamic simulation of land use change in shenzhen city based on Markov-logistic-CA models. In Proceedings of the 2010 18th International Conference on Geoinformatics, Beijing, China, 18–20 June 2010; pp. 1–4. [Google Scholar]
- He, R.; Liu, S.; Liu, Y. Application of SD model in Analyzing the Cultivated Land Carrying Capacity: A Case Study in Bijie Prefecture, Guizho Province, China. Procedia Environ. Sci. 2011, 10, 1985–1991. [Google Scholar] [CrossRef] [Green Version]
- Fujimori, S.; Hasegawa, T.; Masui, T.; Takahashi, K. Land use representation in a global CGE model for long-term simulation: CET vs. logit functions. Food Secur. 2014, 5, 685–699. [Google Scholar] [CrossRef]
- Zhan, J.; Sun, Z.; Wang, Z.; Chen, J.; Li, Z. Simulated water productivity in Gansu Province, China. Phys. Chem. Earth Parts A B C 2015, 79, 67–75. [Google Scholar] [CrossRef]
- Sun, Z.; Wu, F.; Shi, C.; Zhan, J. The impact of land use change on water balance in Zhangye city, China. Phys. Chem. Earth Parts A B C 2016, 96, 64–73. [Google Scholar] [CrossRef]
- Alavalapati, J.; White, B.; Jagger, P.; Wellstead, A. Effect of land use restrictions on the economy of Alberta: A computable general equilibrium analysis. Can. J. Reg. Sci. 1996, 19, 349–366. [Google Scholar]
- Olatubi, W.O.; Hughes, D.W. Natural resource and environmental policy trade-offs: A CGE analysis of the regional impact of the Wetland Reserve Program. Land Use Policy 2002, 19, 231–241. [Google Scholar] [CrossRef]
- Lee, H.L. The GTAP Land Use Data Base and the GTAPE-AEZ Model: Incorporating agro-ecologically zoned land use data and land-based greenhouse gases emissions into the GTAP Framework. In Proceedings of the 8th Annual Conference on Global Economic Analysis, Lübeck, Germany, 26 November 2020. [Google Scholar]
- Perry, M. Food Production vs. Biomass Export vs. Land-use Change: A CGE Analysis for Argentina. 2008. Available online: https://mpra.ub.uni-muenchen.de/13442/ (accessed on 1 April 2020).
- Liu, Y.; Hu, X.; Zhang, Q.; Zheng, M. Improving agricultural water use efficiency: A quantitative study of Zhangye city using the static CGE model with a CES water—Land resources account. Sustainability 2017, 9, 308. [Google Scholar] [CrossRef] [Green Version]
- Bai, Y.; Deng, X.; Cheng, Y.; Hu, Y.; Zhang, L. Exploring regional land use dynamics under shared socioeconomic pathways: A case study in Inner Mongolia, China. Technol. Forecast. Soc. Chang. 2021, 166, 120606. [Google Scholar] [CrossRef]
- Jiang, W.; Chen, Z.; Lei, X.; Jia, K.; Wu, Y. Simulating urban land use change by incorporating an autologistic regression model into a CLUE-S model. J. Geogr. Sci. 2015, 25, 836–850. [Google Scholar] [CrossRef] [Green Version]
- Zare, M.; Samani, A.N.; Mohammady, M.; Salmani, H.; Bazrafshan, J. Investigating effects of land use change scenarios on soil erosion using CLUE-s and RUSLE models. Int. J. Environ. Sci. Technol. 2017, 14, 1905–1918. [Google Scholar] [CrossRef]
- Kucsicsa, G.; Popovici, E.A.; Bălteanu, D.; Grigorescu, I.; Dumitraşcu, M.; Mitrică, B. Future land use/cover changes in Romania: Regional simulations based on CLUE-S model and CORINE land cover database. Landsc. Ecol. Eng. 2019, 15, 75–90. [Google Scholar] [CrossRef]
- Spies, T.A.; White, E.; Ager, A.; Kline, J.D.; Bolte, J.P.; Platt, E.K.; Csuti, B. Using an agent-based model to examine forest management outcomes in a fire-prone landscape in Oregon, USA. Ecol. Soc. 2017, 22, 1. [Google Scholar] [CrossRef] [Green Version]
- Suwarno, A.; van Noordwijk, M.; Weikard, H.P.; Suyamto, D. Indonesia’s forest conversion moratorium assessed with an agent-based model of Land-Use Change and Ecosystem Services (LUCES). Mitig. Adapt. Strateg. Glob. Chang. 2018, 23, 211–229. [Google Scholar] [CrossRef] [Green Version]
- Dou, Y.; Yao, G.; Herzberger, A.; da Silva, R.F.B.; Song, Q.; Hovis, C.; Batistella, M.; Moran, E.; Wu, W.; Liu, J. Land-use changes in distant places: Implementation of a telecoupled agent-based model. Embrapa Inf. Agropecuária Artig. Periódico Indexado (ALICE) 2020, 23, 1–11. [Google Scholar] [CrossRef]
- Jin, G.; Chen, K.; Wang, P.; Guo, B.; Dong, Y.; Yang, J. Trade-offs in land-use competition and sustainable land development in the North China Plain. Technol. Forecast. Soc. Chang. 2019, 141, 36–46. [Google Scholar] [CrossRef]
- Zhang, P.; Liu, Y.; Pan, Y.; Yu, Z. Land use pattern optimization based on CLUE-S and SWAT models for agricultural non-point source pollution control. Math. Comput. Model. 2013, 58, 588–595. [Google Scholar] [CrossRef]
- Villamor, G.B.; Le, Q.B.; Djanibekov, U.; van Noordwijk, M.; Vlek, P.L. Biodiversity in rubber agroforests, carbon emissions, and rural livelihoods: An agent-based model of land-use dynamics in lowland Sumatra. Environ. Model. Softw. 2014, 61, 151–165. [Google Scholar] [CrossRef] [Green Version]
- Guan, D.; Li, H.; Inohae, T.; Su, W.; Nagaie, T.; Hokao, K. Modeling urban land use change by the integration of cellular automaton and Markov model. Ecological. Model. 2011, 222, 3761–3772. [Google Scholar] [CrossRef]
- Deng, X.; Li, Z. A review on historical trajectories and spatially explicit scenarios of land-use and land-cover changes in China. J. Land Use Sci. 2016, 11, 709–724. [Google Scholar] [CrossRef]
- Najmuddin, O.; Deng, X.; Siqi, J. Scenario analysis of land use change in Kabul River Basin–a river basin with rapid socio-economic changes in Afghanistan. Phys. Chem. Earth Parts A B C 2017, 101, 121–136. [Google Scholar] [CrossRef]
- Horridge, M. Using CRETH to Make Quantities Add up without Efficiency Bias. Available online: https://www.gtap.agecon.purdue.edu/resources/download/9280.pdf (accessed on 1 April 2020).
- Bureau of Statistics of Zhangye, China. Zhangye Input—Output Tables; Bureau of Statistics of Zhangye: Zhangye, China, 2012. [Google Scholar]
- Wu, F.; Zhan, J.; Zhang, Q.; Sun, Z.; Wang, Z. Evaluating impacts of industrial transformation on water consumption in the Heihe River basin of northwest China. Sustainability 2014, 6, 8283–8296. [Google Scholar] [CrossRef] [Green Version]
- Zhang, Y.; Lu, Y.; Zhou, Q.; Wu, F. Optimal water allocation scheme based on trade-offs between economic and ecological water demands in the Heihe River Basin of Northwest China. Sci. Total. Environ. 2020, 703, 134958. [Google Scholar] [CrossRef]


| Study | Region | Model | Production Function | Number of Sectors | Base Year | Data | Policy Simulation |
|---|---|---|---|---|---|---|---|
| Alavalapati et al. [36] | Canada | CGE model | Nested Leontief/CES function | 5 | 1990 | Input–output table | Effects of restricted land use policy to prevent land degradation on economics |
| Olatubia et al. [37] | US | CGE model | Nested Leontief/C-D function | 7 | 1993 | Social accounting matrix | Effects of Wetland Reserve Program on agricultural economics |
| Lee [38] | Global | GTAP-AEZ model | Nested Leontief/CES function | 57 | 1997 | GTAP database; FAO data | Incorporate land use and land-based emissions in CGE for integrated assessment of climate change policies |
| Miles [39] | ARGENTINA | BioTradeLand model | Nested CES function | 22 | 2000 | Social accounting matrix | Effects of biofuel-related demand in global trade on economics |
| Labord and Valin [29] | Global | MIRAGE-BioF model | Nested Leontief/CES function | 57 | 2004 | GTAP database | Incorporate land use change in CGE for biofuel policies assessment |
| Liu et al. [40] | China | ORANI-G model | Nested Leontief/CES function | 48 | 2012 | Input–output table | Effects of agricultural water use efficiency on agricultural economics |
| Weng et al. [30] | China | CHEER model (Mu 2008) | Nested Leontief/CES function | 8 | 2012 | Social accounting matrix | Effects of biofuel expansion on land use change and food security |
| Bai et al. [41] | China | ORANI-G model | Nested Leontief/CES function | 139 | 2012 | Input–output table | Land use dynamic under climate change policies |
| Year | Cultivated Land | Forest Area | Grassland | Water Area | Built-Up Area | Unused Land |
|---|---|---|---|---|---|---|
| 1990 | 3740 | 4281 | 15,136 | 652 | 300 | 15,359 |
| 2000 | 3951 | 4279 | 14,946 | 618 | 324 | 15,412 |
| 2005 | 4201 | 4260 | 14,865 | 619 | 336 | 15,249 |
| 2010 | 4204 | 4260 | 14,885 | 623 | 337 | 15,221 |
| 2015 | 4323 | 4303 | 14,733 | 707 | 413 | 15,032 |
| Scenario | BAU | RCS | GDS |
|---|---|---|---|
| Capital growth rate | 4 | 5.5 | 2.5 |
| Labor technological progress rate | 2.5 | 3 | 2.5 |
| Investment growth rate | 10.8 | 12.2 | 8.8 |
| Resident consumption growth rate | 6 | 7.8 | 4.5 |
| Population employment growth rate | 0.3 | 0.5 | 0.3 |
| Exportation growth rate | 5 | 6.8 | 3.5 |
Publisher’s Note: MDPI stays neutral with regard to jurisdictional claims in published maps and institutional affiliations. |
© 2021 by the authors. Licensee MDPI, Basel, Switzerland. This article is an open access article distributed under the terms and conditions of the Creative Commons Attribution (CC BY) license (https://creativecommons.org/licenses/by/4.0/).
Share and Cite
Bai, Y.; Zhao, Z.; Weng, C.; Wang, W.; Hu, Y. Scenario-Based Analysis of Land Use Competition and Sustainable Land Development in Zhangye of the Heihe River Basin, China. Int. J. Environ. Res. Public Health 2021, 18, 10501. https://doi.org/10.3390/ijerph181910501
Bai Y, Zhao Z, Weng C, Wang W, Hu Y. Scenario-Based Analysis of Land Use Competition and Sustainable Land Development in Zhangye of the Heihe River Basin, China. International Journal of Environmental Research and Public Health. 2021; 18(19):10501. https://doi.org/10.3390/ijerph181910501
Chicago/Turabian StyleBai, Yuping, Zhe Zhao, Chuyao Weng, Wenxuan Wang, and Yecui Hu. 2021. "Scenario-Based Analysis of Land Use Competition and Sustainable Land Development in Zhangye of the Heihe River Basin, China" International Journal of Environmental Research and Public Health 18, no. 19: 10501. https://doi.org/10.3390/ijerph181910501
APA StyleBai, Y., Zhao, Z., Weng, C., Wang, W., & Hu, Y. (2021). Scenario-Based Analysis of Land Use Competition and Sustainable Land Development in Zhangye of the Heihe River Basin, China. International Journal of Environmental Research and Public Health, 18(19), 10501. https://doi.org/10.3390/ijerph181910501