Abstract
Fatal injury and accidents in the construction industry occur under the influence of outdoor weather conditions such as temperature, humidity and wind speed in all four seasons. Previous research in this area has focused on hot and cold weather conditions: hot weather causes heat rash, heat cramps and heat fainting, while cold weather causes fatigue, lumbago, and cold finger sensations. However, other weather conditions are also associated with, and cause, fatal injury and accidents. Accordingly, this study analyzes injury and fatal accidents in the construction industry based on the physiological equivalent temperature (PET) as it pertains to thermal comfort using an uncertainty analysis. Furthermore, using a neural network, relative importance is analyzed considering injury and fatal accidents. This study is conducted in five steps: (i) Establishment of the database, (ii) Classification of accident types and weather conditions, (iii) Calculation of thermal comfort, (iv) Analysis of injury and fatal accidents based on thermal comfort, and (v) Calculation of the relative importance of thermal comfort during injury and fatal accidents. Via the research process, 5317 fatal incidents and 207,802 injuries are analyzed according to 18 accident types in all seasons. It was found that ‘falls’, were the most frequent fatal incident and injury (2804 fatal incidents and 71,017 injuries), with most of these occurring during the autumn season. The probabilities of injury and fatal accidents in the ‘fall’ category are 86.01% and 85.60%, respectively, in the outside comfort ranges. The contribution of this study can provide data for a database on safety management considering weather conditions.
1. Introduction
In contrast to manufacturing industry, the construction industry is such that outdoor work is unrelated to indoor environmental quality (IEQ) measures such as temperature and humidity. Moreover, factors of outdoor environmental quality (OEQ), such as temperature, humidity, wind speed, vibrations, noise, fine dust, and ultrafine dust, significantly affect the performance of construction workers [1,2,3]. For instance, high temperatures can cause construction workers to suffer heat rash, heat cramping, heat fainting, heat exhaustion, and heatstroke [4]. These issues can be related to fatal incidents or injuries caused by physical fatigue, mental disorder, slow response speeds, and poor reasoning abilities [5]. On the other hand, cold temperatures in winter can cause fatigue, lumbago, cold finger sensation, rigidity of the body, and shoulder and neck stiffness [6]. It has been reported that work conditions under 10 °C have a negative influence on concentration, memory, and performance capacity [7]. In this regard, it can be assumed that uncomfortable work conditions are commonly based on weather. These weather conditions are related to injury and fatal accidents. Accordingly, this research focuses on the thermal comfort of construction workers considering their work conditions, such as OEQ. Studies related to OEQ found that injury and fatal accidents occurred due to different temperature conditions and seasonal changes [4,5,6,7,8,9,10,11,12,13,14,15,16,17,18,19,20,21,22,23]. Earlier work analyzed the causes of injury and fatal accidents in relation to specific weather conditions, such as those in the summer and winter seasons [24,25,26,27,28,29,30,31,32,33,34,35,36,37]. Other research analyzed ‘falls’ and ‘slips’ as frequent types of accident which can be affected by weather conditions [36,37,38,39,40,41,42,43,44,45]. Still others analyzed construction productivity using the predicted mean vote (PMV) by surveying the thermal comfort of construction workers [46,47]. Despite these studies, however, the relationship between injury and fatal accidents and thermal comfort is difficult to find in the literature.
Therefore, this study aims to analyze the relationship between injury and fatal accidents and weather conditions in the construction industry using the concept of physiological equivalent temperature (PET) and an uncertainty analysis. In addition, a neural network analysis and relative importance analysis are applied to determine reliable factors that affect the input PET.
2. Literature Review
As indicated in Table 1, previous research in this area falls into three categories: (i) research related to the causes of construction disasters [24,25,26,27,28,29,30,31,32,33,34,35,36,37,38,39,40,41,42,43,44,45], (ii) research related to an analysis of the weather impact on injury and fatal accidents in construction [4,5,6,7,8,9,10,11,12,13,14,15,16,17,18,19,20,21,22,23,24,25,26,27,28,29,30,31,32,33,34,35,36,37], and (iii) research related to measuring the thermal comfort of construction workers [46,47,48].

Table 1.
Literature review and differences with this research.
The limitations of previous research are explained below. First, there are various types of accident in construction; however, most previous research has focused on specific accident types, such as ‘disease’, ‘fall’, and ‘drowned’. Second, previous research has focused on specific weather conditions, such as heat wave. Third, although previous studies found that critical weather affected injury and fatal accidents, the important variables of weather impact were not analyzed.
3. Materials and Methods
As shown in Figure 1, the research is conducted in five steps; (i) Establishment of the database, (ii) Classification of accident types and weather conditions, (iii) Calculation of thermal comfort, (iv) Analysis of injury and fatal accidents based on thermal comfort, and (v) Calculation of the relative importance of thermal comfort during injury and fatal accidents.
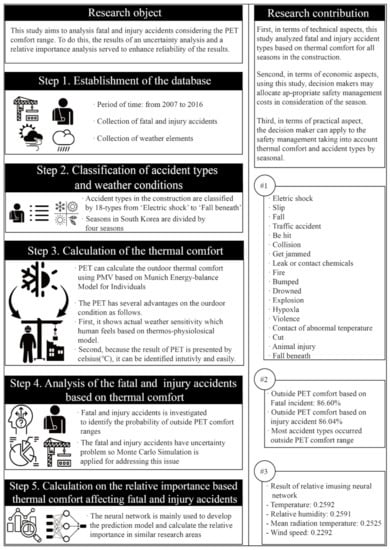
Figure 1.
Research framework.
3.1. Establishment of the Database
Initially, information pertaining to 5318 fatal incidents and 207,802 injuries were collected from a national accident database in Korea as accident cases [49]. Climate information such as air temperature (Ta), relative humidity (RH), and wind speed (v) were also collected from the Korea Meteorological Administration (KMA) to match the dates on which the accidents occurred [49].
Injury and fatal accidents are matched with the climate information considering location (from state to district) and time (from year to hour). Climate information from KMA is provided by region from city to district and time from year to hour. However, climate information by district remains the same. For example, referring to Table 2, when accidents occur in the same city, in different districts, and at the same time, the climate information remains the same. When accidents occur in the same city, the same district, and at different times, the climate information is applied differently. When accidents occur in different cities, different districts, and at the same time, climate information is applied differently.
Table 2.
Example of matching between accident data information and climate information considering city, district, and time.
In this study, the PET, a thermal comfort index, is utilized to analyze the weather impact on injury and fatal accidents. The input variables for the PET are Ta, RH, and v and were obtained from the KMA, and the radiation temperature was calculated using RayMan Pro, a PET simulation tool [50].
3.2. Classification of Accident Types and Weather Conditions
Accident types and weather conditions can vary at construction sites during on-site work [31]. Thus, classifying accident types properly is important when analyzing the causes of accidents and determining how the weather conditions are related. In this study, accident types during construction work are classified into 18 types, e.g., ‘electric shocks’ and ‘fall beneath’, based on earlier work [49,51,52,53,54,55].
Korea has a monsoon climate and four seasons [56]. According to previous research, thermal comfort and related levels experienced by construction workers can differ depending on the season. Accident types can also differ depending on the level of thermal comfort [46,47,48]. In this regard, the seasons in Korea are divided into spring (March–May), summer (June–August), autumn (September–November) and winter (December–February) to analyze injury and fatal accidents and weather conditions [49].
3.3. Calculation of Thermal Comfort
A type of thermal comfort index known as the predicted mean vote (PMV) was presented by Fanger in 1970 as the ASHRAE standard 55 and the ISO 7730 standard [57,58,59,60,61,62,63,64,65,66,67]. PMV was developed to evaluate the thermal comfort of humans in a controlled IEQ using a HVAC system [57,58,59,60,64] (Equations (1)–(4)). Two types of factor, environmental factors and personal factors, should be considered to calculate thermal comfort. There are several environmental factors. Air temperature (Ta) is the most important and is measured by the dry bulb temperature. Humidity is presented as the relative humidity (RH), which is the absolute humidity ratio to the maximum humidity in the air. Air velocity (v) is the wind velocity among indoor occupants. Because the indoor occupants are sensitive to the air velocity, this is an important factor affecting their thermal comfort. The mean radiant temperature (Tmrt) is difficult to measure and therefore requires a globe thermometer to measure radiant heat directly from a warm object [60,68].
There are also several personal factors. The metabolic rate (M) is the value of the body surface area (W/m2). Clothing (Clo) is also one of the factors affecting heat dissipation which is directly related to the thermal performance of a person’s clothing [60,68].
where PMV is the predicted mean vote, M is the metabolic rate, W is the effective mechanical power, Pa is the water vapor partial pressure, ta is the air temperature, fcl is the clothing surface area ratio to the body surface area, tcl is the clothing surface temperature, Icl is the thermal resistance of clothing, Tmrt is the mean radiant temperature, hc is the convective heat transfer coefficient, and Var is the relative air velocity.
Unfortunately, PMV factors are focused on indoor thermal comfort; therefore, it is not appropriate to use PMV for outdoor thermal comfort based on previous research [57,58,59,60,61,62,63,64,65,66,67]. Hőppe presented the PET to address this issue. Referring to Table 3, the comfort range and variables of PMV and PET are presented [66]. Earlier researchers reviewed outdoor thermal comfort using the PET [69,70,71,72,73,74,75,76,77,78,79,80,81,82,83,84,85,86,87]. The PET has several advantages when used for outdoor conditions, as follows. First, it shows actual weather sensitivity as experienced by humans based on a thermo-physiological model. Second, the result of PET is presented in Celsius degrees (°C), which is intuitive and easy to identify. Third, the PET can be used to determine the differences in hot and cold climate. The authors determined that the PET is reasonable for evaluating the thermal comfort of construction workers, who typically stay outdoors.
Table 3.
PET variables and comfort range.
The PET can be used to calculate the level of outdoor thermal comfort using PMV based on the Munich energy-balance model (Equation (5)) [76,77,78]. Generally, the PET requires a complex calculation process. Thus, previous research mainly used Rayman Pro, which as a simulation tool calculates the PET [85]. In this study, Tmrt and the PET are calculated using Rayman Pro. When calculating the PET using this software, the values of Clo and Met are correspondingly fixed at 0.9 Clo and 80 W as default values [84].
where Wp is the physical work output, R is the net radiation of the body, C is the convective heat flow, ED is the imperceptible perspiration, ERe is the sum of the heat flow to heat and the humidity in inhaled air, ESw is the heat flow related to the evaporation of sweat, and S is the storage heat flow for heating or cooling the body mass.
3.4. Analysis of Injury and Fatal Accidents Based on Thermal Comfort
As discussed in Section 3.1, 5317 fatal incidents, 207,803 injuries, and weather data on the day an accident occurred for ten years were collected to analyze injury and fatal accidents while considering the thermal comfort factor in the construction industry. The numbers of injury and fatal accidents both contain some uncertainty. Accordingly, a Monte Carlo simulation (MCS) is applied to consider these uncertainties. MCS is a widely used method in risk management and provides probability distribution using random variables [88]. It is also used to calculate the probabilities of injury and fatal accidents which occur out of the range of thermal comfort in this case. MCS in this study is calculated using Equation (6) [89].
where E(X) is the predicted random variable X, N is the number of random variables, and xn is the random value.
3.5. Calculation on the Relative Importance of Thermal Comfort during Injury and Fatal Accidents
A neural network analysis, used in similar research areas, is conducted here to calculate the relative importance [90]. The neural network analysis uses a processing unit called a neuron. The neural network has three layers in this case: the input layer, the hidden layer, and the output layer [90]. The neural network is mainly used to develop the prediction model and calculate the relative importance.
Here, this type of network is used to calculate the variables of relative importance so as to identify the most influential environmental factor affecting injury and fatal accidents based on thermal comfort. Because the personal factors were fixed at 0.9 Clo and 80 W on RayMan Pro during the process of PET calculation, personal factors cannot be utilized to calculate the relative importance.
4. Result and Discussion
4.1. Analysis of Injury and Fatal Accidents Considering PET in South Korea
Before analyzing the PET of fatal and injury accident by considering accident type and month, the distribution of thermal comfort was analyzed for 10 years. As shown in Figure 2 and Figure 3, the distribution of PET is presented.
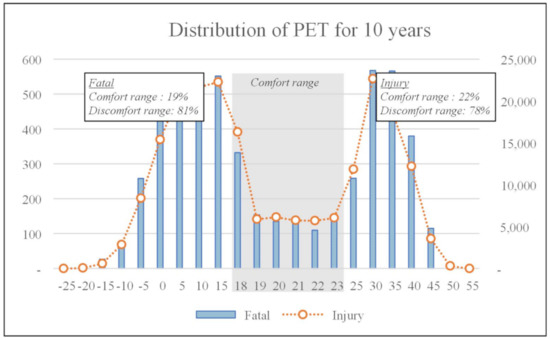
Figure 2.
Distribution of the physiological equivalent temperature for 10 years.
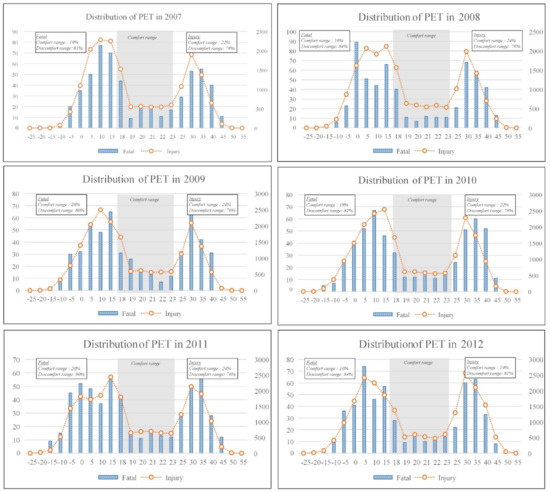
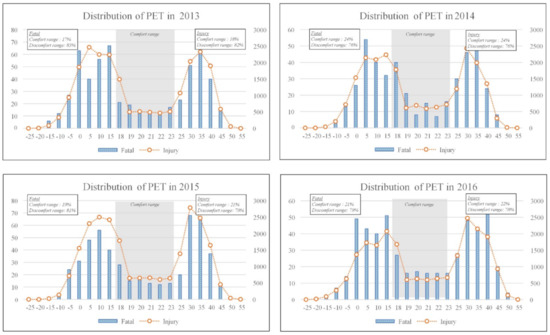
Figure 3.
Distribution of physiological equivalent temperature from 2007 to 2016.
The discomfort range of fatal accident was from a minimum of 76% to a maximum of 84% yearly. Discomfort range for injury was from a minimum of 76% to a maximum of 82% yearly. For 10 years, the discomfort range of injury and fatal accidents occurred in the range of 81% and 78% in South Korea. Therefore, most construction workers have suffered fatal accident or injury accident within the discomfort ranges. So, thermal comfort should be maintained as the PET comfort range during construction work to eliminate and reduce injury and fatal accidents; however, this is very difficult.
According to Köppen climate classification, South Korea is classified as a monsoon climate which has four seasons from spring to winter. Weather conditions such as temperature experience a large gap between winter and summer from minimum −0.9 °C to maximum 25.4 °C (Refer to Table 4). PET range by month also witnesses a large gap from −12 °C to 21.6 °C. So, PET is almost distributed as a discomfort range by month, except for July and August.
Table 4.
Climate information and PET in South Korea for 10 years.
Due to bad outdoor weather conditions, it is considered that more injury and fatal accidents have occurred in the construction industry than in other industries.
4.2. Analysis of Injury and Fatal Accidents Related to Outdoor Thermal Comfort
In this study, 18 accident types were analyzed to identify the relationship between injury and fatal accidents and thermal comfort. Before analyzing types of injury and fatal accident per month, the PET comfort distribution, and the probability distribution of injury and fatal accidents, ‘fall’ incidents were analyzed as an example to help readers understand the results. The ‘fall’ type represents the most common type of injury and fatal accident, at 2804 fatal accidents and 71,017 injury accidents. Therefore, the accident category ‘fall’ is representative among accident types.
First, as shown in Figure 4a, injury and fatal accidents due to falls were analyzed monthly. Injury and fatal accident occurred at nearly identical rates throughout the year. In winter (December to February), injury and fatal accidents occurred less than in other seasons. On the other hand, In October, the highest number of injury and fatal accidents occurred, with 286 fatal accidents and 7355 injury accidents.
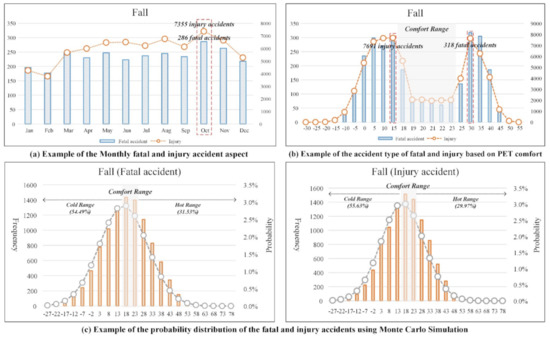
Figure 4.
Examples of injury and fatal accidents in terms of thermal comfort.
Second, as shown in Figure 4b, ‘falls’ that led to injury and fatal accidents were analyzed based on PET comfort ranges. As mentioned above, the PET comfort range is defined from 18 °C to 23 °C. Injury and fatal accidents mainly occur outside the PET comfort range (excluding 18 °C to 23 °C). The most frequent type of fatal accident occurred from 25 °C to 30 °C, with 318 such accidents. The most frequent type of injury occurred from 10 °C to 15 °C, with 7691 injuries.
Third, as shown in Figure 4c, the probabilities of injury and fatal accidents that were ‘falls’ were presented using the probability distribution of PET ranges including both comfort and discomfort ranges. The probabilities of injury and fatal accidents that were ‘falls’ outside of the PET comfort range were 86.02% and 85.60%, respectively. It was identified that injury and fatal accidents of the ‘fall’ type show significantly high probabilities outside of the PET comfort range. Injury and fatal accidents also had high probabilities in the PET cold range, at 54.49% and 55.63%, respectively.
The analysis of injury and fatal accidents according to the 18 accident types in terms of the season, PET comfort range, and probability distribution are described in detail below.
4.3. Analysis of Monthly Injury and Fatal Accidents in Terms of Accident Type
As shown in Table 5 and Figure 5, injury and fatal accidents were analyzed by accident type in detail. The most common accident type, with a high frequency of injury and fatal accidents, is highlighted in boldface and gray. The accident types show significant differences relative to each other according to seasonal changes.
Table 5.
Monthly analysis of injury and fatal accidents by accident type.
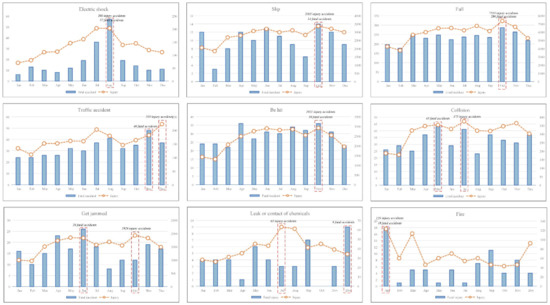
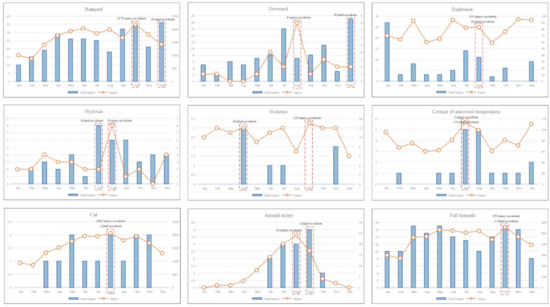
Figure 5.
Graph of monthly injury and fatal accidents in terms of accident type.
First, in the spring (March to May), three accident types (be hit, collision, and fall beneath) were most common among the 18 accident types. Specifically, there were 43 fatalities that were a ‘collision’ in May. This season (spring) has the fewest injuries among the four seasons.
Second, in the summer (June to August), four accident types (electric shock, hypoxia, contact of abnormal temperature, and cut) were most common. Particularly, there were 57 fatalities due to ‘electric shock’ in August. This season, summer, has the highest number of injuries, with eight accident types (electric shock, collision, leak or contact of chemicals, drowned, explosion, hypoxia, contact of abnormal temperature, cut, and animal injury) among the four seasons. Similarly to fatality cases, 203 injuries caused by an ‘electric shock’ in July and August represented the highest number for all injuries.
Third, in the autumn (September to November), six accident types were most common. Specifically, there were 286 fatalities caused by ‘fall’ in October. This season has the highest number of injuries, with eight accident types (slip, fall, be hit, get jammed, bumped, explosion, violence, and fall beneath) among the four seasons. Similarly to fatalities cases, 7355 injuries that were ‘fall’ in October represented the highest number of all injuries.
Fourth, in the winter (December to February), five accident types (traffic accident, fire, bumped, drowned, explosion) were most common. Specifically, there were 36 fatalities in the ‘bumped’ category in December. This season also has the highest number of injuries of two accident types (traffic accident and fire) among the four seasons. Additionally, 223 injuries caused by a traffic accident in December accounted for the highest number of all injuries.
Via these results, several reasons for the low number of accidents in summer and winter seasons can be considered, firstly, in terms of the number of construction workers. It may be regarded that the most injury and fatal accidents were caused by the larger number of construction workers. However, referring to Table 6, the number of construction workers is similar by month and the number of construction workers was not related to the number of injury and fatal accidents. For example, most construction workers worked in November; however, most injury and fatal accidents occurred in October. Second, in terms of working day, there are about 10 holidays per month in South Korea. There are the most working days in April and the fewest working days in May. So there is little relationship between working days and injury and fatal accidents. Third, in terms of PET by month, referring to Table 5, the PET was in the discomfort range in October; however, the PET was not worst in October. The lowest and highest PET were January and August, respectively. Therefore, the correlation between PET and accidents was weak.
Table 6.
Monthly analysis of the number of injury and fatal accidents, construction workers, and working and holiday from 2007 to 2016.
4.4. Analysis of the PET Comfort Distribution in Terms of the Accident Type
As shown in Table 7 and Figure 6, injury and fatal accidents were analyzed based on comfort (18 °C~23 °C) and discomfort (excluding 18 °C~23 °C) PET range. The top 10% of the PET range for each accident type, with a high frequency of injury and fatal accidents, are highlighted as boldface and gray.
Table 7.
Distribution of injury and fatal accidents in terms of the PET range.
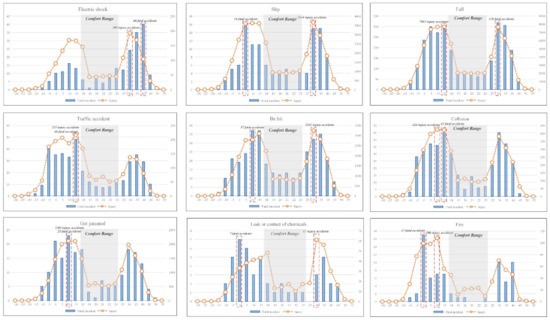
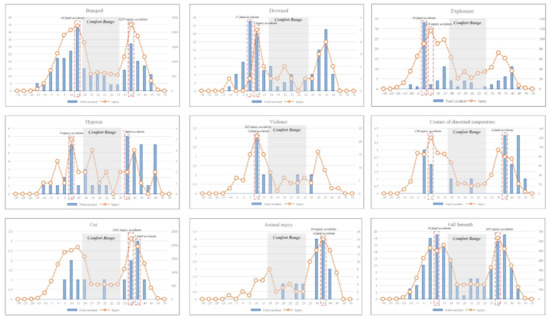
Figure 6.
Graph of injury and fatal accidents types based on PET ranges.
In Section 3.3, the PET comfort range was found to be 18 °C~23 °C. Table 6 shows that the most frequent injuries and fatal accidents occurred outside the PET comfort range for all accident types.
Most large fatal accident types occurred under the PET of 18 °C, including 12 types among the 18 accident types (Refer to Table 6). The most frequent accident type was ‘traffic accident’, which accounted for 48 fatalities from 10 °C to 15 °C. The most common injury types occurred under a PET of 18 °C, amounting to ten among the 18 accident types (Refer to Table 6). The most frequent accident type was ‘fall’, which accounted for 7691 injuries from 10 °C to 15 °C.
Most large fatal accident types occurred over a PET of 23 °C and there were six among 18 accident types (Refer to Table 6). The most frequent accident type was again ‘fall’, which had 318 fatalities from 25 °C to 30 °C. Most large injury accident types occurred over a PET of 23 °C and there were eight among the 18 accident types (Refer to Table 6). The most frequent accident type was ‘slip’, which numbered 3654 injuries from 25 °C to 30 °C.
4.5. Uncertainty Analysis of Accidents and Thermal Comfort
It was identified in the previous chapter that the most frequent injury and fatal accidents occurred outside the PET comfort range. Injury and fatal accidents fluctuate yearly in the construction industry. The probabilities of injury and fatal accidents under the PET comfort range are difficult to estimate using only historical data. Accordingly, MCS is applied to estimate the probability of accidents considering thermal comfort.
Referring to Table 8, the probabilities of injury and fatal accidents by accident type are presented using the probability distribution of the PET ranges, including both comfort and discomfort. The top accident types that are associated with high probabilities of injury and fatal accidents are highlighted in boldface and gray.
Table 8.
Analysis of the probabilities of injury and fatal accidents in terms of the PET ranges.
It was identified that injury and fatal accidents for every accident type show significantly high probabilities outside of the PET comfort range. Specifically, the probability of a fatality by ‘leak or contact chemicals’ outside of the PET comfort range was 88.91%, and the probability of injury by a ‘fire’ outside the PET comfort range was 88.95%. Both showed the highest probabilities among all accident types.
In Figure 7 and Figure 8, the probability distributions of injury and fatal accidents are presented. In the PET cold range as part of the discomfort range, 13 accident types have a higher probability of fatality among the 18 accident types. The most common fatal accident types which have high probabilities in the PET cold range were in the ‘violence’ (74.58%), ‘explosion’ (63.92%), and ‘leak or contact chemicals’ (63.73%) categories. In addition, 17 accident types have a higher probability of injury among the 18 accident types. The most common injury accident types with high probabilities in the PET cold range were ‘fires’ (66.94%), ‘traffic accidents’ (66.58%), and ‘explosions’ (66.32%).
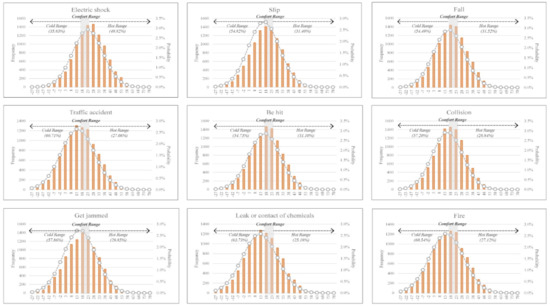
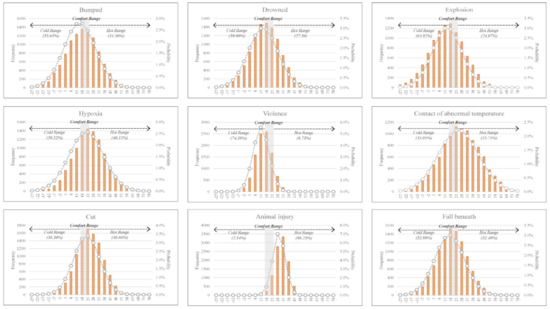
Figure 7.
Analysis of the probability distribution of fatal accident using a Monte Carlo simulation.
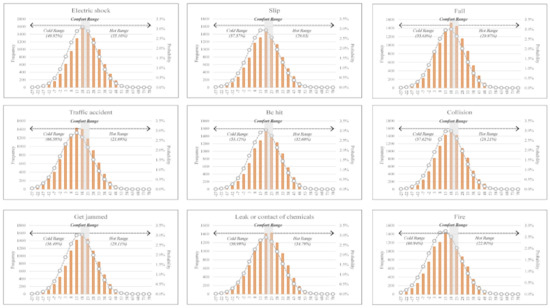
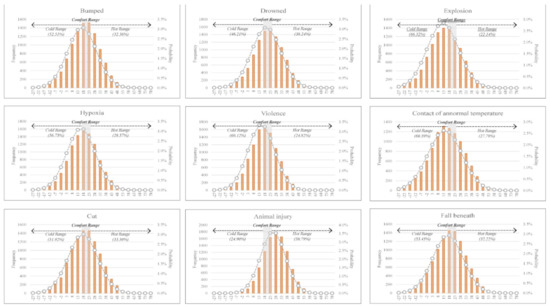
Figure 8.
Analysis of the probability distribution of injuries using a Monte Carlo simulation.
In terms of the PET hot range as part of the discomfort range, five accident types have higher probabilities of a fatality among the 18 accident types. The major fatal accident types which have a high probability in the PET hot range were ‘animal injury’ (86.23%), ‘contact of abnormal temperature’ (53.75%), and ‘electric shock’ (49.82%). Only the ‘animal injury’ category (58.79%) shows a higher probability in the PET hot range compared to the other ranges.
This result shows that the PET discomfort range is associated with a greater probability of accident than the PET comfort range and that the PET cold range means workers are more vulnerable than in the PET hot range in terms of the probabilities of injury and fatal accidents considering various accident types.
4.6. Relative Importance Analysis Based on Thermal Comfort of Injury and Fatal Accidents
In this study, a relative importance analysis was conducted to determine which environmental factor is more significant among Ta, Tmrt, v, and RH as input variables for the PET calculation.
A neural network is used to calculate the environmental factors of the relative importance using SPSS 18. As shown in Figure 9, the training and test sets consisted of 70% and 30% of the total, respectively. Here, the training and test sets were typically split by 70% and 30% for analyzing the data set [91]. The input layer consists of Ta, Tmrt, v, and RH. There are nine hidden layers. The output layer consists of fatal incident and injury.
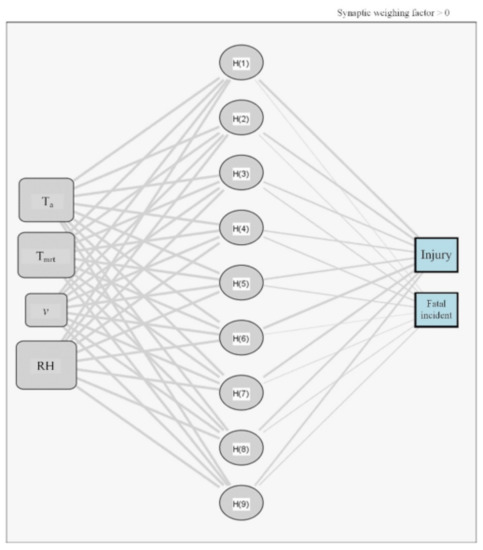
Figure 9.
Graph of the neural network of weighting factors.
The variable R2 was calculated to validate the neural network model, with this result being 97.53%. Therefore, the proposed neural network model was validated. Referring to Table 9, the variables of the relative importance analysis are presented. The order of importance was Ta (0.2592), RH (0.2591), Tmrt (0.2525), and v (0.2292).
Table 9.
Results of the variables of relative importance analysis.
In this result, it was identified that Ta and RH are important environmental factors that influence injury and fatal accidents based on thermal comfort as compared to Tmrt and v.
4.7. Discussion
This study analyzed types of injury and fatal accidents affected by OEQ based on thermal comfort. Most of the earlier works in previous research focused on a specific weather condition, such as those in summer and winter seasons [4,5,6,7,8,9,10,11,12,13,14,15,16,17,18,19,20,21,22,23,24,25,26,27,28,29,30,31,32,33,34,35,36,37]. However, the results of this study showed that injury and fatal accidents in the spring and autumn seasons have greater probability than those of the summer and winter seasons. An expert interview was conducted to double-check this phenomenon, and related regulations pertaining to construction in South Korea were analyzed to interpret these results.
Based on the expert opinion and regulation review, the clients or the supervisor of the construction project have a duty and right to order a work stoppage when the weather is too hot or cold to proceed with common construction work (35 °C for summer and heavy snow accompanied by strong winds in winter (10 m/s) [92]. Thus, it can be assumed that injury and fatal accidents in summer and winter may occur less frequently than in other seasons, despite the fact that the probabilities of injury and fatal accidents in the PET discomfort range were significantly higher than the PET comfort range.
‘Fall’ was the most frequent accident type for both injury and fatal accidents, and this was proven throughout this study and in earlier research. Nadhim et al. (2016) insisted that weather and environmental conditions such as hot and cold temperatures and windy or rainy weather affect ‘fall’ accidents [93]. Gillen et al. (2002) identified weather is one of the important variables affecting ‘falls’ through a survey method [94].
Finally, a relative importance analysis was conducted to address the relative hierarchy among Ta, RH, Tmrt, and v as the input variables of the PET. In this study, the temperature is selected as the most important parameters. Previous research also mentioned the importance of the temperature in enhancing safety management [4,5,6,7,8,9,10,11,12,13,14,15,16,17,18,19,20,21,22,23]. High temperature can cause heat rash, heat exhaustion, and heatstroke in construction workers [4]. Low temperature in winter also can cause fatigue, lumbago, and cold finger sensation [6]. Rameezdeen and Elmualim (2017) insisted that heat stress causes heat rash, heat cramp, heat fainting, heat exhaustion and heatstroke in construction workers [4], Mohammed et al. (2019) noted how productivity losses, illnesses and injuries to workers may arise due to hot and humid weather conditions [13]. In addition, Yi and Chan (2013) found that hot and humid weather conditions caused worker fatigue and productivity losses, and they proposed an evaluation of heat stress to provide a proper balance between work and rest [16]. In this regard, it can be assumed that temperature can directly affect injury and fatal accidents in construction workers.
5. Conclusions
This study aimed to analyze injury and fatal accidents considering the PET comfort range. To achieve this, the results of an uncertainty analysis and a relative importance analysis were used to enhance the reliability of the results.
This study was conducted in five steps: (i) Establishment of the database, (ii) Classification of accident types and weather conditions, (iii) Calculation of the thermal comfort, (iv) Analysis of the injury and fatal accidents based on thermal comfort, and (v) Calculation on the relative importance of thermal comfort in affecting injury and fatal accidents.
The results of this study are as follows. First, the monthly analysis of injury and fatal accidents classified these incidents by accident type. There were more injury and fatal accidents in the autumn compared to the other seasons considering the 18 accident types. Six fatality types in the autumn were highest among the 18 accident types, and eight types of injury were highest among the 18 accident types. The most frequent injury and fatal accidents were ‘fall’ (286 fatal incidents and 7355 injuries). Second, all types of injury and fatal accidents occurred outside of the PET comfort range at significant levels, and these were defined as being in the PET cold and hot range. In the PET cold range (below PET 18 °C), the most frequent fatality types were ‘traffic accident’ (48 fatalities) from 10 °C to 15 °C. The most frequent injury was ‘fall’ (7691 injuries) from 10 °C to 15 °C. In the PET hot range (over PET 23 °C), the most frequent fatality type was ‘fall’ (318 fatal incidents) from 25 °C to 30 °C. The most frequent injury type was ‘slip’ (3654 injuries) from 25 °C to 30 °C. Third, the PET cold range was associated with a higher probability of injury and fatal accidents than the PET hot range for most types of fatality (13 of 18 accident types) and injuries (17 of 18 accident types). Finally, Ta (0.259) was the most influential factor in injury and fatal accidents among the four PET input variables according to the results of a relative importance analysis.
The contributions of this study are as follows. First, in terms of technical aspects, this study analyzed fatal and injury accident types based on thermal comfort for all seasons in the construction industry. Thus, this study can provide data for a database on safety management considering weather conditions. Second, in terms of economic aspects, using this study, decision makers may allocate appropriate safety management costs in consideration of the season. In terms of policy aspects, based on the results here, policymakers can legislate standards for seasonal safety management to reduce and eliminate injury and fatal accidents. Third, in terms of practical aspects, decision makers can apply these results to the safety management taking into account thermal comfort and accident types by seasonal. For example, the decision maker could plan safety management with respect to ‘Electric shock’, ‘Hypoxia’, and ‘Cut’ in the summer season, and ‘Traffic accident’ and ‘Fire’ in the winter season, because these occur more often during these seasons.
The limitations of this study are as follows. First, outdoor environmental quality has many factors, such as lighting, air quality, and noise. However, this study did not consider those factors. Second, there is a need to consider risk for construction workers according to their specific jobs, however; this study did not consider this kind of risk.
There are several directions for future research. First, injury and fatal accidents can be analyzed based not only on thermal comfort but also on other outdoor environmental qualities. Second, a prediction model can be developed to enhance safety management in the construction industry using machine learning.
Author Contributions
M.L.: Methodology, Resources, Investigation, Writing-Original Draft. J.J. (Jaemin Jeong): Methodology, Validation, Formal Analysis, Writing-Original Draft, J.J. (Jaewook Jeong): Conceptualization, Supervision, Project Administration, Writing-Review & Editing. J.L.: Data Curation, Validation, Writing-Review & Editing. All authors have read and agreed to the published version of the manuscript.
Funding
This work is supported by the Korea Agency for Infrastructure Technology Advancement (KAIA) grant funded by the Ministry of Land, Infrastructure and Transport (Grant 21CTAP-C163805).
Institutional Review Board Statement
Not applicable.
Informed Consent Statement
Not applicable.
Data Availability Statement
The data presented in this study are available in the manuscript.
Conflicts of Interest
The authors declare no conflict of interest.
References
- Li, W.; Zhang, J.; Zhao, T.; Ren, J. Experimental study of an indoor temperature fuzzy control method for thermal comfort and energy saving using wristband device. Build. Environ. 2020, 107432. [Google Scholar] [CrossRef]
- Wong, T.K.M.; Man, S.S.; Chan, A.H.S. Critical factors for the use or non-use of personal protective equipment amongst construction workers. Saf. Sci. 2020, 126, 104663. [Google Scholar] [CrossRef]
- Zhang, J.; Zhang, W.; Xu, P.; Chen, N. Applicability of accident analysis methods to Chinese construction accidents. J. Saf. Res. 2019, 68, 187–196. [Google Scholar] [CrossRef]
- Rameezdeen, R.; Elmualim, A. The impact of heat waves on occurrence and severity of construction accidents. Int. J. Environ. Res. Public Health 2017, 14, 70. [Google Scholar] [CrossRef] [PubMed]
- Rowlinson, S.; YunyanJia, A.; Li, B.; ChuanjingJu, C. Management of climatic heat stress risk in construction: A review of practices, methodologies, and future research. Accid. Anal. Prev. 2014, 66, 187–198. [Google Scholar] [CrossRef] [PubMed]
- Inaba, R.; Kurokawa, J.; Mirbod, S.M. Comparison of subjective symptoms and cold prevention measures in winter between traffic control workers and construction workers in Japan. Ind. Health 2009, 47, 283–291. [Google Scholar] [CrossRef][Green Version]
- Jeong, J.R.; Kim, H.E.K.; Rissanen, S. Research on Winter Working Environment and Working Clothes at a Construction Site. Fashion Text. Res. J. 2009, 11, 174–179. [Google Scholar]
- Abdel-Ghany, A.M.; Al-Helal, I.M.; Shady, M.R. Human thermal comfort and heat stress in an outdoor urban arid environment: A case study. Adv. Meteorol. 2013. [Google Scholar] [CrossRef]
- Varghese, B.M.; Hansen, A.; Bi, P.; Pisaniello, D. Are workers at risk of occupational injuries due to heat exposure? A comprehensive literature review. Saf. Sci. 2018, 110, 380–392. [Google Scholar] [CrossRef]
- Acharya, P.; Boggess, B.; Zhang, K. Assessing heat stress and health among construction workers in a changing climate: A review. Int. J. Environ. Res. Public Health 2018, 15, 247. [Google Scholar] [CrossRef]
- Al-Bouwarthan, M.; Quinn, M.M.; Kriebel, D.D.H. Assessment of heat stress exposure among construction workers in the hot desert climate of Saudi Arabia. Ann. Work. Expo. Health 2019, 63, 505–520. [Google Scholar] [CrossRef]
- Rowlinson, S.; Jia, Y.A. Construction accident causality: An institutional analysis of heat illness incidents on site. Saf. Sci. 2015, 78, 179–189. [Google Scholar] [CrossRef]
- Moohialdin, A.S.M.; Lamari, F.; Miska, M.; Trigunarsyah, B. Construction worker productivity in hot and humid weather conditions. Eng. Constr. Archit. Manag. 2019, 27. [Google Scholar] [CrossRef]
- Anttonen, H.; Pekkarinen, A.; Niskanen, J. Safety at work in cold environments and prevention of cold stress. Ind. Health 2009, 47, 254–261. [Google Scholar] [CrossRef] [PubMed]
- Vukadinovic, A.; Radosavljevic, J. Occupational safety and health of construction workers working in extreme temperature. In Proceedings of the 15th International Conference Risk and Safety Engineering, Kopaonik, Serbia, 16–18 January 2020. [Google Scholar]
- Yi, W.; Chan, A.P. Optimizing work–rest schedule for construction rebar workers in hot and humid environment. Build. Environ. 2013, 61, 104–113. [Google Scholar] [CrossRef]
- Inaba, R.; Mirbod, S.M. Subjective musculoskeletal symptoms in winter and summer among indoor working construction electricians. Ind. Health 2010, 48, 29–37. [Google Scholar] [CrossRef] [PubMed]
- Srinavin, K.; Mohamed, S. Thermal environment and construction workers’ productivity: Some evidence from Thailand. Build. Environ. 2003, 38, 339–345. [Google Scholar] [CrossRef]
- Hajat, S.; Kovats, R.S.; Lachowycz, K. Heat-related and cold-related deaths in England and Wales: Who is at risk? Occup. Environ. Med. 2007, 4, 93–100. [Google Scholar] [CrossRef]
- Pérez-Alonso, J.; Callejón-Ferre, Á.J.; Carreño-Ortega, Á.; Sánchez-Hermosilla, J. Approach to the evaluation of the thermal work environment in the greenhouse-construction industry of SE Spain. Build. Environ. 2011, 46, 1725–1734. [Google Scholar] [CrossRef]
- Kozłowska-Szczȩsna, T.; Grzȩdziński, E. The influence of atmospheric environment upon the occurrence of accidents among construction workers. Energy Build. 1991, 16, 749–753. [Google Scholar] [CrossRef]
- Mahoney, C.R.; Castellani, J.; Kramer, F.M.; Young, A.; Lieberman, H.R. Tyrosine supplementation mitigates working memory decrements during cold exposure. Physiol. Behav. 2007, 92, 575–582. [Google Scholar] [CrossRef] [PubMed]
- Szer, I.; Szer, J.; Cyniak, P.; Blazik-Borowa, E. Influence of temperature and surroundings humidity on scaffolding work comfort. Int. Conf. Prev. Accid. Work. 2017, 19–23. [Google Scholar] [CrossRef]
- Berglund, L.; Johansson, M.; Nygren, M.; Samuelson, B.; Stenberg, M.; Johansson, J. Occupational accidents in Swedish construction trades. Int. J. Occup. Saf. Ergon. 2019, 859, 1–10. [Google Scholar] [CrossRef] [PubMed]
- Arquillos, A.L.; Romero, J.C.R.; Gibb, A. Analysis of construction accidents in Spain, 2003–2008. J. Saf. Res. 2012, 43, 381–388. [Google Scholar] [CrossRef] [PubMed]
- Khosravi, Y.; Asilian-Mahabadi, H.; Hajizadeh, E.; Hassanzadeh-Rangi, N.; Bastani, H.; Behzadan, A.H. Factors influencing unsafe behaviors and accidents on construction sites: A review. Int. J. Occup. Saf. Ergon. 2014, 20, 111–125. [Google Scholar] [CrossRef] [PubMed]
- Cheng, C.W.; Leu, S.S.; Lin, C.C.; Fan, C. Characteristic analysis of occupational accidents at small construction enterprises. Saf. Sci. 2010, 48, 698–707. [Google Scholar] [CrossRef]
- Haslam, R.A.; Hide, S.A.; Gibb, A.G.; Gyi, D.E.; Pavitt, T.; Atkinson, S.; Duff, A.R. Contributing factors in construction accidents. Appl. Ergon. 2005, 36, 401–415. [Google Scholar] [CrossRef] [PubMed]
- Hinze, J.; Pedersen, C.; Fredley, J. Identifying root causes of construction injuries. J. Constr. Eng. Manag. 1998, 124, 67–71. [Google Scholar] [CrossRef]
- Abukhashabah, E.; Summan, A.; Balkhyour, M. Occupational accidents and injuries in construction industry in Jeddah city. Saudi. J. Biol. Sci. 2020, 27, 1993–1998. [Google Scholar] [CrossRef]
- Liao, C.W. Pattern analysis of seasonal variation in occupational accidents in the construction industry. Procedia Eng. 2012, 29, 3240–3244. [Google Scholar] [CrossRef]
- Irumba, R. Spatial analysis of construction accidents in Kampala, Uganda. Saf. Sci. 2014, 64, 109–120. [Google Scholar] [CrossRef]
- Zahoor, H.; Albert, P.C.C.; Ran, G.; Wahyudi, P.U. The factors contributing to construction accidents in Pakistan: Their prioritization using the Delphi technique. Eng. Constr. Archit. Manag. 2017, 24, 463–485. [Google Scholar] [CrossRef]
- Cheng, C.W.; Lin, C.C.; Leu, S.S. Use of association rules to explore cause–effect relationships in occupational accidents in the Taiwan construction industry. Saf. Sci. 2010, 48, 436–444. [Google Scholar] [CrossRef]
- Ahmed, S. Causes of accident at construction sites in Bangladesh. Org. Technol. Manag. Constr. 2019, 11, 1933–1951. [Google Scholar] [CrossRef]
- Chi, C.F.; Chang, T.C.; Ting, H.I. Accident patterns and prevention measures for fatal occupational falls in the construction industry. Appl. Ergon. 2005, 36, 391–400. [Google Scholar] [CrossRef]
- Kartam, N.A.; Bouz, R.G. Fatalities and injuries in the Kuwaiti construction industry. Accid. Anal. Prev. 1998, 30, 805–814. [Google Scholar] [CrossRef]
- Arifuddin, R.; Latief, R.U.; Suraji, A. An investigation of fall accident in a high-rise building project. IOP Conf. Ser. Earth Environ. Sci. 2020, 419, 012144. [Google Scholar] [CrossRef]
- Huang, X.; Hinze, J. Analysis of construction worker fall accidents. J. Constr. Eng. Manag. 2003, 129, 262–271. [Google Scholar] [CrossRef]
- Wong, L.; Wang, Y.; Law, T.; Lo, C.T. Association of root causes in fatal fall-from-height construction accidents in Hong Kong. J. Constr. Eng. Manag. 2016, 142, 04016018. [Google Scholar] [CrossRef]
- Knox, E.H.; Smith, S.J.; Eganhouse, J.T. Construction Fall from Height Accident Reconstruction and Safety Analysis. In Proceedings of the XXVIIIth Annual Occupational Ergonomics and Safety Conference, Chicago, IL, USA, 9–10 June 2016; pp. 87–92. [Google Scholar]
- Dong, X.S.; Fujimoto, A.; Ringen, K.; Men, Y. Fatal falls among Hispanic construction workers. Accid. Anal. Prev. 2009, 41, 1047–1052. [Google Scholar] [CrossRef]
- Lipscomb, H.J.; Glazner, J.E.; Bondy, J.; Guarini, K.; Lezotte, D. Injuries from slips and trips in construction. Appl. Ergon. 2006, 37, 267–274. [Google Scholar] [CrossRef] [PubMed]
- Bentley, T.A.; Hide, S.; Tappin, D.; Moore, D.; Legg, S.; Parker, L. Investigating risk factors for slips, trips and falls in New Zealand residential construction using incident-centred and incident-independent methods. Ergonomics 2006, 49, 62–77. [Google Scholar] [CrossRef] [PubMed]
- Cattledge, G.H.; Schneiderman, A.; Stanevich, R.; Hendricks, S.; Greenwood, J. Nonfatal occupational fall injuries in the West Virginia construction industry. Accid. Anal. Prev. 1996, 28, 655–663. [Google Scholar] [CrossRef]
- Yang, Y. Heat stress intervention research in construction: Gaps and recommendations. Ind. Health 2017, 55, 201–209. [Google Scholar] [CrossRef] [PubMed]
- Chan, A.P.C.; Yam, M.C.; Chung, J.W.; Yi, W. Developing a heat stress model for construction workers. J. Facil. Manag. 2012, 10, 59–74. [Google Scholar] [CrossRef]
- Johansson, E.; Yahia, M.W.; Arroyo, I.; Bengs, C. Physiological responses of acclimatized construction workers during different work patterns in a hot and humid subtropical area of China. J. Build. Eng. 2020, 30, 101281. [Google Scholar] [CrossRef]
- Korea Occupational Safety and Health Agency (KOSHA). Analysis of Industrial Accident Causes in 2010. 2011. Available online: https://www.kosha.or.kr/kosha/data/business/commonIndustriesBook.do?medSeq=29857&codeSeq=1100000&medForm=101&menuId=-1100000101&mode=view (accessed on 1 September 2020).
- Matzarakis, A.; Rutz, F.; Mayer, H. Modelling radiation fluxes in simple and complex environments: Basics of the RayMan model. Int. J. Biometeol. 2010, 54, 131–139. [Google Scholar] [CrossRef]
- Cheng, C.W.; Leu, S.S.; Cheng, Y.M.; Wu, T.C.; Lin, C.C. Applying data mining techniques to explore factors contributing to occupational injuries in Taiwan’s construction industry. Accid. Anal. 2012, 48, 214–222. [Google Scholar] [CrossRef]
- Suraji, A.; Duff, A.R.; Peckitt, S.J. Development of causal model of construction accident causation. J. Constr. Eng. Manag. 2001, 127, 337–344. [Google Scholar] [CrossRef]
- Chi, C.F.; Chang, T.C.; Hung, K.H. Significant industry–source of injury–accident type for occupational fatalities in Taiwan. Int. J. Ind. Ergon. 2004, 34, 77–91. [Google Scholar] [CrossRef]
- Goh, Y.M.; Ubeynarayana, C.U. Construction accident narrative classification: An evaluation of text mining techniques. Accid. Anal. Prev. 2017, 108, 122–130. [Google Scholar] [CrossRef] [PubMed]
- Winge, S.; Albrechtsen, E. Accident types and barrier failures in the construction industry. Saf. Sci. 2018, 105, 158–166. [Google Scholar] [CrossRef]
- Cho, I.H.; Kim, H.K.; Lee, M.H.; Kim, Y.J.; Lee, H.; Kim, B.H. The Effect of Monsoon Rainfall Patterns on Epilithic Diatom Communities in the Hantangang River, Korea. Water 2020, 12, 1471. [Google Scholar] [CrossRef]
- Orosa, J.A.; Oliveira, A.C. A new thermal comfort approach comparing adaptive and PMV models. Renew Energy 2011, 36, 951–956. [Google Scholar] [CrossRef]
- Kim, J.T.; Lim, J.H.; Cho, S.H.; Yun, G.Y. Development of the adaptive PMV model for improving prediction performances. Energy Build. 2015, 98, 100–105. [Google Scholar] [CrossRef]
- Fanger, P.O.; Toftum, J. Extension of the PMV model to non-air-conditioned buildings in warm climates. Energy Build. 2002, 34, 533–536. [Google Scholar] [CrossRef]
- Pourshaghaghy, A.; Omidvari, M. Examination of thermal comfort in a hospital using PMV–PPD model. Appl. Ergon. 2012, 43, 1089–1095. [Google Scholar] [CrossRef]
- Fang, Z.; Feng, X.; Lin, Z. Investigation of PMV model for evaluation of the outdoor thermal comfort. Procedia Eng. 2017, 205, 2457–2462. [Google Scholar] [CrossRef]
- Fabbri, K.; Di Nunzio, A.; Gaspari, J.; Antonini, E.; Boeri, A. Outdoor Comfort: The ENVI-BUG tool to evaluate PMV values Output Comfort point by point. Energy Procedia 2017, 111, 510–519. [Google Scholar] [CrossRef]
- Alfano, F.R.D.A.; Ianniello, E.; Palella, B.I. PMV–PPD and acceptability in naturally ventilated schools. Build. Environ. 2013, 67, 129–137. [Google Scholar] [CrossRef]
- Jang, M.S.; Koh, C.D. Moon IS. Review of thermal comfort design based on PMV/PPD in cabins of Korean maritime patrol vessels. Build. Environ. 2007, 42, 55–61. [Google Scholar] [CrossRef]
- Zare, S.; Hasheminejad, N.; Bateni, M.; Baneshi, M.R.; Shirvan, H.E.; Hemmatjo, R. The association between wet-bulb globe temperature and other thermal indices (DI, MDI, PMV, PPD, PHS, PSI and PSIhr): A field study. Int. J. Occup. Saf. Ergon. 2020, 26, 71–79. [Google Scholar] [CrossRef]
- Karakounos, I.; Dimoudi, A.; Zoras, S. The influence of bioclimatic urban redevelopment on outdoor thermal comfort. Energy Build. 2018, 158, 1266–1274. [Google Scholar] [CrossRef]
- Fabbri, K. Thermal comfort evaluation in kindergarten: PMV and PPD measurement through datalogger and questionnaire. Build. Environ. 2013, 68, 202–214. [Google Scholar] [CrossRef]
- Charles, K.E. Fanger’s Thermal Comfort and Draught Models; NRC IRC-RR-162; National Research Council of Canada, Institute for Research in Construction: Ottawa, ON, Canada, 2003.
- Lucchese, J.R.; Mikuri, L.P.; de Freitas, N.V.; Andreasi, W.A. Application of selected indices on outdoor thermal comfort assessment in Midwest Brazil. IJEE 2016, 7, 291. [Google Scholar]
- Chen, L.; Ng, E. Outdoor thermal comfort and outdoor activities: A review of research in the past decade. Cities 2012, 29, 118–125. [Google Scholar] [CrossRef]
- Lin, T.P.; Matzarakis, A.; Hwang, R.L. Shading effect on long-term outdoor thermal comfort. Build. Environ. 2010, 45, 213–221. [Google Scholar] [CrossRef]
- Kumar, P.; Sharma, A. Study on importance, procedure, and scope of outdoor thermal comfort—A review. Sustain. Cities Soc. 2020, 61, 102297. [Google Scholar] [CrossRef]
- Makaremi, N.; Salleh, E.; Jaafar, M.Z.; GhaffarianHoseini, A. Thermal comfort conditions of shaded outdoor spaces in hot and humid climate of Malaysia. Build. Environ. 2012, 48, 7–14. [Google Scholar] [CrossRef]
- Honjo, T. Thermal comfort in outdoor environment. Glob. Environ. Res. 2009, 13, 43–47. [Google Scholar]
- Salata, F.; Golasi, I.; de Lieto Vollaro, R.; de Lieto Vollaro, A. Outdoor thermal comfort in the Mediterranean area. A transversal study in Rome, Italy. Build. Environ. 2016, 96, 46–61. [Google Scholar] [CrossRef]
- Sharmin, T.; Steemers, K.; Humphreys, M. Outdoor thermal comfort and summer PET range: A field study in tropical city Dhaka. Energy Build. 2019, 198, 149–159. [Google Scholar] [CrossRef]
- Cheng, V.; Ng, E.; Chan, C.; Givoni, B. Outdoor thermal comfort study in a sub-tropical climate: A longitudinal study based in Hong Kong. Int. J. Biometeorol. 2012, 56, 43–56. [Google Scholar] [CrossRef]
- Golasi, I.; Salata, F.; de Lieto Vollaro, E.; Coppi, M. Complying with the demand of standardization in outdoor thermal comfort: A first approach to the Global Outdoor Comfort Index (GOCI). Build. Environ. 2018, 130, 104–119. [Google Scholar] [CrossRef]
- Shooshtarian, S.; Rajagopalan, P.; Sagoo, A. A comprehensive review of thermal adaptive strategies in outdoor spaces. Cities Soc. 2018, 41, 647–665. [Google Scholar] [CrossRef]
- Huang, Z.; Gou, Z.; Cheng, B. An investigation of outdoor thermal environments with different ground surfaces in the hot summer-cold winter climate region. J. Build. Eng. 2020, 27, 100994. [Google Scholar] [CrossRef]
- Ghaffarianhoseini, A.; Berardi, U.; Ghaffarianhoseini, A.; Al-Obaidi, K. Analyzing the thermal comfort conditions of outdoor spaces in a university campus in Kuala Lumpur. Malaysia. Sci. Total Environ. 2019, 666, 1327–1345. [Google Scholar] [CrossRef]
- Sen, J.; Nag, P.K. Human susceptibility to outdoor hot environment. Sci. Total Environ. 2019, 649, 866–875. [Google Scholar] [CrossRef]
- Broday, E.E.; Ruivo, C.R.; da Silva, M.G. The use of Monte Carlo method to assess the uncertainty of thermal comfort indices PMV and PPD: Benefits of using a measuring set with an operative temperature probe. J. Build. Eng. 2020, 101961. [Google Scholar] [CrossRef]
- Deb, C.; Ramachandraiah, A. The significance of physiological equivalent temperature (PET) in outdoor thermal comfort studies. Int. J. Eng. Sci. Technol. 2010, 2, 2825–2828. [Google Scholar]
- Cheung, P.K.; Jim, C.Y. Subjective outdoor thermal comfort and urban green space usage in humid-subtropical Hong Kong. Energy Build. 2018, 173, 150–162. [Google Scholar] [CrossRef]
- Park, S.; Tuller, S.E. Modelling human radiation exchange in outdoor urban environments. In Proceedings of the Seventh International Conference on Urban Climate, Yokohama, Japan, 29 June–3 July 2009; p. 29. [Google Scholar]
- Zare, S.; Hasheminejad, N.; Shirvan, H.E.; Hemmatjo, R.; Sarebanzadeh, K.; Ahmadi, S. Comparing Universal Thermal Climate Index (UTCI) with selected thermal indices/environmental parameters during 12 months of the year. Weather Clim. Extrem. 2018, 19, 49–57. [Google Scholar] [CrossRef]
- Tong, R.; Cheng, M.; Zhang, L.; Liu, M.; Yang, X.; Li, X.; Yin, W. The construction dust-induced occupational health risk using Monte-Carlo simulation. J. Clean. Prod. 2018, 184, 598–608. [Google Scholar] [CrossRef]
- Beisbart, C.; Norton, J.D. Why Monte Carlo simulations are inferences and not experiments. Int. Stud. Philos. 2012, 26, 403–422. [Google Scholar] [CrossRef]
- Aleboyeh, A.; Kasiri, M.B.; Olya, M.E.; Aleboyeh, H. Prediction of azo dye decolorization by UV/H2O2 using artificial neural networks. Dyes Pigm. 2008, 77, 288–294. [Google Scholar] [CrossRef]
- Liu, H.; Cocea, M. Semi-random partitioning of data into training and test sets in granular computing context. Granul. Comput. 2017, 2, 357–386. [Google Scholar] [CrossRef]
- Korea Ministry of Government Legislation (MOLEG). 2020. Available online: https://www.law.go.kr (accessed on 1 September 2020).
- Nadhim, E.A.; Hon, C.; Xia, B.; Stewart, I.; Fang, D. Falls from height in the construction industry: A critical review of the scientific literature. Int. J. Environ. Res. Public Health 2016, 13, 638. [Google Scholar] [CrossRef]
- Gillen, M.; Baltz, D.; Gassel, M.; Kirsch, L.; Vaccaro, D. Perceived safety climate, job demands, and coworker support among union and nonunion injured construction workers. J. Saf. Res. 2002, 33, 33–51. [Google Scholar] [CrossRef]
Publisher’s Note: MDPI stays neutral with regard to jurisdictional claims in published maps and institutional affiliations. |
© 2021 by the authors. Licensee MDPI, Basel, Switzerland. This article is an open access article distributed under the terms and conditions of the Creative Commons Attribution (CC BY) license (https://creativecommons.org/licenses/by/4.0/).