Correction

Corrections: Xu, L.; Mondal, D.; Polya, D.A. Positive Association of Cardiovascular Disease (CVD) with Chronic Exposure to Drinking Water Arsenic (As) at Concentrations below the WHO Provisional Guideline Value: A Systematic Review and Meta-Analysis. Int. J. Environ. Res. Public Health 2020, 17, 2536

1
Department of Earth and Environmental Sciences and Williamson Research Centre for Molecular Environmental Science, University of Manchester, Manchester M13 9PL, UK
2
School of Science, Engineering & Environment, University of Salford, Salford M5 4WT, UK
*
Author to whom correspondence should be addressed.
Int. J. Environ. Res. Public Health 2020, 17(23), 8947; https://doi.org/10.3390/ijerph17238947
Submission received: 4 November 2020 / Accepted: 26 November 2020 / Published: 2 December 2020
(This article belongs to the Special Issue Arsenic Exposure in Environment and Human Health)
In our recently published meta-analysis, due to an oversight, we treated urinary As concentration data reported by Tsinovoi et al. [1] instead as drinking water As data. This oversight impacted, in minor way, our linear and non-linear published dose-response models for combined fatal and non-fatal strokes. The oversight does not impact, in any way, any of our other published [2] dose-response models.
We corrected both Table 1 and Supplementary Materials Table S1; the exposure media for Tsinovoi et al. [1] is changed to ‘urinary As (µg/g creatinine)’ from ‘water As (µg/L)’. Accordingly, we modified dose-response models (Table 2) and goodness of fit parameters (Table 3) for the relationships between drinking water As and combined fatal and non-fatal risks of strokes in the corrected Manuscript [2]. These are based on using Equation (3) of Xu et al. [2] to calculate equivalent drinking water As concentrations from the reported urinary As values from Tsinovoi et al. [1]. Over the drinking water arsenic concentration range 1 to 50 µg/L, the absolute differences between the originally published and corrected relative risks (RR) for the linear and non-linear dose-response models for combined fatal and non-fatal stroke risks are all < 0.001 and < 0.020 respectively.
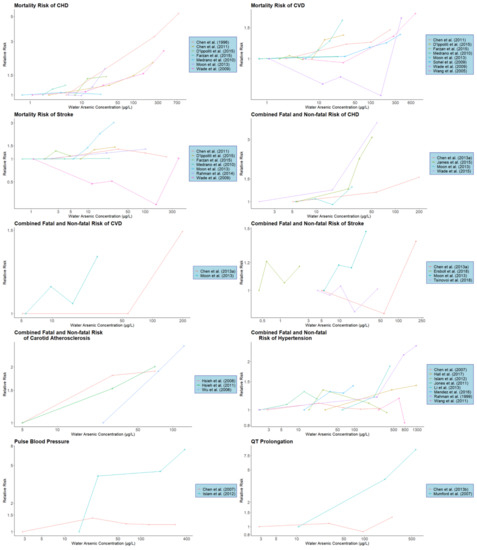
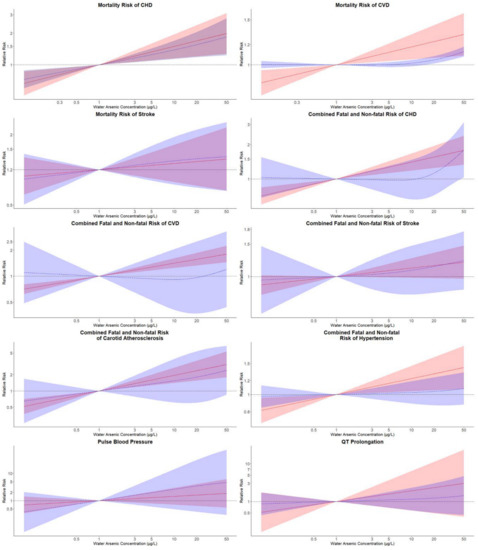
We also made the required corrections in Figure 1 and Figure 2 and Supplementary Figure S2, although these are almost identical to the original figures.
Lastly, we note that the corrections to the linear and non-linear dose-response models for combined fatal and non-fatal risks of strokes as a function of drinking water arsenic concentration show the same trends as in the original publication and, in particular, over the relatively low concentration range in the scope of the study, there remains no significant association in the data collated between drinking water As concentration and the combined fatal and non-fatal risks of stroke.

Supplementary Materials

The following are available online at https://www.mdpi.com/1660-4601/17/23/8947/s1, Figure S1: Flow diagram of study selection procedure, Figure S2: Association of CVD endpoints with drinking water arsenic concentrations, Figure S3: Funnel Plots for the analysis of publication bias, Table S1: Epidemiological studies of arsenic (As) exposure and cardiovascular disease (CVD) included in the systematic review, Table S2: Egger’s regression test of funnel plot asymmetry, Table S3: Pooled relative risks (95% confidence intervals) for different CVD types and clinical markers in relation to drinking water arsenic concentrations with the exclusion of studies which do provide drinking water As concentrations directly, Table S4: Pooled relative risks (95% confidence intervals) for different CVD types and CVD markers in relation to drinking water arsenic concentrations lower than 100 ppb.

Funding

LX was funded by the University of Manchester.

Acknowledgments

We would like to express our thanks to Matt Gribbins (Emory University) for drawing this error to our attention.

Conflicts of Interest

The authors declare no conflict of interest

References

  1. Tsinovoi, C.L.; Xun, P.C.; McClure, L.A.; Carioni, V.M.O.; Brockman, J.D.; Cai, J.W.; Guallar, E.; Cushman, M.; Unverzagt, F.W.; Howard, V.J.; et al. Arsenic exposure in relation to ischemic stroke the reasons for geographic and racial differences in stroke study. Stroke 2018, 49, 19–26. [Google Scholar] [CrossRef] [PubMed]
  2. Xu, L.; Mondal, D.; Polya, D.A. Positive association of cardiovascular disease (CVD) with chronic exposure to drinking water Arsenic (As) at concentrations below the WHO provisional guideline value: A systematic review and meta-analysis. Int. J. Environ Res. Public Health 2020, 17, 2536. [Google Scholar] [CrossRef] [Green Version]
Figure 1. Individual study dose-response characteristics for various CVD subtypes or biomarkers. Arsenic concentrations refer to the observed or estimated median arsenic concentrations for the given concentration category. Lines connect the dose-response data for each study and are for illustrative purposes only (CVD: cardiovascular disease; CHD: coronary heart disease).
Ijerph 17 08947 g001
Figure 2. Pooled log-linear and non-linear relative risks and 95% confidence intervals (CIs) of different CVD endpoints in relation to the estimated drinking water arsenic concentration. Pooled log-linear and non-linear relative risks of CVD endpoints were estimated for drinking water arsenic concentrations with reference to an arsenic concentration of 1 µg/L. Solid lines (red) correspond to pooled relative risks of linear models with their 95% CIs represented as shaded regions (red). Pooled relative risks of non-linear models were represented by long-dash lines (blue) and their 95% CIs were plotted as shaded areas (blue). Log-linear models were estimated with log-transformed estimated drinking water arsenic concentration and non-linear associations were estimated from models with restricted cubic splines of log-transformed water arsenic concentration with knots at the 10th, 50th and 90th percentiles of log-transformed water arsenic (CVD: cardiovascular disease; CHD: coronary heart disease).
Ijerph 17 08947 g002
Table 1. Characteristics of studies included for dose-response meta-analysis.
Study (Year)DesignCasesPerson or Person-YearsExposure MediaConcentration CategoryMedianRR (95% CI)
Mortality
CHD
Chen et al. [15] (2011)ir1420,064water (µg/L)0.1–12.02.31 (referent)
1619,10912.1–62.034.01.220.562.65
1518,69962.1–148.0101.01.490.703.19
2619,380148.1–864.0237.01.940.993.84
D’Ippoliti et al. [29] (2015)ir684771,860water (µg/L)< 107.41 (referent)
573713,27610–2012.91.401.191.64
1014904,129> 2029.71.461.072.01
Medrano et al. [74] (2010)ci88,56618,978,000water (µg/L)< 10.71 (referent)
19,7094,803,0001–103.91.051.011.10
47251,011,000> 1023.31.020.961.08
Moon et al. [63] (2013)ir6813,616urine (µg/g creatinine)< 5.84.21 (referent)
6713,4305.8–9.77.50.990.701.41
8712,7209.8–15.712.41.180.831.69
11912,033> 15.721.81.711.192.44
Chen et al. [81] (1996)ir42748water (µg/L)< 1051 (referent)
5141710–5002553.300.8013.69
164309≥ 5107555.301.4918.85
Wade et al. [79] (2009)ir4414,636water (µg/L)0–51.11 (referent)
2690475.1–2011.81.070.641.78
7221,36720.1–10026.21.220.821.82
173313100.1–300156.11.550.882.73
2249Over 300387.92.470.5012.18
Farzan et al. [19] (2015)ir57898toenail
(µg/g)
0.01–0.070.051 (referent)
518520.07–0.110.091.130.771.67
467540.11–3.260.231.220.821.82
CVD
Chen et al. [15] (2011)ir4320,064water (µg/L)0.1–12.02.31 (referent)
5119,10912.1–62.034.01.210.801.84
4118,69962.1–148.0101.01.240.801.93
6319,380148.1–864.0237.01.460.962.20
Sohel et al. [80] (2009)ir147114,068water (µg/L)< 100.71 (referent)
168139,23310–4931.81.030.821.29
463365,49650–14995.01.160.961.40
318241,930150–299201.21.231.011.51
11578,786> 300371.51.371.071.77
D’Ippoliti et al. [29] (2015)ir2752771,860water (µg/L)< 107.41 (referent)
2115713,27610–2012.91.281.081.51
3514904,129> 2029.71.361.061.74
Medrano et al. [74] (2010)ci285,04918,978,000water (µg/L)< 10.71 (referent)
62,7394,803,0001–103.91.020.991.06
13,9621,011,000> 1023.31.030.981.08
Moon et al. [63] (2013)ir8613,616urine (µg/g creatinine)< 5.84.21 (referent)
9513,4305.8–9.77.51.120.831.52
11512,7209.8–15.712.41.260.921.73
14312,033> 15.721.81.651.202.27
Wade et al. [79] (2009)ir9714,636water (µg/L)0–51.11 (referent)
4290475.1–2011.80.720.321.60
11321,36720.1–10026.20.790.341.86
243313100.1–300156.10.620.103.70
3249Over 300387.91.700.515.72
Farzan et al. [19] (2015)ir1251987toenail (µg/g)0.01–0.070.051 (referent)
10316910.07–0.110.091.040.801.35
8413340.11–3.260.230.990.741.32
Wang, et al. [82] (2005)ir42819,360water (µg/L)<105.01 (referent)
84213010–4929.50.950.741.21
116231750–499274.51.341.081.66
601165≥500724.51.801.362.38
Stroke
D’Ippoliti et al. [29] (2015)ir660771,860water (µg/L)< 107.41 (referent)
448713,27610–2012.91.331.121.58
789904,129> 2029.71.441.161.78
Farzan et al. [19] (2015)ir15233toenail (µg/g)0.01–0.070.051 (referent)
162430.07–0.110.091.280.642.61
121610.11–3.260.231.100.502.40
Rahman et al. [17] (2014)ir6238,198water (µg/L)< 101.71 (referent)
196156,36210–4921.11.200.921.57
27142,579> 50102.21.351.041.75
Moon et al. [63] (2013)ir613,616urine (µg/g creatinine)< 5.84.21 (referent)
1713,4305.8–9.77.51.410.543.67
1312,7209.8–15.712.42.160.776.09
1812,033> 15.721.83.031.088.50
Chen et al. [15] (2011)ir1920,064water (µg/L)0.1–12.02.31 (referent)
2619,10912.1–62.034.01.350.752.43
1818,69962.1–148.0101.01.200.632.27
2219,380148.1–864.0237.01.070.542.12
Wade et al. [79] (2009)ir5314,636water (µg/L)0–51.11 (referent)
1690475.1–2011.80.470.270.84
4121,36720.1–10026.20.510.340.79
73313100.1–300156.10.251.102.95
1249Over 300387.91.020.166.71
Medrano et al. [74] (2010)ci81,36818,978,000water (µg/L)< 10.71 (referent)
18,3274,803,0001–103.91.000.991.05
38951,011,000> 1023.31.020.951.09
Fatal and non-fatal
Carotid atherosclerosis disease
Wu et al. [69] (2006)cc2564water (µg/L)≤ 50.00251 (referent)
469550.01–100.00751.900.903.80
89183≥ 100.011252.601.305.00
Hsieh et al. [72] (2008)cc1748water (µg/L)< 1051 (referent)
236110.1–50301.801.003.20
195370> 50701.901.103.10
Hsieh et al. [73] (2011)cc2455water (µg/L)< 1051 (referent)
318110.1–50.0301.530.673.50
325720> 50.0702.011.053.85
CHD
Wade et al. [83] (2015)cc168305water (µg/L)< 101.91 (referent)
10523610–3916.01.230.781.93
1126> 4058.64.051.1014.99
Moon et al. [63] (2013)ir20212,146urine (µg/g creatinine)< 5.84.21 (referent)
20611,7015.8–9.77.51.050.861.28
19711,3059.8–15.712.40.950.771.19
24110,586> 15.721.81.301.041.62
James et al. [84] (2015)ir584806water (µg/L)1–205.71 (referent)
18133520–3025.31.250.702.31
1653430–4535.12.141.223.98
49845–8850.53.121.129.02
Chen et al. [20] (2013)ir612823water (µg/L)0.1–255.11 (referent)
72271825.1–10757.01.180.751.84
752770108–864198.51.541.022.31
CVD
Moon et al. [63] (2013)ir26512,146urine (µg/g creatinine)< 5.84.21 (referent)
29711,7015.8–9.77.51.140.951.35
29111,3059.8–15.712.41.050.871.26
33110,586> 15.721.81.321.051.28
Chen et al. [20] (2013)ir1142823water (µg/L)0.1–255.11 (referent)
120271825.1–10757.01.000.671.50
1322770108–864198.51.491.062.11
Hypertension
Wang et al. [71] (2011)ir93618water (µg/L)< 5382691 (referent)
103721538–7006191.180.602.34
83634> 7007810.830.401.68
Jones et al. [26] (2011)ir418952urine (µg/L)< 4.22.11 (referent)
45110574.2 to 8.36.31.080.831.40
4461090> 8.3 to 17.112.71.300.941.80
4461068> 17.121.51.170.751.83
Chen et al. [75] (2007)cc2892242water (µg/L)0.1–8.02.81 (referent)
27421168.1–40.823.21.100.901.33
273218740.9–91.063.91.030.851.25
259218191.1–176.0128.11.010.831.22
2652184176.1–864.0283.11.020.841.23
Islam et al. [67] (2012)cc22291water (µg/L)10–2215.51 (referent)
1920823–3227.51.330.672.62
1325233–261180.01.100.492.44
12243≥ 262376.00.960.422.23
Li et al. [66] (2013)cc29120water (µg/L-year)< 10061.01 (referent)
30119100 to 350223.81.200.632.29
45121> 350427.71.871.023.42
Mendez et al. [59] (2016)cc106260water (µg/L)< 25.512.81 (referent)
10626025.5–47.936.71.300.842.00
10925947.9–79.063.51.270.821.94
118259≥ 79.094.61.410.912.17
Hall et al. [16] (2017)cc140323water (µg/L)< 6030.01 (referent)
24648260–859459.51.330.981.79
225450> 8591258.51.421.041.92
Rahman et al. [70] (1999)cc9114water (µg/L)< 021 (referent)
506230–5002501.200.602.30
93576500–10007502.201.104.30
55282> 100012502.501.204.90
Stroke
Tsinovoi et al. [36] (2018)ir150637urine (µg/g creatinine)2.72–3.723.31 (referent)
1386224.75–5.885.30.970.731.30
1396248.26–9.188.11.030.771.38
11960611.99–16.7213.90.870.641.18
12560826.11–54.8134.11.010.741.36
Moon et al. [63] (2013)ir5512,146urine (µg/g creatinine)< 5.84.21 (referent)
7511,7015.8–9.77.51.180.821.69
6211,3059.8–15.712.41.160.771.72
7210,586> 15.721.81.470.972.21
Chen et al. [20] (2013)ir502823water (µg/L)0.1–255.11 (referent)
46271825.1–10757.00.860.491.51
522770108–864198.51.380.842.27
Ersboll et al. [57] (2018)ir486172,202water (µg/L)0.049–0.5730.4351 (referent)
657180,8910.573–0.7600.5841.211.071.36
475169,4700.760–1.9331.1741.050.921.19
577173,8561.933–25.342.1091.171.041.32
CVD markers
Pulse blood pressure (SBP-DBP ≥ 55 mmHg))
Chen et al. [75] (2007)cc2052242water (µg/L)0.1–8.02.81 (referent)
25221168.1–40.823.21.391.141.71
232218740.9–91.063.91.210.991.49
227218191.1–176.0128.11.190.971.45
2332184176.1–864.0283.11.190.971.46
Islam et al. [67] (2012)cc5291water (µg/L)10–2215.51 (referent)
1020823–3227.53.871.2212.2
1025233–261180.04.321.2315.11
16243≥ 262376.07.322.1824.60
QT prolongation
Chen et al. [85] (2013)ir57428water (µg/L)0.1–92.81 (referent)
634329.5–5730.01.100.741.63
4942358–14495.10.870.571.31
68421145–790254.51.310.871.96
Mumford et al. [68] (2007)cc4103water (µg/L)< 2110.71 (referent)
12108100–350199.93.831.1312.99
21102430–690568.38.852.7228.75
CVD: cardiovascular disease; CHD: coronary heart disease. RR: Relative risk or approximation of the relative risk (rate ratio, risk ratio, odds ratio). ir: Risks estimated in the studies as rate ratio (incidence-rate data); ci: Risks estimated in the studies as risk ratio (cumulative incidence data); cc: Risks estimated in the studies as an odds ratio (see details reported by Orsini et al. [65]).
Table 2. Pooled relative risks (95% CIs) for different types of cardiovascular disease (CVD) and clinic markers in relation to water arsenic concentrations.
Mortality RiskCombined Fatal and non-Fatal RiskCVD Markers
CHD (7(25)) aCVD (8(31)) aStroke (7(25)) aCHD (4(14)) aCVD (2(7)) aStroke (4(16)) aCarotid Atherosclerosis Disease (3(9)) aHypertension (8(30)) aPulse Blood Pressure (2(9)) aQT Prolongation (2(7)) a
Log-linear dose-response association model
1 µg/L b1.0001.0001.0001.0001.0001.0001.0001.0001.0001.000
3 µg/L1.213
(1.070, 1.374)
1.079
(1.023, 1.139)
1.061
(0.891, 1.262)
1.176
(1.083, 1.276)
1.178
(1.108, 1.252)
1.051
(0.992, 1.114)
1.370
(1.175, 1.598)
1.104
(1.020, 1.195)
1.187
(0.848, 1.662)
1.363
(0.770, 2.414)
5 µg/L1.327
(1.105, 1.593)
1.118
(1.034, 1.210)
1.090
(0.844, 1.407)
1.268
(1.125, 1.429)
1.272
(1.163, 1.391)
1.076
(0.989, 1.172)
1.587
(1.267, 1.987)
1.156
(1.030, 1.298)
1.286
(0.785, 2.105)
1.574
(0.682, 3.636)
10 µg/L1.498
(1.153, 1.948)
1.174
(1.049, 1.313)
1.131
(0.784, 1.630)
1.405
(1.183, 1.667)
1.411
(1.242, 1.603)
1.111
(0.984, 1.254)
1.936
(1.403, 2.671)
1.231
(1.043, 1.452)
1.433
(0.707, 2.901)
1.914
(0.578, 6.339)
20 µg/L1.693
(1.203, 2.380)
1.232
(1.064, 1.426)
1.173
(0.729, 1.889)
1.556
(1.245, 1.944)
1.566
(1.325, 1.848)
1.146
(0.979, 1.343)
2.362
(1.553, 3.590)
1.310
(1.057, 1.625)
1.597
(0.637, 3.998)
2.327
(0.490,11.052)
50 µg/L1.988
(1.274, 3.103)
1.313
(1.085, 1.589)
1.233
(0.662, 2.295)
1.781
(1.331, 2.383)
1.796
(1.445, 2.230)
1.195
(0.973, 1.469)
3.071
(1.777, 5.308)
1.423
(1.074, 1.885)
1.842
(0.555, 6.109)
3.012
(0.394, 23.045)
coefficient0.1750.0700.0540.1480.1500.0460.2870.0900.1560.282
p-value for trend c0.0030.0050.510< 0.001< 0.0010.090< 0.0010.0140.3200.290
I2 d79.7%77.9%89.0%6.6%17.4%0.0%17.5%62.3%80.4%91.5%
Cochran’s Q-statistic29.5431.7054.783.211.212.882.4318.565.1011.7
P-heterogeneity e< 0.001< 0.001< 0.0010.3600.2710.4090.2970.0970.0240.006
Non-linear dose-response association model (restricted cubic splines)
1 µg/Lb1.0001.0001.0001.0001.0001.0001.0001.0001.0001.000
3 µg/L1.163
(1.060, 1.276)
0.999
(0.983, 1.014)
1.092
(0.862, 1.382)
0.985
(0.811, 1.197)
0.954
(0.647, 1.406)
1.026
(0.854, 1.232)
1.225
(0.783, 1.917)
1.012
(0.944, 1.085)
1.578
(0.707, 3.523)
1.070
(0.772, 1.483)
5 µg/L1.250
(1.090, 1.433)
1.001
(0.980, 1.023)
1.136
(0.807, 1.596)
0.978
(0.735, 1.302)
0.933
(0.528, 1.648)
1.044
(0.815, 1.338)
1.347
(0.699, 2.594)
1.018
(0.920, 1.128)
1.951
(0.601, 6.326)
1.105
(0.685, 1.781)
10 µg/L1.387
(1.135, 1.695)
1.015
(0.986, 1.043)
1.192
(0.746, 1.902)
0.986
(0.663, 1.468)
0.915
(0.410, 2.040)
1.081
(0.798, 1.464)
1.537
(0.612, 3.863)
1.027
(0.888, 1.187)
2.601
(0.483, 14.001)
1.155
(0.583, 2.288)
20 µg/L1.557
(1.182, 2.052)
1.045
(1.012, 1.080)
1.241
(0.701, 2.195)
1.124
(0.720, 1.754)
0.963
(0.371, 2.499)
1.133
(0.816, 1.574)
1.800
(0.605, 5.353)
1.041
(0.868, 1.249)
3.449
(0.389, 30.605)
1.229
(0.504, 2.996)
50 µg/L1.846
(1.231, 2.769)
1.125
(1.077, 1.176)
1.295
(0.659, 2.542)
1.795
(1.029, 3.131)
1.199
(0.439, 3.273)
1.220
(0.848, 1.753)
2.394
(0.852, 6.728)
1.082
(0.877, 1.334)
4.642
(0.298, 72.343)
1.433
(0.440, 4.667)
p-value for trend f0.006< 0.0010.7500.0470.0780.390< 0.0010.2000.1500.270
I2 d69.8%35.3%80.0%41.0%53.7%0.0%0.0%46.3%73.1%72.5%
Cochran’s Q-statistic39.7521.6560.0210.164.325.652.5826.077.437.27
P-heterogeneity e< 0.0010.086< 0.0010.1170.1150.4600.6290.0250.0240.026
CVD: cardiovascular disease; CHD: coronary heart disease. a: Sum of studies included; the total number of relative risks in each model. b: treat 1 µg/L water arsenic concentration as the referent. c: p-value for linear trend from a Wald test of the coefficient for drinking water arsenic concentrations. d: Proportion of total variance due to between-study heterogeneity. e: p-value for heterogeneity is chi-square p-value of the Q-statistic. f: Non-linear trend p-value for the non-linear spline coefficient in a model with arsenic concentrations entered as a restricted cubic spline with knots at 10th, 50th and 90th percentiles of water arsenic concentration.
Table 3. Goodness-of-fit assessment.
StudiesMortality RiskCombined Fatal and non-Fatal RiskCVD Markers
CHDCVDStrokeCHDCVDStrokeCarotid Atherosclerosis DiseaseHypertensionPulse Blood PressureQT Prolongation
Log-linear dose-response association model
Deviance a19.4022.5815.9813.047.0618.532.9920.2714.024.97
Degrees of freedom b172217941152164
p-value c0.3060.4260.5260.1610.1330.0700.7020.5040.0290.291
R20.3200.2580.0270.5370.7980.1340.8440.2300.0660.185
Adjusted R20.2800.225−0.0310.4860.7480.0560.8130.193−0.089−0.019
AIC0.17−6.776.58−0.561.26−2.223.38−4.364.555.58
Non-linear dose-response association model (restricted cubic splines)
Deviance a17.2822.8115.395.833.9417.611.7112.949.163.44
Degrees of freedom b162116831042053
p-value c0.3670.3540.4960.6660.2670.0620.7890.8800.1030.328
R20.3730.6200.0350.5120.5640.0970.8920.1990.2920.435
Adjusted R20.2970.584−0.0850.3900.273-0.0840.8380.1180.0080.058
AIC29.955.8923.8612.3410.3716.0713.7523.5512.1611.43
CVD: cardiovascular disease; CHD: coronary heart disease. a: Measure of the total absolute deviation between reported and predicted log-relative risk taking into account the covariance structure of the residuals. b: Degrees of freedom from the deviance statistic. c: p-value from test for model specification. AIC: Akaike’s information criterion.
Publisher’s Note: MDPI stays neutral with regard to jurisdictional claims in published maps and institutional affiliations.